
Abstract
Objectives
Clinicians regularly encounter substantial time delays in diagnosing sepsis and administering appropriate antibiotic treatment. This study investigated the ability of the Intensive Care Infection Score (ICIS) to distinguish between infectious and noninfectious processes, and to assess the justified commencement of antibiotic therapy retrospectively, in line with hospital actual best practice and applied laboratory parameters.
Methods
Intensive-care unit (ICU) patients were enrolled in this retrospective, observational study. Clinical data and laboratory parameters were determined daily. The cohort was divided into infected and noninfected patient groups.
Results
Out of 172 ICU patients, including 72 postoperative patients, the predictive value for infection throughout the first 5 days in ‘all patients’ and the ‘postoperative patient’ group was highest for ICIS. An ICIS cut-off value of three could predict infection in postoperative patients with 82.9% sensitivity and 75.1% specificity. ICIS showed the lowest rate of potentially ‘falsely encouraged’ and ‘discouraged’ antibiotic therapies for noninfected and for septic postoperative patients, respectively, compared with C-reactive protein, procalcitonin and white blood cell levels.
Conclusions
In the ICU, particularly for postoperative patients, ICIS is a reliable marker for the timely identification of infection. ICIS may qualify as a new decision support tool for antibiotic therapy, when interpreted within the clinical context.
Keywords
Introduction
In the USA, each year, ∼30% of patients with sepsis experience postoperative complications. 1 Systemic inflammatory reaction is a postoperative condition that occurs with or without infection on a fairly regular basis.2–4 In cases of systemic infection, multiple organ system failure frequently leads to postoperative mortality.5,6 For the postoperative patient experiencing systemic inflammatory reaction with infection, there is an evident need for the earliest possible onset of antibiotic treatment, following the principle of the ‘golden hour’. 7 Excessive and unnecessary antibiotic application, however, enhances the development of multiresistant microorganisms,5,8 which leads to a marked increase in mortality in intensive-care unit (ICU) patients.9,10 Antibiotics specifically targeted against multiresistant bacteria have proven not to be ‘magic bullets,’ and their restricted use is recommended. 11 Thus, for postoperative patients with systemic inflammation it is imperative to detect or exclude infection rapidly and reliably, to facilitate appropriate antibiotic treatment decisions.
In practice, clinicians regularly encounter substantial time delays in confirming the patient’s diagnosis, due to missing indicators, nonspecific and/or insensitive clinical variables, or a delay in microbiology test results. 12 Hope was raised with the emergence of new biomarkers, such as procalcitonin (PCT) and C-reactive protein (CRP), which offered the potential to address the need for infection diagnosis within the ‘golden hour’. In a prospective cohort study, PCT accurately predicted blood culture positivity in patients with community-acquired pneumonia. 13 In febrile patients, it was shown that serum PCT levels below 0.4 ng/ml accurately ruled out bacteraemia. 14 The very few studies conducted for PCT in postoperative patients show varying results: PCT was elevated in all patients following diverse surgical interventions, irrespective of postoperative infection,15,16 whereas in other studies PCT levels were higher in infected compared with noninfected patients.17,18 Outcomes also vary for CRP in postoperative cohort studies. In one study, elevated CRP levels were detected in patients who developed systemic infections following surgery, 19 however, most studies revealed that CRP is not a useful predictor of sepsis in patients following surgical intervention: Plasma CRP concentrations were high in almost all infectious and noninfectious systemic processes.20–22
Measurement of acute-phase derivative markers, such as PCT and CRP, is time-consuming, costly, and not widely available.23,24 New and reliable approaches for rapid diagnosis of sepsis (and for therapy monitoring) are needed. The Intensive Care Infection Score (ICIS) has displayed promising potential to differentiate between ICU patients with and without infection, with high sensitivity and specificity. 25 The aim of the present study was to conduct a retrospective observational evaluation of ICIS in terms of its ability to identify and distinguish between infectious and noninfectious patients with systemic inflammation, in an overall cohort of ICU patients and in a subgroup of postoperative ICU patients (since this group is most likely to develop a systemic infection). Since there is no ‘gold standard’ for the diagnosis of sepsis, the effectiveness of a new indicator needs to be compared with current methods. 26 In the present study, the performance of ICIS was compared with hospital actual best practice, and PCT and CRP levels. The question of whether monitoring ICIS could help guide antibiotic therapy, and stop it earlier in patients without infection, was also investigated.
Patients and methods
Study design and population
In this retrospective observational study, critically ill patients admitted to one of three different medicosurgical ICUs at the Charité – Universitätsmedizin Berlin, Germany (total capacity, 32 beds), between March 2010 and May 2010, were sequentially selected for screening. Exclusion criteria comprised: >12 h antibiotic treatment prior to ICU admission; <18 years of age; an expected stay on the ICU < 48 h. All clinical investigations had been conducted according to the principles expressed in the Declaration of Helsinki. This study was approved by the local Charité – Universitätsmedizin Berlin ethics committee (ClinicalTrials.gov Identifier NCT01236703, Ethics application no.: EA1/244/10). Admission and anthropometric data, pre-existing comorbidities, previous location before admission, medication and reason for admission were collected for every patient. All data were analysed anonymously and obtaining patient consent was deemed unnecessary by the ethics committee.
Study day 1 was defined as ICU admission day and patients were followed up until the end of ICU stay, or for a maximum of 60 days. For data analyses, enrolled patients were divided into one of two groups: (I) patients without infection; (II) patients with infection. To determine the presence of infection, a team of medical specialists (Department of Anaesthesiology and Operative Intensive Care Medicine, Charité – Universitätsmedizin Berlin, Germany) evaluated relevant clinical data obtained according to the standard protocol for ICU patients at the Charité – Universitätsmedizin Berlin: data comprised vital signs every h, days of mechanical ventilation, source of infection when known (and medication), laboratory results (once-daily CRP and PCT; three-times-daily white blood cell [WBC] count and ICIS), microbiological culture results (blood culture, tracheal secretion, smear culture) confirmed by microbiologists (Institute for Microbiology and Hygiene, Charité – Universitätsmedizin Berlin, Germany) and chest X-radiography confirmed by radiologists (Institute of Radiology, Charité – Universitätsmedizin Berlin, Germany). Data were stored on the COPRA® (COPRA System GmbH, Sasbachwalden, Germany) and SAP HANA (SAP Deutschland AG & Co. KG, Walldorf, Germany) ICU information systems. In addition, the Simplified Acute Physiology Score II (SAPS II), Sequential Organ Failure Assessment (SOFA) score, Acute Physiology and Chronic Health Evaluation II (APACHE II_, and Therapeutic Intervention Scoring System (TISS) were calculated daily.
Antibiotic treatment was developed and administered in accordance with the standard ICU operating procedures for the Charité – Universitätsmedizin Berlin. Postoperative ICU patients were treated according to the best practice infection and antibiotic workflow procedure (Figure 1), based on a computerized decision support program, to guide best practice (DGAI-ABX; http://en.dgai-abx.de/).
Guidance for antibiotic therapy management at Charité – Universitätsmedizin Berlin. ‘Systemic inflammatory reaction criteria negative’, ≤1 systemic inflammatory response syndrome criteria positive; ‘Systemic inflammatory reaction criteria positive’, ≥2 systemic inflammatory response syndrome criteria positive; ‘CRP negative’, <10 mg/l; ‘CRP positive’, ≥10 mg/l; ‘PCT negative’, <0.1 µg/l; ‘PCT positive’, ≥0.1 µg/l; ‘culture negative’, no microorganism; ‘culture positive’, microorganism or X-radiography positive; ‘clinical symptoms negative’, antibiotic program IC-SOP negative; ‘clinical symptoms positive’, antibiotic program IC-SOP positive. ABx, antibiotics; CRP, C-reactive protein; IC, intensive care; NEG, negative; PCT, procalcitonin; POS, positive; SOP, standard operating procedure.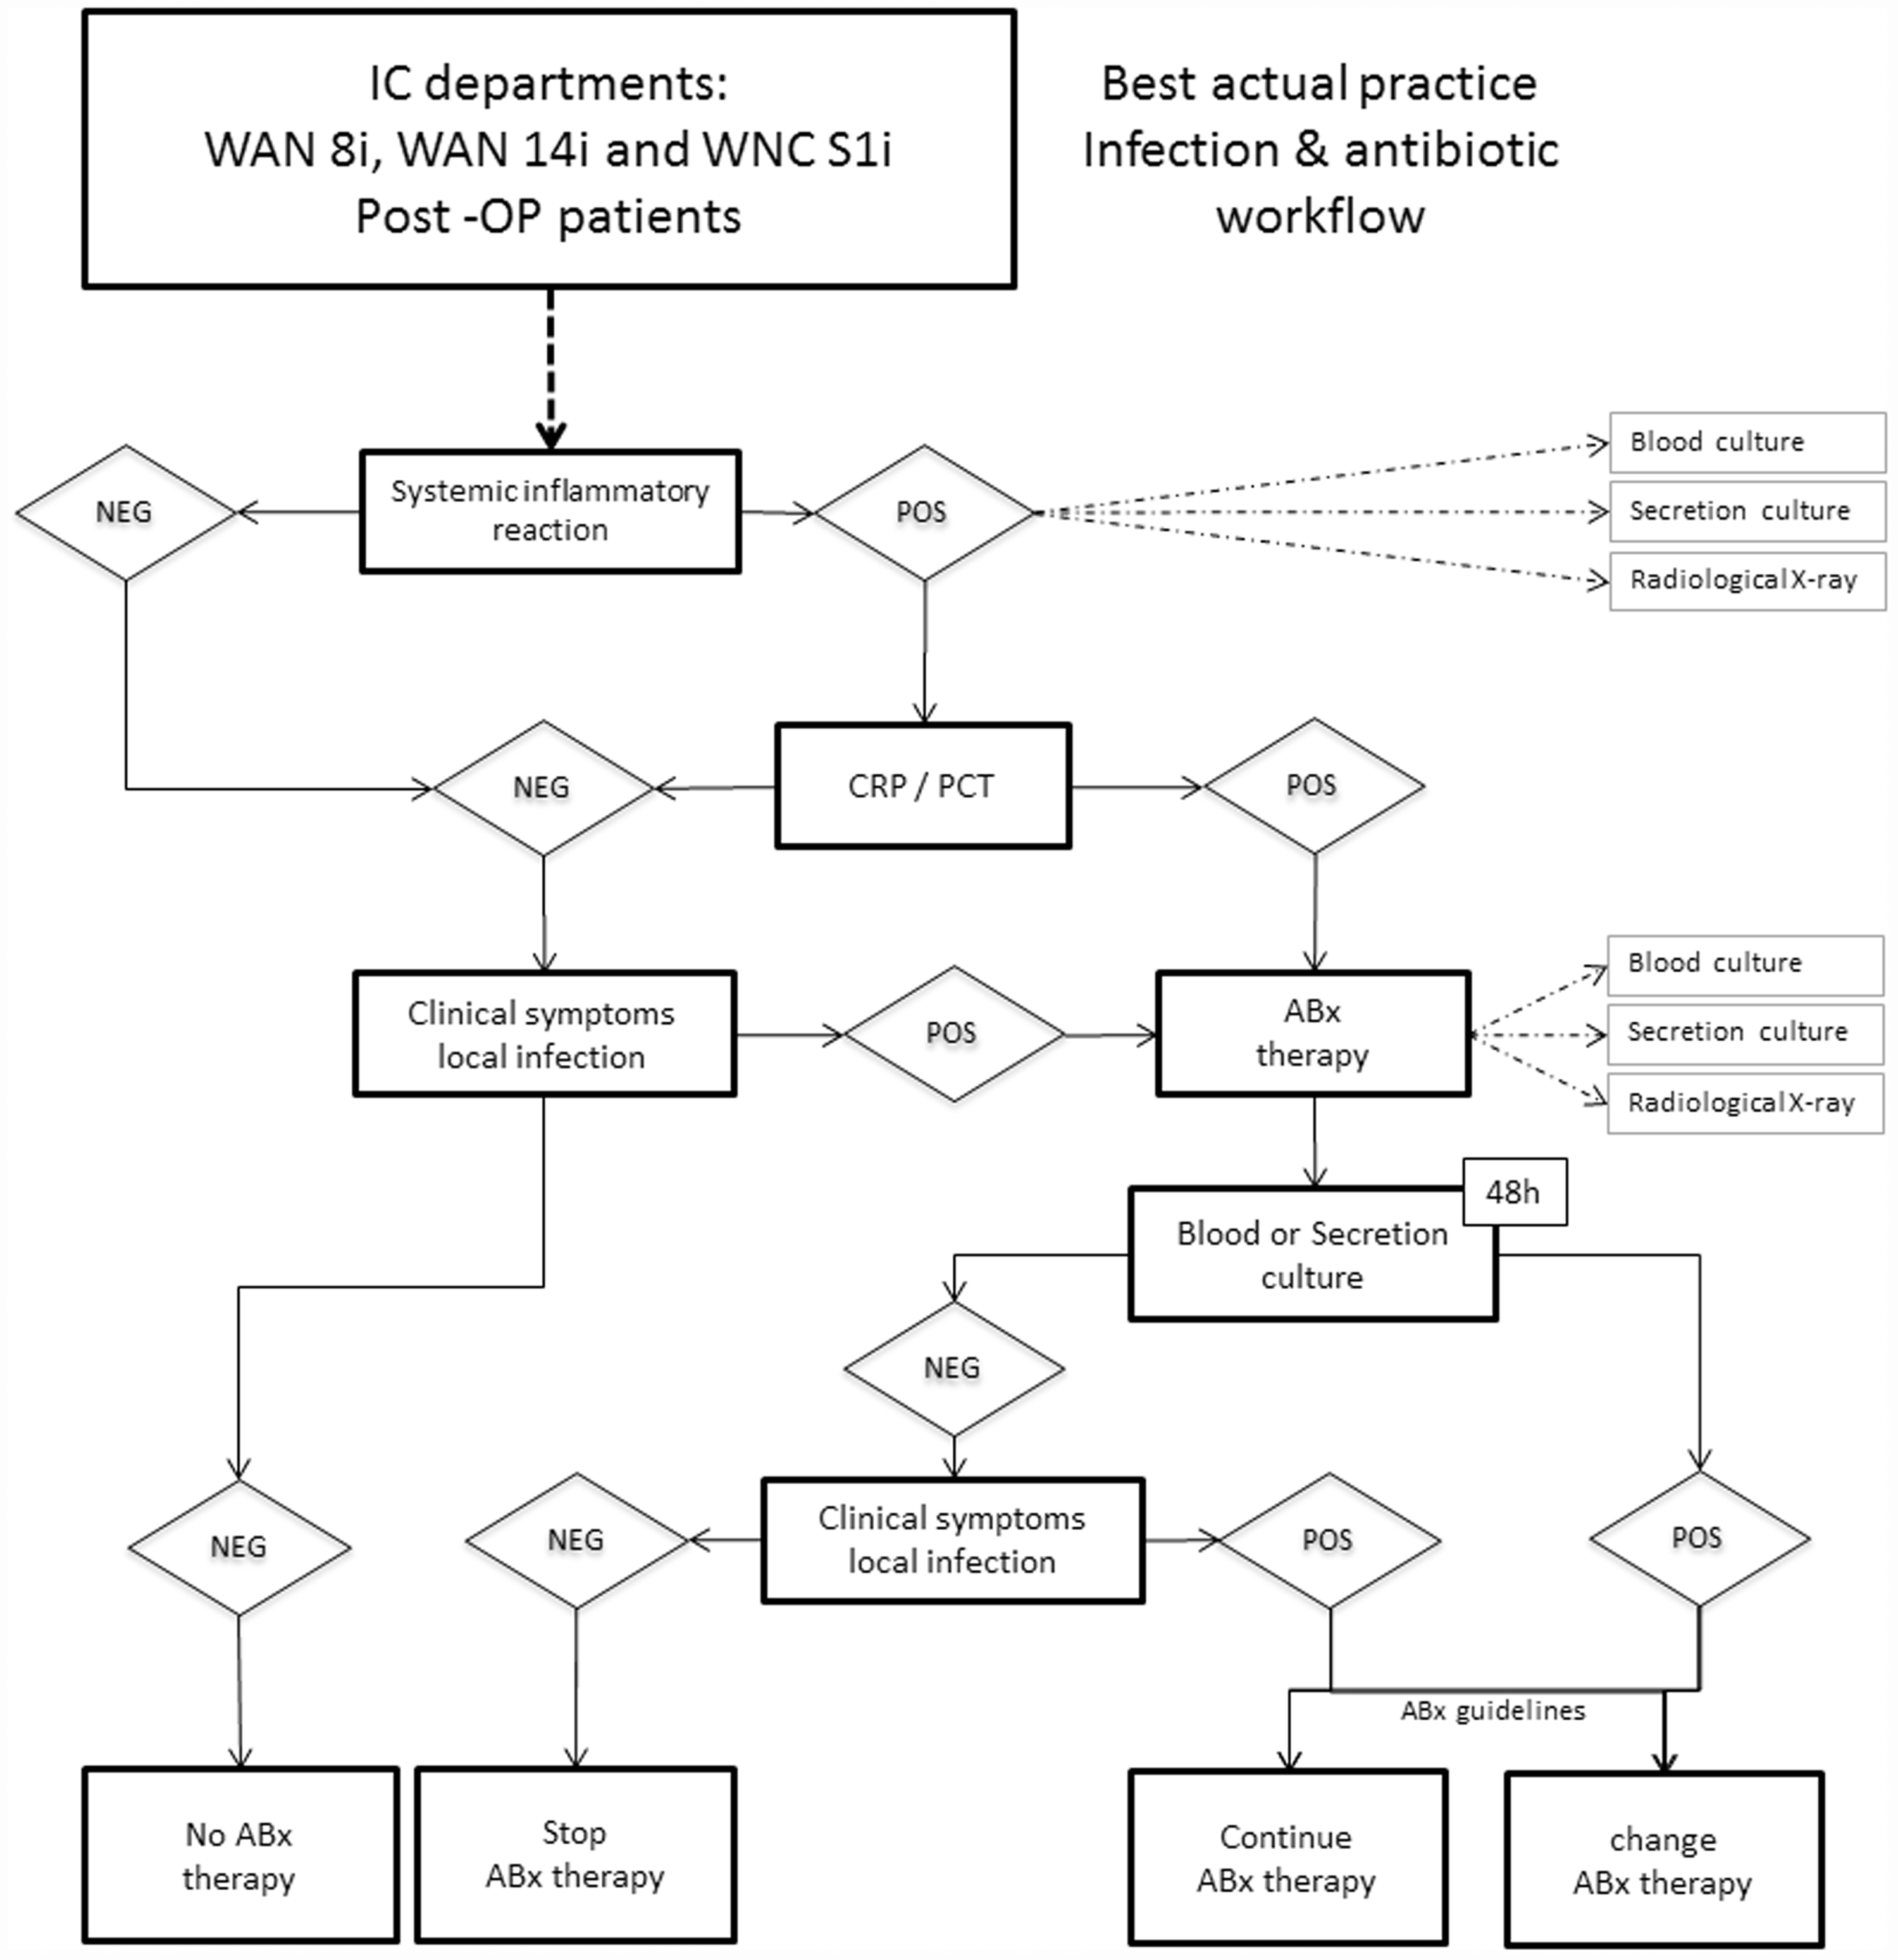
The algorithm for detecting infection and determining antibiotic treatment was as follows. When a patient admitted to the ICU developed a systemic inflammatory reaction, blood and secretion samples were collected for culture, CRP and PCT were measured in the blood sample and X-radiography imaging was performed. CRP < 10 mg/l or PCT < 0.17 µg/l, with no clinical symptoms of a local infection, resulted in no antibiotic administration; CRP ≥ 10 mg/l or PCT ≥ 0.17 µg/l (depending on the localization of the suspected infection) resulted in initiation of antibiotic therapy, calculated according to the standard operating procedure, supported by the DGAI-ABX program. After 48 h, blood and secretion samples were collected again, for culture and re-evaluation of the suspected infection (leading to possible adaptations to the antibiotic treatment). If the suspected infection was confirmed by X-radiography imaging or microbiological methods, the patient was retrospectively included in the infection group. If no infection could be confirmed, the patient was included in the noninfection group.
Assessment of antibiotic therapy decisions for postoperative ICU patients was undertaken using six antibody treatment decision criteria (based on three measurements daily for ICIS calculations and one measurement daily for other parameters, per patient): (I) actual best practice; (II) PCT algorithm; (III) PCT ≥ 0·17 µg/l; (IV) CRP ≥ 10 mg/l; (V) ICIS > 3; (VI) ICIS monitoring (>3 at least once following three-times-daily measurement). The sum of daily samples from postoperative patients observed for the first 7 days of ICU stay were considered. The percentage of potentially correct and incorrect decisions was determined by applying the individually calculated best cut-off values to either start an antibiotic therapy ‘ABx treatment – yes’ or not ‘ABx treatment – no’ and comparing the accuracy of such hypothetical decisions with the reference. Categorization of outcomes was as follows: ‘ABx falsely encouraged’, when antibiotic therapy would have been recommended, but the reference method was negative for infection; or ‘ABx falsely discouraged’, when antibiotic therapy would not have been recommended, but the reference method was positive for infection.
Determination of blood parameters
Repeated routine blood measurements were used to calculate ICIS for the purpose of monitoring antibiotic therapy. Only the ICIS calculation from the first blood measurement per day, acquired at the same time as CRP and PCT were evaluated, was used for comparison with these markers. ICIS results were not made available to the treating physicians during the study period.
The ICIS comprised five blood-cell derived parameters that characterize the early innate immune response: (I) mean fluorescence intensity of mature (segmented) neutrophils; (II) difference in haemoglobin concentration between newly formed and mature red blood cells; (III) total segmented neutrophil count; (IV) antibody secreting lymphocyte count; (V) immature granulocyte count, as previously described. 25 WBC count was measured and ICIS was calculated three-times-daily from whole blood samples (2.5 ml of either venous or arterial blood, collected in K2 ethylenediaminetetra-acetic acid tubes [BD Vacutainer®, Heidelberg, Germany]) using a modified, fully automated routine fluorescence haematology flow cytometer (XE-5000, Sysmex, Kobe, Japan) according to the manufacturer’s instructions. 27 ICIS > 3 from the first daily calculation was recorded as a positive score; ICIS ≤ 3 was recorded as a negative score. For ICIS monitoring, if any one of the three daily ICIS measurements was >3, the ICIS monitoring score was considered positive, if all three ICIS measurements per day were ≤3, the ICIS monitoring score was negative.
Once per day, venous or arterial blood was collected into heparin plasma tubes and immediately sent to the core laboratory via a pneumatic tube system. Samples were centrifuged at 2500
Statistical analyses
Data were analysed as an ‘all patients’ group and as a ‘postoperative patients’ subgroup, and both groups were divided into patients with or without infection. Differences between patients with or without infection were tested using Student`s t-test or Wilcoxon Mann–Whitney U-test, as appropriate. Frequencies were tested using χ2-test. In the underlying case of repeated diagnostic decisions for a patient (so-called clustered binary data), a ratio estimator method was used 28 to determine variances, standard deviations and 95% confidence intervals [CI]. MedCalc® Software, version 8.1.0.0© (Mariakerke, Belgium) was used for receiver operating characteristic (ROC)-curve analysis. Statistical tests for clustered binary data 29 were applied to compare sensitivity and specificity between different test variables (ICIS versus PCT, CRP, or WBC), using the defined gold standard (infection [yes/no]). Cut-off values for variables were determined by combined best sensitivity and specificity using ROC-curve analysis. A two-tailed P-value < 0.05 was considered statistically significant. No adjustments for multiple testing were made. All numerical calculations were performed with SPSS® software, version 18.0 (SPSS, Inc., Chicago, IL, USA) and S-PLUS 2000 Professional Release 2 software (© 1988–1999, MathSoft, Cambridge, MA, USA).
Results
Patient characteristics
Characteristics of 175 intensive care unit patients grouped into all patients (without or with infection) and postoperative patients (without or with infection).

Data presented as mean (range), n patient incidence, n (%) patient incidence, or mean score.
P < 0.05; bP < 0.001; cP < 0.0001, statistically significant differences between patients with or without infection.
SAPS II, APACHE II, SOFA and TISS scores relate to day 1 (ICU admission day).
ABx, antibiotics; APACHE II, Acute Physiology And Chronic Health Evaluation; ICU, intensive care unit; SAPS II, Simplified Acute Physiology Score II; SOFA, Sequential Organ Failure Assessment; TISS, Therapeutic Intervention Scoring System.
The postoperative subgroup comprised 72 patients (33 male and 39 female; mean age 60.2 years [range, 20–86 years]) with a mean length of ICU stay of 8.1 days (range, 2–34 days). Mortality rate was one of 72 patients (1.4%) and infection was confirmed to be present in 32 patients and absent in 40 patients. The mean duration of antibiotic treatment was 7.7 days (range, 1–24 days) for 50/72 (69%) of postoperative patients.
The length of ICU stay was significantly different between patients with or without infection (13.4 versus 5.7 days, respectively, P < 0.0001) for all patients, and also for the postoperative subgroup with and without infection (11.7 versus 5.2 days, respectively, P < 0.0001). Patients with infection received antibiotic treatment for a significantly longer period than patients without infection (10.5 versus 6.1 days, respectively, P = 0.003) for all patients, and for the postoperative subgroup (9.9 versus 4.8 days, respectively, P = 0.0003). The SAPS II, APACHE II, SOFA and TISS calculations all showed significantly higher values on day 1 (ICU admission) for all patients with infection compared with those without infection (P < 0.01). In the postoperative patient subgroup only the SOFA score showed a significant difference (P < 0.05) between patients with or without infection. There was a significant difference for all scores when all patients were compared with the postoperative subgroup (P < 0.05; Table 1).
Discriminative power to detect infection during the first 5 ICU days
For the first 5 days of ICU stay, ICIS had the highest area under the curve (AUC) for detecting infection compared with CRP, PCT, and WBC values, in the postoperative subgroup of patients (Figure 2A and Table 2), and in the all-patient group (Figure 2B and Table 3). In the postoperative patients’ group, ICIS was shown to have a significantly higher specificity of 75.11% (95% CI 75.11%, 80.81% for independent data and 67.17%, 83.06% for ratio estimator; Table 2) compared with CRP, PCT, and WBC values. In the all patients’ group, a significantly higher specificity of 78.68% (95% CI 74.92%, 82.44% for independent data and 73.71%, 83.65% for ratio estimator; Table 3) was also shown for ICIS versus CRP, PCT, and WBC values, except the ratio estimation against CRP. Cut-off values for detecting infection for ICIS and PCT were 3 and 0.17 µg/l, respectively, and these were identical in the postoperative and all patients’ groups. CRP and WBC cut-offs were found to be 10.0 mg/l and 14.3 cells/nl, respectively for the postoperative group and 4.8 mg/l and 13.2 cells/nl, respectively for the all patients group.
Receiver operating characteristic curves comparing the power to predict infection (in patients during the first 5 intensive care unit days) between C-reactive protein (CRP), procalcitonin (PCT), white blood cell count (WBC) and Intensive Care Infection Score (ICIS): (A) postoperative patients’ subgroup and (B) all-patients group. Receiver operating characteristic curve analysis to determine the best cut-off value for each of four variables to discriminate between postoperative intensive care unit (ICU) patients (n = 72) with or without infection within the first 5 days of ICU stay. Sensitivity and specificity from calculated best cut-off values are also shown for each variable. Sensitivity and specificity data presented as % (95% confidence interval). Statistically significant differences in sensitivity or specificity between ICIS and other variables (P < 0.05; ratio estimator). AUC, area under the curve; CRP, C-reactive protein; ICIS, Intensive Care Infection Score; PCT, procalcitonin; WBC, white blood cell count. Receiver operating characteristic curve analysis to determine the best cut-off value for each of four variables, to discriminate between an intensive care unit (ICU) patient group (n = 175) with or without infection within the first 5 days of ICU stay. Sensitivity and specificity from calculated best cut-off values are also shown for each variable. Sensitivity and specificity data presented as % (95% confidence interval). Statistically significant differences in sensitivity or specificity between ICIS and other variables (P < 0.05; ratio estimator). AUC, area under the curve; CRP, C-reactive protein; ICIS, Intensive Care Infection Score; PCT, procalcitonin; WBC, white blood cell count.


In the postoperative patients’ group, ICIS showed the highest AUC during the first day of ICU stay compared with PCT (P = 0.0034) and WBC (P = 0.0009; Figure 3 and Table 4), but was not significantly higher than CRP. The AUC value was significantly higher for CRP compared with WBC (P = 0.02) but not significantly different from PCT (P = 0.1).
Receiver operating characteristic curves comparing the power to predict infection in postoperative patients in the first intensive care unit day, between C-reactive protein (CRP), procalcitonin (PCT), white blood cell count (WBC) and Intensive Care Infection Score (ICIS). Receiver operating characteristic curve analysis to determine the best cut-off value for each of four variables, to discriminate between postoperative intensive care unit patients (n = 72) with or without infection during the first day following surgery. ICIS versus CRP, PCT or WBC (statistically significant differences at P < 0.05; ratio estimator). AUC, area under the curve; CRP, C-reactive protein; ICIS, Intensive Care Infection Score; NS, not statistically significantly different; PCT, procalcitonin; WBC, white blood cell count.

The discriminate power of CRP, PCT, WBC and ICIS to detect an infection (per day) for the first 5 days on ICU, for ‘all patient’ and ‘postoperative patient’ groups are shown (Figure 4). For each of the 5 days, ICIS showed a highly significant discriminate power for the 95% CI to detect whether or not a patient was infected for ‘all’ and ‘postoperative’ patients, with the same cut-off value of>3 for both groups; CRP showed a good discriminate power for the ‘all patients’ group and a lower discriminate power for the ‘postoperative patients’ group (but with increasing cut-off values); and PCT and WBC showed a lower significant discriminate power for the postoperative patient group compared with CRP and ICIS.
Clustered multiple comparison graphs showing the diagnostic power per day of C-reactive protein (CRP), procalcitonin (PCT), white blood cell count (WBC) and Intensive Care Infection Score (ICIS) to detect infection in an all-patients group and a postoperative patients’ subgroup during the first 5 days of intensive care unit (ICU) stay. Data presented as mean ± 95% confidence interval.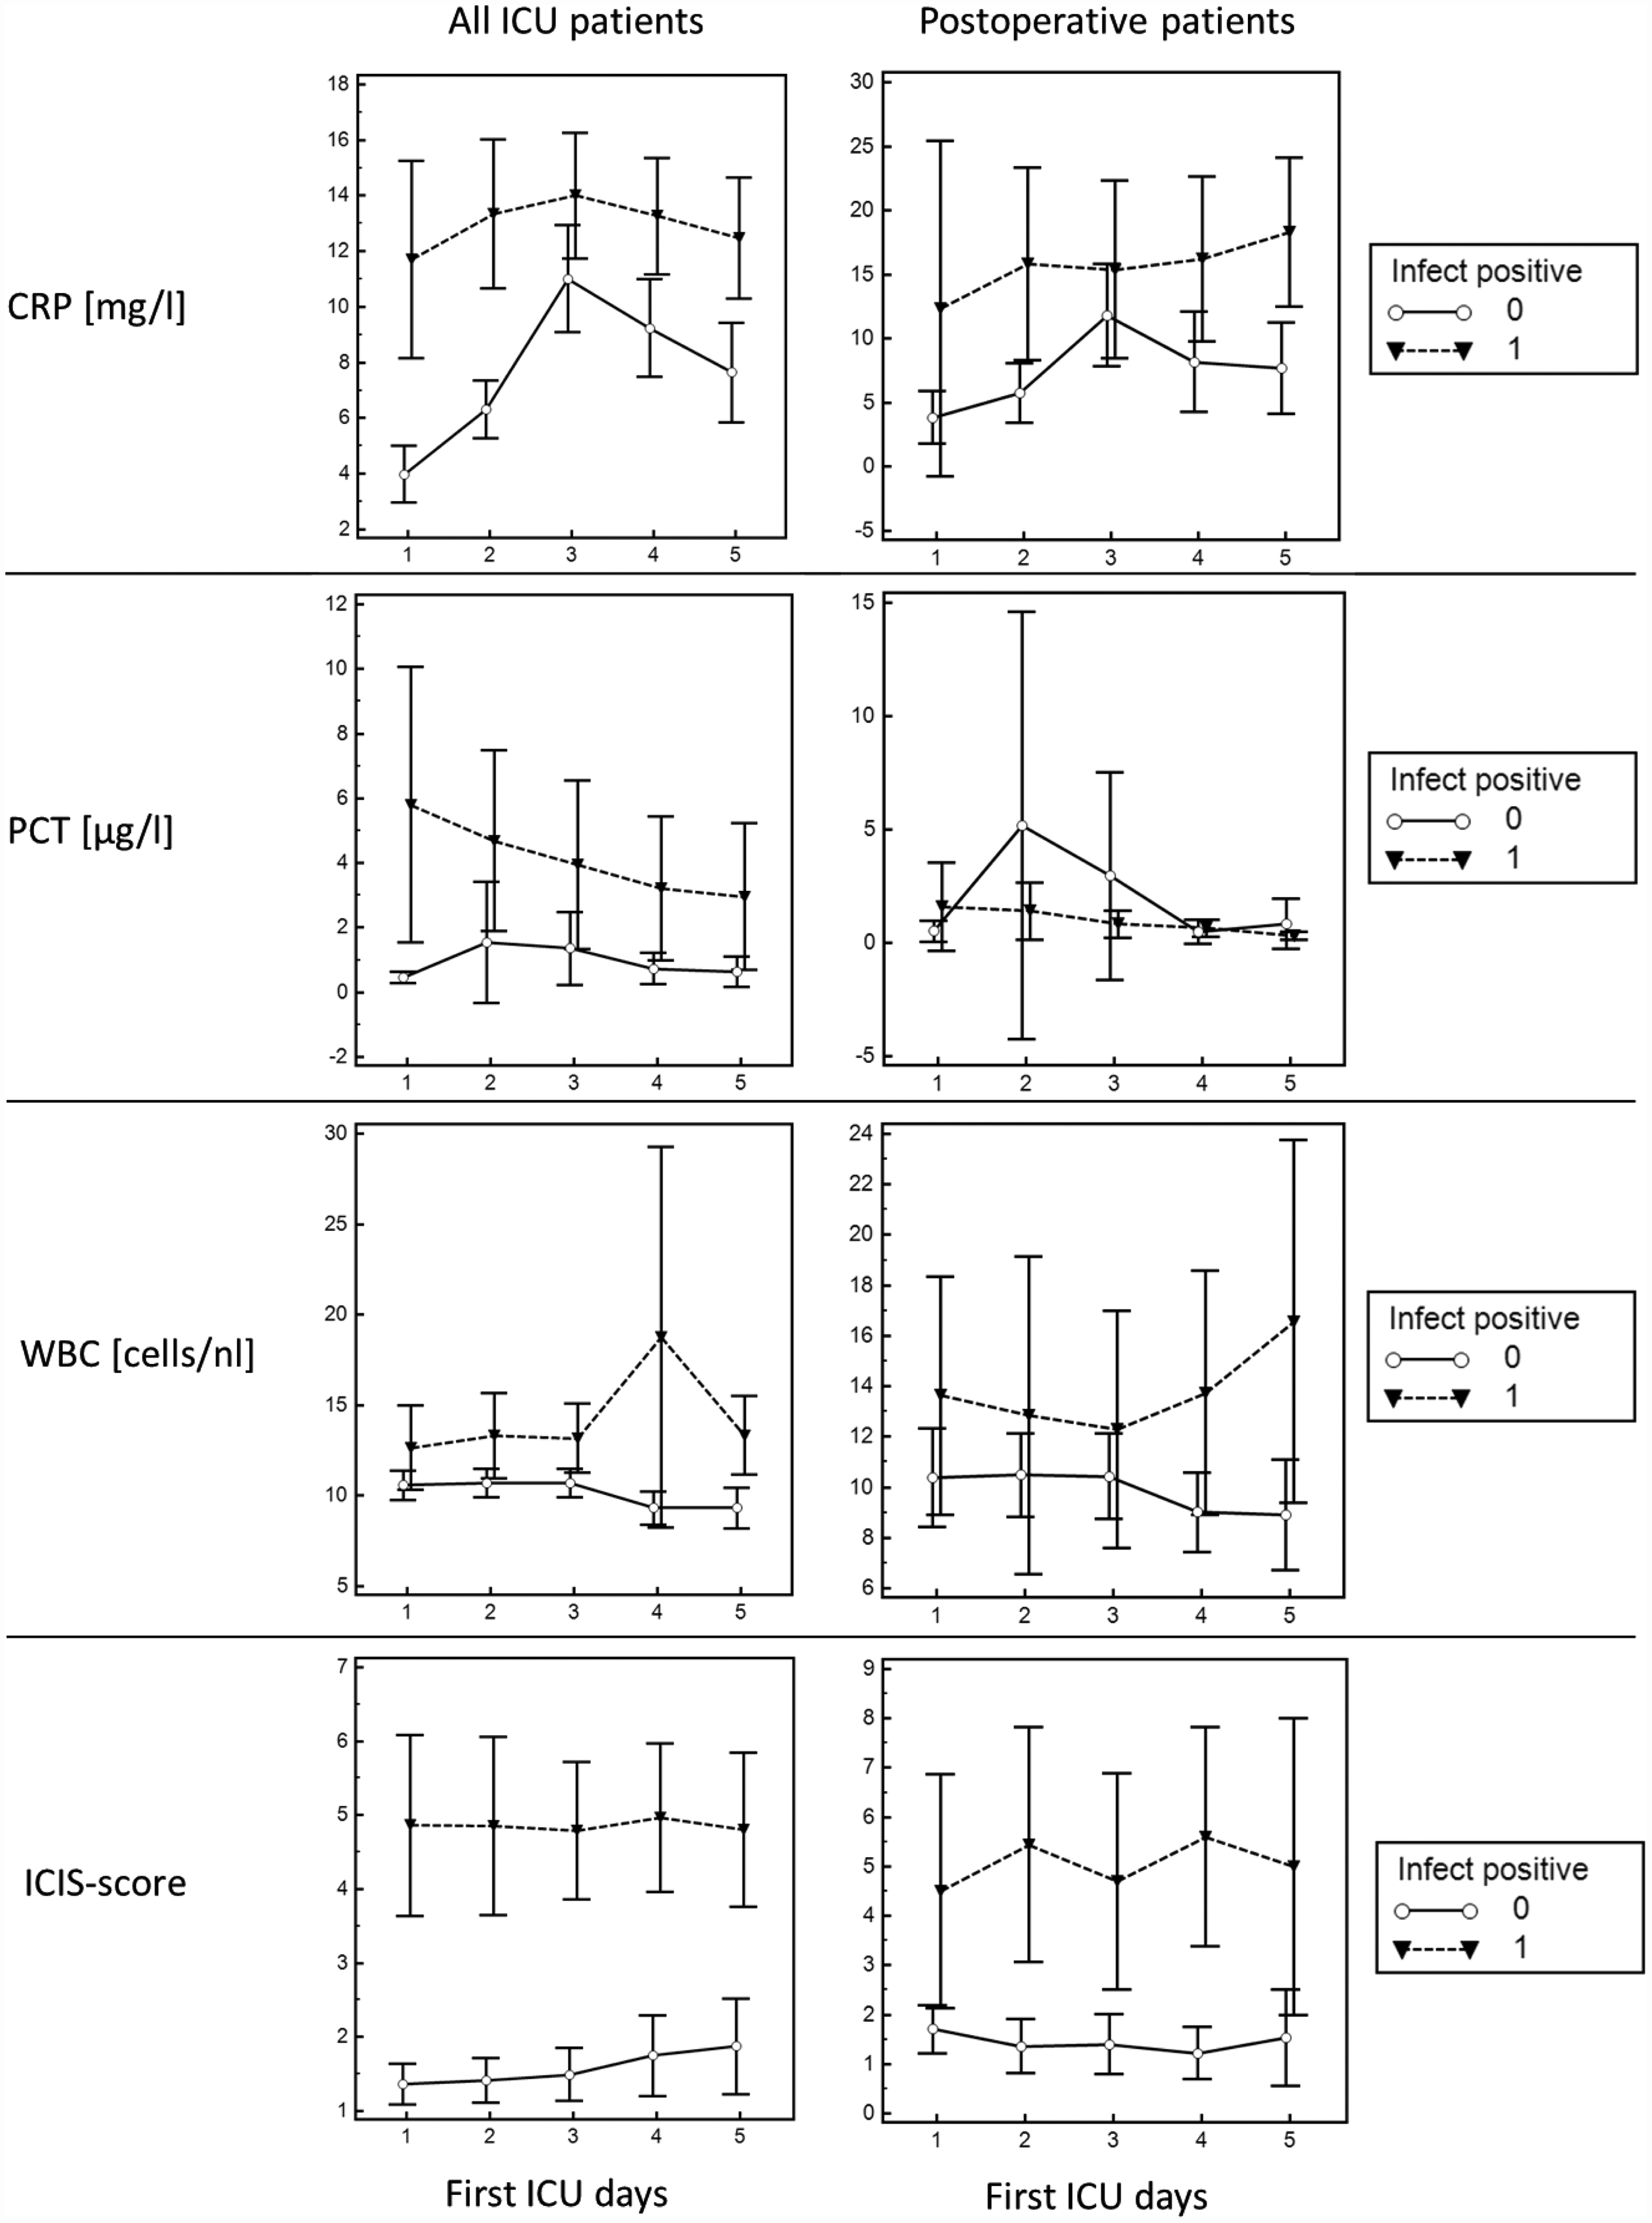
Assessment of antibiotic therapy decisions for postoperative ICU patients
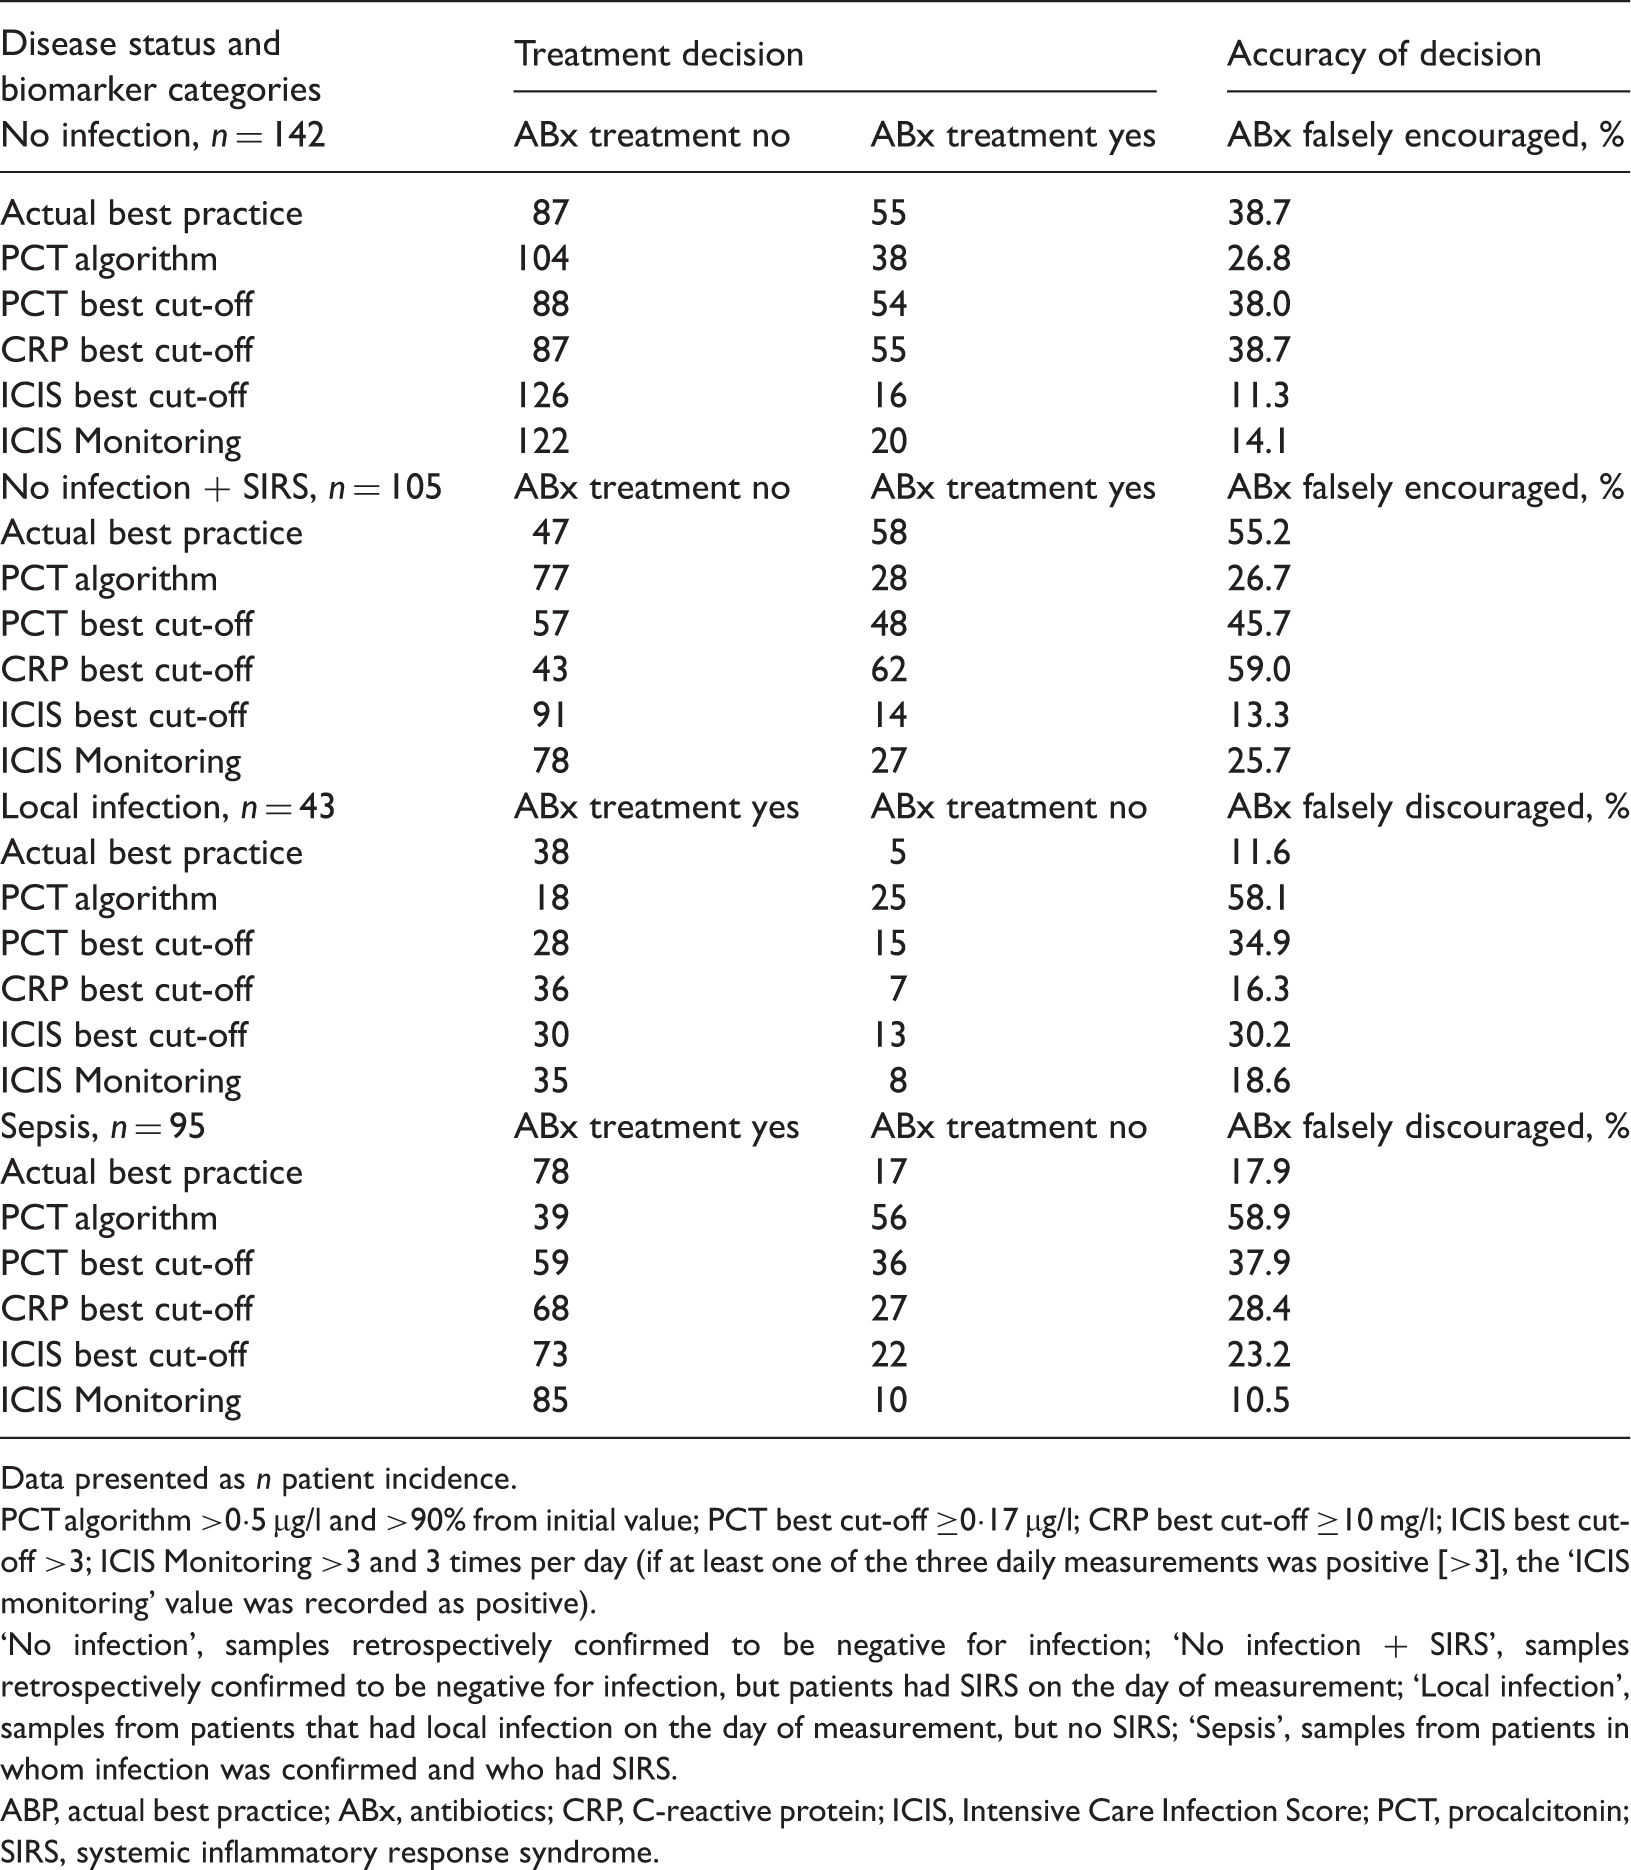
Retrospective assessment of daily antibiotic therapy decisions for 72 postoperative patients (n total samples = 385) during the first 7 days on the intensive care unit, based on the disease status and biomarker categories studied.
Data presented as n patient incidence.
PCT algorithm >0·5 µg/l and >90% from initial value; PCT best cut-off ≥0·17 µg/l; CRP best cut-off ≥10 mg/l; ICIS best cut-off >3; ICIS Monitoring >3 and 3 times per day (if at least one of the three daily measurements was positive [>3], the ‘ICIS monitoring’ value was recorded as positive).
No infection’, samples retrospectively confirmed to be negative for infection; ‘No infection + SIRS’, samples retrospectively confirmed to be negative for infection, but patients had SIRS on the day of measurement; ‘Local infection’, samples from patients that had local infection on the day of measurement, but no SIRS; ‘Sepsis’, samples from patients in whom infection was confirmed and who had SIRS.
ABP, actual best practice; ABx, antibiotics; CRP, C-reactive protein; ICIS, Intensive Care Infection Score; PCT, procalcitonin; SIRS, systemic inflammatory response syndrome.
In postoperative ICU patients without local infection, ICIS best cut-off showed the lowest calculated rate of 11.3% (16/142) ‘falsely encouraged antibiotic’ therapies followed by ICIS Monitoring, with a corresponding rate of 14.1% (20/142). For patients who were found to have systemic inflammatory response syndrome without local infection, the calculated rates of ‘falsely encouraged antibiotic’ therapies were 13.3% and 25.7% for ICIS best cut-off and ICIS Monitoring, respectively.
In postoperative ICU patients with local infection, actual best practice decision based antibody therapies showed the lowest rate (11.6% [five of 43]) of ‘falsely discouraged antibiotic’ treatment, followed by CRP with a rate of 16.3% (seven of 43). In patients with sepsis, ICIS Monitoring yielded the lowest rate (10.5%, [10/95]) of ‘falsely discouraged antibiotic’ treatment followed by the actual best practice decision criteria, with a rate of 17.9% (17/95).
Discussion
Early identification of infection remains a challenge for clinicians, especially in postoperative patients.30,31 Many biomarkers have been proposed and assessed clinically, but none alone is specific enough to determine diagnosis definitively. 32 The present study demonstrated the superior efficiency of fully automated ICIS to discriminate those individuals with infection from those without infection, in general ICU patients and in a postoperative cohort, compared with widely used infection markers (namely, PCT, CRP, or WBC levels). Through retrospective analysis, the present study also indicated that using ICIS for monitoring antibiotic therapy may result in unnecessary antibiotic therapy being stopped earlier: In a group of postoperative ICU patients without infection, ICIS was shown to have the lowest calculated rate of unnecessary antibiotic administration.
The host response to infection invariably starts with activation of the innate immune system. All ICIS blood-cell derived parameters are involved in the immediate or early inflammation response: the activation of neutrophils, monocytes and lymphocytes, and indicators that reflect bone-marrow production of innate immune cells, namely mature and immature neutrophils. 25 The present study demonstrated that the ICIS can significantly discriminate between groups of patients with and without infection. Throughout the first 5 days on ICU, ICIS was a more accurate marker for local bacterial infection or for sepsis in postoperative patients compared with PCT, CRP, or WBC levels.
The utility of PCT has been demonstrated in selected patient cohorts, especially in relation to community-acquired pneumonia. 13 However, it is important to consider the kinetics of prospective markers, particularly in postoperative patients. Thus, the present study analysed the discriminate power of biomarkers to detect infection in each individual throughout the first 5 days in ICU, to assess the potential to contribute to the principle of the ‘golden hour’ of sepsis. For all 5 days, ICIS showed the highest significant discriminate power to detect infection, with almost identical cut-off values on each of the 5 days, in contrast to CRP, PCT and WBC levels (which were all revealed to be less accurate for the same purpose, with daily varying cut-offs [except for PCT which had the same cut-off value over the 5 days]).
Following surgical trauma, CRP or WBC levels rise and peak at 48 h postoperatively.33–35 In addition, the CRP concentration has no correlation with the occurrence of infection within the first 3 postoperative days. 36 Consequently, although CRP has a clear role in monitoring clinical response to treatment when infection is diagnosed, the routine use of CRP measurements within the first 2–3 days following surgery is not recommended, and should only be requested if there is a clear clinical indication. 36
Elevated PCT levels have been shown to correlate with systemic inflammation when there are no signs of infection and/or other complications early following surgery, though these are largely influenced by the type of surgery performed.22,37 The kinetics of PCT show that it increases following surgery, with peak levels on day 1 or 2, and its decline following surgery is faster than that seen for CRP. 38 In the present study, ICIS was demonstrated to discriminate significantly between postoperative patients with infection and those without infection. In the first 5 days on ICU, ICIS levels were also more accurate markers for local bacterial infection or sepsis than PCT, CRP, or WBC levels. Since postoperative patients show a different response compared with general ICU patients, the cut-off value evaluated in the present study (>3) was slightly different from that evaluated in an overall ICU cohort (>4). 25
The suitability of ICIS as a patient monitoring parameter was evaluated by measuring parameters three-times-daily, in the present study. This was possible since ICIS determination is a rapid and easy point-of-care method that is performed with only 150 µl of whole blood, it does not require sophisticated equipment and results are available within 1 min. 25 In the present study, rates of potentially falsely encouraged antibiotic therapy and falsely discouraged antibiotic therapy for postoperative ICU patients (based on actual best practice, PCT, CRP, ICIS best cut-off value, PCT recommended cut-off value of 0.5, and ICIS Monitoring) revealed that ICIS had the lowest calculated rate of unnecessary antibiotic administration in postoperative ICU patients without infection.
In the present ICU patient cohort, ICIS was shown to have the potential to support an overall treatment protocol with the aim of reducing unnecessary antibiotic treatment and limiting antibiotic therapy duration for ICU patients, compared with PCT, CRP and actual best practice, since the performance of ICIS was not inferior to actual best practice. The comparisons of antibiotic therapy decisions were limited, however, by the fact that they were based solely on positive microbiological cultures and/or X-radiography results as a reference, and this protocol carries a possible result delay of 48 h. In addition, there were no over-ruling criteria such as difficulties eradicating pathogens, infections requiring prolonged antibiotic therapy, or immunosuppressed patients.
Several further limitations of the present study also require consideration. The sole use of clinical criteria and microbiological evidence may have made it difficult to ascertain the exact aetiology of systemic inflammatory reaction and sepsis for all patients. Furthermore, sample contamination could have led to false-positive culture results, which could have introduced a misclassification bias. Investigators were not made aware of the diagnostic results performed in the respective case ascertainment, however, so the authors’ do not believe that a lack of ‘gold standard’ compromised the study conclusions. The present study should be considered as a pilot study for defining ICIS cut-off values as a marker of infection in postoperative and general ICU patients, due to the relatively small number of patients investigated.
In conclusion, the present study demonstrated the possibility to use ICIS measurement routinely in ICU patients, in general. For postoperative patients in particular, ICIS may provide a reliable marker for the timely identification of infection. Further prospective studies are required to ascertain whether early ICIS measurements will improve the prognosis for ICU patients, by helping to initiate very early anti-infective therapy regimens. Finally, the use of ICIS as a decision guide may reduce antibiotic exposure and the associated risks of adverse effects, and in addition reduce antibiotic resistance, without putting patients at risk.
Footnotes
Declaration of conflicting interest
The authors declare the following: Honoraria from Sysmex for presentations at international scientific meetings (A.W.); a travel grant from Sysmex for taking part in a scientific meeting in 2009 (K.W.); and funding by Sysmex for the duration of the data collection period (O.V.).
Funding
This study was supported by Sysmex Europe GmbH (funding for the routine blood work of the study and contribution to the study design). However, Sysmex had no responsibility for conducting the study, or the collection, management, analysis and interpretation of the data, or for the preparation, review, or approval of the manuscript.