
Abstract
Objective
To determine the role of altered brain connectivity in patients with psychogenic non-epileptic seizures (PNES).
Methods
Patients with PNES and age- and sex-matched healthy control subjects were enrolled. Participants underwent neuropsychological evaluation (anxiety, depression and dissociation) and interictal scalp electroencephalography (EEG). A brain network was constructed. Between-group differences in clustering coefficient and global efficiency were analysed.
Results
Patients with PNES (n = 15) had significantly decreased clustering coefficients in the gamma band compared with controls (n = 15). Difference topology revealed that patients with PNES had decreased long linkage between the frontal region and other regions compared with controls. There were no significant between-group differences in global efficiency. Neuropsychological scores were significantly higher in patients than controls, but there were no correlations with network properties.
Conclusion
Altered brain connectivity in patients with PNES suggests an underlying pathophysiological mechanism. EEG and network analysis allow noninvasive exploration of the neurological processes of this disease.
Keywords
Introduction
Psychogenic non-epileptic seizures (PNES) are paroxysmal episodes of altered motor function, sensation and behaviour that resemble epileptic seizures, but lack electroencephalographical epileptic changes and central nervous system dysfunction. 1 The diagnosis of PNES is challenging and relies on assessment of clinical manifestation, with video-electroencephalography (vEEG) being the gold standard.2,3
Accurate diagnosis of PNES is limited by the lack of quantifiable biomarkers, since the pathophysiological basis of the condition remains to be elucidated. 4 Magnetic resonance imaging (MRI) studies have revealed significant cortical thinning in the motor and premotor areas of the right hemisphere of patients with PNES, as well as in the bilateral cerebellum. 5 In addition, resting-state functional (f)MRI found an abnormal functional correlation between movement and emotion in these patients. 6 Although vEEG is a valuable tool in differentiating between PNES and epileptic seizures, the recordings are used only to demonstrate the absence or presence of visually detectable epileptic features, and the EEG data is disregarded. Interestingly, a study examining the whole-head surface topography of multivariate phase synchronization in interictal EEG found that PNES was associated with decreased prefrontal and parietal synchronization, possibly reflecting network dysfunction within these regions. 7 Thus, EEG may be a promising tool for studying the pathophysiology of PNES.
Graph theory 8 is a branch of classical mathematics dealing with networks, which are represented as sets of nodes (vertices) and connections (edges). Clustering coefficient (C; a measure of the local connectedness of a graph) and global efficiency (E global ) are also important properties of the network. The shortest path length (L) is the number of edges in the shortest path between two vertices. Global efficiency refers to the mean of the inverse of the shortest path by setting the value to zero for disconnected vertices, and is a measure of global connectedness. Different types of brain disease can disrupt optimal brain connectivity, causing cognitive problems 9 or epilepsy. 10 It is possible that PNES is related to abnormal connectivity within the brain. The aim of the present study, therefore, was to use interictal scalp EEG to compare clustering coefficients and global efficiency in patients with PNES and healthy control subjects.
Patients and methods
Study population
Patients with PNES who attended the Epilepsy Centre of Xuanwu Hospital, Capital Medical University, Beijing, China, were recruited between October 2010 and October 2012. Inclusion criteria were: (I) aged 17–40 years; (II) no significant abnormalities on MRI; (III) witness descriptions of episodes lacked association with central nervous system dysfunction, and were suspected to be PNES by two epilepsy specialists; (IV) vEEG recorded at ≥2 spontaneous or provoked non-epileptic events that were considered non-epileptic seizures by two specialists, and familiar witnesses recognized the events as typical; (V) no evidence of abnormal discharge on interictal and ictal 20-channel EEG, according to two EEG specialists; (VI) no use of any drugs for 2 months prior to diagnosis; (VII) right-handed.
Age- and sex-matched healthy control subjects were recruited via advertisements posted in Capital Medical University. Inclusion criteria were: (I) aged 17–40 years; (II) no significant abnormalities on MRI; (III) no history of epilepsy or PNES; (IV) no evidence of abnormal discharge on 20-channel EEG, according to two EEG specialists; (V) no use of any drugs for 2 months prior to diagnosis; (VI) right-handed.
Exclusion criteria for patients and controls were: (I) neurological comorbidity (including epilepsy) (II) malingering; (III) current or previous systemic disease or head trauma; (IV) alcohol or substance abuse; (V) psychosis.
All subjects provided a full medical history and underwent systematic and neurological examinations, psychiatric evaluation, MRI and vEEG. Psychiatric evaluation included the Mini-Mental State Examination (MMSE), 11 Self-rating Anxiety Scale (SAS), 12 Self-rating Depression Scale (SDS) 14 and Somatoform Dissociation Questionnaire 20 (SDQ-20). 15
Experimental protocols were approved by the ethics committee of Xuanwu Hospital, and all participants provided written informed consent.
EEG recording and preprocessing
An electrode cap (Greentek, Wuhan, China) was used to record the EEG from 20 sites (Fp1, Fp2, F7, F3, Fz, F4, F8, T3, C3, Cz, C4, T4, T5, P3, Pz, P4, T6, O1, Oz and O2) according to the 10–20 system, as well as the common reference, ground, electrocardiogram and electro-oculogram. Data were recorded using an amplifier (Micromed, Treviso, Italy) with band-pass filter 0.5–50 Hz, notch 50 Hz, and sampling rate 512 Hz. Electrode impedance was <20 kΩ.
All EEGs were recorded with the individual in the awake–eyes-closed condition for 5 min in order to minimize the possibility of sleep and retain visually detectable alpha rhythms. EEG epochs with artefacts were preliminary identified by two EEG specialists and discarded. Linear detrending and artefact rejection were performed in order to discard epochs contaminated by eye blinks, eye movement, amplifier clipping or muscle potentials. Off-line recordings were further band-pass filtered within 0.5–45 Hz and re-referenced to the common average reference. For each subject, ten consecutive 2-s segments excluding artefacts were selected for further analysis.
Brain network construction
Coherence
Coherence (Coh) was used for analysis of synchrony-defined cortical neuronal assemblies. We adopted frequency-specific coherence to denote linkage strength between two network nodes. Coh is expressed as:

Network properties
The brain network was constructed based on coherences of the 20 nodes using the corresponding coherence as the edge linkage w between two nodes. A connectivity threshold was set to remove weak links between nodes, and the weighted network was then set as a binary network. A 20 × 20 binary graph, consisting of nodes and undirected edges between nodes, was constructed by applying a threshold T to the coherence coefficients:
If the c(i, j) (coherence coefficient) of a pair of brain regions (i and j) exceeds a given threshold (T) an edge is said to exist, otherwise it does not exist. In the present study, the threshold was defined as the maximum value that could guarantee the connectivity of the 20 nodes between the two groups. Clustering coefficients and global efficiency were used to denote the local and global properties of networks, respectively. The absolute clustering coefficient of a node Ci is the ratio of the number of existing connections to the number of all possible connections in the subgraph:


Eglobal, a measure of the global efficiency of parallel information transfer in the network, is defined by the inverse of the harmonic mean of the minimum absolute path length between each pair of nodes:

Network analysis
The above network analysis procedure was performed for each of the 2-s EEG segments of every subject, resulting in 10 connectivity matrices, the mean of which was then used to achieve the final matrix for analysis. Based on the mean connectivity matrix, the network topology and properties were calculated for each subject. To determine the threshold for network analysis, the thresholds were increased for each frequency band in increments of 0.01 from 0.05 until the network was disconnected. At each threshold, the shortest path lengths were calculated for each subject based on the averaged adjacent matrix, and then those properties were further averaged across groups. Based on the shortest path length, the thresholds for the four frequency bands were separately defined as the maximum value that could guarantee the connectivity of the 20-node networks at a low cost (with smallest number of edges).
Statistical analyses
Data were presented as mean ± SD or median (interquartile range). Between-group comparisons were made using independent samples t-test or Mann–Whitney U-test for normally and non-normally distributed data, respectively. For multiple comparisons, we applied the Bonferroni-corrected independent t-test to the network properties. Fisher's exact test was used for comparison of sex distribution. Pearson's test (for normally distributed data) or Spearman's test (for non-normally distributed data) were used to analyse correlations between network properties and neuropsychological scores. Statistical analyses were performed using SPSS® version 17.0 (SPSS Inc., Chicago, IL, USA) for Windows®. P-values < 0.05 were considered statistically significant.
Results
Demographic and clinical data of patients with psychogenic non-epileptic seizures (PNES) and healthy control subjects included in an electroencephalography network analysis study.

Data presented as mean ± SD, n, or median (interquartile range).
MMSE, Mini-Mental State Examination; SAS, Self-rating Anxiety Scale; SDS, Self-rating Depression Scale; SDQ-20, Somatoform Dissociation Questionnaire 20.
P < 0.001 vs controls; aindependent-sample t-test; bMann–Whitney U-test.
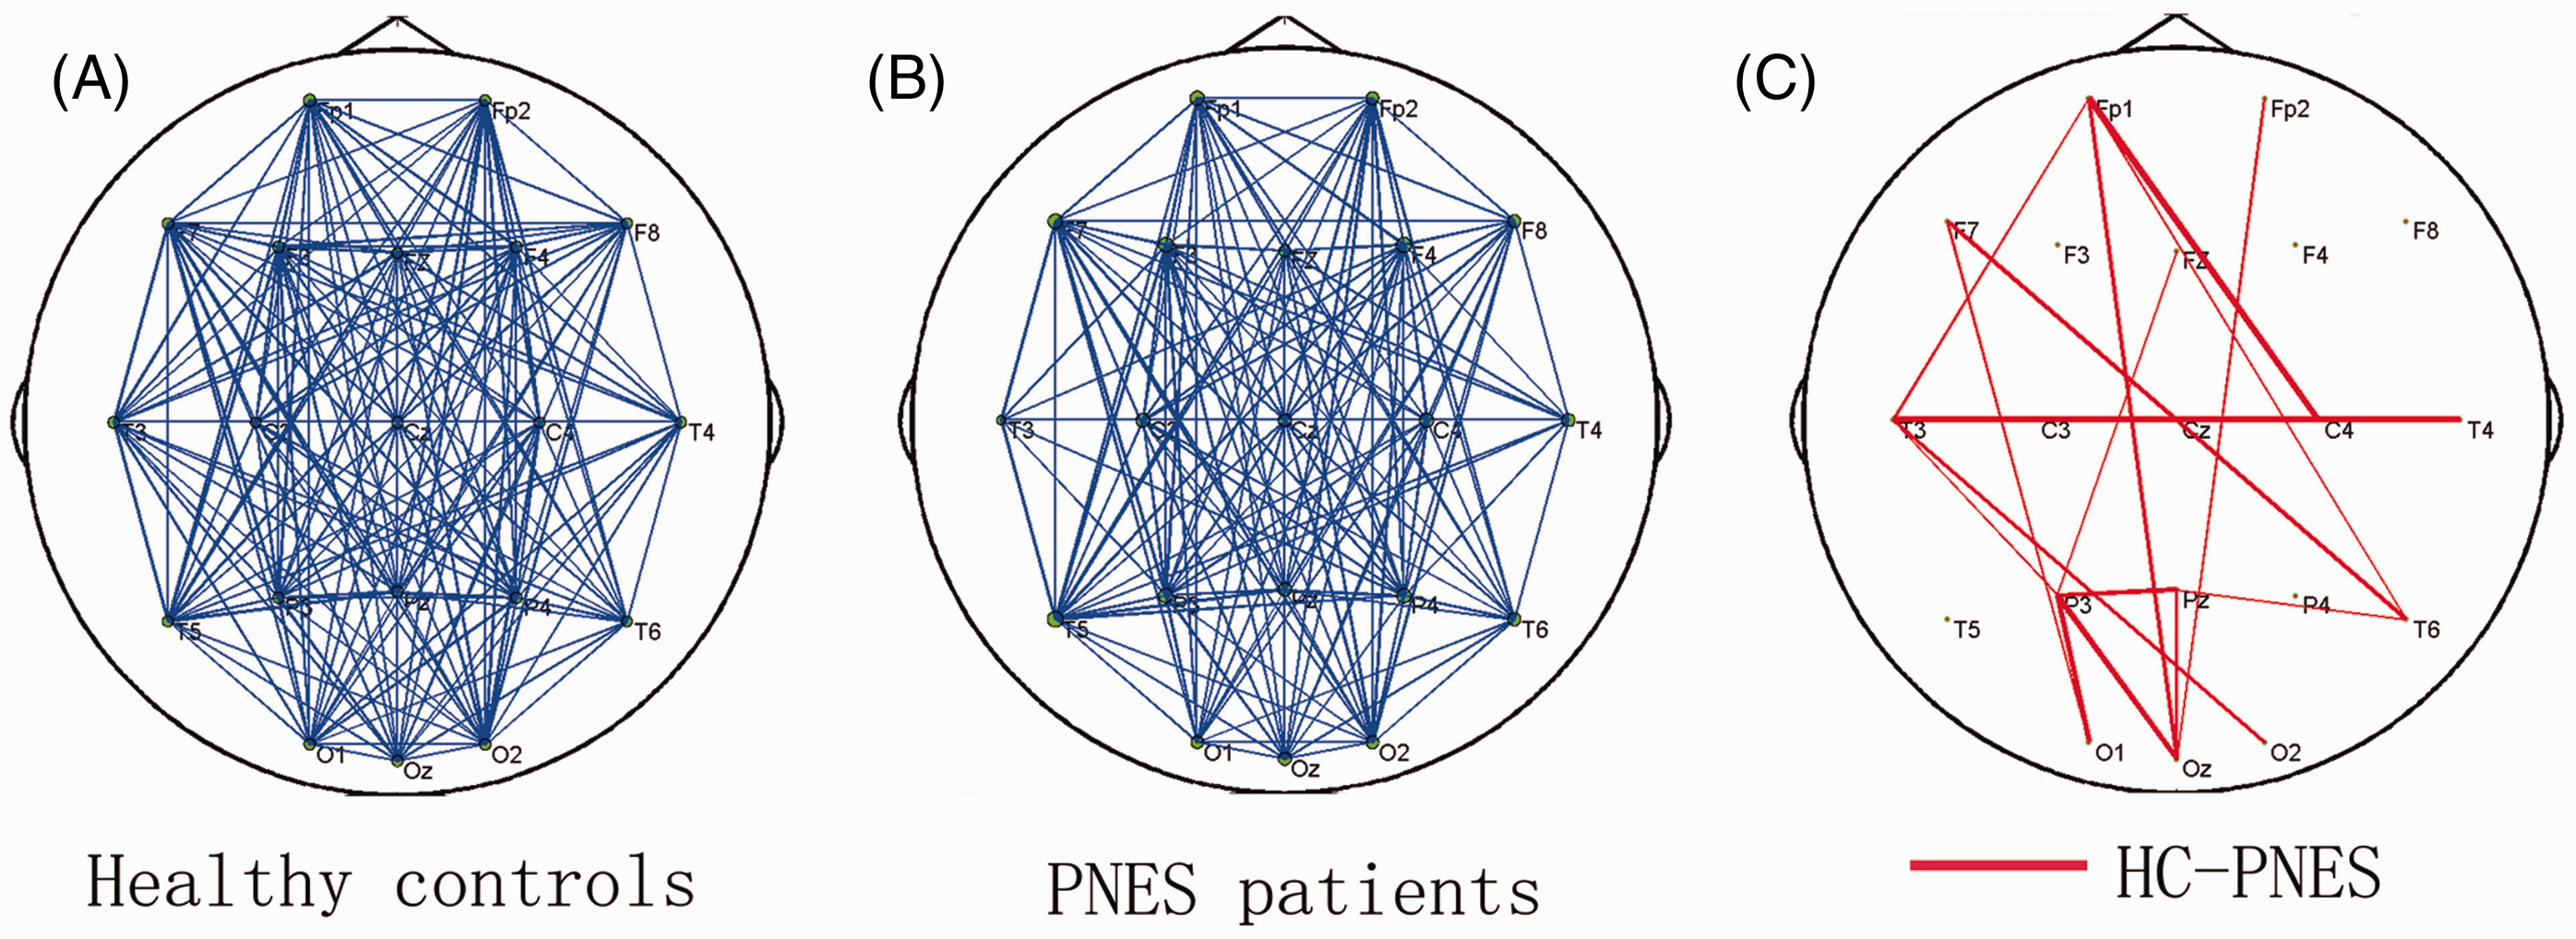
The shortest path lengths for different thresholds are shown in Figure 1. Threshold values were 0.23, 0.24, 0.23 and 0.16 for the theta, alpha, beta and gamma bands, respectively. The corresponding clustering coefficients and global efficiency were calculated using these thresholds (Table 2). Clustering coefficients and global efficiency were smaller in all four frequency bands in patients with PNES compared with controls, but this difference was only statistically significant in the gamma band (P = 0.036; Table 2). Analysis of network topology in the gamma band revealed that patients with PNES had decreased long linkage between the frontal region and posterior brain areas compared with controls (Figure 2).
Network analysis of electroencephalography findings from patients with psychogenic non-epileptic seizures (PNES) and healthy control (HC) subjects, to determine the shortest path length (L) at different threshold values in the four frequency bands. Mean network topology of gamma band electroencephalography findings (with threshold 0.16) from (A) healthy control (HC) subjects; (B) patients with psychogenic non-epileptic seizures (PNES); and (C) the difference between the two groups (lines indicate reduced linkage in the PNES group compared with controls). Clustering coefficients and global efficiency determined by network analysis of electroencephalography findings in patients with psychogenic non-epileptic seizures (PNES) and healthy control subjects. Data presented as mean ± SD. P < 0.05; Bonferroni-corrected independent t-test.

There were no significant correlations between SDQ-20, SAS or SDS scores and clustering coefficient in any frequency band.
Discussion
The brain is as a complex anatomical and functional network of approximately 1 × 10¹⁰ neurons, with each neuron communicating with about 1 × 10⁴ others. 8 It has been shown that brain connectivity is altered in patients with schizophrenia, Alzheimer's disease, epilepsy and depression.9,10,15–17 The present study found altered network properties in the form of decreased clustering coefficients in the gamma band in patients with PNES compared with controls. Decreased clustering coefficients are associated with low local efficiency of information transfer, 18 suggesting impaired local neural processing in PNES and a possible pathophysiological mechanism of this disease.
The synchronization of the gamma band, usually 30–70 Hz, is an important neurophysiological mechanism underlying binding, attention and consciousness.19–22 Gamma synchronization is a local phenomenon, either within one area or between monosynaptically coupled neurons in different areas. 23 Patients with PNES exhibited significantly altered clustering coefficients in the gamma band in the present study, as well as decreased long linkage between the frontal region and posterior areas. It is possible that these alterations reflect decreased interactions within one brain area or connectivity of monosynaptic neurons from distant areas. This decreased gamma synchronization did not significantly affect the lower frequencies in the present study, however.
Dysfunction of prefrontal connectivity may lead to impairment of executive control, resulting in uncontrolled movements. An EEG study found instability of prefrontal functional connectivity to be an important factor underlying PNES. 7 Frontal lobe dysfunction has been described in patients with other somatoform or conversion disorders. 7 The present study revealed similar results, suggesting a role for frontal lobe involvement in the pathophysiology of PNES.
A cortical thickness and voxel-based morphometry study revealed abnormal cortical atrophy of the motor and premotor regions in the right hemisphere and the cerebellum bilaterally, and a significant association between increasing depression scores and atrophy involving the premotor regions in patients with PNES. 5 It was unclear whether the volumetric differences were related to depression or PNES, however. There were no correlations between clustering coefficients and SAS or SDS scores in the present study. It is therefore likely that the decreased clustering coefficients in patients with PNES were related to the disease itself. In an fMRI study, patients with PNES exhibited stronger connectivity values between areas involved in emotion, executive control and movement, which were significantly associated with dissociation scores. 6 This suggests that emotions can bypass executive control and cause involuntary movement in these patients. These data are consistent with the present finding of decreased executive control, likely resulting from frontal connectivity dysfunction. In contrast to the findings of others, 6 the present study found no correlation between dissociation (SDQ-20 score) and clustering coefficients, indicating that the reduced clustering coefficient in patients with PNES compared with controls is related to PNES rather than the dissociation.
The current study has several limitations. First, in spite of the 3-year duration of the study, the sample size was small. Secondly, the exclusion of patients with epilepsy prevents the discrimination between epileptic and non-epileptic seizures. Further, larger scale studies of patients with different clinical subtypes, as well as healthy and epileptic control groups are required.
In conclusion, the altered brain connectivity in patients with PNES suggests an underlying pathophysiological mechanism of this disease. PNES is a complex disorder with poorly understood mechanisms, and the noninvasive techniques of EEG and network analysis allow exploration of the underlying functional neurological processes. Future investigations should elucidate the exact neurophysiological basis, including the connectivity of the frontal region.
Footnotes
Declaration of conflicting interest
The authors declare that there are no conflicts of interest.
Funding
The research was supported by the National Natural Science Foundation of China (No: 81271494 and 61175117).