
Abstract
Background
Visual evaluation of interstitial lung disease (ILD)-related changes can generate intra- and inter-observer errors. However, recent deep learning (DL) algorithm advances have facilitated accurate lung segmentation, lesion characterization, and quantification.
Purpose
To evaluate the treatment response and long-term course in ILD associated with anti-aminoacyl-tRNA synthetase syndrome (anti-ARS ILD) using a DL algorithm.
Material and Methods
Patients with anti-ARS ILD who underwent both pre- and post-initial-treatment computed tomography (CT) (n = 68) were divided into two groups (responders and non-responders) according to forced vital capacity improvement after initial treatment. We also analyzed the CT images of patients for whom long-term follow-up CT (>5 years) was performed after post-treatment CT (n = 43). DL analysis was used to classify CT imaging features into five patterns: normal; ground-glass opacity (GGO); consolidation; fibrotic lesions; and emphysema.
Results
The initial responder group had a larger volume of consolidation. Consolidation and GGO volumes decreased after initial treatment in both groups. However, whole-lung and normal-area volumes increased in the responder group; conversely, there was no significant increase in the non-responder group. At the long-term follow-up, fibrotic lesions significantly increased in both groups. The emphysema pattern increased significantly in both groups after initial treatment and long-term follow-up. Six of 26 (23.1%) responders and 8 of 17 (47.1%) non-responders were judged as having progressive pulmonary fibrosis.
Conclusion
DL-based analysis facilitated the chronological evaluation of anti-ARS ILD. During the long-term follow-up, anti-ARS ILD was associated with chronological progression, regardless of initial treatment efficacy.
Introduction
The presence of anti-aminoacyl-tRNA synthetase (anti-ARS) antibodies is correlated with the development of interstitial lung diseases (ILDs) in individuals diagnosed with polymyositis (PM) and dermatomyositis (DM) (1,2). Anti-ARS antibodies are also found in ILD without connective tissue diseases (3), known as anti-ARS syndrome. Anti-inflammatory drugs, including corticosteroids, are generally effective in treating ILD associated with anti-ARS syndrome (anti-ARS ILD); however, the chronological clinical course may vary, and it often recurs and can progress to serious fibrosis of the lung tissue (4,5).
Recently, progressive pulmonary fibrosis (PPF) has been defined as the fulfillment of at least two of the following three criteria—worsening symptoms, radiological progression, and physiological progression—occurring within the past year in a patient with ILD of known or unknown etiology other than idiopathic pulmonary fibrosis, and the Official ATS/ERS/JRS/ALAT Clinical Practice Guideline Committee considered PPF as the conditional recommendation for the anti-inflammatory, antifibrotic agent pirfenidone (6,7). PPF includes PM/DM/anti-ARS syndrome; therefore, chest computed tomography (CT) evaluation over time is important for managing patients with anti-ARS syndrome. However, radiologists’ visual evaluation of ILD severity and chronological changes can often generate intra- and inter-observer errors (8).
Recent studies showed that the deep learning (DL) algorithm provides an objective and accurate characterization and quantification of ILD and lung inflammatory diseases (9,10). We hypothesized that the DL algorithm might provide the objective evaluation of the complicated clinical course of anti-ARS-ILD, potentially resulting in appropriate patient management. Thus, the aim of the present study was to quantitatively investigate the chronological changes of imaging features by comparing the responder and non-responder to the treatment in the patients with anti-ARS-ILD.
Material and Methods
The study was approved by the Institutional Review Board of Kanagawa Cardiovascular and Respiratory Center (KCRC-18-20 and 30 November 2018) and the requirement for informed consent was waived.
Patient population
We initially screened 131 consecutive patients diagnosed with anti-ARS ILD between January 1996 and April 2018. Some patients were enrolled in previous clinical research (11). Of the 131 patients, we excluded those who did not undergo either pre- or post-treatment (within 3–18 months after pre-treatment CT) CT imaging at our institution (n = 63). Therefore, 68 patients were finally included in this study. The enrolled patients were divided into two groups according to the presence or absence of forced vital capacity (FVC) improvement after initial treatment: initial responder and non-responder groups. FVC improvement was defined as an improvement of at least 10% after treatment compared to the pre-treatment baseline (11). Pre-treatment pulmonary function tests were performed 3 months before pre-treatment CT. Post-treatment and long-term follow-up pulmonary function tests were performed within 6 months of the CT examination; %predicted FVC (FVC%) data were also obtained.
In addition, we analyzed the CT images of patients (n = 43) for whom long-term follow-up CT was performed after the post-treatment CT (at least 5 years later). Pre- and post-treatment CT data were evaluated for 68 patients (37 responders and 31 non-responders), and long-term follow-up CT data were evaluated for 43 patients (26 responders and 17 non-responders). In total, 179 CT scans of 68 patients were quantitatively evaluated, including pre-treatment to long-term follow-up. Patients with long-term follow-up were evaluated to determine those who met the definition of PPF (6).
Autoantibodies were evaluated as part of the initial work-up or during the follow-up period. ARS antibodies (against Jo1, EJ, PL7, PL12, OJ, and KS) were analyzed using RNA and protein immunoprecipitation assays.
Table 1 and Fig. 1 show the patient characteristics and selection flowchart, respectively.
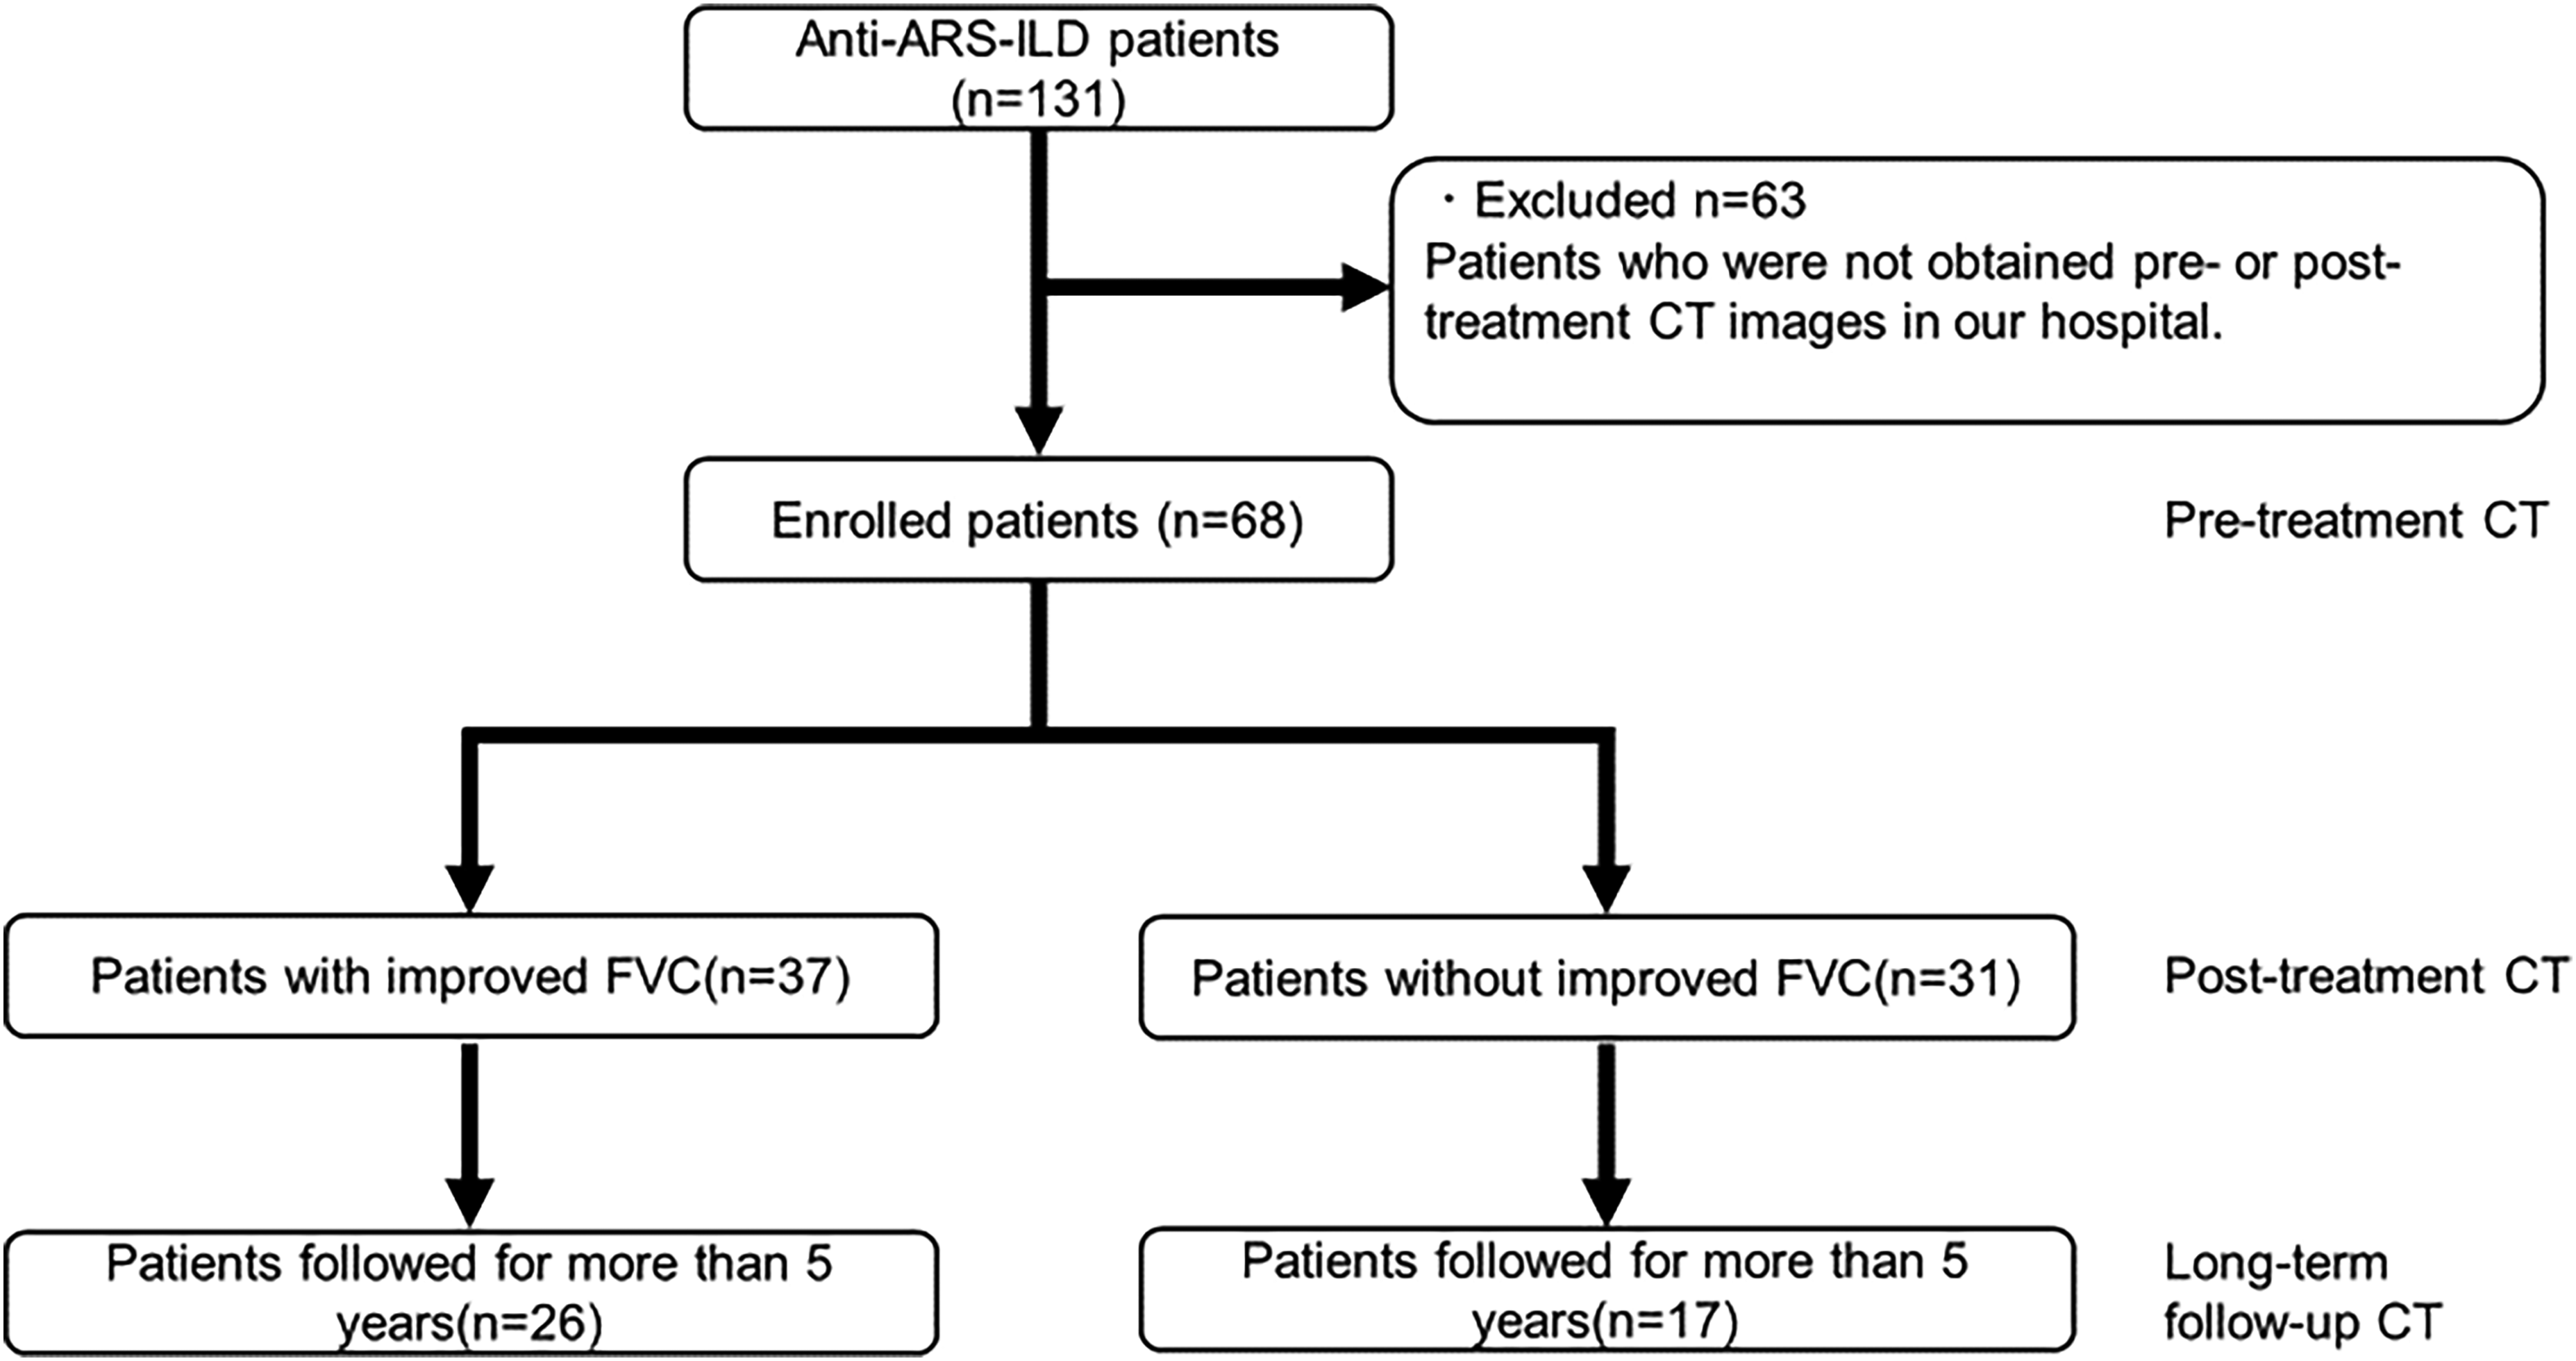
Flowchart of the present study. Of the 131 consecutive patients with anti-ARS-ILD, 68 were enrolled in the study and 63 were excluded.
Patient characteristics.
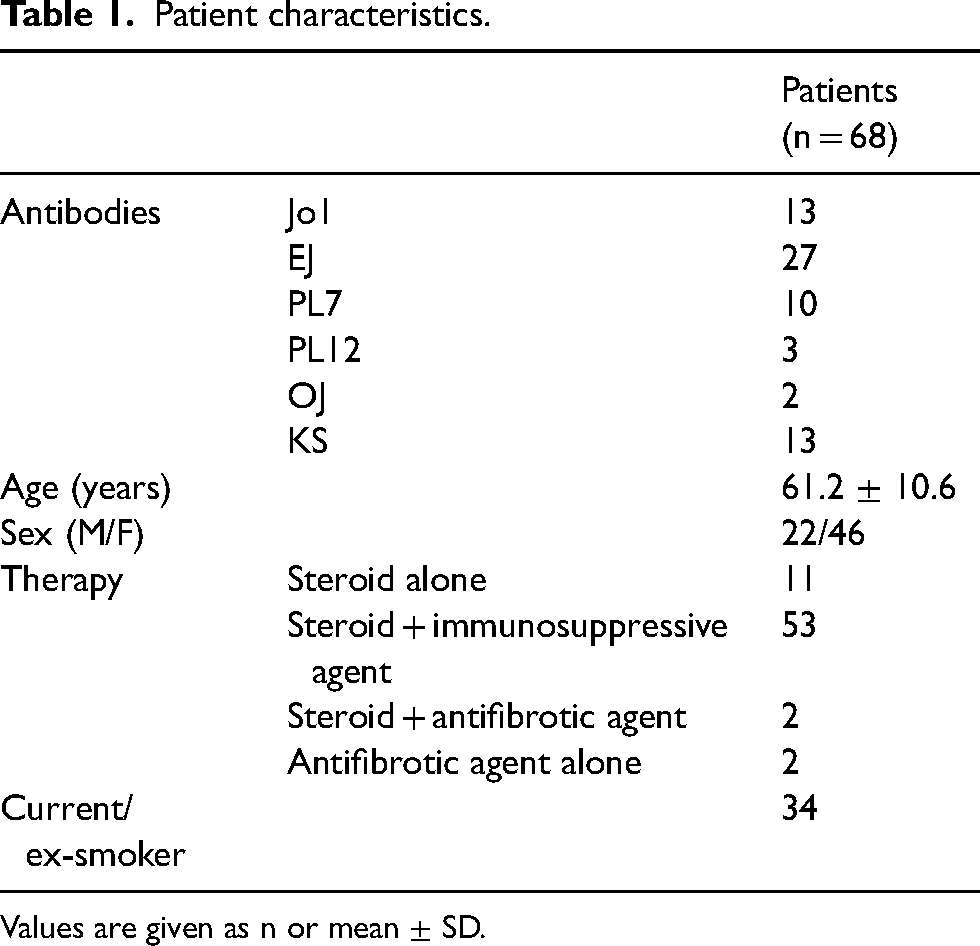
Values are given as n or mean ± SD.
CT data acquisition
Thin-section non-contrast CT images were obtained from each patient in the supine position during inspiration using 320-, 64-, or 16-row multidetector CT scanners (Aquilion ONE GENESIS, Aquilion 64, or Aquilion 16; Canon Medical Systems, Otawara, Japan). The tube voltage was 120 kVp for all the scanners. The tube current of each scanner was as follows: 250–300 mA (automatic exposure control) for the Aquilion ONE GENESIS and Aquilion 64; and 250 mA for the Aquilion 16. All CT images were reconstructed with a slice thickness of 0.5 mm using an iterative reconstruction algorithm (AIDR3D; Canon Medical Systems) or filtered back-projection.
DL lung analysis
We used a DL-based ILD analysis system (Quantification by Ziosoft Informatics Platform for Interstitial Lung Disease [QZIP-ILD]; Ziosoft, Inc. Tokyo, Japan). This DL system enables quantitative assessment of lung disease; details of this DL-based ILD analysis system have been provided in previous reports (9,10). We classified the CT imaging features using DL lung analysis into five patterns: normal; ground-glass opacity (GGO); consolidation; fibrotic lesions; and emphysema. Fibrotic lesions include reticulation, traction bronchiectasis, honeycombing, and pleuroparenchymal fibroelastosis-like lesions (10). Lung lesion volumes were quantified for all lung lobes and each lobe. In addition, the lesion extent (the lesion volume to total lung volume ratio) was calculated. The mean CT number (HU) of the normal lung pattern was also quantified. Fig. 2 shows representative pre-treatment CT images and DL analysis of the anti-ARS-ILD patient.
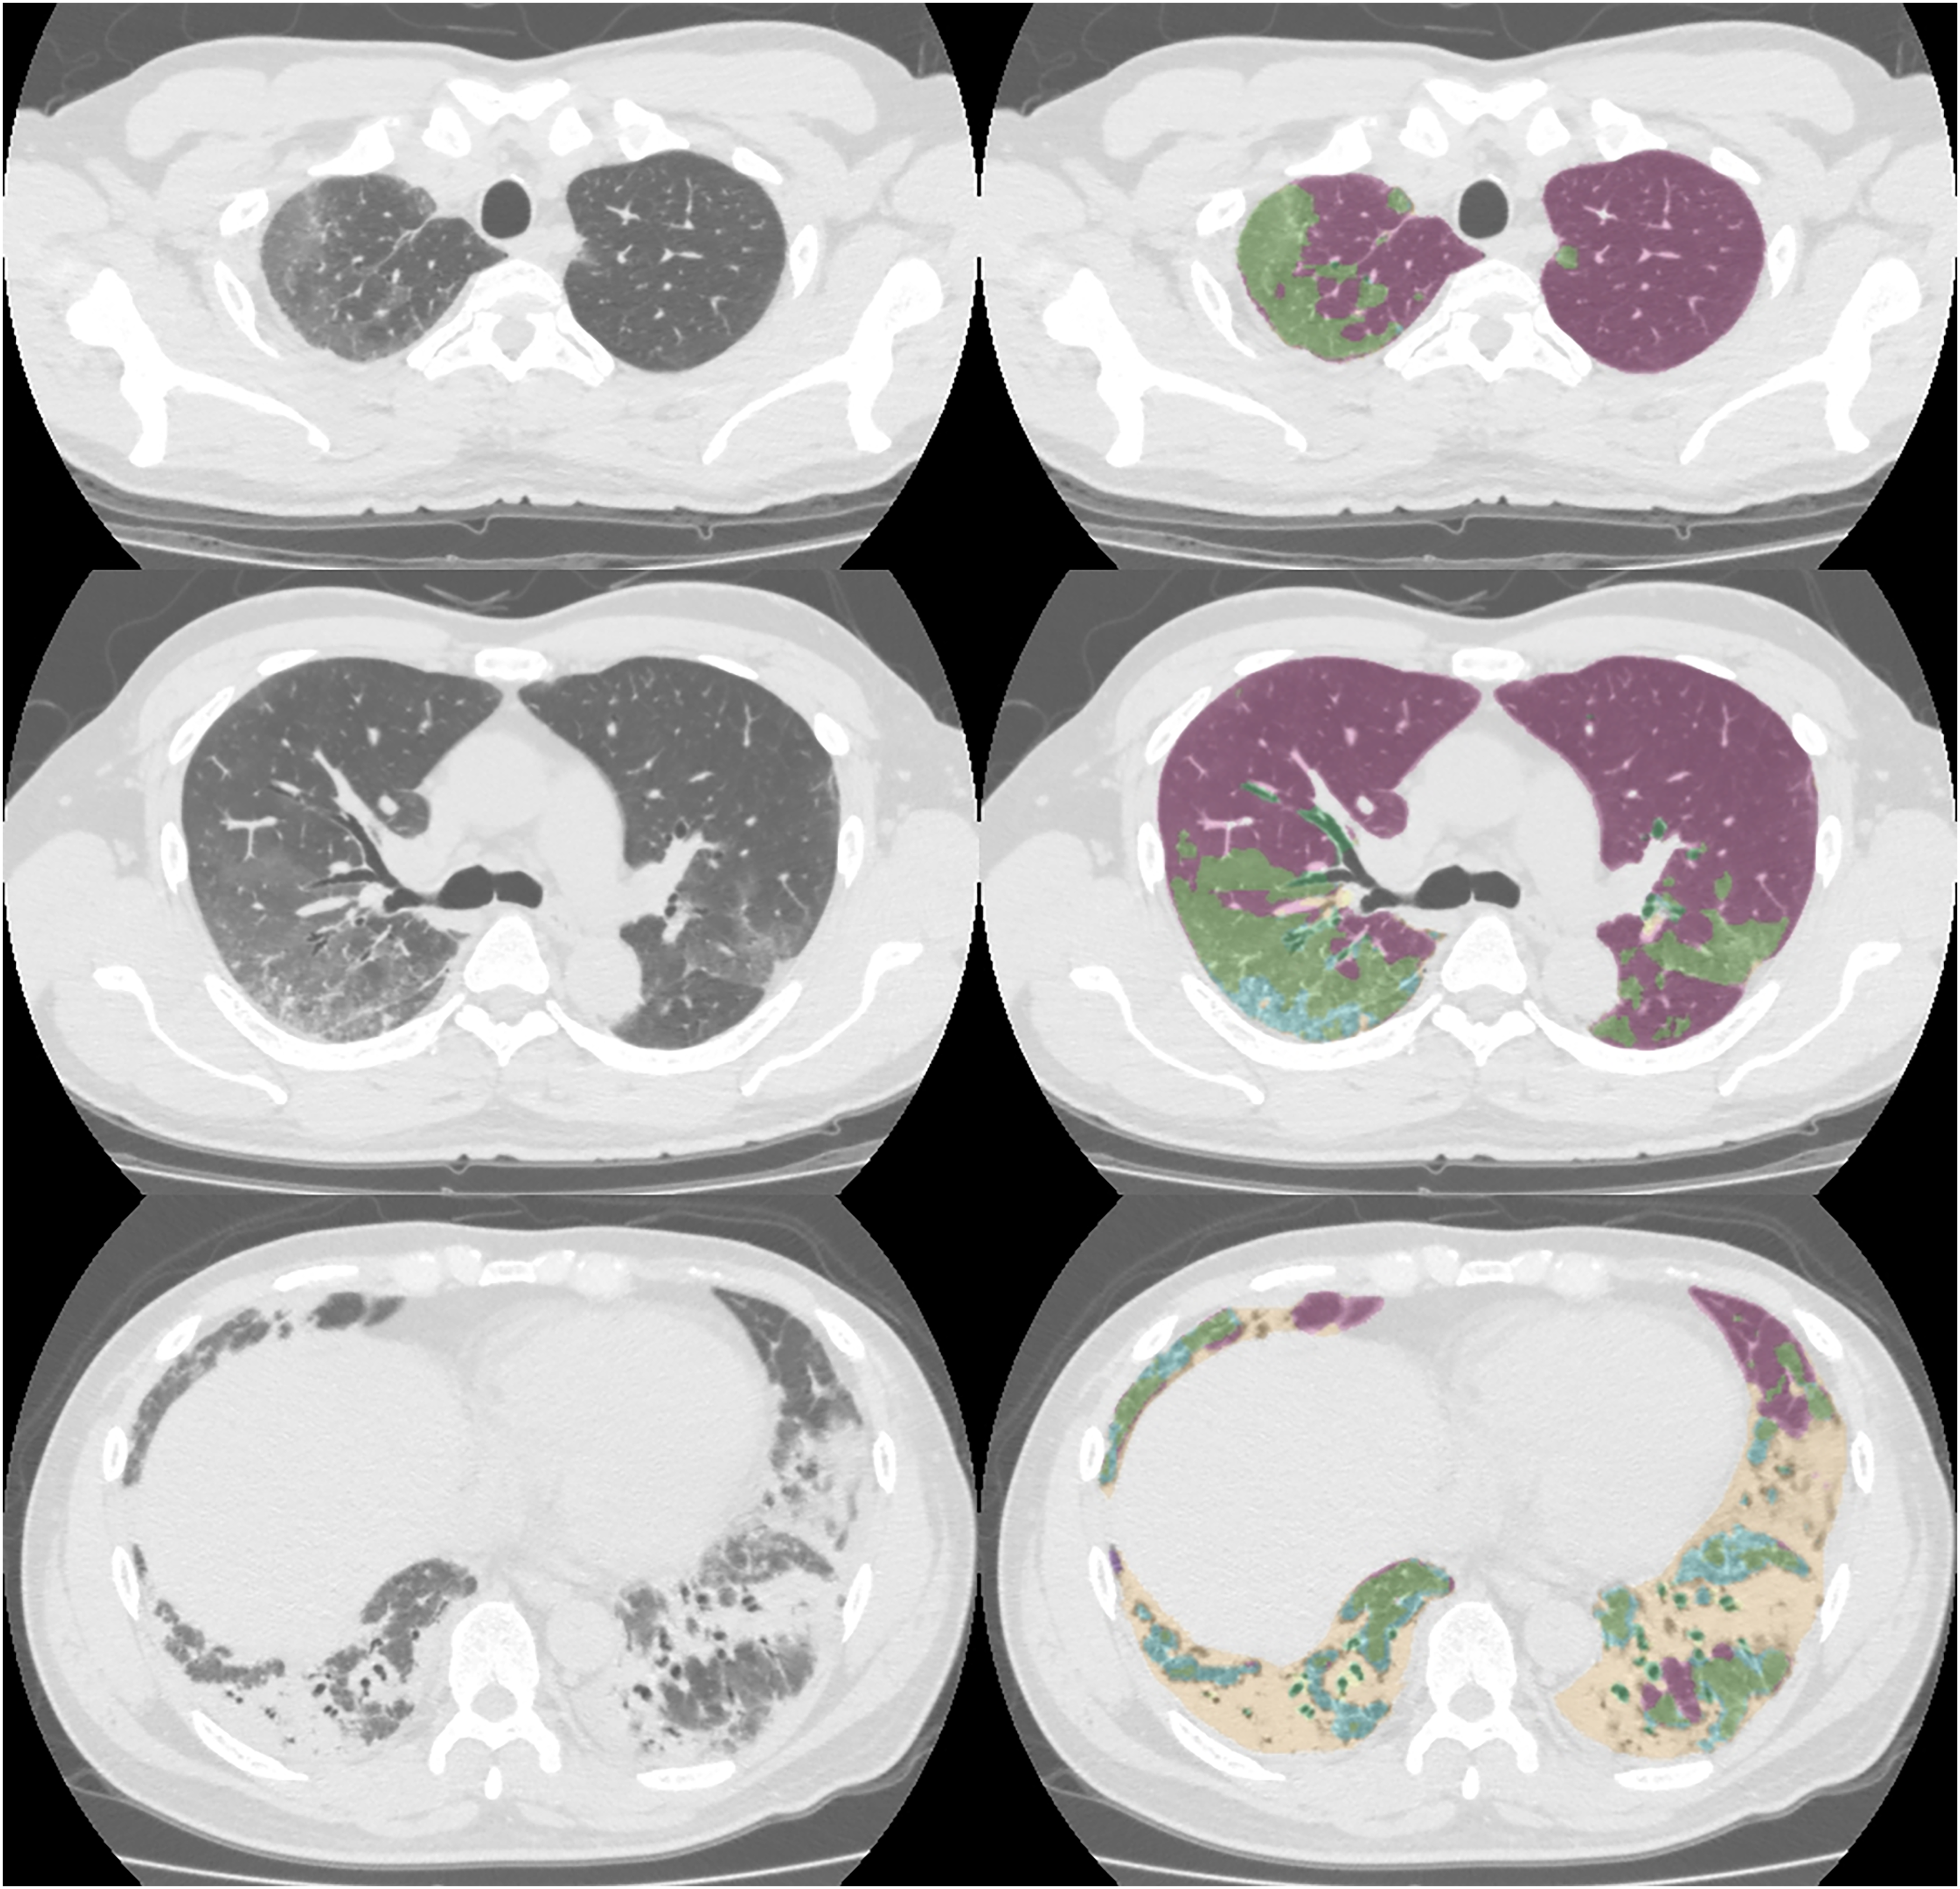
Images of a 56-year-old man with anti-ARS-ILD. Pre-treatment CT images and DL analysis image. For the DL-based analysis image, violet = normal, light green = GGO, yellow = consolidation, light blue = reticulation, and dark green = traction bronchiectasis. Anti-ARS-ILD, anti-aminoacyl-tRNA synthetase syndrome; CT, computed tomography; DL, deep learning; GGO, ground-glass opacity.
Relationship of baseline CT and disease improvement after initial treatment
We compared the differences in the quantitative values of patient characteristics (age, sex, and FVC%) and pre-treatment CT lesion extent in the whole lung, upper and middle lobes, and lower lobes between the responder and non-responder groups for initial treatment.
Chronological evaluation in the long-term follow-up
The lesion volumes before treatment, after the initial treatment, and after long-term follow-up were compared. We also compared the FVC and mean CT values of the normal area before treatment, after treatment, and after long-term follow-up. Quantitative pre-treatment, post-treatment, and post-long-term follow-up data for the whole lung, upper and middle lobes, and lower lobes are presented as box-and-whisker plots.
Statistical analysis
All numerical data are reported as mean ± standard deviation (SD) values. SPSS Statistics version 26 (IBM Corp., Armonk, NY, USA) was used for the statistical analyses.
Continuous variables between the responder and non-responder groups were compared using the Mann–Whitney U test. Categorical variables were analyzed using the chi-square test. Univariate and multivariate logistic regression analyses were used to determine which clinical characteristics and CT imaging findings were useful to predict initial treatment response and PPF. Variables with P values <0.05 by univariate logistic regression analysis were chosen as the variables for multivariate logistic regression analysis. The statistical differences between pre-and post-treatment and post-treatment and long-term follow-up data were tested using the paired t-test. Statistical significance was set at P < 0.05.
Results
Relationship of baseline CT and initial treatment response
Table 2 shows the quantitative evaluation results for the two groups according to disease improvement after the initial treatment, i.e. the responder and non-responder groups. Of the 68 patients, 66 underwent steroid-based treatment. Four patients were treated with antifibrotic agents (two in combination with steroids and two with antifibrotic agents alone). Of these four patients, one was in the responder group and three were in the non-responder group. There were no significant differences between the responder and non-responder groups with regard to antifibrotic agent therapy (P = 0.223). There were no significant differences between the responder and non-responder groups in terms of the interval between pre-treatment and post-treatment CT (11.7 ± 5.4 and 12.4 ± 7.5 months, respectively; P = 0.933) or between pre-treatment and long-term follow-up CT (77.6 ± 7.7 and 85.5 ± 19.5 months, respectively; P = 0.328). In both groups, CT imaging findings showed GGO, consolidation, and fibrotic lesions with a predominant distribution in the lower lobes. The pre-treatment FVC% was significantly lower in patients in the responder group than those in the non-responder group. Consolidation was significantly more extensive in the responder group, particularly in the bilateral lower lobes. There were no significant differences in age, sex, normal area, or other lesion CT patterns between the two groups.
Quantitative pre-treatment CT data for the responder and non-responder groups.
Values are given as n or mean ± SD. Quantitative lung values are indicated as a percentage of whole-lung volume.
CT, computed tomography; DM, dermatomyositis; FVC, forced vital capacity; GGO, ground-glass opacity; HU, Hounsfield unit; PM, polymyositis; SD, standard deviation.
A univariate logistic regression analysis including patient characteristics and each lesion extent in the whole lung revealed that disease duration (odds ratio [OR] = 0.904, 95% confidence interval [CI] = 0.831–0.984; P = 0.02), FVC% (OR = 0.967, 95% CI = 0.935–0.999; P = 0.045), and consolidation (OR = 1.164, 95% CI = 1.013–1.337; P = 0.032) were significant predictors of treatment response. A multivariate logistic regression analysis, encompassing the aforementioned three factors, demonstrated that disease duration (OR = 0.912, 95% CI = 0.844–0.986; P = 0.02) emerged as the sole predictor of treatment response, although FVC% (OR = 0.963, 95% CI = 0.918–1.01; P = 0.121) and consolidation (OR = 1.11, 95% CI = 0.902–1.367; P = 0.325) were not significant.
Chronological evaluation from pre- and post-treatment to long-term follow-up
There was no significant difference between the responder and non-responder groups in terms of the interval between post-treatment and long-term follow-up CT (64.5 ± 5.5 and 65.9 ± 6.0 months, respectively; P = 0.583). Fig. 3 shows box-and-whisker plots of the quantitative values in the chronological course (pre-treatment, post-treatment, and long-term follow-up) for the entire lung, normal lung, and disease patterns, i.e. GGO, consolidation, emphysema, and fibrotic lesion. Supplementary Figs. S1 and S2 show box-and-whisker plots of the quantitative values in the upper + middle lobes and lower lobes, respectively.
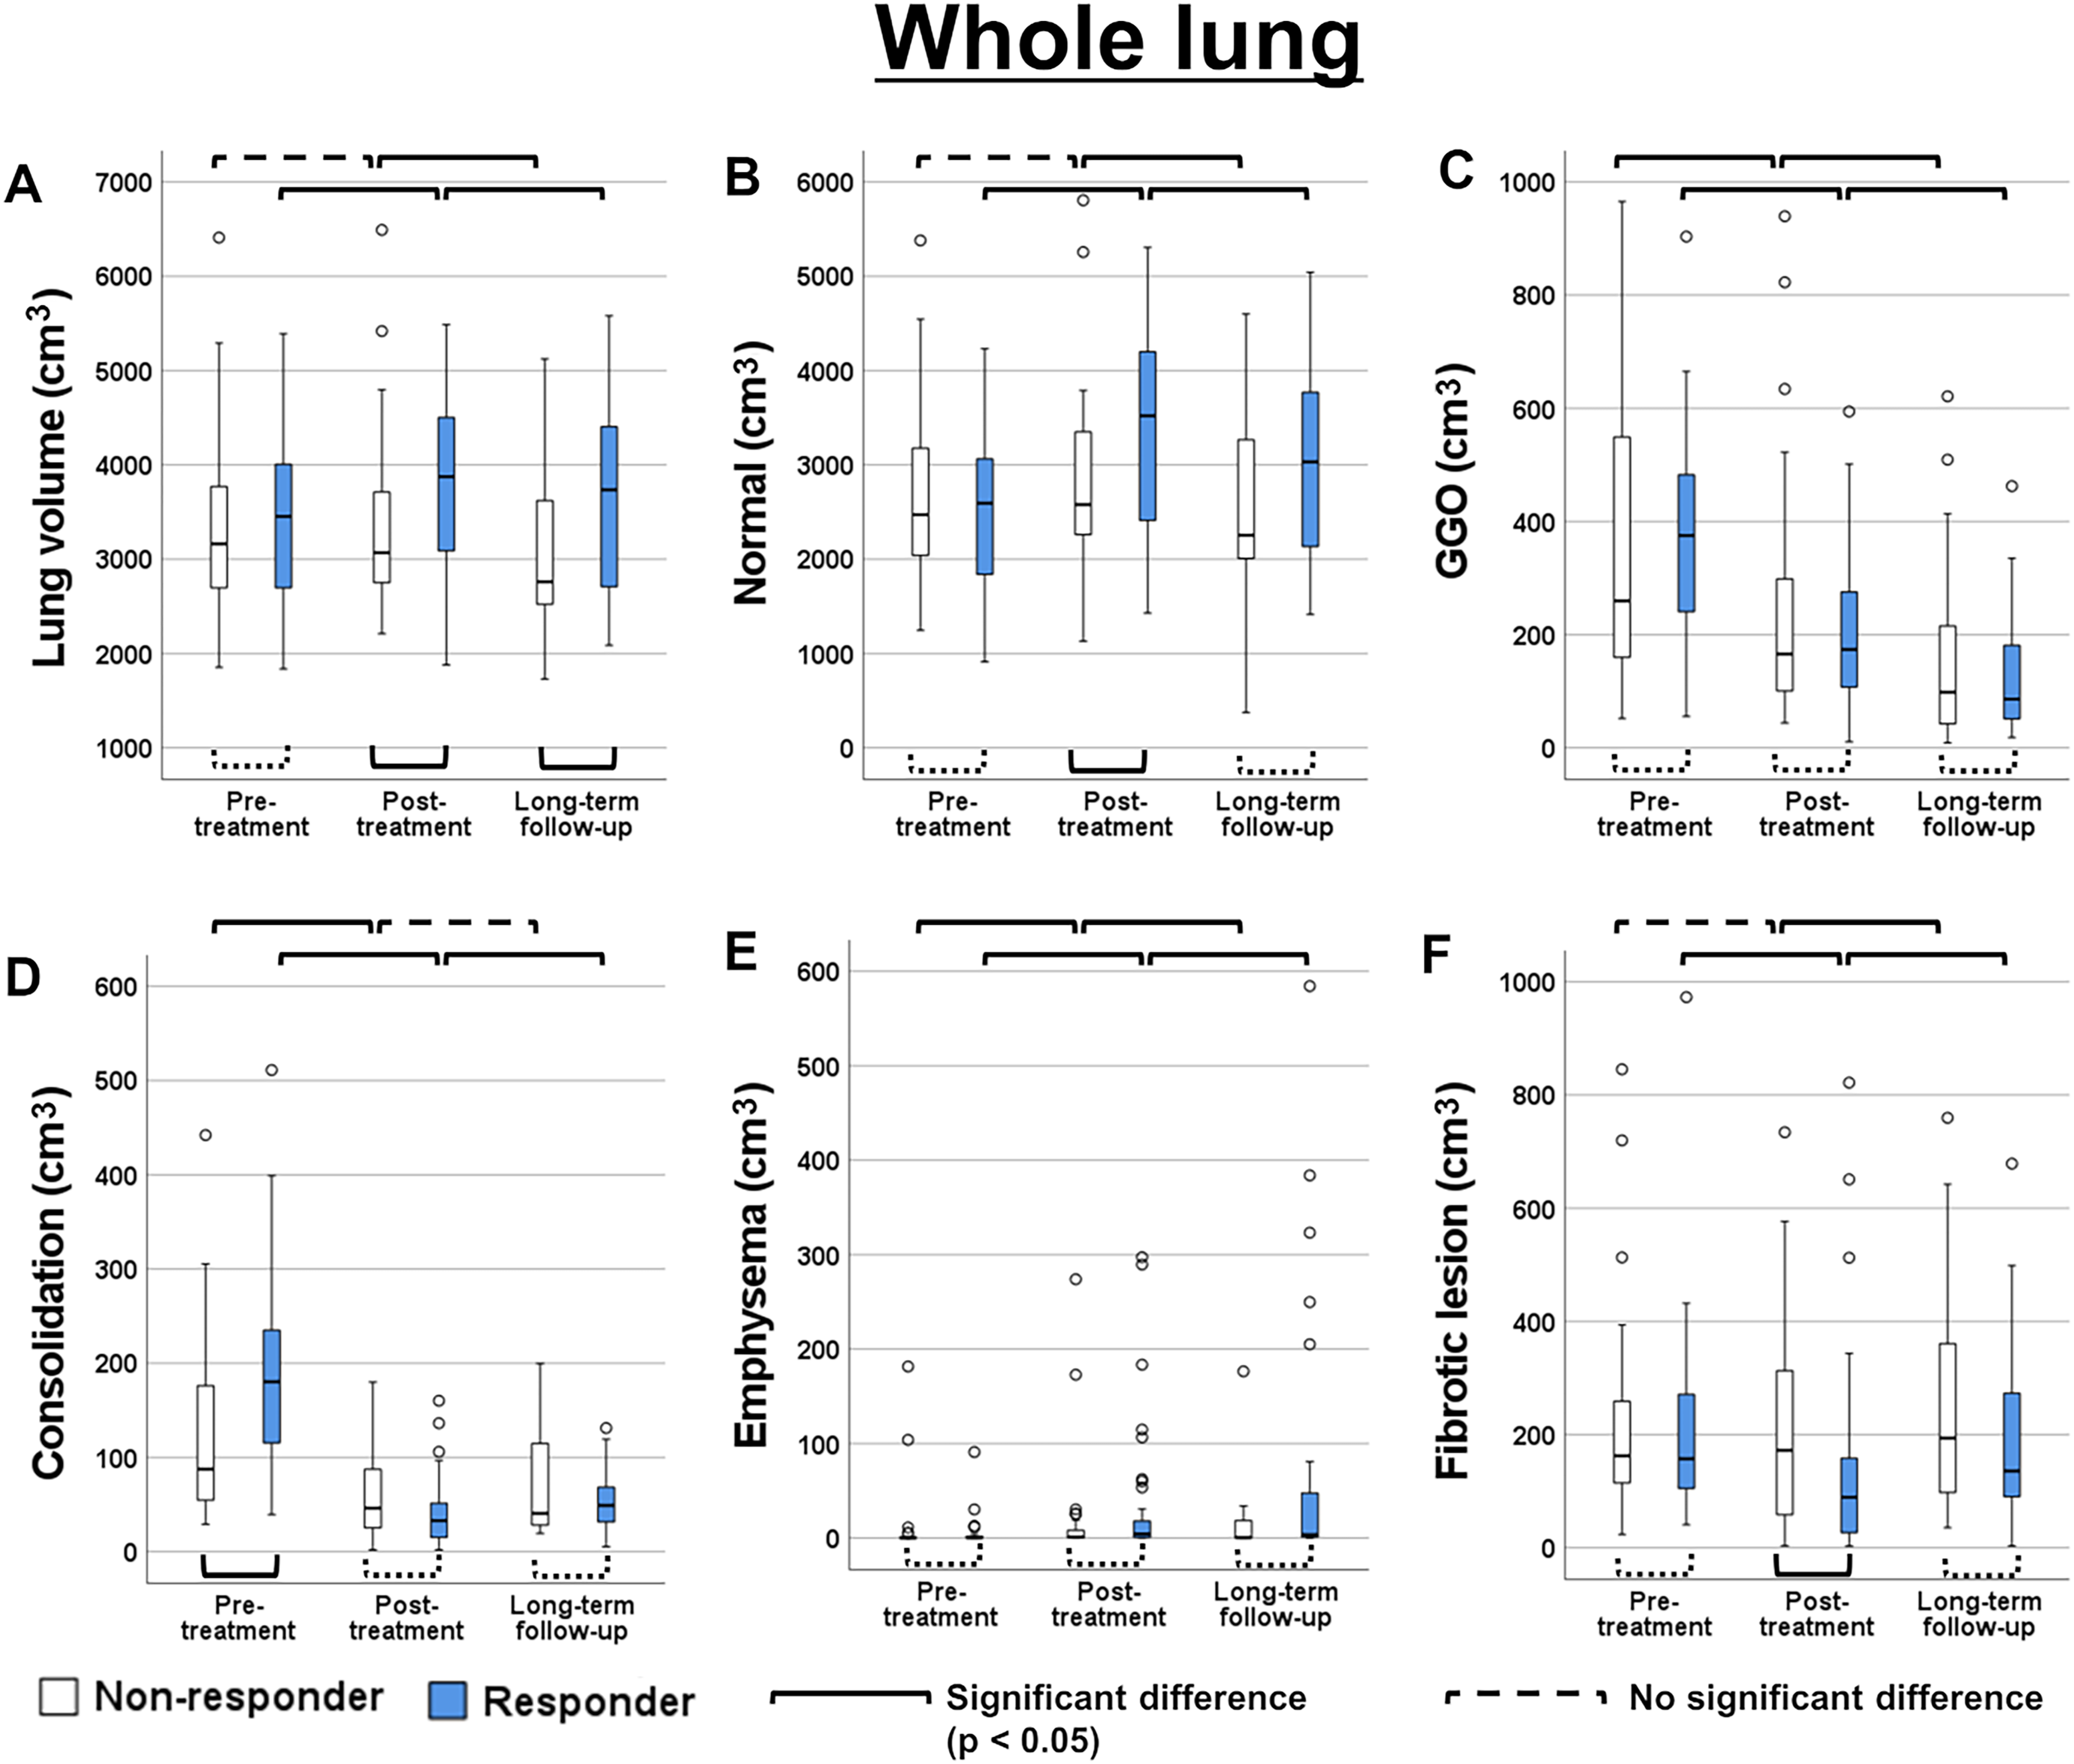
(a–f) Box-and-whisker plots of lesion volumes in the responder and non-responder groups. Before treatment, after treatment, and after long-term follow-up quantitative values are shown. The unit of measurement is cubic centimeter.
Pre-treatment CT showed no significant difference in total lung volume between the responder and non-responder groups (Fig. 3a). Initial post-treatment CT showed that total lung volume in the responder group was significantly increased, but no such significant change on post-treatment CT was observed in the non-responder group (Fig. 3a). In the follow-up CT after initial treatment and long-term follow-up CT, the total lung volume was significantly higher in the responder group than that in the non-responder group (P = 0.015 for post-initial-treatment CT and P = 0.036 for long-term follow-up CT) (Fig. 3a).
Normal lung volume was significantly increased in the responder group, and it was significantly higher in the responder group than in the non-responder group (P = 0.024) at initial post-treatment CT (Fig. 3b). Consolidation volume at pre-treatment CT was significantly higher in the responder group than in the non-responder group (Fig. 3d). After the initial treatment, consolidation volume was significantly decreased in both groups compared with pre-treatment CT, and there was no significant difference between the two groups after the treatment (Fig. 3d). Regarding fibrotic lesions, the volume was significantly higher in the non-responder group than in the responder group at post-treatment CT (P = 0.037), but the difference was not significant at the long-term follow-up CT (Fig. 3f). Furthermore, a significant increase in fibrotic lesion volume was observed between post-treatment and long-term follow-up in both groups.
GGO was significantly decreased in the chronological course (Fig. 3c). On the other hand, emphysema volume was significantly increased in the chronological course (Fig. 3e). GGO and emphysema volume were not significantly different between the responder and non-responder groups (Fig. 3c, e).
The mean CT value of the normal area significantly decreased after the initial treatment, but there was no significant difference between the post-initial-treatment and long-term follow-up CT scans (Fig. 4).
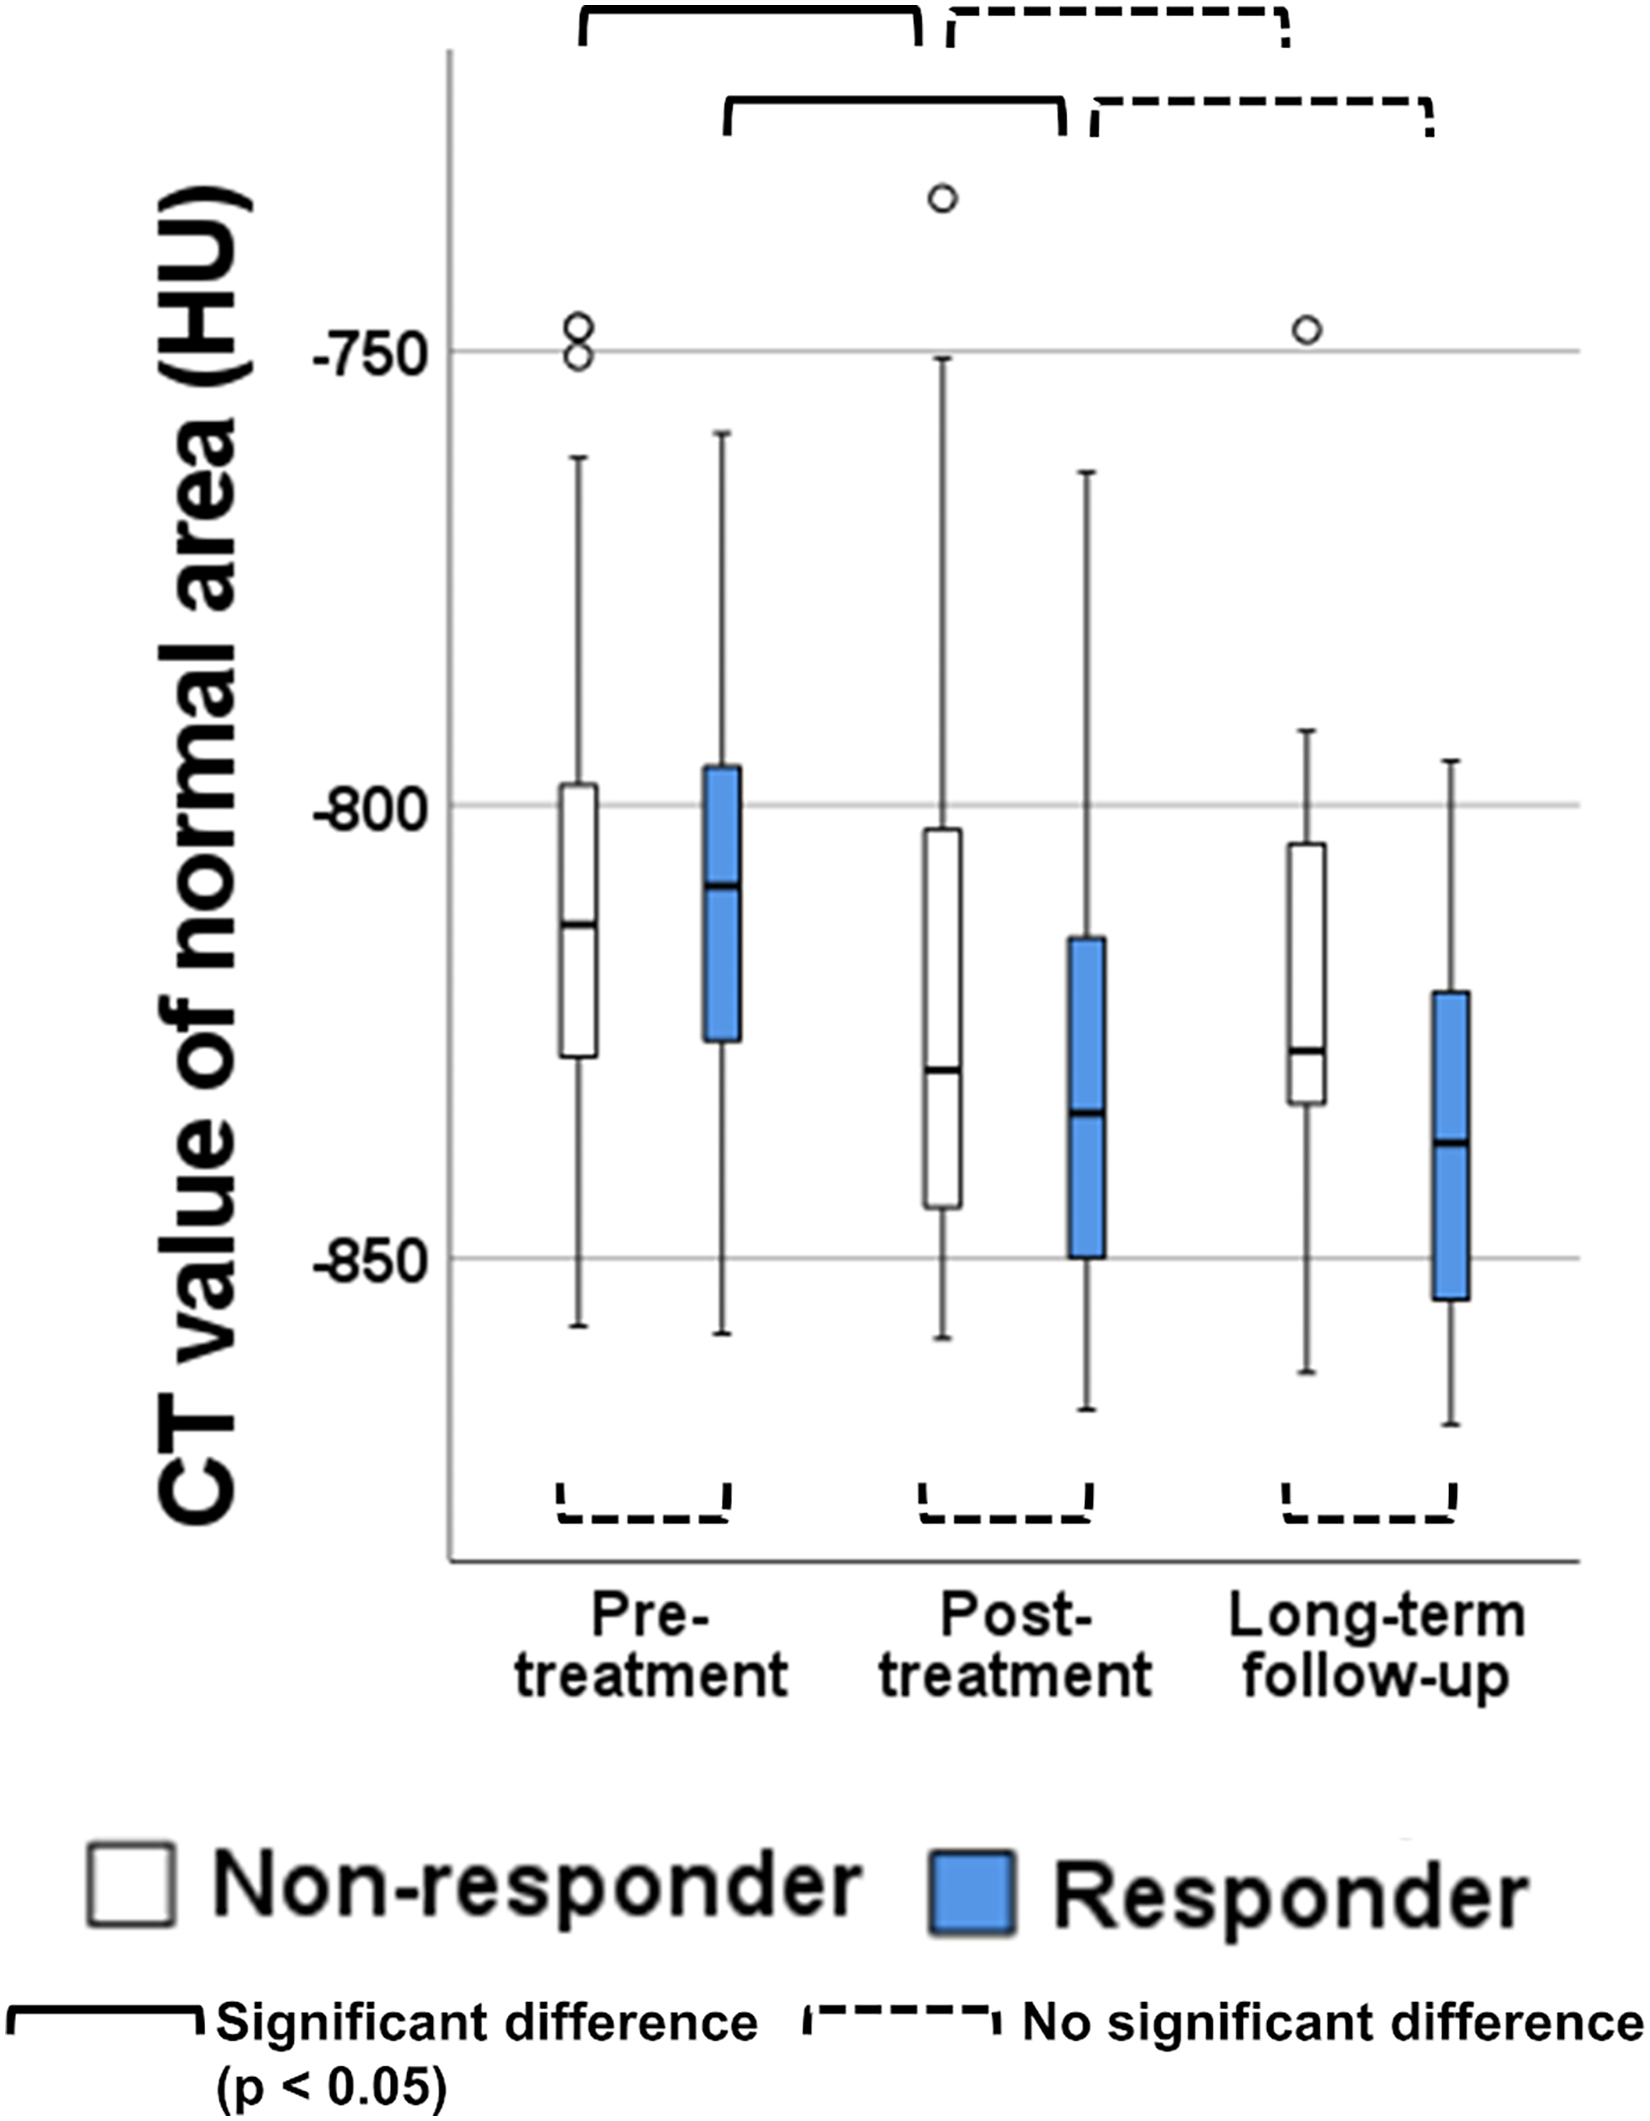
Box-and-whiskers plot of the mean CT value of normal area in the responder and non-responder groups. Before treatment, after treatment, and after long-term follow-up quantitative values are shown. The unit of measurement is the Hounsfield unit.
Among the 26 initial responders, 6 (23.1%) met the definition of PPF in the long-term follow-up. Among the 17 patients in the non-responder group, 8 (47.1%) met the definition of PPF. The prevalence of PPF was slightly higher in the non-responder group, although this difference was not statistically significant (P = 0.135).
Univariate logistic regression analysis, incorporating patient characteristics and pre-treatment CT quantitative values, indicated that there were no significant predictors of PPF. Fig. 5 shows representative pre-treatment, post-treatment, and long-term follow-up period CT images.
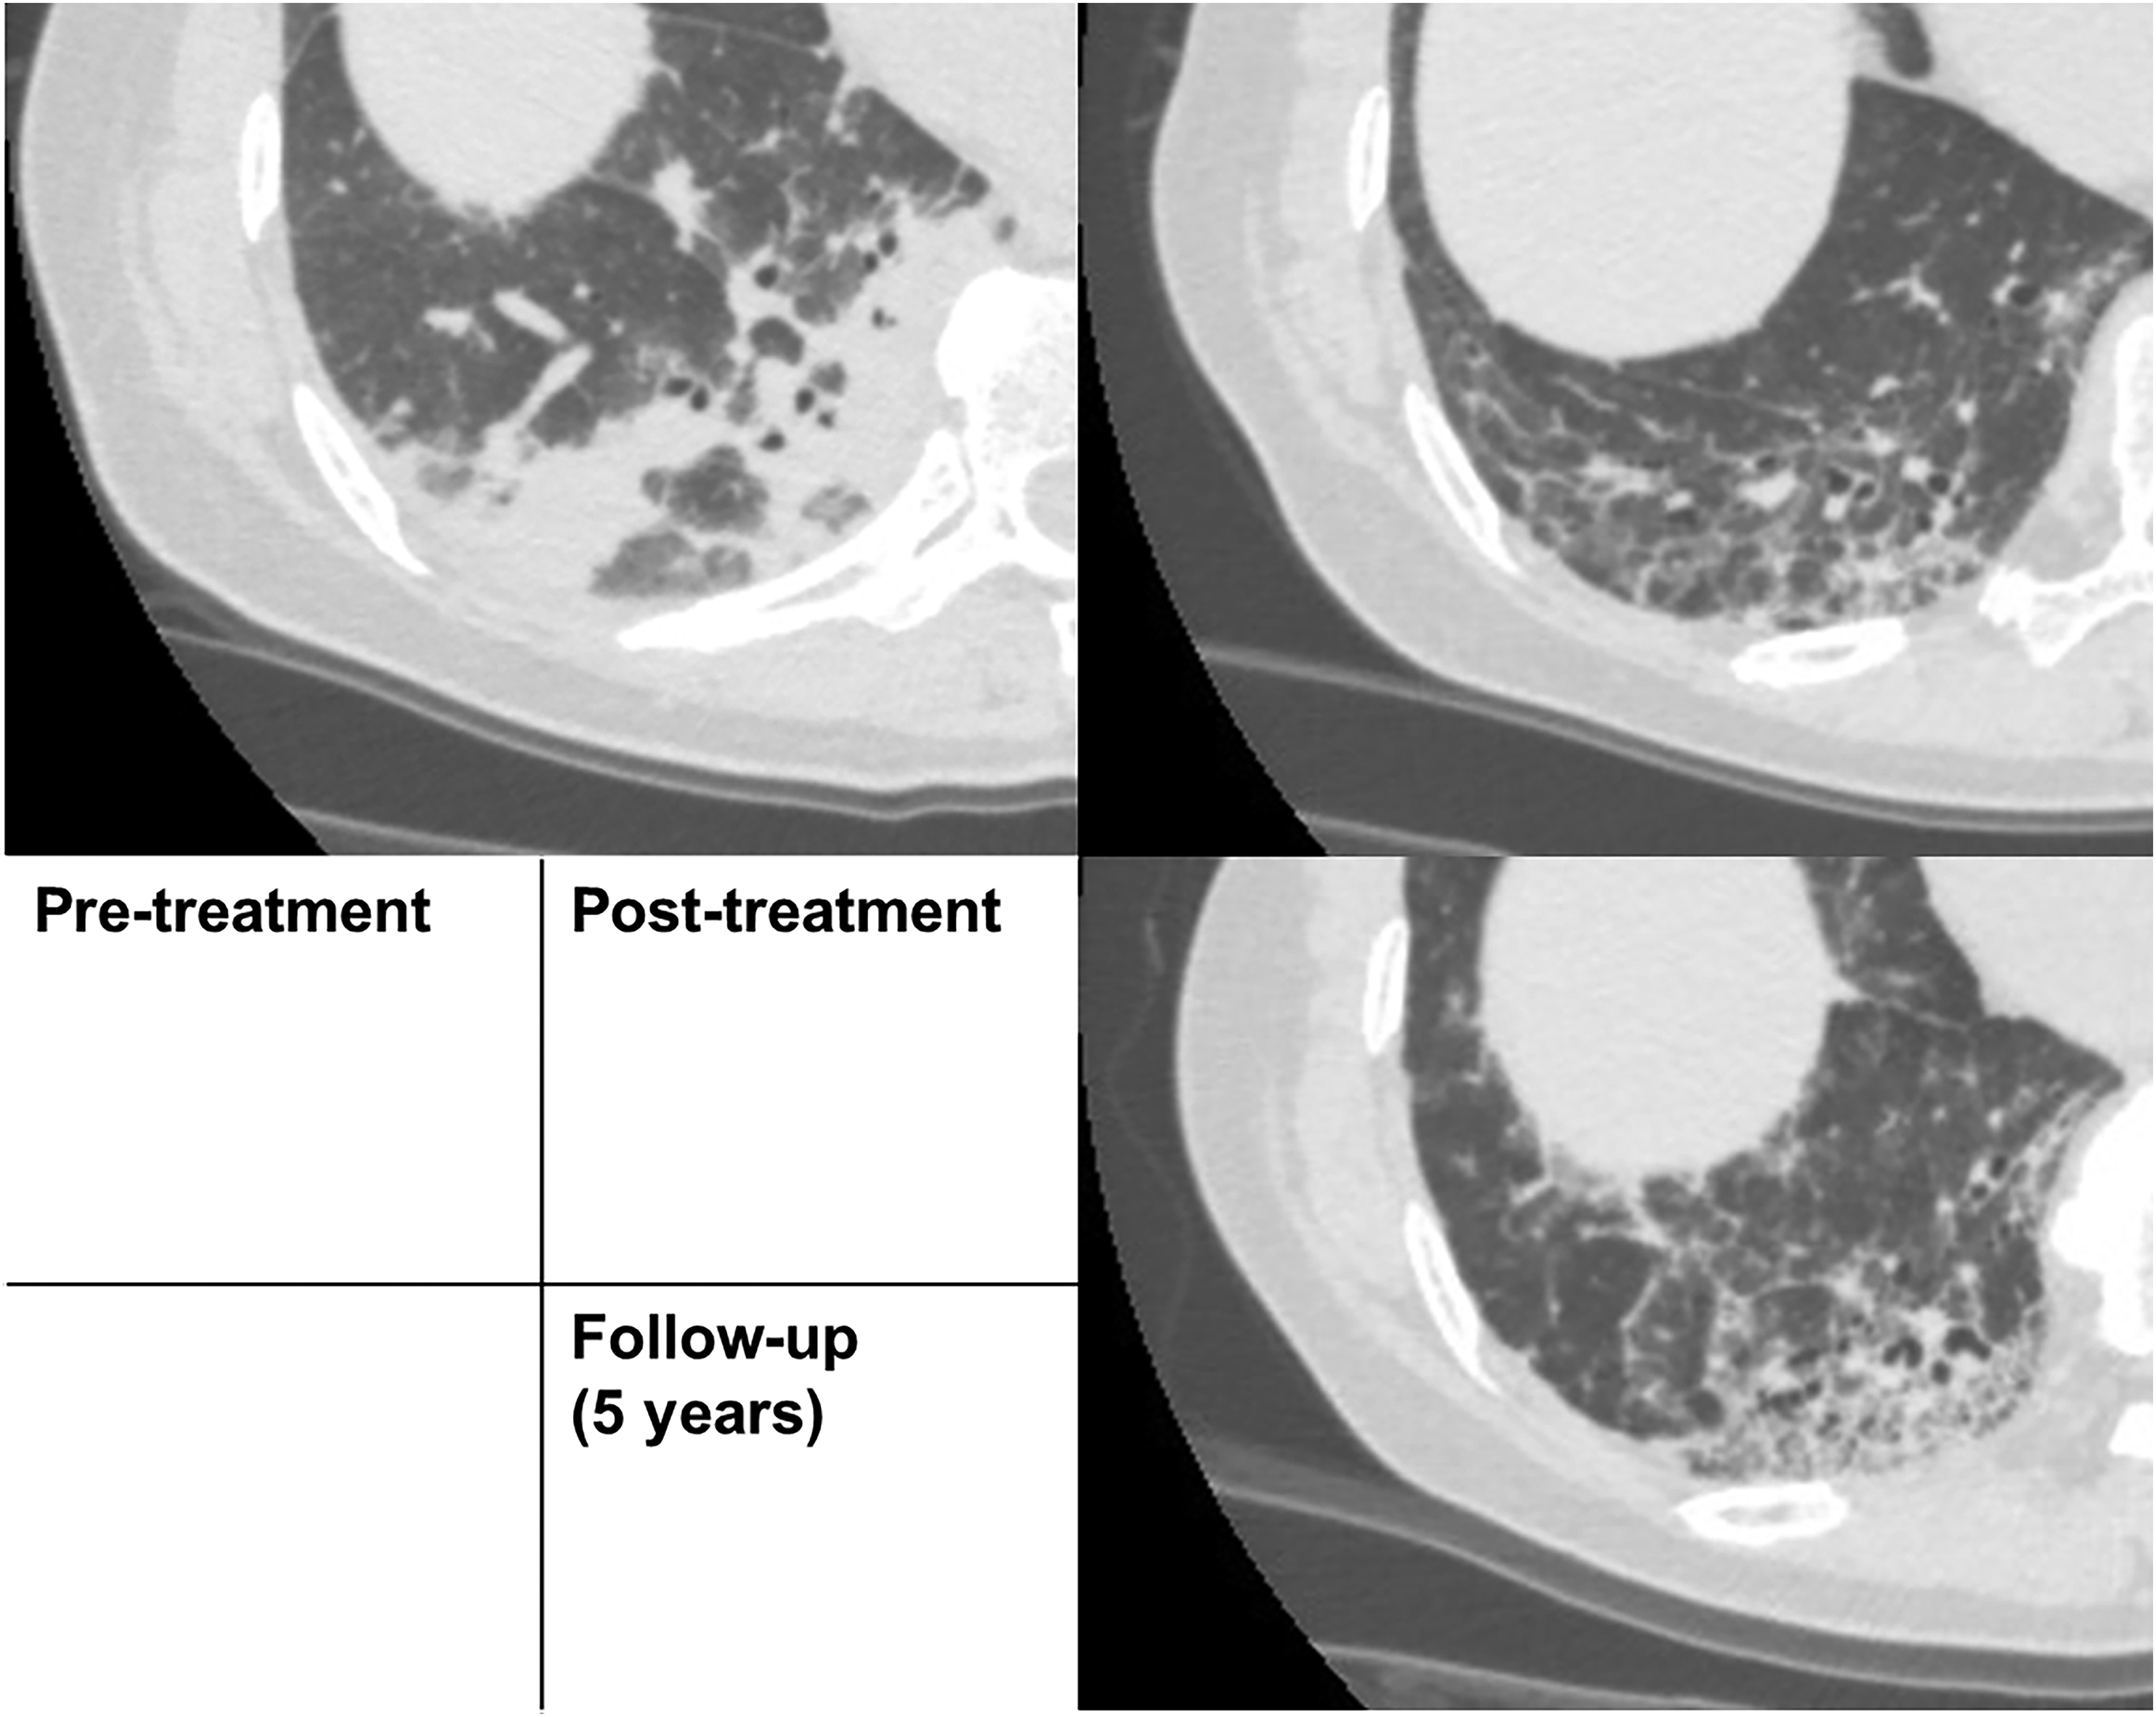
Images of a 62-year-old woman (at the time of pre-treatment CT) with anti-ARS-ILD in the responder group. Pre-treatment CT shows extensive consolidation in the lower lobe. Post-treatment CT shows that consolidation has improved; however, reticulation and GGO remain and increased after long-term follow-up along with lung volume loss and traction bronchiectasis. Anti-ARS-ILD, anti-aminoacyl-tRNA synthetase syndrome; CT, computed tomography; GGO, ground-glass opacity.
Discussion
This study quantitatively evaluated the chronological course of baseline, post-treatment, and long-term follow-up CT in patients with anti-ARS-ILD to clarify the treatment response and long-term course. Baseline CT findings showed GGO, consolidation, and fibrotic lesions with a predominant distribution in the lower lobes. Our results revealed that the initial responder group (FVC improvement of 10% or more) had a larger volume of consolidation in the lower lobes on baseline CT. Consolidation and GGO volumes significantly decreased after initial treatment in both groups. In contrast, the whole lung and normal lung volumes increased in the initial responder group alone and did not significantly change in the non-responder group. At the long-term follow-up, fibrotic lesions significantly increased in both groups.
Anti-ARS ILD showed GGO, consolidation, and fibrotic lesion with lower lobe predominance, as previously described (12,13). We demonstrated that consolidation, shown as a lower lobe predominance, was a factor in treatment responsiveness. Consolidation in Anti-ARS-ILD means a histopathological pattern, such as non-specific interstitial pneumonia and organizing pneumonia (13,14). These histopathological patterns have responded well to the treatment (5,15), consistent with our study. The consolidation volume was also significantly reduced in the non-responder group; however, no increase in the total lung volume was observed. Considering that the disease duration was significantly shorter in the responder group, consolidation on pre-treatment CT in the responder group might reflect acute and subacute ILD lesions with larger components of edema and active inflammation than those in the non-responder group, resulting in better response to steroid-based treatment. We consider that irreversible fibrotic changes can occur within the consolidation area in the non-responder group (16,17), and a decrease in lung volume in the consolidation area after treatment may hinder FVC improvement. Anti-ARS ILDs have been reported to deteriorate respiratory function over time (18), and this study provides quantitative evidence of progressive CT imaging features over time. Notably, even among patients who initially responded to treatment, an increase in fibrotic lesions was observed during long-term follow-up, which highlights the need for careful monitoring regardless of treatment responsiveness.
The increased emphysema pattern volume and decreased mean CT value in the normal area observed in this study may suggest overexpansion of existing alveoli. Conventionally, compensatory lung growth is known to occur in the residual lung lobes after lobectomy (19,20), which indicates an increase in the number of alveoli and overexpansion of existing alveoli, contributing to improved respiratory function (19). We believe that similar alveolar changes may occur in ILD as in the residual lung after lobectomy, with increased emphysema pattern volume and decreased mean CT value of the normal area indicating compensatory overexpansion of the normal area due to the decreased lung volume of ILD lesions. In addition, overexpansion of the normal area may compensate for the decreased FVC. Interestingly, the responder and non-responder groups showed a significant increase in the emphysema pattern volume after the initial treatment. Even in patients with visually resolved consolidation and increased whole-lung volume, quantitative evaluation of each lung lobe may suggest volume loss in the lesion area and overexpansion of the normal area seen in the background (Fig. 6) (21). In our DL analysis model, the normal lung and emphysema regions were classified as different characteristics, although it was considered that the increase or decrease in the emphysema pattern did not have substantive importance for the ILD severity and it might not be so useful to evaluate emphysema and normal areas separately in this study. On the other hand, the increased emphysema pattern might potentially be important information because it suggested the compensatory overexpansion of non-lesion areas of ILD due to the residual serious fibrosis after the treatment.
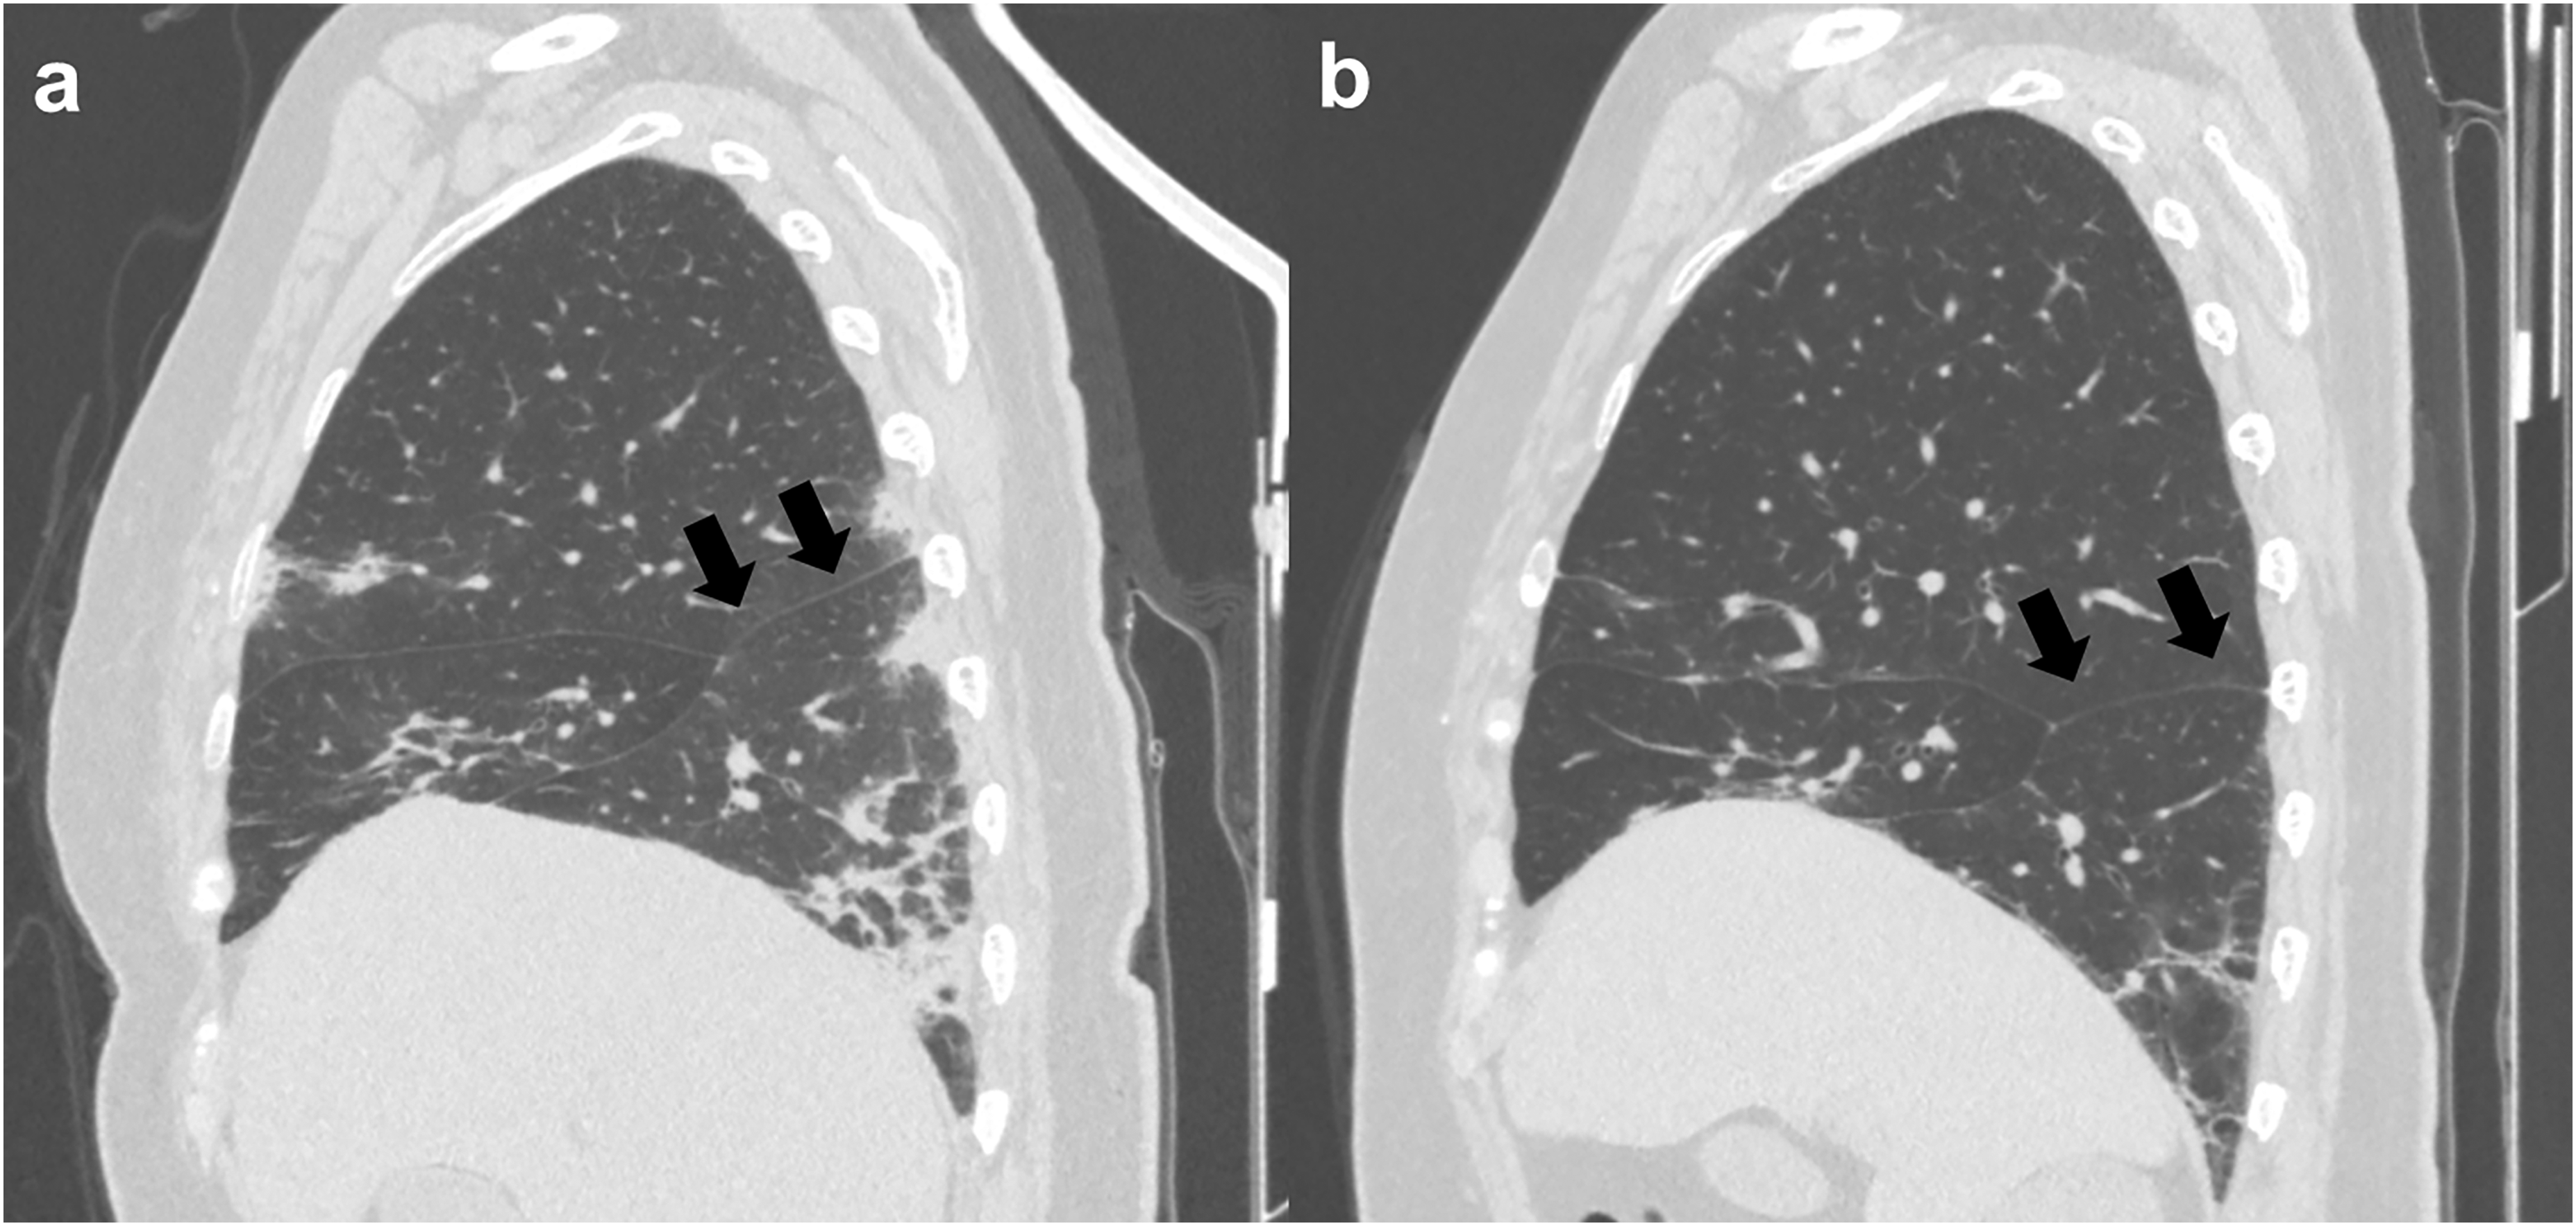
Images of a 71-year-old woman with anti-ARS-ILD in the non-responder group. (a) Pre-treatment and (b) post-treatment sagittal CT images of the right lung. The consolidation observed on pre-treatment CT decreased and upper lobe volume increased after treatment. On the other hand, lower lobe volume decreased and the major fissure was contracted downwards (arrows). DL lung analysis revealed that lower lobe volume decreased (from 409.3 cm3 to 377.8 cm3); however, upper lobe and middle lobe volume increased (from 800.6 cm3 to 994.6 cm3 and 216.1 cm3 to 224.3 cm3, respectively). Anti-ARS-ILD, anti-aminoacyl-tRNA synthetase syndrome; CT, computed tomography; DL, deep learning.
The present study has some limitations. First, the results were obtained from a few patients recruited from a single center. Furthermore, all patients did not undergo long-term follow-up; therefore, it is possible that some of the patients who withdrew did not develop fibrosis. Second, we assessed several types of anti-ARS antibodies in this study, but did not evaluate the imaging features of the DL analysis for specific antibodies. Third, an increased emphysema pattern does not necessarily indicate the destruction of the alveolar walls. The emphysema pattern defined by the DL software used in this study included areas that appeared to be visually in the normal range but had excessively decreased CT values.
In conclusion, disease duration and baseline extent of consolidation are important for predicting the initial treatment response in the anti-ARS-ILD patients. Nevertheless, during the long-term follow-up, anti-ARS ILD was associated with chronological progression, regardless of initial treatment efficacy.
Supplemental Material
sj-docx-1-acr-10.1177_02841851241281492 - Supplemental material for Interstitial lung disease associated with anti-aminoacyl-tRNA synthetase syndrome: quantitative evaluation of CT after initial treatment and long-term follow-up
Supplemental material, sj-docx-1-acr-10.1177_02841851241281492 for Interstitial lung disease associated with anti-aminoacyl-tRNA synthetase syndrome: quantitative evaluation of CT after initial treatment and long-term follow-up by Ryo Aoki, Tae Iwasawa, Daisuke Utsunomiya, Hideaki Yamakawa, Hideya Kitamura, Tomohisa Baba and Takashi Ogura in Acta Radiologica
Footnotes
Declaration of conflicting interests
The authors declared the following potential conflicts of interest with respect to the research, authorship, and/or publication of this article: TI was provided with the software that was used in this study (Quantification by Ziosoft Informatics Platform for Interstitial Lung Disease [QZIP-ILD]) by Ziosoft, Tokyo, Japan.
Funding
The authors received no financial support for the research, authorship, and/or publication of this article.
Supplementary material
Supplementary material for this article is available online.
References
Supplementary Material
Please find the following supplemental material available below.
For Open Access articles published under a Creative Commons License, all supplemental material carries the same license as the article it is associated with.
For non-Open Access articles published, all supplemental material carries a non-exclusive license, and permission requests for re-use of supplemental material or any part of supplemental material shall be sent directly to the copyright owner as specified in the copyright notice associated with the article.