
Abstract
Background
Magnetic resonance imaging (MRI) is effective in diagnosing deltoid ligament (DL) injury but its sensitivity in chronic cases is low. Additional diagnostic signs are required to reduce the risk of a false negative diagnosis.
Purpose
To evaluate the added diagnostic value of bone marrow edema at the ligament insertion (BMELI) of DL to the MRI assessment of chronic DL injury.
Material and Methods
One hundred patients who consecutively came to our institution between November 2018 and December 2021 and underwent arthroscopic surgery for chronic ankle instability (CAI) were enrolled in the present study. Preoperative MR images were retrospectively reviewed by two orthopedic surgeons to evaluate the sensitivity, specificity and interobserver reliability of three MRI signs in diagnosing chronic DL injury, namely, abnormal ligamentous morphological characteristics (ALMC), BMELI and medial clear space (MCS).
Results
Taking arthroscopy as the reference standard, there were 34 patients with and 66 without DL injury. ALMC had 64.71% (22/34; 46.47–79.70) sensitivity and 83.33% (55/66; 71.71–91.00) specificity, BMELI had 70.59% (24/34; 52.33–84.29) sensitivity and 95.45% (63/66; 86.44–98.82) specificity and MCS had 26.47% (9/34; 13.51–44.65) sensitivity and 92.42% (61/66; 82.50–97.18) specificity. Compared with ALMC, BMELI had similar efficacy in superficial cases (P = 0.06) and greater efficacy in deep cases (P = 0.04). All three signs showed good interobserver agreement (kappa values all above 0.7).
Conclusion
BMELI can reliably indicate concomitant injury to the DL in CAI patients. Using BMELI as a sign of chronic DL injury when ALMC is unclear may reduce the risk of a false negative diagnosis.
Keywords
Introduction
The incidence of injury of the medial ankle deltoid ligament (DL) is often underestimated in the clinic (1–4). Magnetic resonance imaging (MRI) offers a useful tool for diagnosing DL rupture (5,6). Identification of abnormal morphological ligamentous characteristics (ALMC) on MRI is the main approach to assessing the location and severity of DL rupture (7,8). Although this method is accurate in acute injuries, it may lack sensitivity in chronic cases because the striation of DL may be lost, making it hard to identify the boundaries or integrity of the DL (9–11). Measuring the medial clear space (MCS) is another method that is used to assess the integrity of DL. However, previous reports of MCS are inconsistent and its reliability remains uncertain (12–14). No other MRI signs have been reported to be of diagnostic value for identifying chronic DL injuries. It has been reported in the previous literature that patients with acute DL injury usually have bone marrow edema of the talus. However, we noticed that bone marrow edema of talus or tibia was also not rare in patients with chronic DL injury in the clinical, and was located at the tibial insertion of superficial DL and talus insertion of deep DL most of the time. To our knowledge, the diagnostic value of this MRI sign in DL injury has not been discussed previously.
In the present study, we identify characteristic MRI signs in chronic DL injury cases to improve the diagnostic accuracy of this condition. Specifically, we aim to evaluate the diagnostic value of bone marrow edema at the ligament insertion (BMELI) of chronic DL injury. We hypothesized that BMELI is a specific diagnostic sign of chronic DL injury.
Material and Methods
The present study was a retrospective diagnostic study conducted on patients presenting to our institution between November 2018 and December 2021 with a chief complaint of chronic ankle instability (CAI) following an ankle injury that occurred at least 3 months prior. All patients who received an MRI of the ankle and subsequently underwent arthroscopic surgery (repair/reconstruction of anterior talofibular ligament or DL or both), performed by a single surgeon with over 20 years of clinical experience, were included in the chart review. Surgical decisions were made by the surgeon based on preoperative imaging results, clinical symptoms and the patient's wishes. Patients were excluded if they had pathological ankle fracture, ankle infections, severe subtalar joint osteoarthritis or a history of previous ankle surgery. The recruitment flowchart is shown in Fig. 1. In clinical work, we recommended conservative treatment for at least 3 months for patients with acute ankle injury if there is no evidence of fracture, and arthroscopic treatment would be performed if they still complained of instability 3 months later and presented to our hospital again. The integrity of the DL was checked using a probe during the arthroscopy, as described by Vega et al. (15,16) Surgical reports were reviewed as the gold standard of DL integrity. With confirmation from the surgeon, any descriptions of a DL “tear”, “rupture” “detachment” or “poor continuity” in the surgical reports were considered to indicate DL injury. The location of the injury (whether superficial or deep) was also recorded. Cases were excluded if the DL assessment was not described in their surgical report.
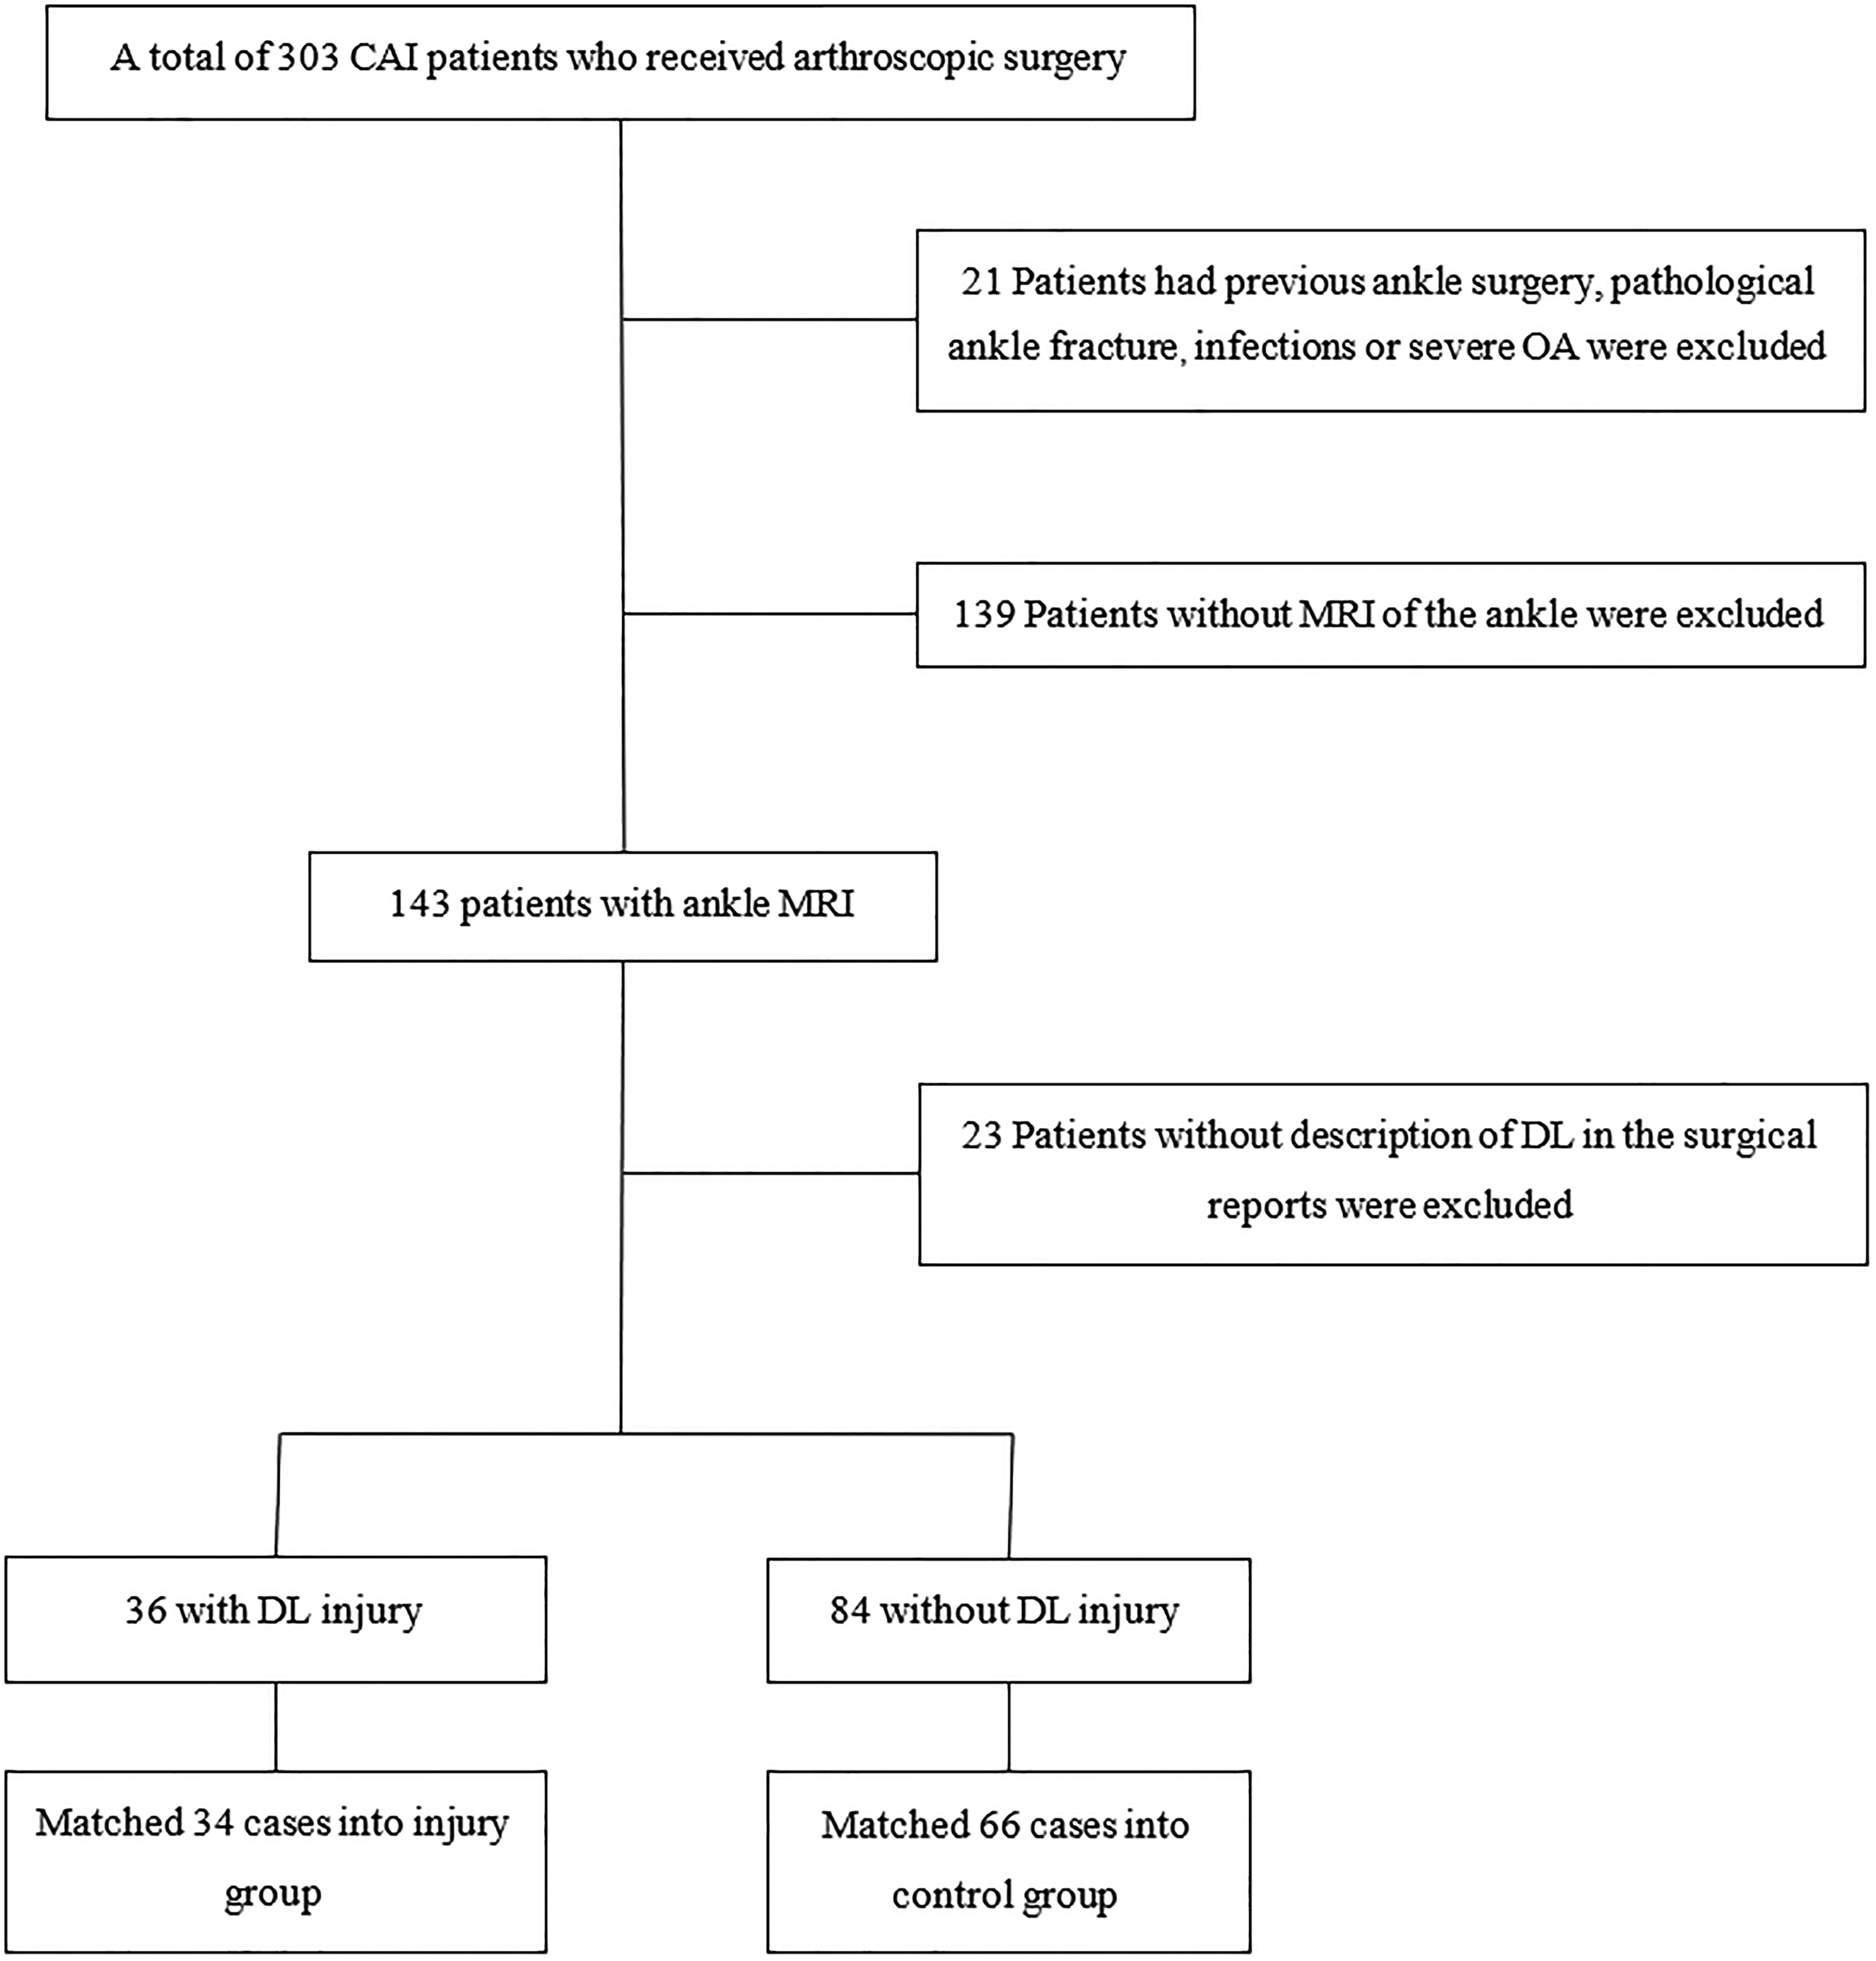
Flowchart diagram of included patients. CAI, chronic ankle instability; OA, osteoarthritis; DL, deltoid ligament; MRI, magnetic resonance imaging.
Propensity score–matched analysis
All CAI patients who underwent arthroscopic surgery in our institution during the study period were recruited, with a total of 303. One hundred and twenty eligible patients were propensity score matched in a 1:2 ratio of injury to control using R, version 3.3.3 (R Foundation for Statistical Computing, Vienna, Austria) to minimize the influence of possible confounding variables. The injury and control groups were matched using a greedy algorithm, without replacement, using a caliper of 0.2 according to the following variables: age, body mass index (BMI) and gender. As a result of matching, 34 patients with a clinical diagnosis of DL injury according to arthroscopic examination comprised the injury group, and 66 patients confirmed to have no DL injury during the arthroscopic examination comprised the control group. The demographic data of the study groups are shown in Table 1. There were no significant differences in terms of age, gender, BMI and time-to-surgery between the two groups.
Demographic data of the study groups.
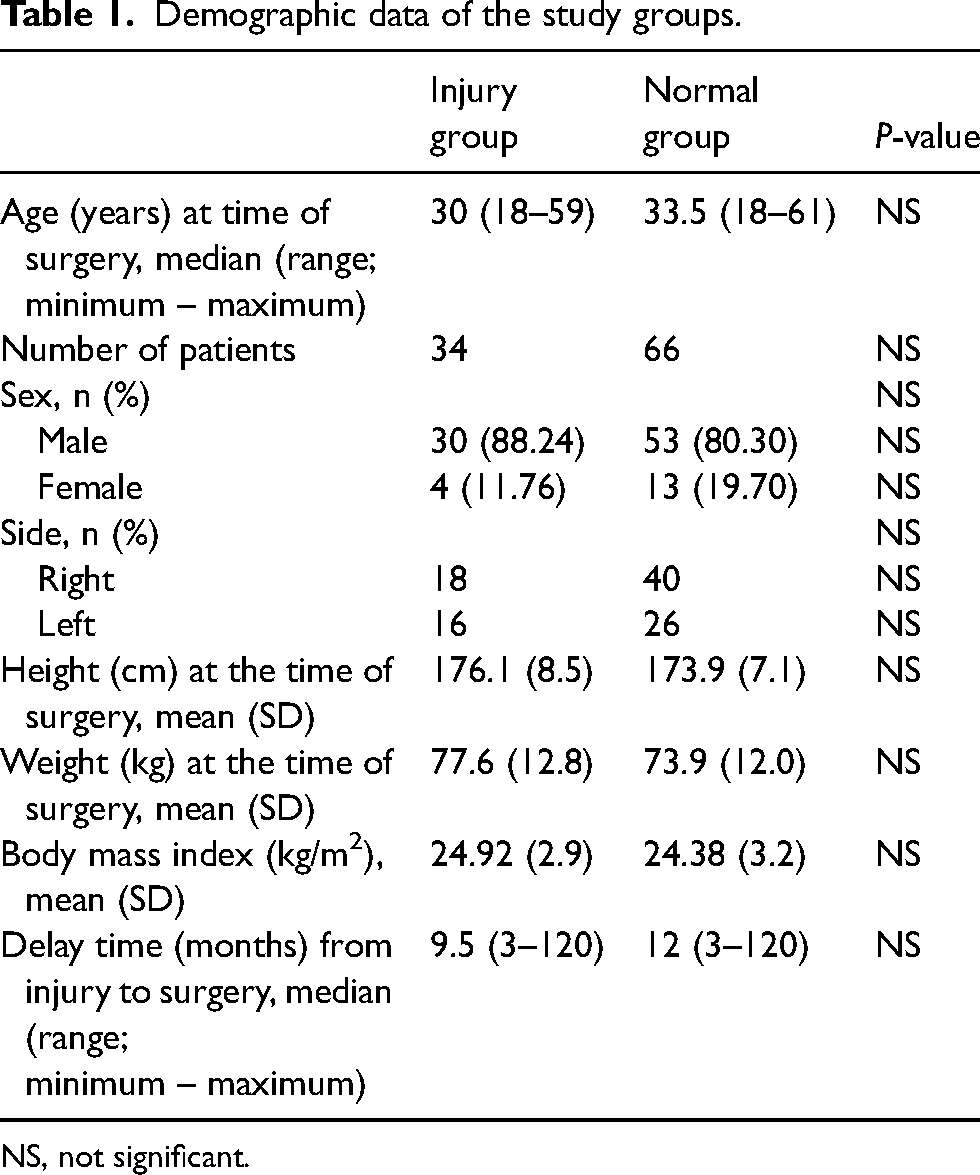
NS, not significant.
MRI scan and image analysis
MRI scans were performed with a 3.0-T MRI scanner (MAGNETOM Verio, A Tim system; Siemens, Munich, Germany) in a standardized fashion. The patient's feet were placed in a neutral position. Coronal and sagittal images were taken at PD FSE TR/TE 2500–3000/30–40 ms, matrix 320 × 320, and slice thickness 3.0–4.0 mm (three images were taken at PD FSE TR/TE 5730/30 ms, matrix 320 × 320, and slice thickness 3.0 mm). Axial images were taken at PD FSE TR/TE 3000–4000/30–75 ms, matrix 320 × 320, and slice thickness 3.0–4.2 mm.
MR images were independently reviewed by two orthopedic surgeons (one with 2 years of experience and the other with 10 years) who were blinded to the results of the arthroscopic examination and the patient history. In cases of disagreement, the final diagnosis was reached by consensus of the two investigators. The following signs were targeted on the MR images. (1) Abnormal ligamentous morphological characteristics (ALMC): the ALMC were divided into three levels: ligament stretching/thickening/striation loss was regarded as grade I injuries, partial tears as grade II and discontinuity/gap/complete disruptions as grade III (Fig. 2). Grade II or III injuries required surgical intervention (17–22). (2) Bone marrow edema at ligament insertion (BMELI): BME, also known as a bone contusion or bone bruise, refers to the alteration of bone marrow signal on MR images, specifically an increase of signal intensity on T2-weighted images and weakened intensity on T1-weighted images (23–25). BME at the insertion site of DL was considered to indicate DL injury (Fig. 3). In our clinical experience, the classification of BME according to the range, signal strength or any other indicators was not helpful in judging the severity of ligament injury. Therefore, we adopted a dichotomy method to evaluate BMELI. (3) Medial clear space (MCS): MCS is the distance between the medial border of the talus and the lateral tibial plafond (pilon), and is commonly used as an indicator of DL rupture with a threshold value of 5 mm (14,26,27). In the present study, MCS was measured on a line parallel to the medial articular surface and 5 mm below the talar dome on T1-weighted coronal MR images (Fig. 4). Each MCS was measured on four or five consecutive slices, and the maximum value was recorded. Each case was measured three times and the average value was used in the analysis. MCS > 5 mm was considered to indicate DL injury.
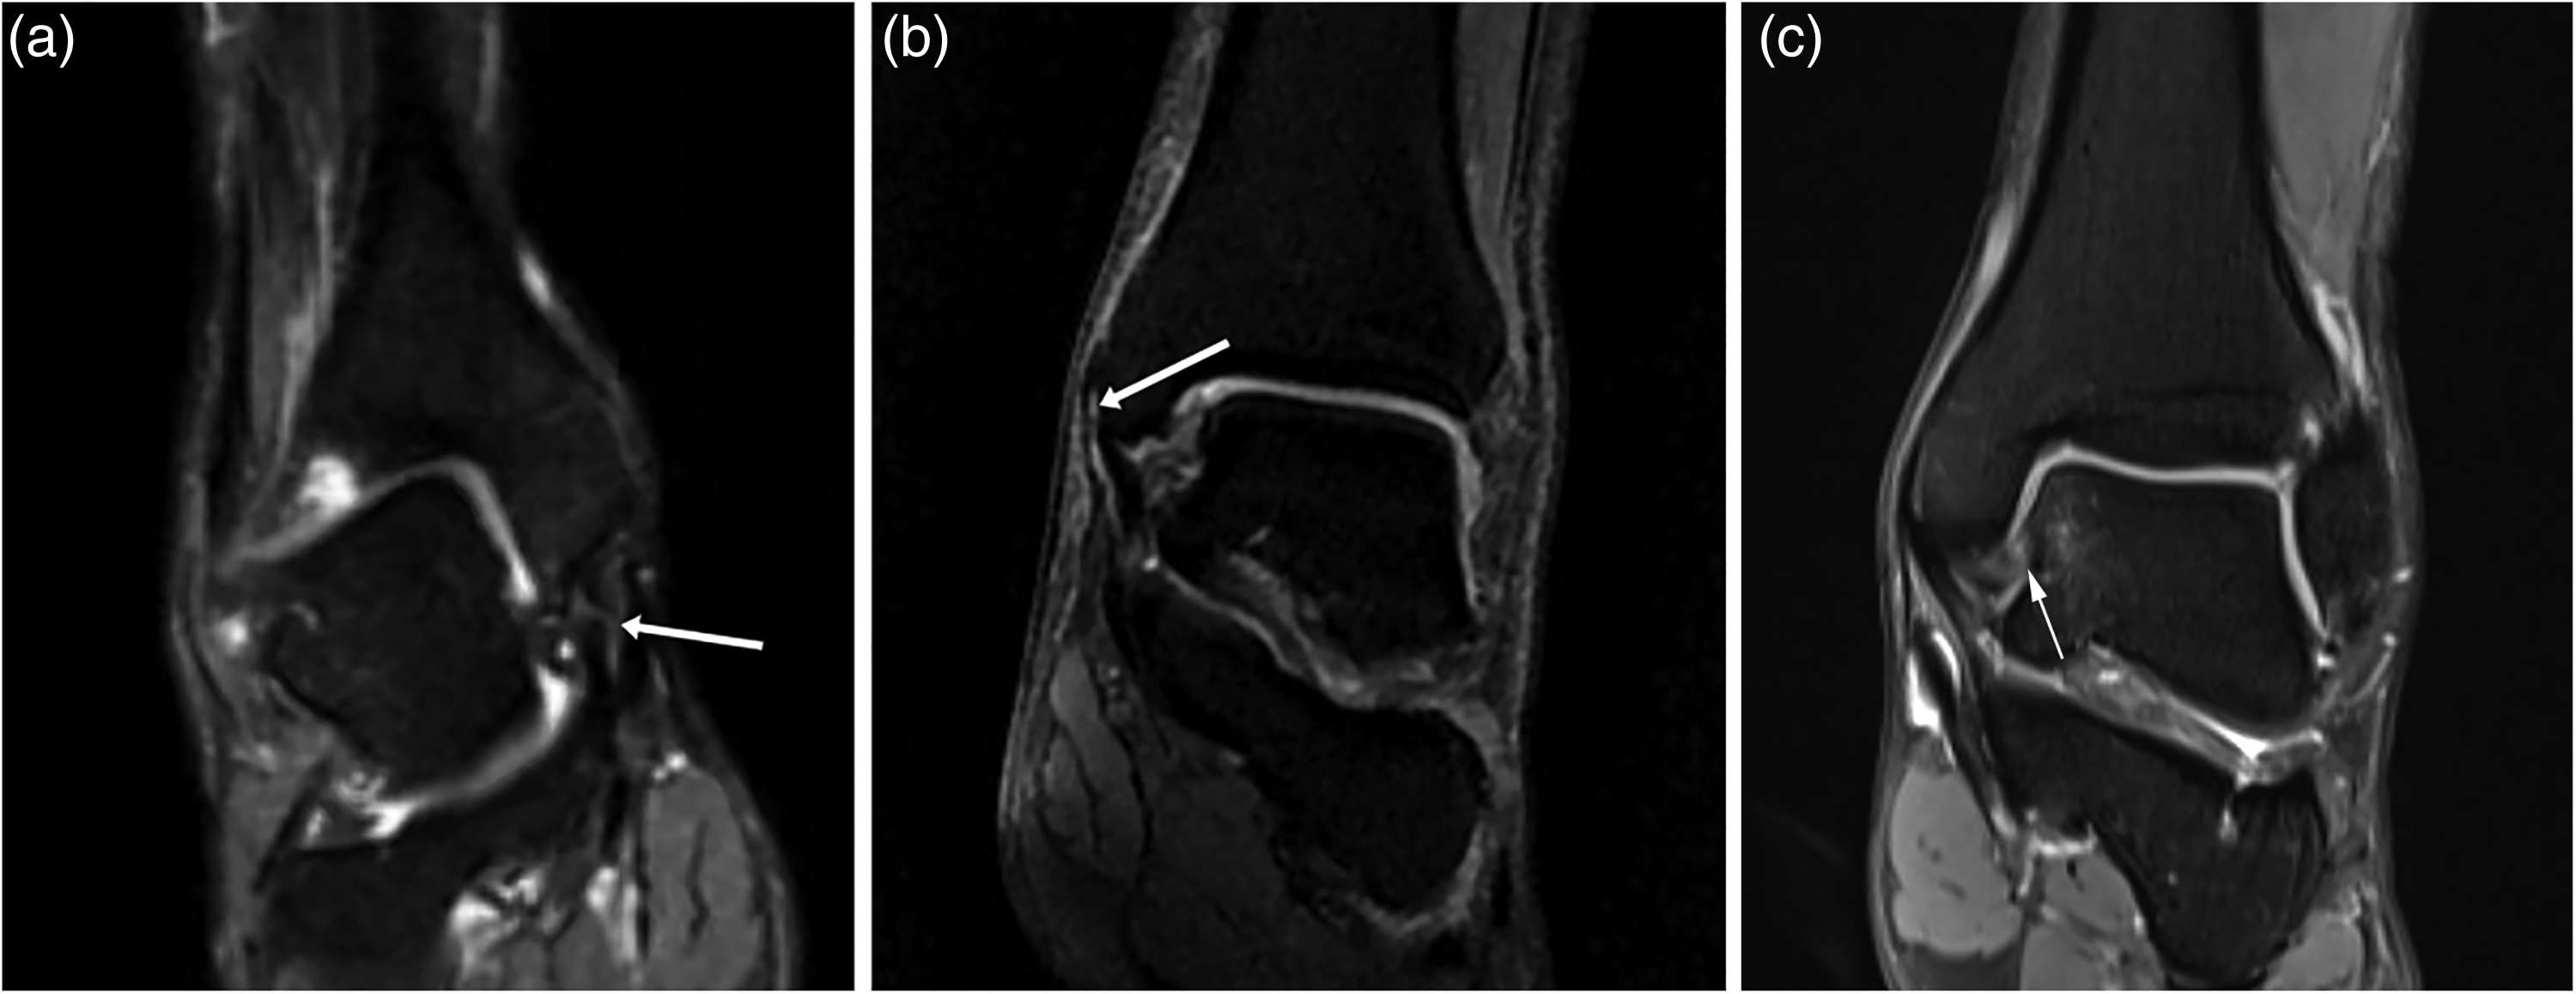
Magnetic resonance images show morphological abnormality of the deltoid ligament (DL). (a) DL rupture in its middle part. Partial discontinuity can be seen (white arrow). (b) Superficial DL rupture at its origin on tibia. DL detachment from the tibia can be observed (white arrow). (c) DL tear at the insertion on talus. The long white arrow indicates rupture of DL.
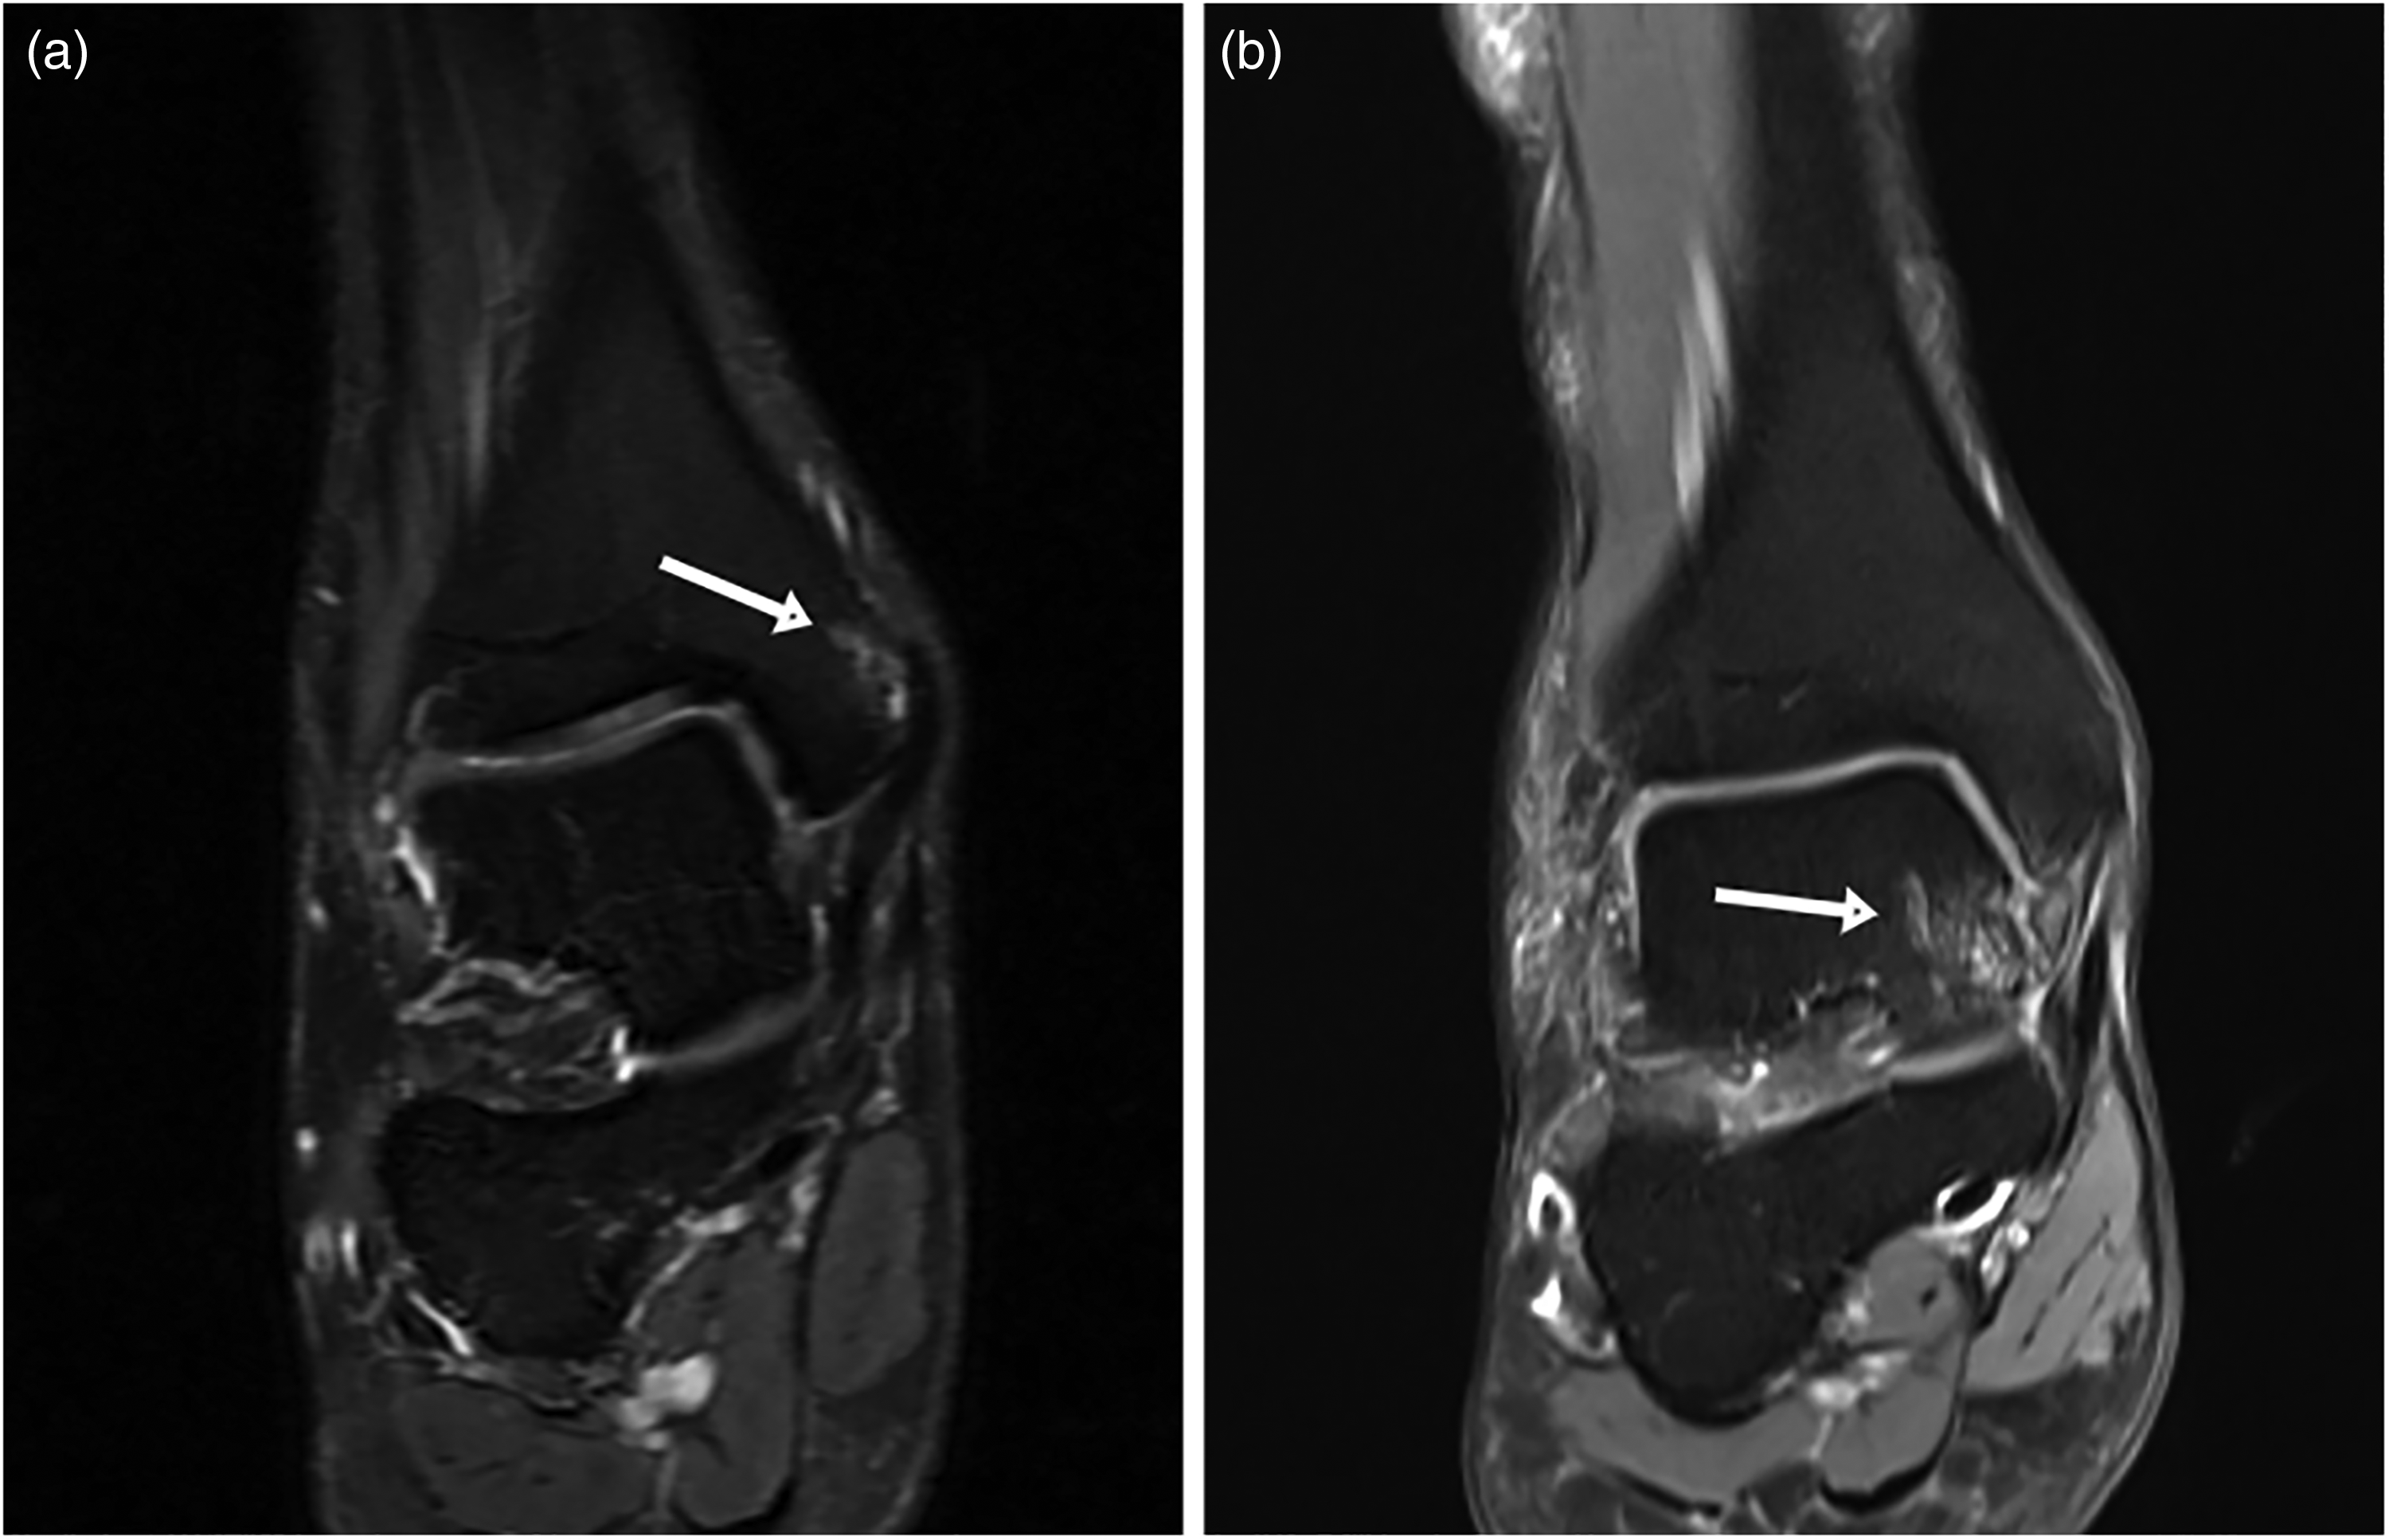
Magnetic resonance images reveal bone marrow edema (BME) at the ligament insertion. (a) BME superior to the inferior tip of superficial medial malleolus, with insertion of superficial deltoid ligament (DL) on tibia (white arrow), indicating superficial DL injury. (b) BME at the medial side of talus and the attachment of deep DL on talus (white arrow), indicating deep DL injury.
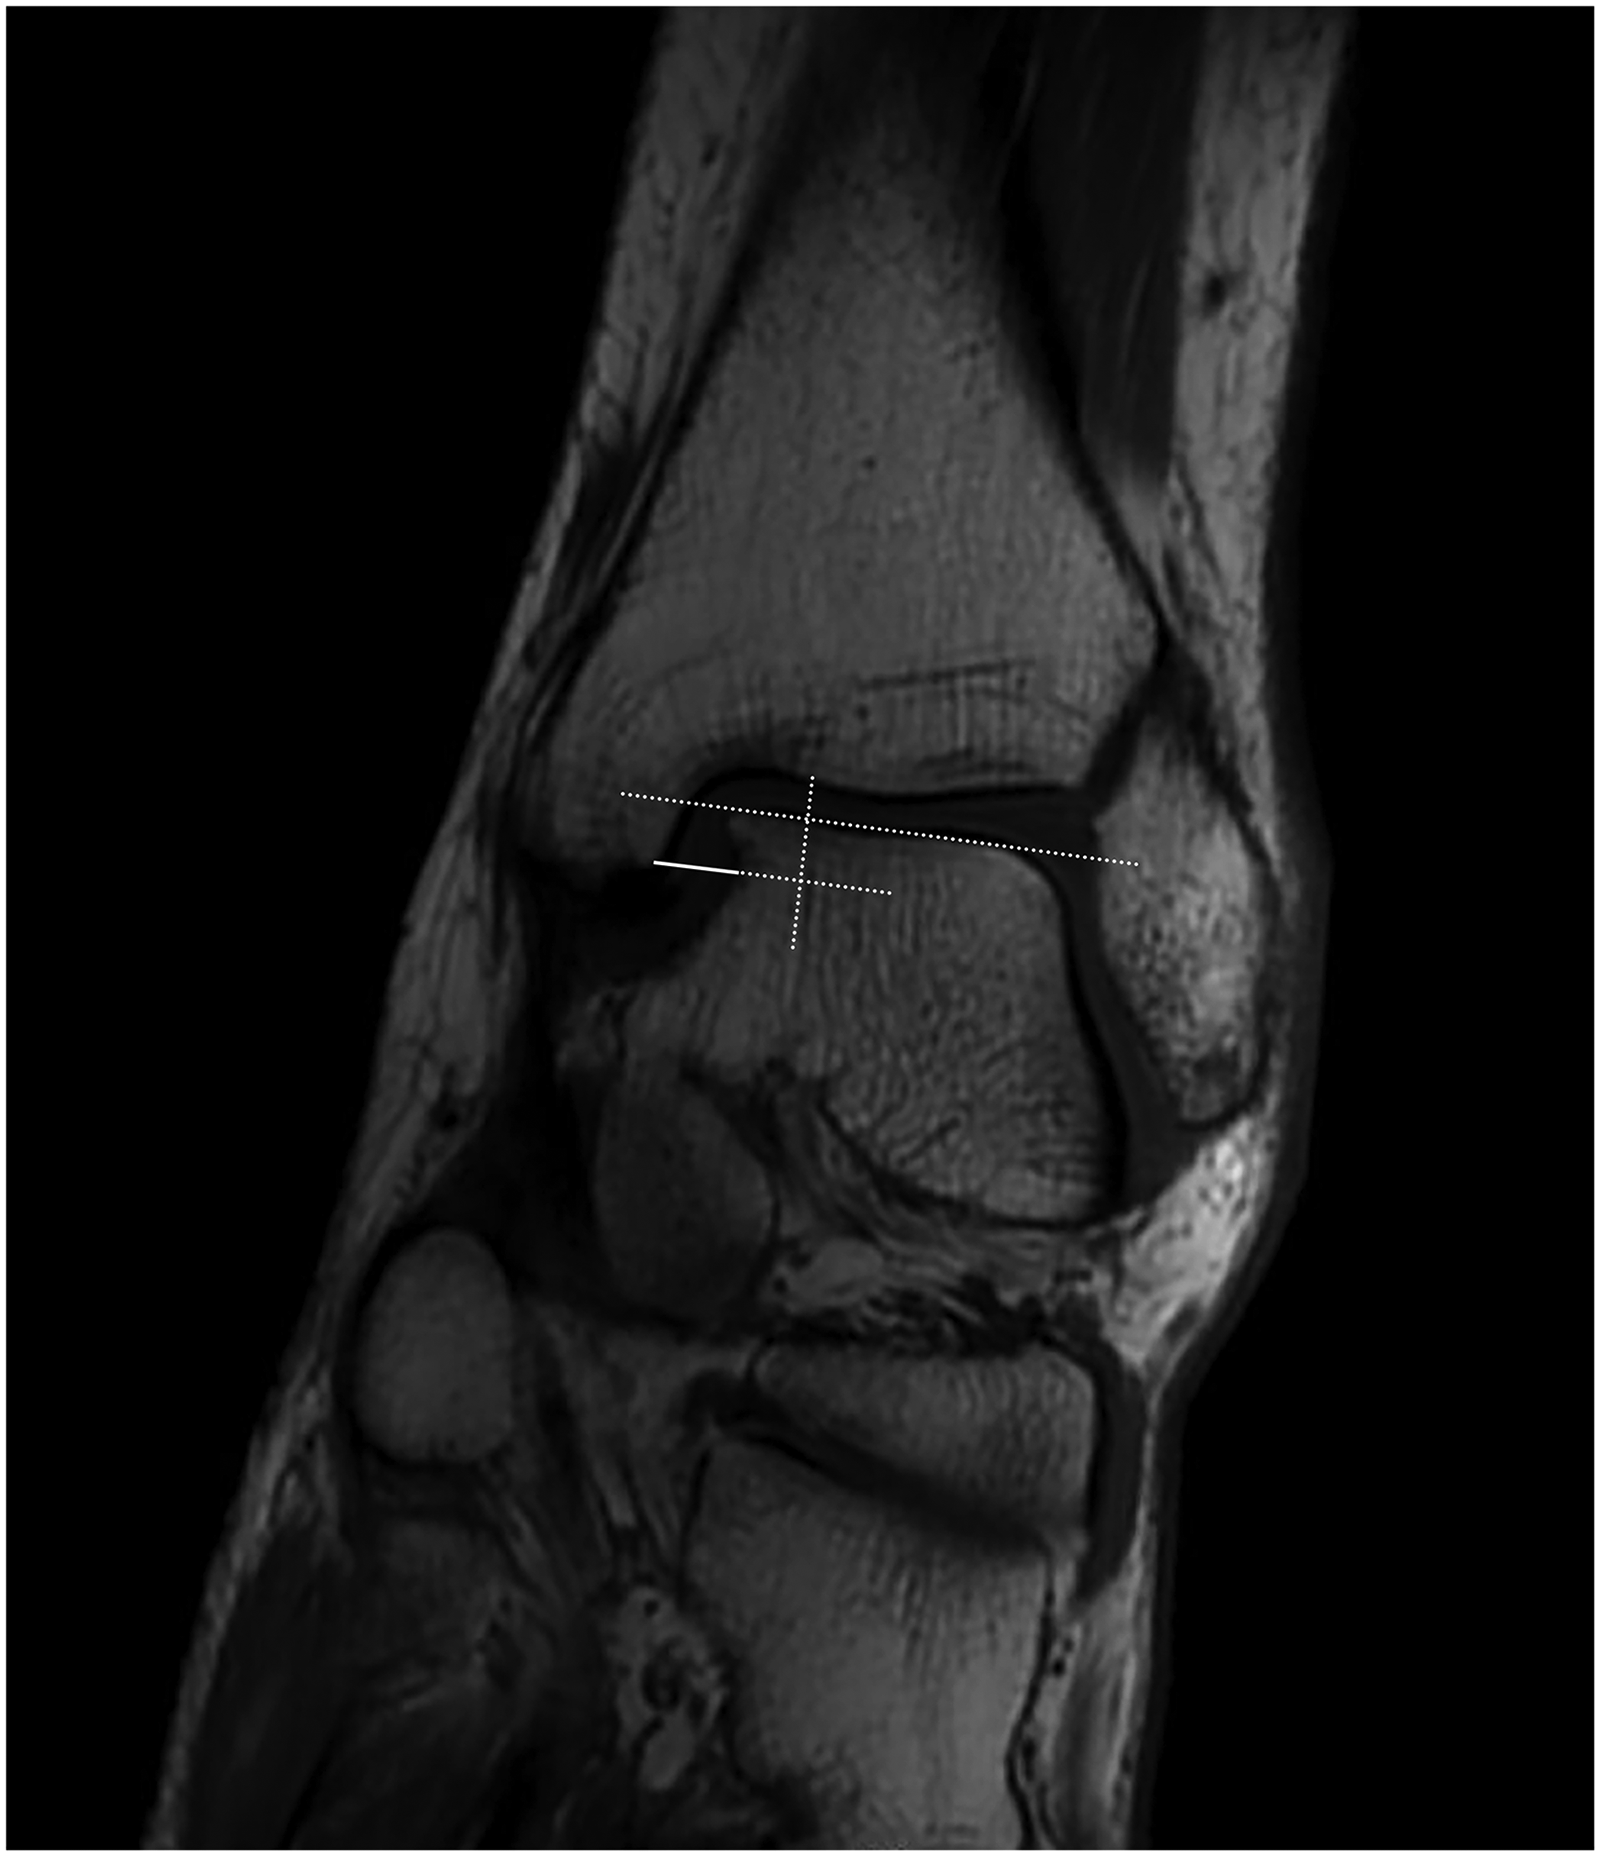
Medial clear space (MCS) measurement. MCS, the distance between the medial border of the talus and the lateral tibial plafond, was measured on a line parallel to the medial articular surface and 5 mm below the talar dome.
In our clinical experience, the classification of BME according to the range, signal strength or other indicators is not helpful for judging the severity of ligament injury. Therefore, a dichotomy method was adopted to evaluate BMELI in the present study.
For each investigator, the three signs were evaluated separately. The interval between each evaluation was at least 1 week to reduce the risk of memory bias. We first assessed the value of the three signs in diagnosing overall DL injuries. Then, we analyzed their diagnostic value in superficial versus deep DL injuries.
Statistical analysis
Power analysis was conducted with PASS 11 (NCSS, Kayesville, UT, USA). All other statistical analyses were performed using SPSS, version 22.0 (IBM Corp., Armonk, NY, USA).
We considered arthroscopic findings to be the gold standard diagnosis of DL injury. The sensitivity and specificity of the three MRI signs were calculated in comparison with this approach. Differences between study groups were compared using chi-squared tests. Differences between the three methods were compared using McNemar's test. P < 0.05 was considered statistically significant.
Interobserver reliability was estimated using Cohen's kappa (κ). The results of the test were interpreted as follows: κ values of 0.21–0.4 indicated poor correspondence, 0.41–0.6 indicated fair correspondence, 0.61–0.8 indicated good correspondence and 0.81–1.0 indicated excellent correspondence.
An a priori power analysis was conducted to determine the number of ankles required to establish 80% power in a 1:2 propensity score-matched ratio. The power analysis was based on the expected sensitivity (72%) and specificity (95%) of BMELI according to a convenient sample (an unscreened group consisted of 60 CAI patients). Given these parameters, we needed at least 30 ankles in the injury group and 61 ankles in the normal group to minimize the risk of a type II error. Considering the possible error in using this sample as a reference, we also conducted a post-hoc power analysis and result was 0.77.
Results
The demographic data of the study groups are shown in Table 1. Taking arthroscopy as the reference standard, there were 34 patients with a DL injury and 66 patients without a DL injury. There were no significant differences in terms of age, gender, BMI and time-to-surgery between the two groups.
The results of using three MRI signs for primary diagnosis of general DL injury are provided in Table 2. ALMC had a sensitivity of 64.71% (22/34; 46.47–79.70) and a specificity of 83.33% (55/66; 71.71–91.00). BMELI had a sensitivity of 70.59% (24/34; 52.33–84.29) and a specificity of 95.45% (63/66; 86.44–98.82). MCS had a sensitivity of 26.47% (9/34; 13.51–44.65) and a specificity of 92.42% (61/66; 82.50–97.18). ALMC and BMELI showed better diagnostic efficacy of DL injury compared to MCS (both P = 0.002). However, no significant differences were found in the diagnostic efficacy between ALMC and BMELI (P = 0.06).
Predictive value of magnetic resonnace imaging signs.
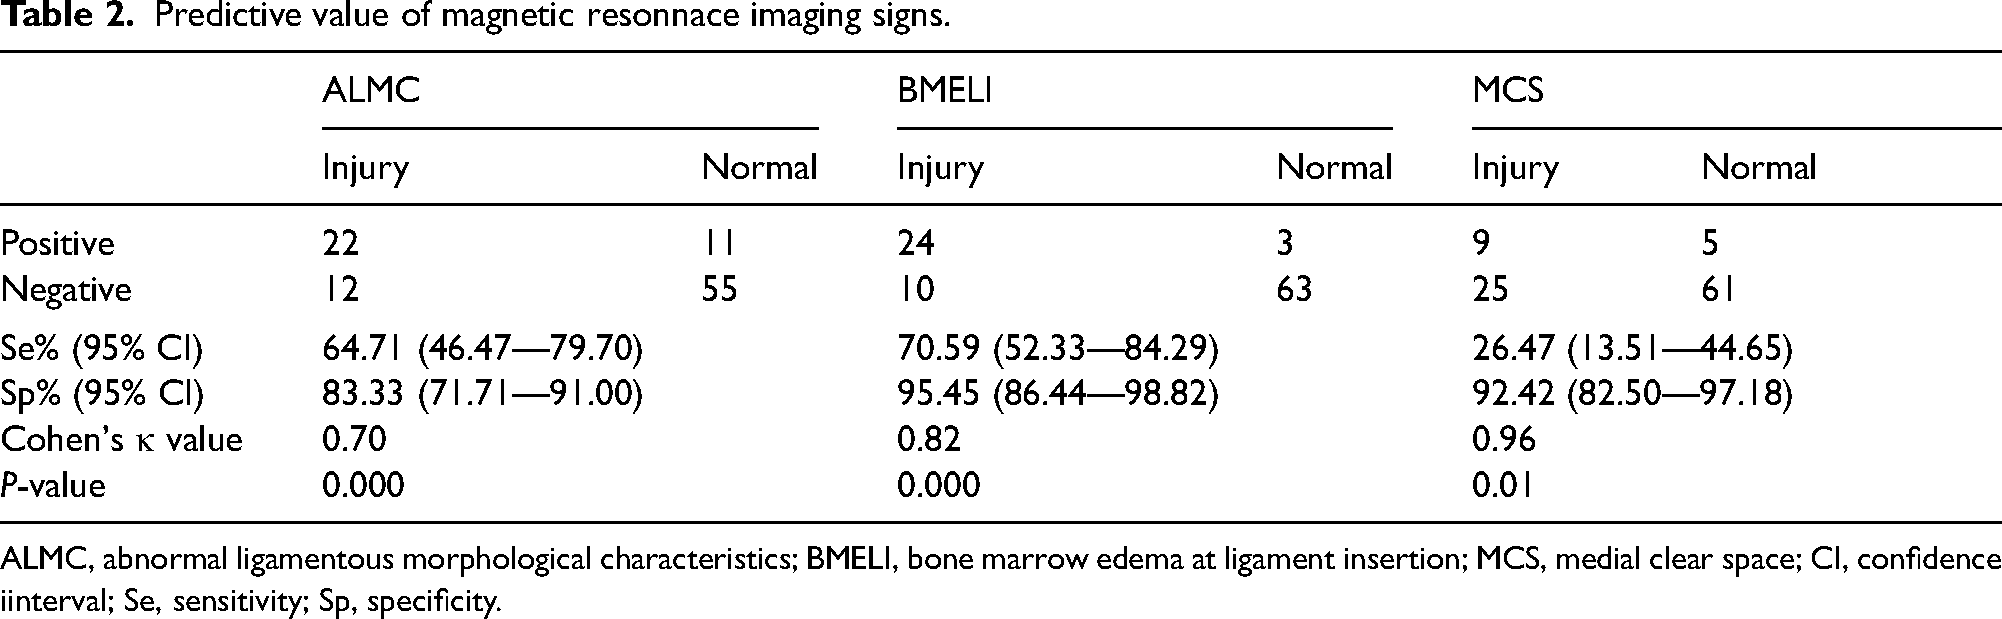
ALMC, abnormal ligamentous morphological characteristics; BMELI, bone marrow edema at ligament insertion; MCS, medial clear space; CI, confidence iinterval; Se, sensitivity; Sp, specificity.
The diagnostic efficacy of the three signs differed when superficial and deep DL injuries were addressed separately. The positive case numbers in the superficial and the deep group (true positive cases) and the uninjured group (false positive cases) and metrics of diagnostic efficacy of the three MRI signs are shown in Table 3. Both ALMC and BMELI showed high efficacy in the diagnosis of superficial DL injuries. MCS may not be a reliable sign for either superficial or deep DL injuries (both P > 0.05). BMELI efficacy was significantly higher than ALMC and MCS in deep DL injuries (P = 0.01 and 0.04, respectively), with a sensitivity of 75.00% (15/20; 50.59–90.41) and a specificity of 95.00% (38/40; 81.79–99.13).
Diagnostic results with differentiation of superficial and deep deltoid ligament injury.
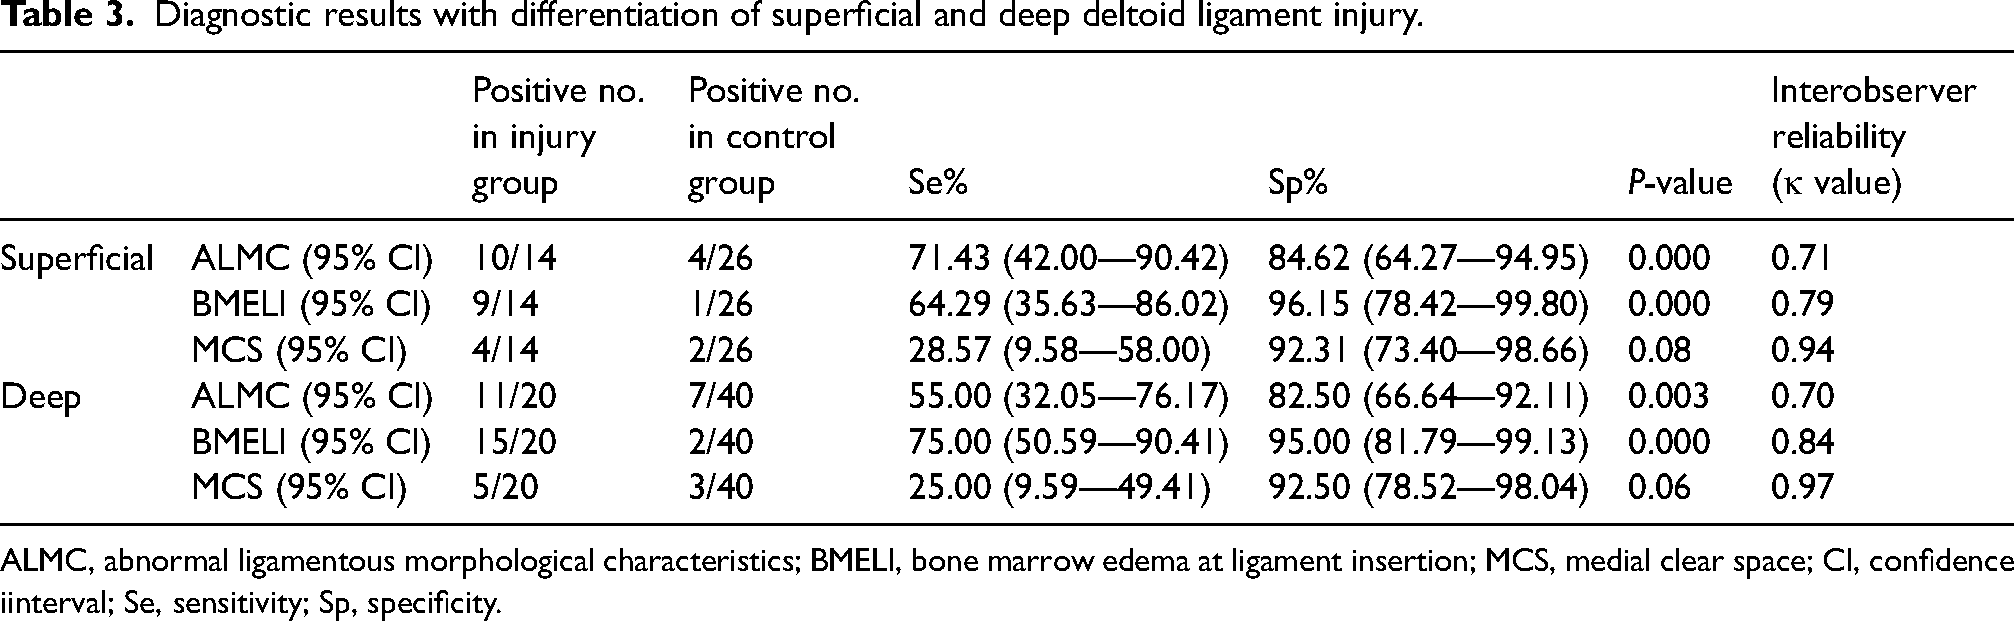
ALMC, abnormal ligamentous morphological characteristics; BMELI, bone marrow edema at ligament insertion; MCS, medial clear space; CI, confidence iinterval; Se, sensitivity; Sp, specificity.
Inter-observer reliability of the three signs was all good. Cohen's κ values of ALMC, BMELI and MCS were 0.70, 0.82 and 0.96, respectively. When specifically diagnosing superficial DL injury, the κ values of ALMC, BMELI and MCS were 0.71, 0.79 and 0.94, respectively. When specifically diagnosing deep DL injury, the κ values of ALMC, BMELI and MCS were 0.70, 0.84 and 0.97, respectively.
Discussion
MRI diagnosis of DL injury evaluating ALMC and MCS may lack sensitivity in the diagnosis of chronic cases. In the present study, we aimed to verify the diagnostic value of an MRI sign that was not been studied before, BMELI, in chronic DL injury. We found that BMELI is an efficacious MRI sign for chronic deep DL injuries. As a novel diagnostic sign, BMELI may help improve the overall accuracy of MRI-based diagnosis of chronic DL injury.
Observing ligament integrity directly on MRI, termed ALMC in the present study, is the most widely used method in evaluating injuries of the DL (7–9,17,28). An advantage of ALMC is that it allows the location of the DL rupture to be pinpointed. Several studies have graded DL injuries based on the ALMC as follows: grade I (ligament stretching/thickening/striation loss), grade II (partial tear) and grade III (discontinuity/gap/complete disruption). Treatment strategies have been proposed based on these grades: non-operative treatment for grade I injuries and surgery for grade II and III injuries (17–22). However, the accuracy of evaluating DL integrity by ALMC has varied from study to study. Mengiardi et al. (18) reported a sensitivity of 78% and specificity of 80% in superficial injuries and 89%/83% in deep injuries. A retrospective study by Slullitel and Calvi (29), taking surgical reports as standard, reported 83.3% sensitivity/93.9% specificity in superficial cases and 96.3%/97.9% in deep cases. Van Leeuwen et al. (9) compiled the results of several studies and reported an overall sensitivity and specificity with values between 65% and 88% in their systematic review. Previous studies have argued that ALMC has higher accuracy in diagnosing acute DL injuries in younger patients without previous ankle injuries, and is readily distinguishable from normal ligament morphology on fluid-sensitive MRI (18,29). However, ALMC may not be reliable in the diagnosis of chronic DL injuries, due to the loss of striation of the ligaments (9–11). In the present study, we found that the sensitivity of ALMC in diagnosing deep DL lesions was lower than expected, and the concordant use of BMELI may help reduce the risk of a false negative diagnosis of chronic deep DL injury by ALMC.
MCS was once considered to be a reliable radiological indicator of DL injury and medial ankle instability (14,26). However, the methods of MCS measurement differ in previous literature and the optimal cut-off value of MCS depends on the foot position during image acquisition (30,31). Van Leeuwen et al. (12) and Pitakveerakul et al. (32) suggested that an MCS > 4 mm reliably indicates DL injury when the ankle is in a gravity-stress position. A retrospective study by Arthur et al. (13), taking surgical reports as standard, reported that MCS > 5.5 mm on injury mortise radiographs indicated a deep DL injury. According to a prospective study by Warner et al. (14), an MCS > 5 mm in either neutral or stress-positioned images can predict DL rupture. In our study, all images were acquired in non-stress positions. As such, we used perpendicular MCS for DL injury evaluation and 5 mm as the cut-off value, as was recommended by Ashraf et al. (33). However, our results showed poor sensitivity of MCS in diagnosing a DL injury. One possible contributor is that MCS measured on MRI may be different from that measured on ankle radiographs due to the thickness of cartilage on the surface of the distal tibia and talus. Comparing the MCS of the injured ankle with the contralateral side may be a more accurate way to diagnose DL injury, rather than the use of a cut-off value.
The relationship between BME and ligamentous tears has been discussed in previous studies. Anteromedial/posteromedial BME on the distal tibia is considered to relate to an anterior/posterior DL avulsion (34). Trauma to the ligament attachment and impingement of the medial ankle are both possible mechanisms of localized BME (35). In addition, BME could persist for 6 months or longer after significant ankle trauma (36). However, no clinical study has thoroughly interrogated the correlation between BME and DL rupture. To ensure that the BME identified in the present study was associated with DL injury, we evaluated only BME that was found at the insertion of the DL. BME superior to the inferior tip of the medial malleolus was considered to indicate superficial DL injury (proximal insertion), while BME at the medial aspect of the talus was regarded as indicative of a deep DL injury (distal insertion). As a result, we found a high diagnostic accuracy of BMELI in DL injury. BMELI was more common in the deep DL injury group compared to the superficial injury group (64.29% vs. 75.00%). This is probably because BME at the medial talus can be secondary to the continuous impingement of talus and distal tibia after a deep DL avulsion (37). Because the mechanism of BME is not as simple as ligament avulsion, the range and signal intensity of BME are not related to the severity of ligament injury. Therefore, we used a binary approach to evaluate BME rather than grading it. Although BME is usually self-limiting and thought to be more common in the acute phase of ankle injury than in the chronic phase (35), we found that BMELI was not uncommon in CAI patients with chronic DL injury. Why BMELI persists after the acute phase of the DL injury remains to be explored.
There was no doubt that the accuracy of all three MRI signs would be affected by the thickness of the MRI slices. In the present study, a 5-mm slice was adopted. However, three T MRI devices currently used in the clinic were able to provide images with a thickness of 1–3 mm. A thinner slice may be more helpful to detect subtle ligament tears and BME and can also make MCS measurement more exact, and thus making MRI diagnosis of DL injury more accurate.
There are some limitations to the present study. First, only patients undergoing surgical treatment were included in this study, and so the conclusions cannot be generalized to all patients that received non-surgical treatment. Second, all included patients with DL injuries were CAI patients, and so the conclusions of the study do not apply to patients who have isolated or acute DL injuries. Third, the presence rather than the severity of BMELI was evaluated, and so we did not evaluate test performance across the severity spectrum, and no multi-stage scale was used either. Fourth, the evaluation result of one MRI sign may affect the evaluation of other signs because three signs were evaluated on the same set of images. Fifth, the MRI slice used in the present study was relatively thick, which may have led to generally lower accuracy of all diagnostic signs comparing to thinner slice. Sixth, a convenient sample was used to calculate the required sample size in the present study, but the post-hoc power was 0.77, which was slightly lower than expected.
Despite these limitations, we provide initial confirmation of the value of the BMELI for diagnosing chronic DL injury. BMELI showed good sensitivity and the highest specificity among the three signs that we evaluated in our CAI patients. We suggest that concomitant DL injury should be strongly suspected in CAI patients showing BME at the insertion of the DL and that treatment strategies should be made based on ALMC grading. In addition, for CAI patients with an unclear morphology of DL but with a positive BMELI, DL injury should also be suspected, and further arthroscopy is recommended.
In conclusion, BMELI can reliably indicate DL injury in CAI patients. BMELI has high specificity and sensitivity, especially in diagnosing deep DL injuries. Using BMELI as an indicator of chronic DL injury when ALMC is unclear may reduce the rate of false negative diagnoses in the clinic.
Footnotes
Acknowledgments
Ethics approval
This retrospective study was approved by the institutional review board of Huashan Hospital Fudan University (HIRB2016-314). For this type of study formal consent is not required.
Declaration of conflicting interests
The authors declared no potential conflicts of interest with respect to the research, authorship, and/or publication of this article.
Funding
The authors disclosed receipt of the following financial support for the research, authorship, and/or publication of this article: This work was supported by the National Natural Science Foundation of China, (grant number 81871823).