
Abstract
Background
BRAF V600E mutation is a common genomic alteration in gangliogliomas (GGs) and pleomorphic xanthoastrocytomas (PXAs) with prognostic and therapeutic implications.
Purpose
To investigate the ability of magnetic resonance imaging (MRI) features to predict BRAF V600E status in GGs and PXAs and their prognostic values.
Material and Methods
A cohort of 44 patients with histologically confirmed GGs and PXAs was reviewed retrospectively. BRAF V600E status was determined by immunohistochemistry (IHC) staining and fluorescence quantitative polymerase chain reaction (PCR). Demographics and MRI characteristics of the two groups were evaluated and compared. Univariate and multivariate Cox regression analyses were performed to identify MRI features that were prognostic for progression-free survival (PFS).
Results
T1/FLAIR ratio, enhancing margin, and mean relative apparent diffusion coefficient (rADCmea) value showed significant differences between the BRAF V600E-mutant and BRAF V600E-wild groups (all P < 0.05). Binary logistic regression analysis revealed only rADCmea value was the independent predictive factor for BRAF V600E status (P = 0.027). Univariate Cox regression analysis showed age at diagnosis (P = 0.032), WHO grade (P = 0.020), enhancing margin (P = 0.029), and rADCmea value (P = 0.005) were significant prognostic factors for PFS. In multivariate Cox regression analysis, increasing age (P = 0.040, hazard ratio [HR] = 1.04, 95% confidence interval [CI] = 1.002–1.079) and lower rADCmea values (P = 0.021, HR = 0.036, 95% CI = 0.002–0.602) were associated with poor PFS in GGs and PXAs.
Conclusion
Imaging features are potentially predictive of BRAF V600E status in GGs and PXAs. Furthermore, rADCmea value is a valuable prognostic factor for patients with GGs or PXAs.
Introduction
Gangliogliomas (GGs) and pleomorphic xanthoastrocytomas (PXAs) are uncommon neoplasms, accounting for approximately 2% of all intracranial tumors (1). They are usually slow-growing and predominantly occur in childhood and young adulthood. A GG is a mixed glio-neuronal tumor consisting of neoplastic glial cells and dysplastic ganglion cells (2). A PXA is characterized by the proliferation of glial cells and the presence of polymorphic giant tumor cells with lipid-filled xanthomatous cells (3). These two entities are often curable by complete resection. However, total resection is not possible in every case. For instance, infratentorial GGs usually cannot be radically resected due to their frequent infiltration of the brainstem (4). Sometimes, PXAs are too large to be completely removed (5).
In recent years, neuro-oncologic molecular markers have become increasingly significant for clinical management. Some of these markers exhibit great diagnostic capacity, while others are becoming helpful to predict treatment response or prognosis (6,7). Among these markers, the BRAF V600E (B-Raf proto-oncogene serine/threonine-protein kinase) mutation is most frequently detected in PXAs (66%) and GGs (18%–57%) for brain tumors (8,9). Studies have demonstrated that children with BRAF V600E-mutant GGs or PXAs have a higher risk of progression and worse outcome (10,11). However, by targeting BRAF, BRAF inhibitors, such as vemurafenib, were proved to be effective in decreasing tumor size (12,13). Regarding these findings, neoadjuvant targeted therapy plus minimally invasive surgery has become a new way of treating large or unresectable GGs or PXAs. Therefore, identification of BRAF V600E status during pre-therapeutic work-up is crucial to treatment planning and prognostic prediction.
Magnetic resonance imaging (MRI) is the preferred tool for the preoperative evaluation of brain tumors. Imaging features are correlated with tumor biology, suggesting a careful analysis of MRI features could potentially predict tumor genetic status (14,15). Visually Accessible Rembrandt Images (VASARI), developed by multi-institutional neuroradiologists with extensive experience in neuro-oncology, is designed to comprehensively describe the MRI features of glioma in consistent and reproducible terms. Studies have shown that the VASARI feature set contributed to predict IDH mutation and 1p19q codeletion in gliomas (16,17). In addition, a recent study has reported the role of diffusion-weighted imaging (DWI) on the differentiation of BRAF V600E status in GGs and pilocytic astrocytomas (18). Although some studies have described the imaging features of GGs and PXAs, rare studies evaluated the imaging characteristics of BRAF V600E status in GGs and PXAs.
Therefore, the aim of the present study was to investigate whether MRI features were associated with the BRAF V600E status in GGs and PXAs and to identify the prognostic value of MRI features for the prediction of progression-free survival (PFS).
Material and Methods
Patient cohort
This study was approved by the institutional review board, and the requirement for informed consent was waived due to the retrospective nature of the study. Consecutive patients with GGs or PXAs proven by histopathology between January 2016 and December 2022 were identified from the institutional database. The inclusion criteria were as follows: (i) a histopathological diagnosis of GG or PXA; (ii) a preoperative MRI examination including DWI and susceptibility-weighted imaging (SWI) was performed; and (iii) BRAF V600E status was identified according to the 2016 World Health Organization (WHO) guidelines. Patients who received treatment (radiation or chemotherapy) before the MRI examination were excluded. Finally, 21 patients with GG (15 BRAF V600E-mutant and 6 BRAF V600E-wild type) and 23 individuals with PXA (17 BRAF V600E-mutant and 6 BRAF V600E-wild type) were enrolled. In total, 40 patients underwent gross total resection and four patients received partial resection followed by concomitant chemoradiotherapy with adjuvant temozolomide.
Treatment response
All patients visited the outpatient clinic and underwent a follow-up MRI examination, according to the institution’s protocol. Tumor response was assessed according to the Response Assessment in Neuro-Oncology criteria. Disease progression was diagnosed if the patient satisfied at least one of the following Response Assessment in Neuro-Oncology criteria: (i) 25% increase in size of enhancing tumor; (ii) any newly enhancing lesion; (iii) evident clinical deterioration secondary to disease; and (iv) clear progression of non-measurable disease. PFS was calculated as the time interval between the date of the initial imaging diagnosis and the date of disease progression. Patients without any recurrence at the last follow-up were censored.
Imaging protocol
All brain MRI scans were performed on 3.0-T MR scanners (Magnetom Verio Tim, Skyra, or Prisma; Siemens, Erlangen, Germany) using an eight-channel head coil. The MRI protocol included axial pre-contrast T1-weighted (T1W) spin-echo imaging (TR = 250 ms, TE = 2.48 ms); axial T2-weighted (T2W) turbo spin-echo imaging (TR = 4000 ms, TE = 96 ms); axial fluid-attenuated inversion recovery (FLAIR; TR = 9000 ms, TE = 94 ms, TI = 2500 ms) imaging, and three-plane contrast-enhanced T1W CE-T1W imaging (TR = 250 ms, TE = 2.48 ms) with a field of view (FOV) of 22 cm and slice thickness of 5 mm. All images were acquired with matrix size of 256 × 256. CE-T1W images were obtained after an intravenous injection of gadobenate dimeglumine (GD-BOPTA, Multihance; Bracco, Shanghai, PR China) at a dosage of 0.1 mmol/kg of body weight and a rate of 2–3 mL/s.
DWI was performed in the axial plane with a multi-slice, single-shot echo planar imaging (EPI) sequence (TR = 8200 ms, TE = 102 ms, number of excitations [NEX] = 2.0). Two b-values (0 and 1000 s/mm2) were used in the three orthogonal directions. Corresponding apparent diffusion coefficient (ADC) maps were generated automatically by the MRI system.
Non-enhanced SWI was performed in the axial plane using a three-dimensional (3D) fully flow-compensated gradient-echo sequence (TR = 27 ms, TE = 20 ms, flip angle = 15°).
Computed tomography (CT) was available in 33 individuals. The CT examinations were performed on a 320-detector volume CT scanner (Aquilion ONE; Toshibo Medical Systems, Tokyo, Japan). The scan parameters were as follows: current = 200–300 mAs; voltage = 120 kV; section thickness = 1–5 mm; and matrix = 512 × 512.
Imaging analysis
Two experienced radiologists (with 3 and 10 years of experience) evaluated the conventional MRI scans independently. The readers were blinded to tumor histology and molecular subtypes. When disagreement occurred, a final decision was reached by a senior neuroradiologist (with 30 years of experience). The imaging manifestations were scored in accordance with the VASARI feature set (https://wiki.cancerimagingarchive.net/display/Public/VASARI+Research+Project). Furthermore, tumor size and calcification were also evaluated in the present study. The size was calculated as the maximal area of the transverse plane. Calcification was generally determined by CT examination, but in the absence of CT (n = 11), it was determined by a SWI sequence.
For the quantitative analysis of DWI data, ADC values were measured by manually placing regions of interest (ROIs) on the ADC maps. At least five small round ROIs (size = 40–80 mm2) were placed on the solid component of the tumor (defined on FLAIR images and CE-T1W imaging) and avoided calcified, cystic, necrotic, and hemorrhagic lesions. The mean ADC (ADCmea) value was calculated from the multiple ROIs. In addition, the same ROIs were applied to the contralateral normal-appearing white matter (NAWM). The mean relative ADC (rADCmea) value was derived from the ratios of the tumor ADCmea to the ADCmea of the NAWM. ADCmea values were expressed as x10−3 mm2/s.
Molecular studies
Tumors were examined for the presence or absence of a BRAF V600E mutation by using two complementary methods: immunohistochemistry (IHC) staining and fluorescence quantitative polymerase chain reaction (PCR). IHC staining was performed using 5-μm-thick sections in paraffin-embedded specimens and mouse monoclonal anti-human BRAF V600E antibody (clone VE1, dilution 1:100; Spring Bioscience, Xiamen, PR China). Samples were considered positive when the VE1 staining showed unequivocal diffuse cytoplasmic staining of tumor cells. The BRAF V600E mutation was determined by applying the amplification refractory mutation system PCR (ARMS-PCR) technique with a human BRAF V600E ARMS-PCR kit (P216010801Y; Amoy Diagnostic Co. Ltd., Xiamen, PR China). All operations were strictly performed according to the manufacturer’s instructions.
Statistical analysis
Inter-observer reliability of conventional imaging features was evaluated by kappa statistical test. The interpretation of the intraclass correlation coefficient was as follows: <0.20 = positive, but poor; 0.21–0.40 = fair; 0.41–0.60 = moderate; 0.61–0.80 = good; and 0.81–1.00 = excellent agreement (19). To compare the clinical and MRI features between BRAF V600E-mutant and wild-type GGs and PXAs, the Student’s t-test was used to assess the quantitative data and the chi-square test or Fisher’s exact test was performed for the categorical data. Binary logistic regression analysis was used to identify the significant independent factors for predicting BRAF V600E status. Receiver operating characteristic (ROC) curves were applied to identify the differentiation capacity. Univariate regression analysis was performed to identify clinical and MRI features that were prognostic for PFS. Factors that were significant (P < 0.05) in univariate analysis were entered into multivariate Cox regression analysis. All of the statistical analyses were two-sided, and a P value <0.05 was considered to be a statistically significant difference. Analyses were conducted using SPSS software version 26.0 (IBM Corp., Armonk, NY, USA) and MedCalc version 18.11.6 (MedCalc Inc., Mariakerke, Belgium).
Results
The clinical and MRI characteristics between BRAF V600E-mutant and wild-type GGs and PXAs are summarized in Tables 1 and 2. There were no significant differences in clinical characteristics (age and sex) between the BRAF V600E-mutant and BRAF V600E-wild groups.
Clinical and imaging characteristics of BRAF V600E-mutant and wild-type tumors.
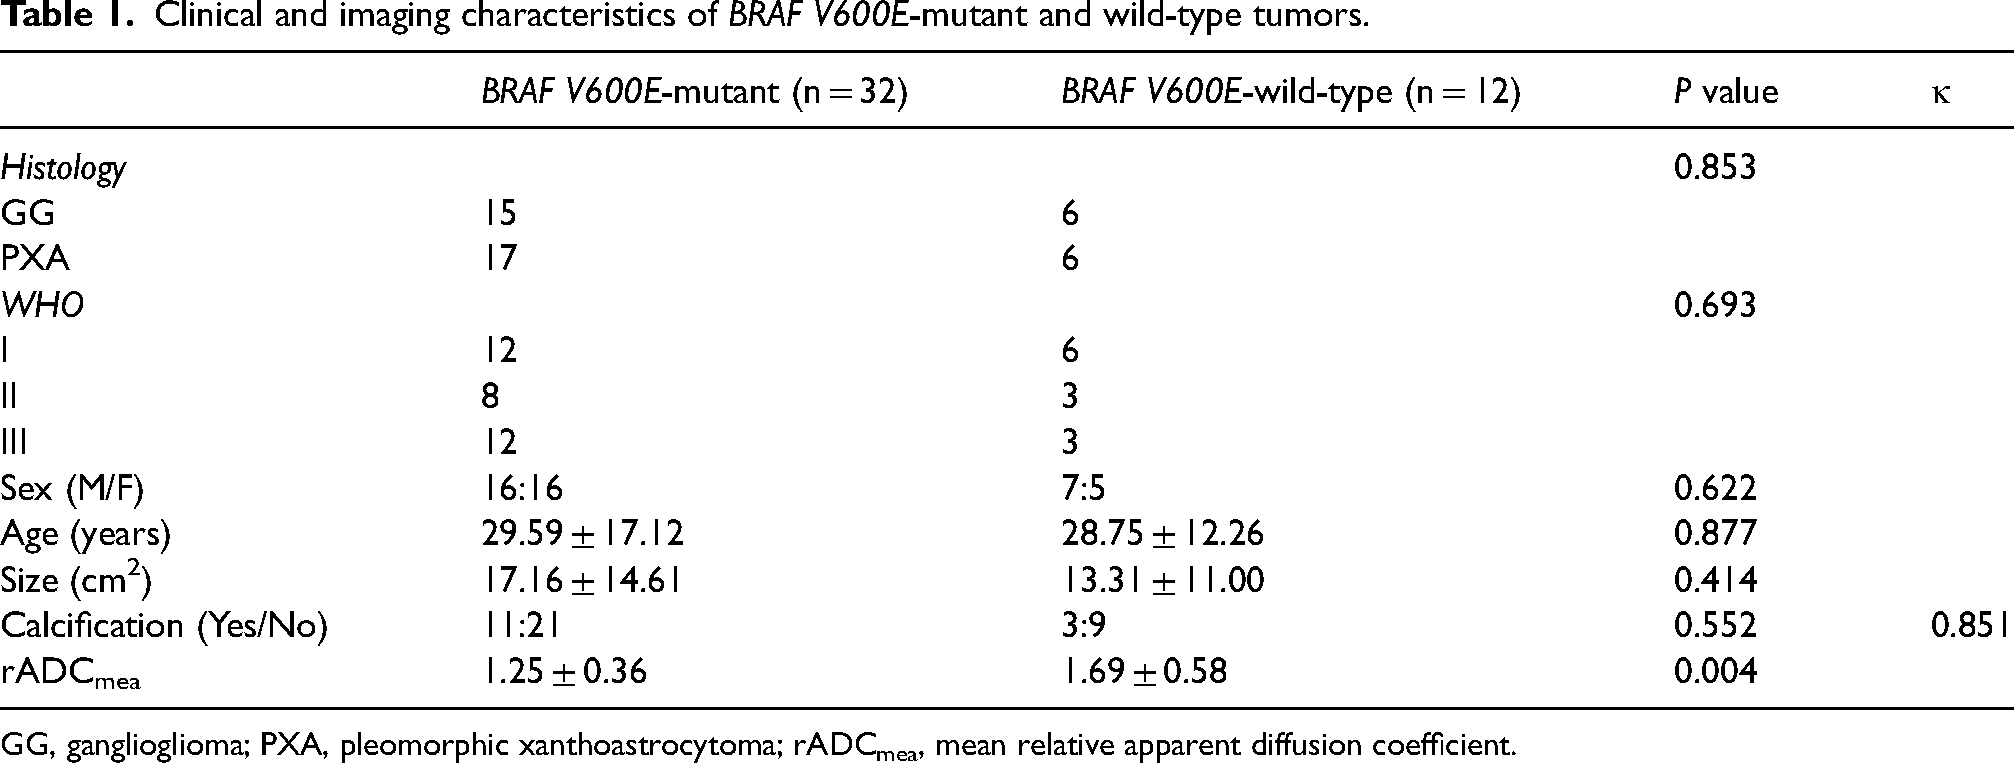
GG, ganglioglioma; PXA, pleomorphic xanthoastrocytoma; rADCmea, mean relative apparent diffusion coefficient.
VASARI feature set of BRAF V600E-mutant and wild-type tumors.
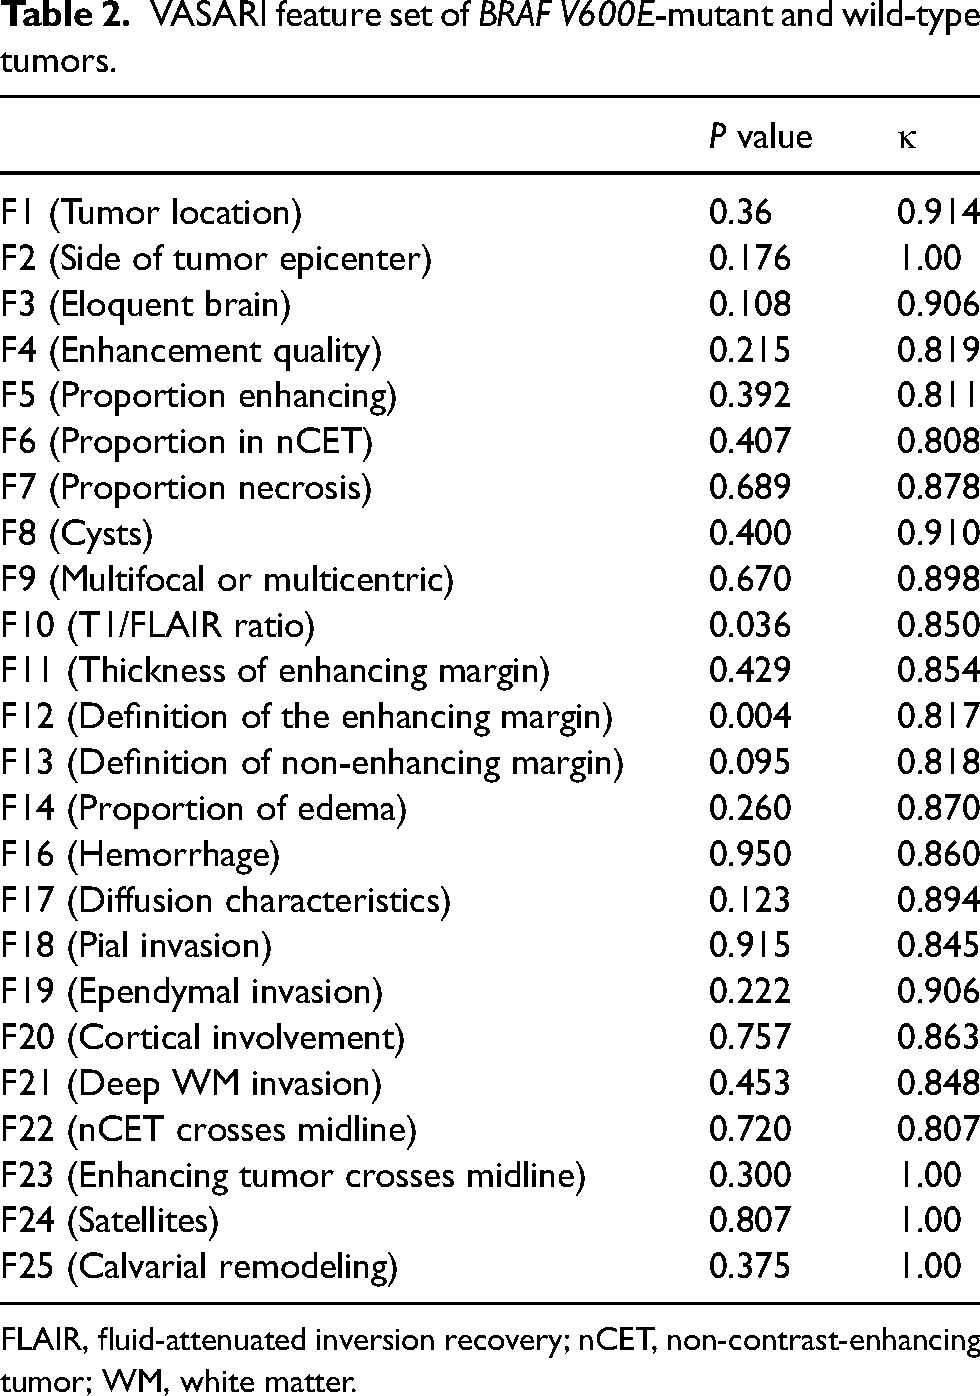
FLAIR, fluid-attenuated inversion recovery; nCET, non-contrast-enhancing tumor; WM, white matter.
Among conventional MRI features, F10 (T1/FLAIR ratio) and F12 (enhancing margin) showed significant differences between the BRAF V600E-mutant and BRAF V600E-wild groups (P = 0.036 and 0.007, respectively). In addition, significant differences were also noted in the rADCmea value between the two groups (P = 0.004). The relevant MRI scans are shown in Figs. 1 and 2. Binary logistic regression analysis revealed that only the rADCmea value was the independent predictive factor for BRAF V600E status (P = 0.027). In the ROC curve analysis, F12 provided a relatively high diagnostic performance in the discrimination of BRAF V600E status, with an area under the ROC curve (AUC) of 0.729 (Table 3). The optimal cutoff value of >1.35 for the rADCmea value provided a remarkable diagnostic value for differentiating the BRAF V600E-wild group from the BRAF V600E-mutant group (AUC = 0.783). By combining F12 and rADCmea values, the diagnostic capacity was improved to an AUC of 0.836, sensitivity of 87.50%, and specificity of 75.00%. Other imaging features, including cysts, calcification, and hemorrhage, were not significantly different between the two groups. The agreements of the two readers for conventional MRI features were almost excellent (Tables 1 and 2).
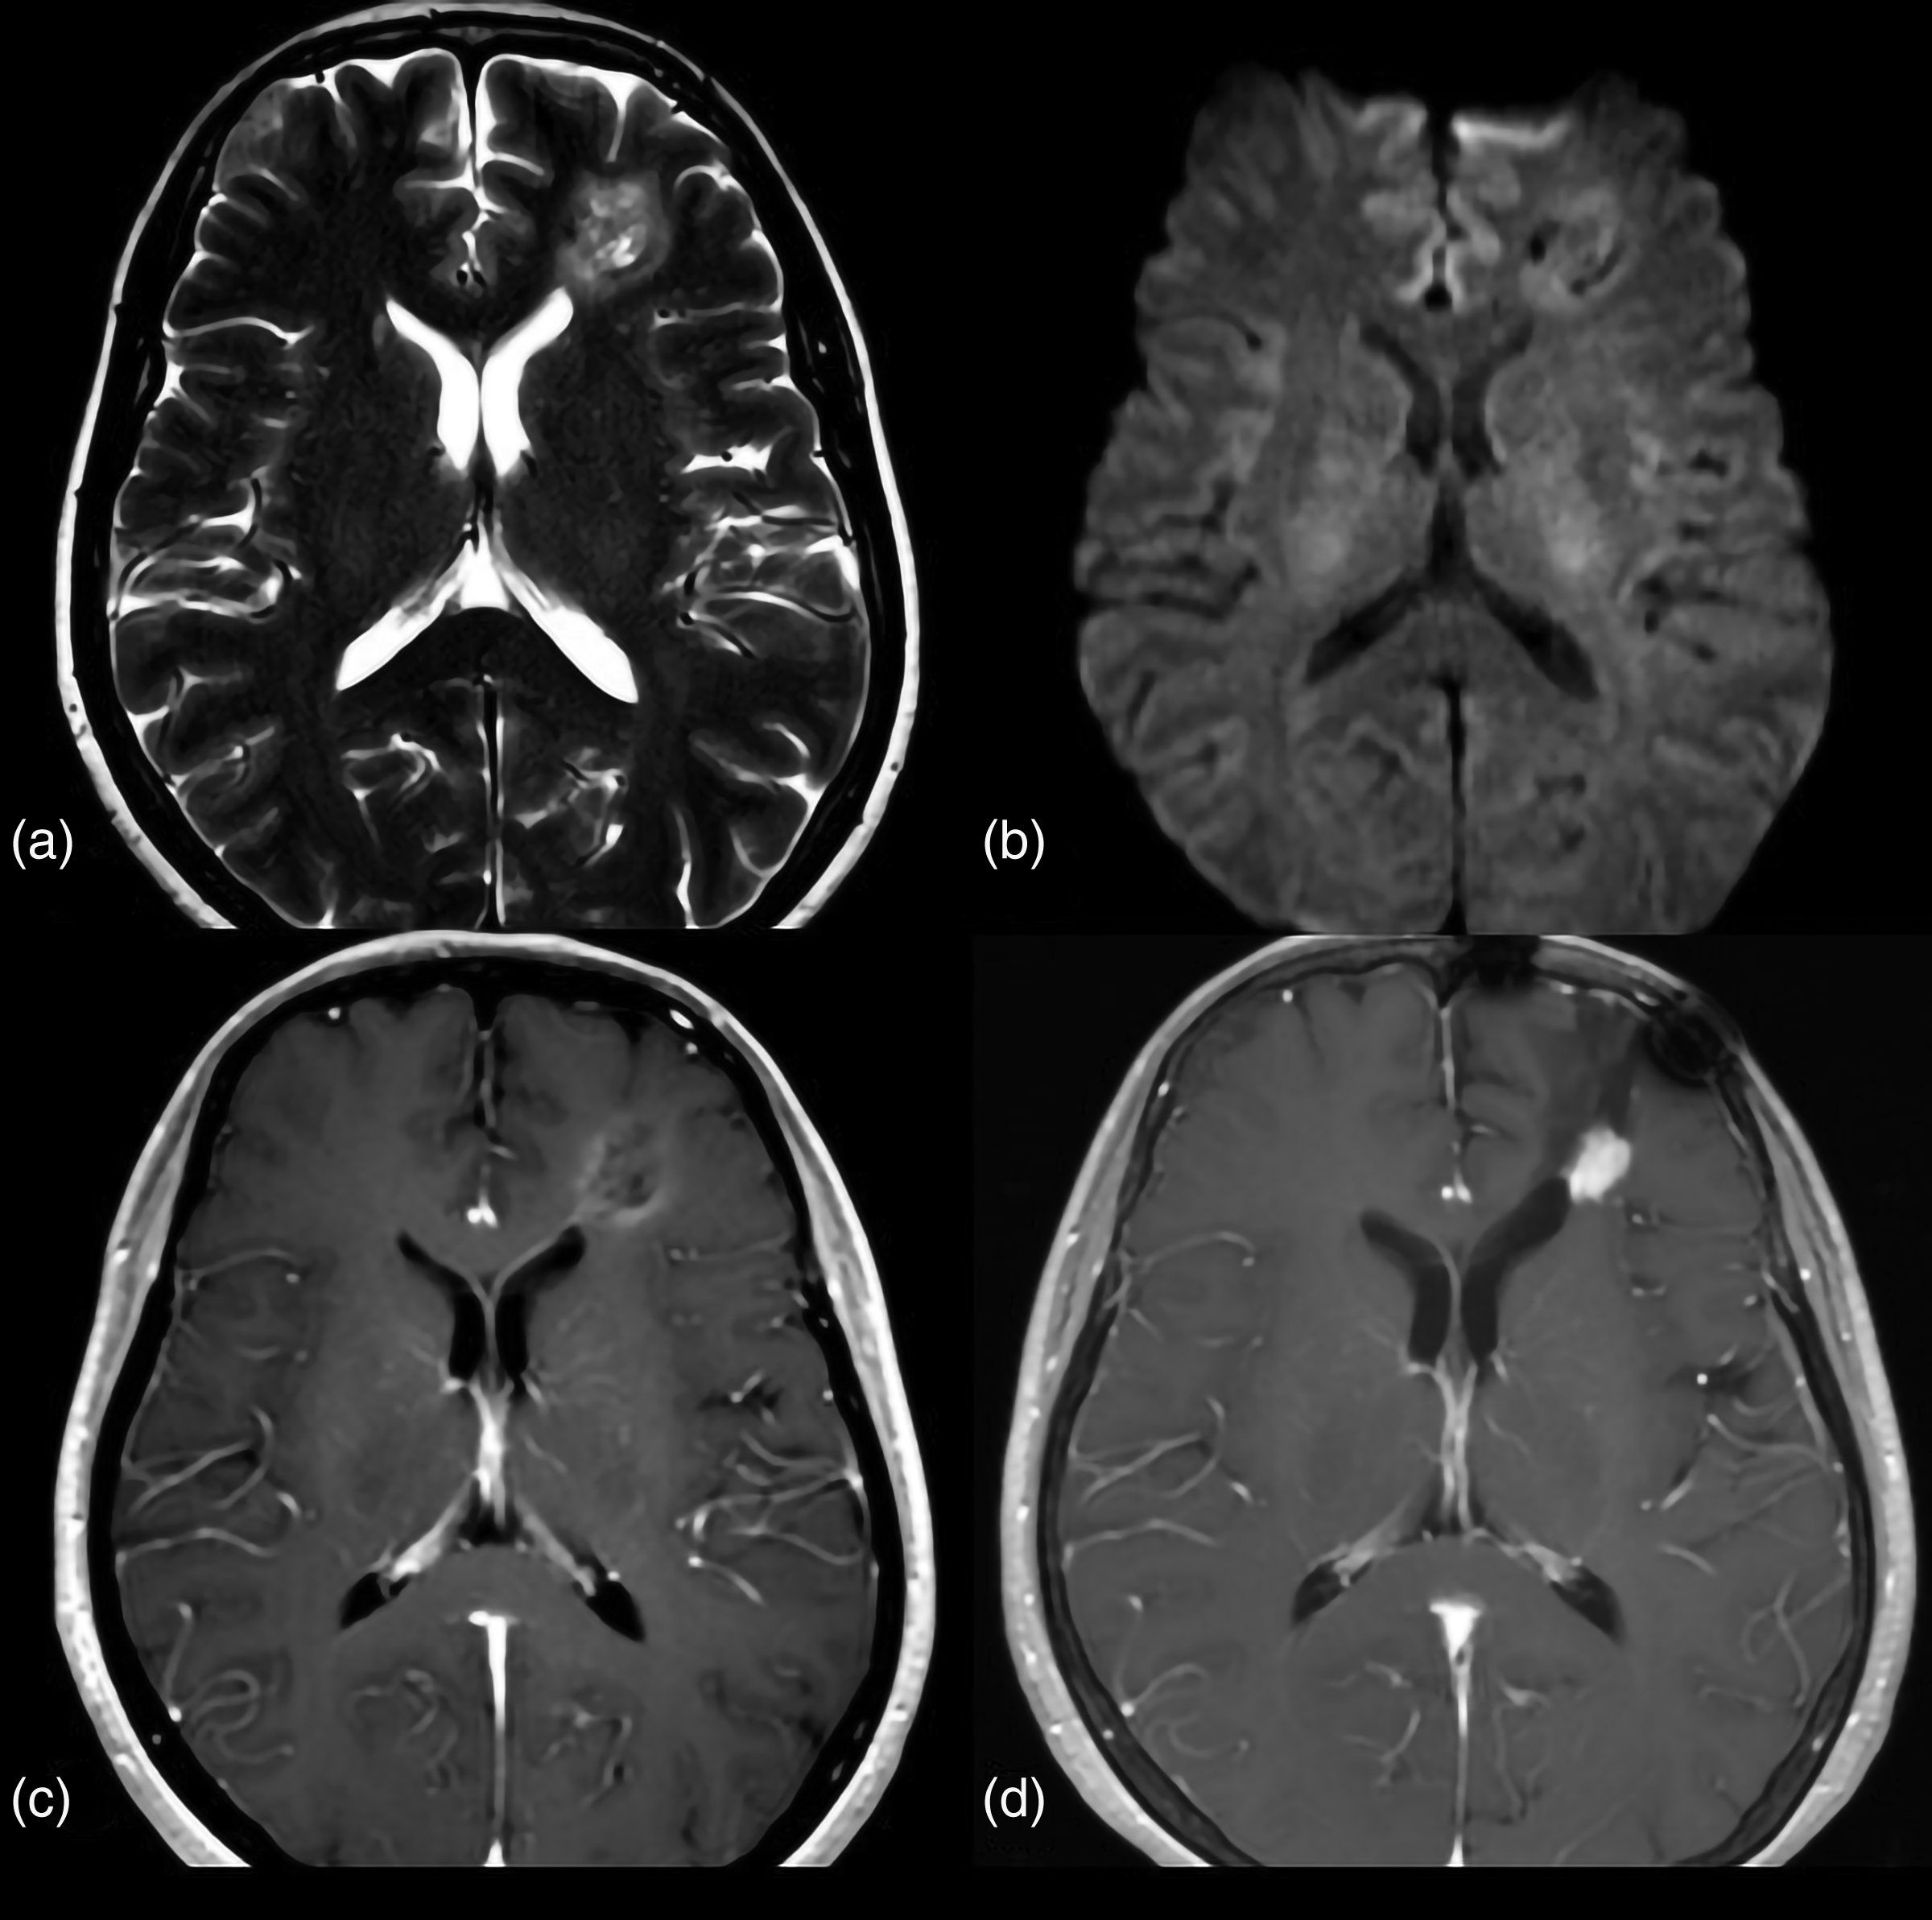
A 55-year-old woman with GG, BRAF V600E-mutant type. (a) Preoperative axial T2W image shows a mass with relative hyperintense in the left frontal lobe. (b) There is no restricted diffusion in the solid tumor area on DWI, corresponding rADCmean value = 1.18. (c) Axial contrast-enhanced T1W image shows the mass is heterogeneous enhancement with an ill-defined margin. (d) The follow-up MR image performed two years later (after surgery) demonstrated a recurrence of the mass. The patient was confirmed as having recurrent atypical GG by histopathology. DWI, diffusion-weighted imaging; GG, ganglioglioma; MR, magnetic resonance; rADCmean, mean relative apparent diffusion coefficient; T1W/T2W, T1-/T2-weighted.
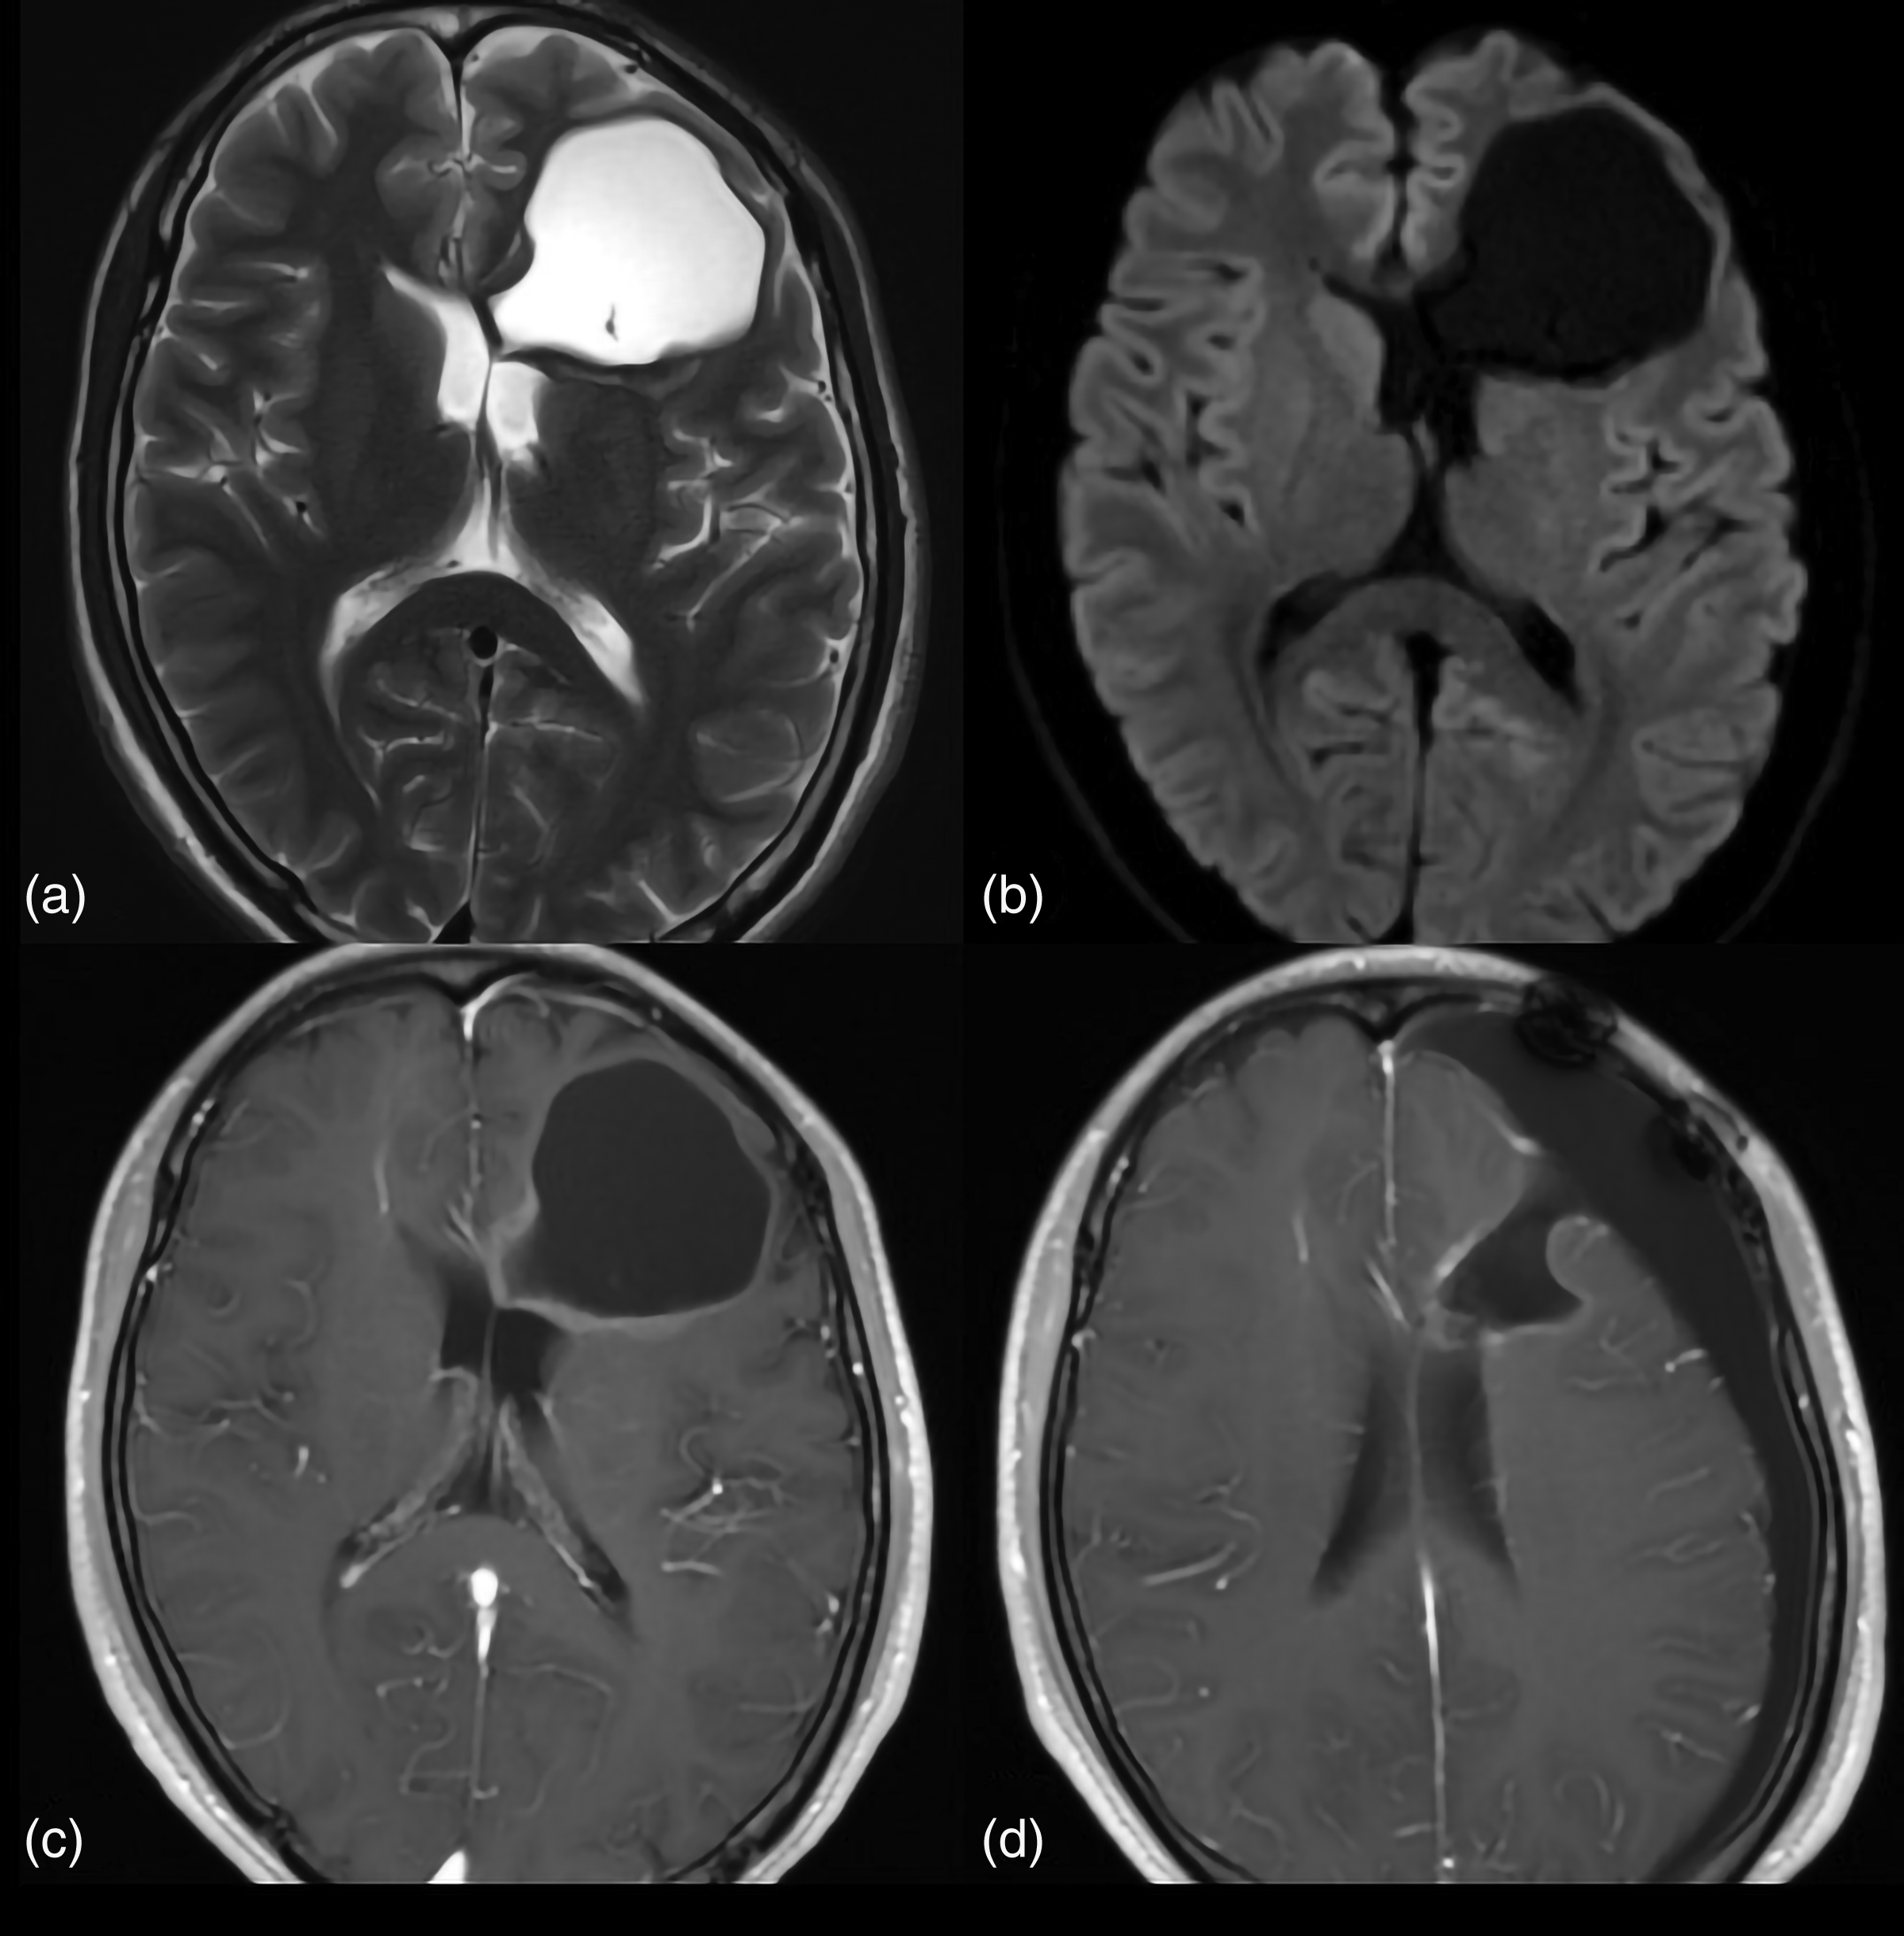
A 19-year-old man with GG, BRAF V600E-wild type. (a) Preoperative axial T2W image shows a cystic mass in the left frontal lobe. (b) There is no restricted diffusion in the tumor area on the DWI, corresponding rADCmean value = 1.37. (c) Axial contrast-enhanced T1W image shows the mass is minimally enhanced with a well-defined margin. (d) The follow-up MR image performed one year later (after surgery) showed non-progression. DWI, diffusion-weighted imaging; GG, ganglioglioma; MR, magnetic resonance; rADCmean, mean relative apparent diffusion coefficient; T1W/T2W, T1-/T2-weighted.
Receiver operating characteristic results of imaging features in the differentiation of BRAF V600E-mutant and wild-type tumors.
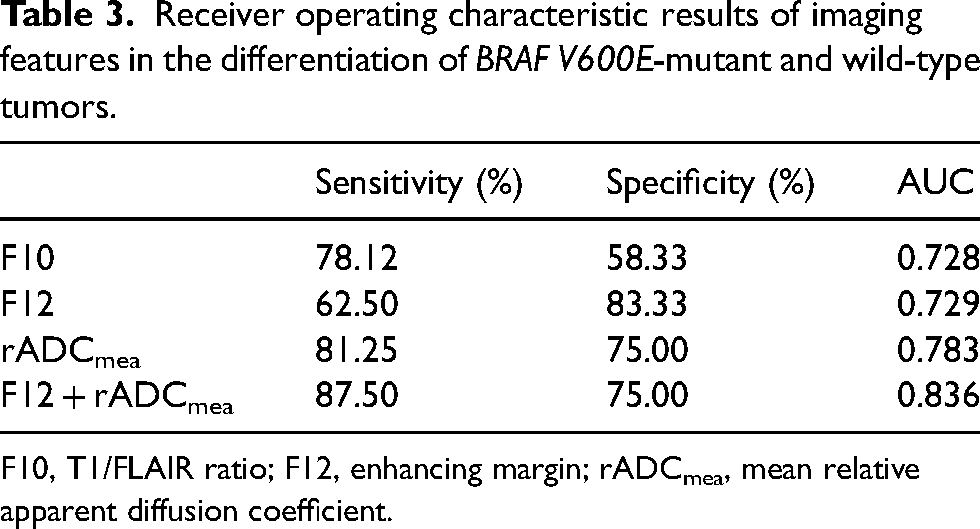
F10, T1/FLAIR ratio; F12, enhancing margin; rADCmea, mean relative apparent diffusion coefficient.
Tumor progression occurred in 19 of the 44 patients during follow-up; the median follow-up period was 14.5 months (range = 1–84 months). In the univariate regression analysis, age at diagnosis (P = 0.032), WHO grade (P = 0.020), enhancing margin (P = 0.029), and rADCmea value (P = 0.005) were significant prognostic factors for PFS (Table 3). In the multivariate Cox regression analysis, increasing age (P = 0.04, hazard ratio [HR] = 1.04, 95% confidence interval [CI] = 1.002–1.079) and lower rADCmea values (P = 0.021, HR = 0.036, 95% CI = 0.002–0.602) were associated with poor PFS (Table 4). All patients who had partial resection and followed concurrent chemoradiotherapy were diagnosed with disease progression. Nevertheless, since only four patients underwent partial resection, we did not perform survival curve analysis for treatment methods.
Univariate analysis and multivariate Cox analysis of clinical and imaging features in relation to progression-free survival.
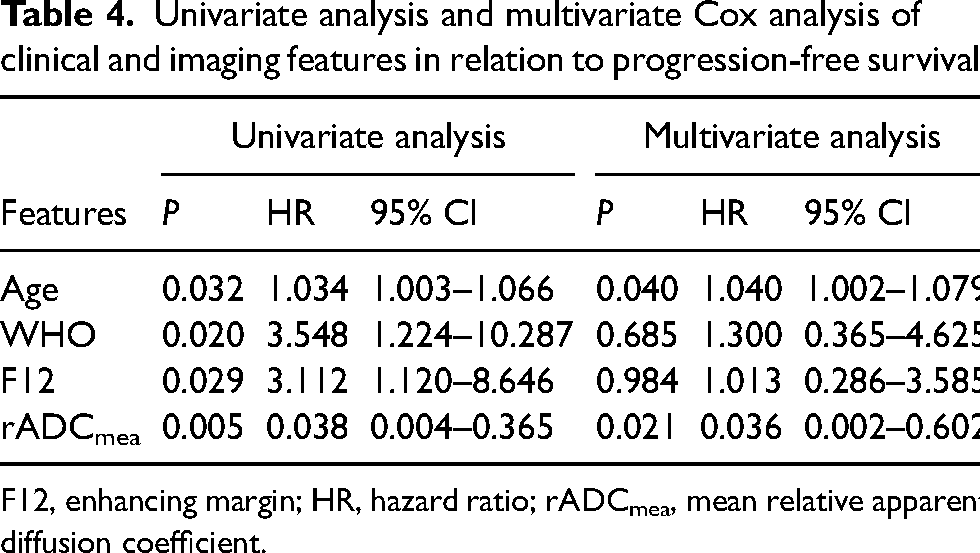
F12, enhancing margin; HR, hazard ratio; rADCmea, mean relative apparent diffusion coefficient.
Discussion
In the present study, we demonstrated the detailed MRI manifestations and clinical outcomes of 44 patients with BRAF V600E status in GGs and PXAs. The results of our study showed that T1/FLAIR ratio, enhancing margin, and rADCmea value were associated with BRAF V600E status and rADCmea value was the independent predictive factor of BRAF V600E status. In addition, patients with lower rADCmea values had a shorter PFS than those with higher rADCmea value.
BRAF is a key member in the mitogen-activated protein kinase (MAPK) pathway (20). The MAPK pathway takes part in various cellular functions, including cell proliferation, cell cycle control, differentiation, and apoptosis (21). The vast majority of BRAF mutations is the V600E type, which is characterized by the substitution of valine by glutamate, leading to constitutive activation of MAPK pathway (22). In the present study, the BRAF V600E mutation was harbored in 15/21 (71.43%) GGs and in 17/23 (73.91%) PXAs, consistent with prior studies (9). In previous studies, the BRAF V600E mutation was reported to be a predilection for the temporal lobe in PXAs and the supratentorial site in GGs (23,24). In our study, although the BRAF V600E mutation was found more frequently in the temporal lobe and supratentorial site (n = 30/44), no significant difference was observed between location and BRAF V600E status. This could be attributed to the small sample size in our study.
The present study demonstrated that tumor-enhancing margin and T1/FLAIR ratio were associated with BRAF V600E status. BRAF V600E-mutant GGs or PXAs more frequently presented ill-defined enhancing margin, which was consistent with the studies by Shrot et al. and Trasolini et al. (25,26). Although the reasons for this association are still unclear, several studies have investigated the relationship on the micro level. Liu et al. (27) reported three GGs with BRAF V600E mutation, all of which showed ill-defined and infiltrative growth pattern. Similarly, Bannykh et al. (28) revealed that a BRAF V600E-mutant pilocytic astrocytoma showed an infiltrative and diffuse appearance on microscopic pathological evaluation.
DWI can non-invasively evaluate the tumor microstructural characteristics by measuring the ADC value (29). ADC values have been widely used to investigate astrocytomas and their genomic characteristics (30,31). The results of our study showed that the rADCmea value of the BRAF V600E-wild group was significantly higher than that of the mutation group, which was consistent with the results of Ramaglia et al. (18). The etiology of the ADC value changes in the BRAF V600E-mutant group may be multifactorial. On one hand, low mitotic activity and a decrease in Ki-67 proliferation index have been reported in BRAF V600E-mutant low-grade gliomas, which might result in an increase of the ADC value. On the other hand, BRAF V600E immunostaining positively correlated with prominent inflammatory cell infiltration, and thereby could potentially reduce ADC values (32). These two reasons cause different ADC changes and further research may be warranted to better define the relationship between ADC values, tumoral microarchitecture, and lymphocytic infiltration.
Our study determined that the diagnostic capacity is not high based on a single MR feature in the discrimination of BRAF V600E status. However, the combination of F12 and rADCmea value remarkably improved the diagnostic accuracy (AUC = 0.836), indicating that, to some degree, this combination might serve as an optimal method for neuroradiologist to distinguish the BRAF V600E status in clinical work.
The results from the present study also suggested that increasing age and higher WHO grade were associated with a poor outcome, in line with other studies (33). In addition, patients with an ill-defined enhancing margin had a shorter PFS. The possible mechanism is that the obscure boundary makes it difficult to radically remove the tumor and the residual tissue is the main source of tumor recurrence. Most interestingly, in our study, tumors with lower rADCmea values had a significantly shorter PFS. Several studies have demonstrated the association of diffusion metrics with survival in gliomas. For instance, Feroca et al. reported worse outcomes in grade III astrocytomas with lower ADC values (34). However, this finding has not been previously described in GGs or PXA. There was no association between BRAF V600E status and PFS in our study. This could be related to the small sample size. Future prospective studies on a large scale are needed to validate our results.
The present study has some limitations. First, it has inherent biases due to its retrospective nature and relatively small sample size. Second, we did not perform a survival analysis for treatment methods due to the small number of subtotal resections. A multicentered large-scale investigation with complex multivariate regression analysis is needed to verify these results in future studies. In addition, some cases had a short-term follow-up. Moreover, in this study, imaging features were recorded by radiologists. Although the VASARI feature set has proven to be highly reproducible and an excellent inter-observer agreement based on the kappa statistical test has been achieved in this study, the interpretation of imaging features is still subject to inter-observer variability. Texture analysis or radiomics analysis based on whole tumor may decrease subjectivity in future studies.
In conclusion, our study demonstrated that the assessment of the tumor-enhancing margin and rADCmea value of GGs and PXAs may be helpful to predict BRAF V600E status. Moreover, a lower rADCmea value in GGs and PXAs was associated with early progression. This single method can be used by radiologists to indicate a genomic correlation of these tumors, which has potential therapeutic and prognostic implications.
Footnotes
Declaration of conflicting interests
The author(s) declared no potential conflicts of interest with respect to the research, authorship, and/or publication of this article.
Funding
The author(s) received no financial support for the research, authorship, and/or publication of this article.