
Abstract
Background
Hepatic hemangiomas are the most common benign liver tumors. It is important to know the imaging features of hemangiomas on gadoxetic acid (GA)-enhanced magnetic resonance imaging (MRI).
Purpose
To evaluate the qualitative and quantitative imaging features of hemangiomas on GA-enhanced MRI, and to compare imaging features of hemangiomas with and without pseudo-washout sign (PWS).
Material and Methods
We retrospectively included 93 cases of hemangioma that underwent GA-enhanced MRI. The presence of an enhancement pattern in the arterial phase (AP) and PWSs in the transitional phase (TP) were evaluated. Signal-to-norm ratios (SINorm) of hemangiomas, liver parenchyma, and portal vein (PV) as well as contrast-to-norm ratio (CNorm) were assessed. Additionally, hemangiomas with and without PWSs were defined as two separate subgroups, and imaging features were compared.
Results
Of the 93 cases of hemangiomas, 49 (52.6%) had PWSs in the TP. The mean SINorms of hemangiomas showed the highest value in the AP (P < 0.05). The mean CNorms showed positive values in the AP, and gradually decreased (P < 0.05). Hemangiomas with PWSs were significantly rapidly enhanced and smaller in size (P < 0.05), and the mean SINorms was lower in the TP (P = 0.023). While the mean CNorms showed a significant difference in the AP between subgroups (P < 0.001), the enhancement pattern was equal to that of the PV.
Conclusion
When evaluating GA-enhanced MRI, radiologists should utilize quantitative measures in addition to qualitative assessment and should be aware that SI matching with PV in all phases can be a distinguishing finding in the diagnosis of hemangioma.
Introduction
Hepatic hemangiomas are the most common benign liver tumor, with a frequency of up to 20% in the population (1). Hemangiomas are asymptomatic and often do not require treatment, so it is important to make the correct diagnosis using non-invasive methods. Typical imaging features with a high specificity and sensitivity of hemangiomas in different imaging modalities have been described previously (2,3). Specifically, on triphasic computed tomography (CT) and Gd-DTPA–enhanced magnetic resonance imaging (MRI), typical hemangiomas are characterized by peripheral nodular enhancement in the arterial phase (AP), centripedal fill-in enhancement in the portal venous phase (PVP), and prolonged enhancement in the transitional phase (TP) (3–6). However, rapidly enhanced high-flow hemangiomas, which constitute approximately half of hemangiomas <1 cm in diameter, and 20% of all hemangiomas, show rapid homogeneous contrast enhancement in the AP and perilesional arterioportal shunts, and may be confused with hypervascular tumors (1,3,6,7).
In the last 10 years, the clinical use of gadoxetic acid (GA), a hepatocyte-specific MRI contrast agent, has increased and has been shown to be of great benefit in the characterization of focal liver lesions (8–10). However, compared to extracellular gadolinium chelates, GA has different pharmacokinetic properties, including lower AP and higher PVP liver parenchyma enhancement, and is washed out from the intrahepatic arteries (11). This results in the contrast enhancement patterns of hemangiomas on GA-enhanced MRI being different from those when using other extracellular gadolinium chelates. An example of this is the pseudo-washout sign (PWS) seen in the TP on MRI conducted using GA. This occurs because the parenchyma surrounding the hemangioma has more intense contrast enhancement than the hemangioma and the hemangioma has a relatively lower signal intensity (SI) value (12). This situation causes a diagnostic problem between hemangiomas, hypervascular tumors, and hepatocellular carcinoma (13).
Several studies in the literature have evaluated the characteristics of hemangiomas with and without PWSs (13–15). However, to our knowledge, no studies have evaluated the qualitative and quantitative imaging features of hemangiomas in GA-enhanced MRI, and compared imaging features of hemangiomas with and without PWSs. The aims of the present study were to evaluate the qualitative and quantitative imaging features of hemangiomas on GA-enhanced MRI and to compare imaging features of hemangiomas with and without PWSs.
Material and Methods
This retrospective study was approved by the Institutional Ethics Committee (KAEK: 2022/82). Due to the retrospective nature of the study, the requirement for informed consent was waived. The study protocol conformed to the ethical guidelines of the 1975 Declaration of Helsinki.
Study population
We searched the institutional electronic medical database for patients meeting the following inclusion criteria for the period between November 2019 and November 2021: patients who (i) underwent a GA-enhanced MRI scan, and (ii) hemangioma was diagnosed by (a) consistent findings on at least two of three imaging modalities—ultrasound (US), triphasic CT, and dynamic MRI with extracellular gadolinium chelates—and (b) no change in size for at least 12 months on follow-up examination. On US, homogeneous, hyperechoic, and well-defined nodules that could give posterior acoustic enhancement were defined as hemangioma (16). The following were regarded as hemangiomas: on triphasic CT, the classical contrast enhancement pattern (peripheral nodular enhancement in the AP, centripedal fill-in enhancement in the PVP, and prolonged enhancement in the TP) or early homogeneous enhancement during AP, persistent enhancement to TP, and isoattenuation relative to enhancing intrahepatic vessels; and on MRI, lesions with a high SI similar to that of cerebrospinal fluid on T2-weighted (T2W) images with typical enhancement patterns similar to those described on triphasic CT (2,3,5,6,17,18). The exclusion criteria were as follows: (i) lack of follow-up imaging examinations; (ii) assessment using only one imaging modality; (iii) poor image quality on dynamic MRI images; and (iv) had histologic or clinical evidence of chronic liver disease or liver cirrhosis. In patients with multiple hemangiomas, each hemangioma was evaluated separately. The final study population consisted of 55 patients with 93 hemangiomas. Fig. 1 shows the patient selection.
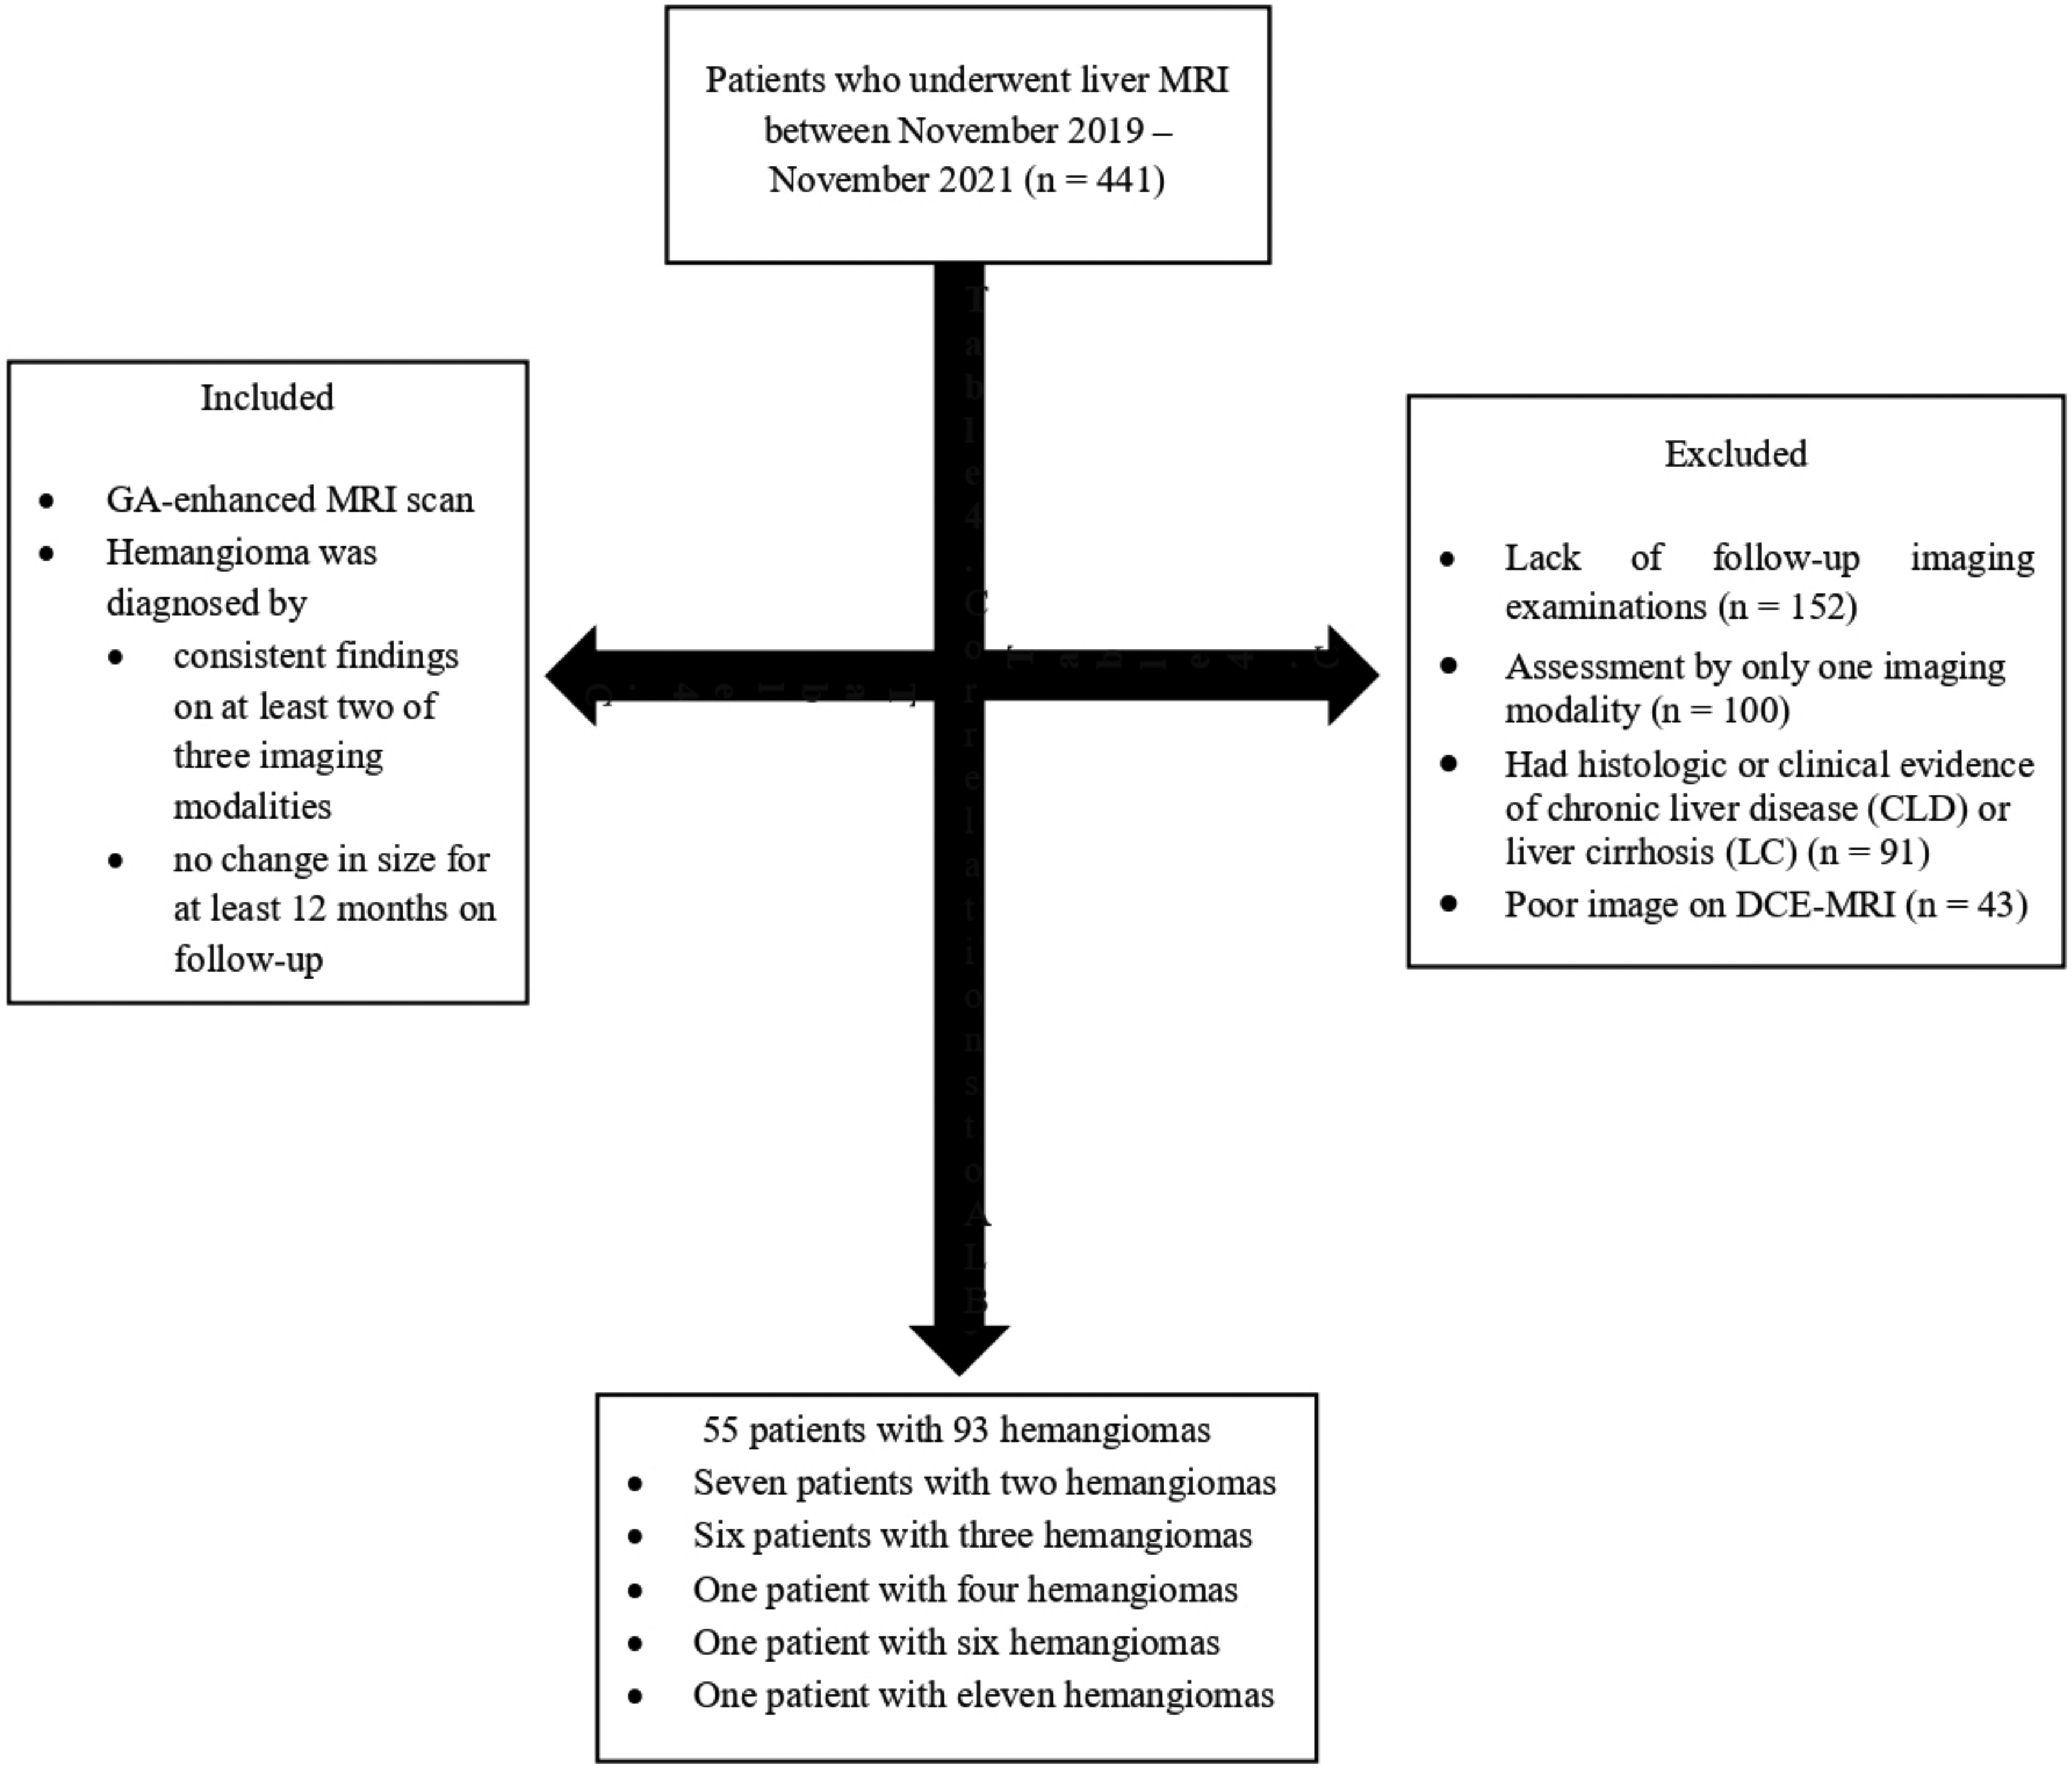
Flow chart of patient selection.
MRI protocol
All MRI examinations were performed on a 1.5-T MRI system (Magnetom Symphony; Siemens Medical Solutions, Erlangen, Germany) in the supine position by using a combined six-element phased-array abdominal coil. The non-enhanced protocol includes the following sequences: breath-hold T1-weighted (T1W) in-phase and out-of-phase images; breath-hold single-shot turbo-spin echo T2W images; respiration-triggered single-shot T2W images; and axial free-breathing single-shot echo-planar diffusion-weighted imaging (DWI) (b values of 0, 400, and 800 s/mm2). For enhanced MRI, a standard dose of GA (0.025 mmol/kg; Primovist, Bayer Healthcare, Leverkusen, Germany) was injected intravenously at a rate of 1.0 mL/s using a power injector and then followed by a 30-mL infusion of normal saline. The contrast-enhanced sequences comprised three-dimensional, T1W, volume-interpolated, breath-hold examinations (VIBE) sequences. Axial contrast-enhanced images were obtained before contrast injection and in the AP, PVP, TP, and hepatobiliary phase (HBP) (15–20 s, 70 s, 300 s, and 20 min after injection, respectively). AP timing was determined using the bolus-tracking system. Table 1 details the technical parameters of the MRI sequences.
Technical details of GA-enhanced MRI scanning parameters.
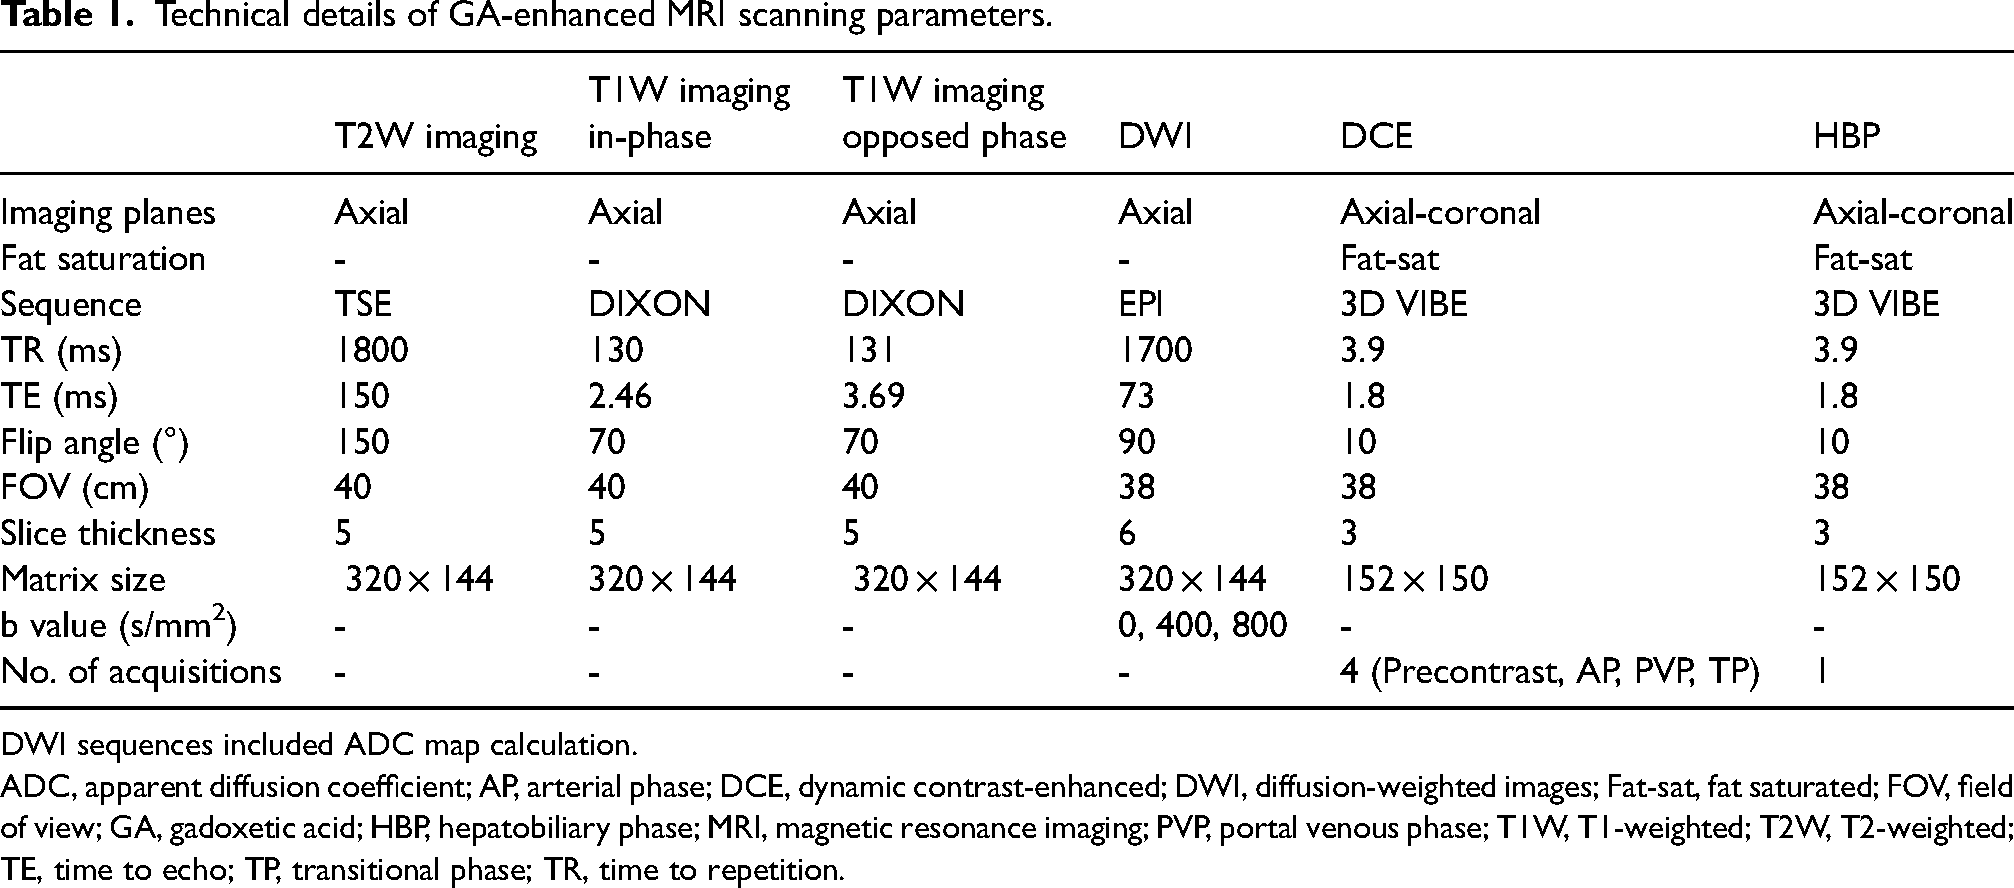
DWI sequences included ADC map calculation.
ADC, apparent diffusion coefficient; AP, arterial phase; DCE, dynamic contrast-enhanced; DWI, diffusion-weighted images; Fat-sat, fat saturated; FOV, field of view; GA, gadoxetic acid; HBP, hepatobiliary phase; MRI, magnetic resonance imaging; PVP, portal venous phase; T1W, T1-weighted; T2W, T2-weighted; TE, time to echo; TP, transitional phase; TR, time to repetition.
Image analysis
Qualitative evaluation
MRI scans of 55 patients with 93 hemangiomas were transferred to a picture archiving communication system (PACS). Two radiologists (reader 1, third year of training; and reader 2, second year of training) independently evaluated dynamic contrast-enhanced, and HBP GA-enhanced MRI images. The largest diameter of each hemangioma was recorded. The following features were evaluated on contrast-enhanced MRI images: peripheral nodular (typical) or rapid enhancement (high flow) in the AP; centripedal fill-in enhancement in the PVP; and PWSs in the TP (low SI relative to adjacent liver parenchyma without prolonged or fill-in enhancement). On AP images, rapid enhancement was defined when the extent of intratumoral hypervascular enhancement was >50% of the lesion, which showed a similar SI to that of the aorta (5). In addition, readers visually assessed the degree of enhancement of the enhanced portion of the hemangioma relative to the liver parenchyma in the AP, PVP, TP, and HBP using a 5-grade scale (grade 4 = hyperintense, grade 3 = slightly hyperintense, grade 2 = isointense, grade 1 = mild hypointense, grade 0 = hypointense). Any disagreements among readers were resolved during a third analysis session in consultation with a board-certified radiologist with 11 years of abdominal radiology experience.
Quantitative evaluation
SI was measured using the region of interest (ROI). ROI drawings and SI measurements were performed by a board-certified radiologist with 11 years of experience in abdominal radiology. In precontrast, AP, PVP, TP and, HBP images, ROIs were placed on 93 hemangiomas, liver parenchyma, portal vein (PV), and right paravertebral muscle regions. It was attempted to locate ROIs in the same regions in the sequential phase images of each patient. For each hemangioma, the ROI was drawn to cover as much of the enhanced portion as possible. In the ROI drawings for the liver parenchyma, care was taken to avoid arteries and artifacts, and three ROIs of equal size were placed on the lateral, anterior, and posterior segments of the liver parenchyma at the level of the liver hilum, and the average was calculated. The right major branch was used in ROI drawings for SI measurements of the PV. The right paravertebral muscle was used as a phantom to normalize the obtained SI values (signal-to-norm ratio [SINorm]), as the noise was not evenly distributed when parallel imaging was used. ROI drawings for the right paravertebral muscle were almost the same size and cross-section as those drawn on the liver parenchyma and PV. An example of ROI placement in all phases is presented in Fig. 2. The mean SINorm of the liver parenchyma, hemangioma, and PV in all phases were calculated as follows: [SIliver parenchyma/SImuscle, SIhemangioma/SImuscle, and SIPV/SImuscle]. Hemangioma-to-liver contrast-to-muscle ratio (contrast-to-norm ratio [CNorm]) were calculated using the formula [SIhemangioma–SIliver parenchyma]/SImuscle in all phases to determine the absolute SI changes in hemangiomas according to the liver parenchyma.

An example of ROI placement for quantitative analysis. The white ROI is drawn in the enhanced segment of the hemangioma. The red ROI is drawn in the anterior, lateral, and posterior liver parenchyma at the level of the liver hilus. The black ROI is drawn in the right major branch of the portal vein. The blue ROI was drawn in the right paravertebral muscle to be used as a phantom to normalize the SI. (a) Arterial phase. (b) Portal venous phase. (c) Transitional phase. (d) Hepatobiliary phase. ROI, region of interest; SI, signal intensity.
Statistical analysis
Statistical analyses were performed using SPSS software version 25 (IBM Corp., Armonk, NY, USA). The normality of data was assessed using a Kolmogorov–Smirnov test. Normally distributed quantitative data are presented as mean ± standard deviations (SDs). Categorical variables are presented as numbers and percentages. A Fisher's exact test was used to analyze categorical variables in hemangiomas, including enhancement patterns in all phases. A Mann–Whitney U test was used to analyze continuous variables, including hemangioma size and degree of visual enhancement of hemangiomas. We used weighted kappa (K) analysis to determine the inter-observer agreement on visual assessment of the enhancement of hemangiomas (K = 0.00–0.20, slight agreement; K = 0.21–0.40, fair agreement; K = 0.41–0.60, moderate agreement; K = 0.61–0.80, high agreement; and K = 0.81–1.00, almost perfect agreement). The repeated-measures analysis of variance model was used to compare the time courses of the SINorms of the liver parenchyma, hemangiomas, PV, and the CNorm in all phases. If the F score from the analysis of variance indicated a significant difference (P < 0.05), a pairwise comparison of individual mean differences was performed using a Bonferroni post hoc test. In addition, to better understand the characteristics of hemangiomas showing PWSs in the TP, subgroup analysis was performed to compare with those without PWSs using an unpaired Student's t test. Statistical calculations were performed using 95% confidence intervals (CIs). A P value <0.05 was considered statistically significant.
Results
The study included 55 patients (28 men, 27 women; mean age = 51.6 ± 10.4 years; age range = 27–70 years) with 93 hemangiomas. From the study, 16 (29%) of the patients had multiple hemangiomas (7 patients with 2 hemangiomas, 6 patients with 3 hemangiomas, 1 patient with 4 hemangiomas, 1 patient with 6 hemangiomas, and 1 patient with 11 hemangiomas).
Qualitative analysis of all hemangiomas
The mean diameter was 25 mm (range = 8–185 mm). The GA-enhanced MRI visual assessment characteristics of the hemangiomas are shown in Table 2. The results showing the grade of visual enhancement of hemangiomas are presented in Table 3. In the AP, 62.3% (58/93) of hemangiomas were hyperintense (grade 4, n = 29; grade 3, n = 29); 41.9% (39/93) of hemangiomas were isointense in the PVP; 41.9% (39/93) of hemangiomas were isointense; 52.6% (49/93) were hypointense (grade 1, n = 49) in the TP; and all hemangiomas were hypointense in the HBP (Figs. 3 and 4). Inter-observer agreement was almost perfect, with weighted K values in the range of 0.86–0.92 when assessing MRI features, and in the range of 0.88–1.00 regarding the visual grade of enhancement of hemangiomas.

A 45-year-old woman with hemangioma without pseudo-washout sign on GA-enhanced MRI. (a) Axial T2W image shows a bright high SI lesion in hepatic segment VIII (arrow). (b) The lesion shows low SI on the axial precontrast T1W MRI (arrow). (c) On the AP, the lesion shows peripheral nodular intermittent enhancement (arrow), and the visual enhancement grade is classified as 4. (d) On the PVP, the lesion shows centripedal fill-in enhancement (arrow), and the visual enhancement grade is classified as 4. (e) On the TP, the lesion shows prolonged enhancement (arrow), and the visual enhancement grade is classified as 3. (f) On the HBP, the lesion shows low SI (arrow), and the visual enhancement grade is classified as 0. AP, arterial phase; GA, gadoxetic acid; HBP, hepatobiliary phase; MRI, magnetic resonance imaging; PVP, portal venous phase; SI, signal intensity; T1W/T2W, T1/T2-weighted; TP, transitional phase.
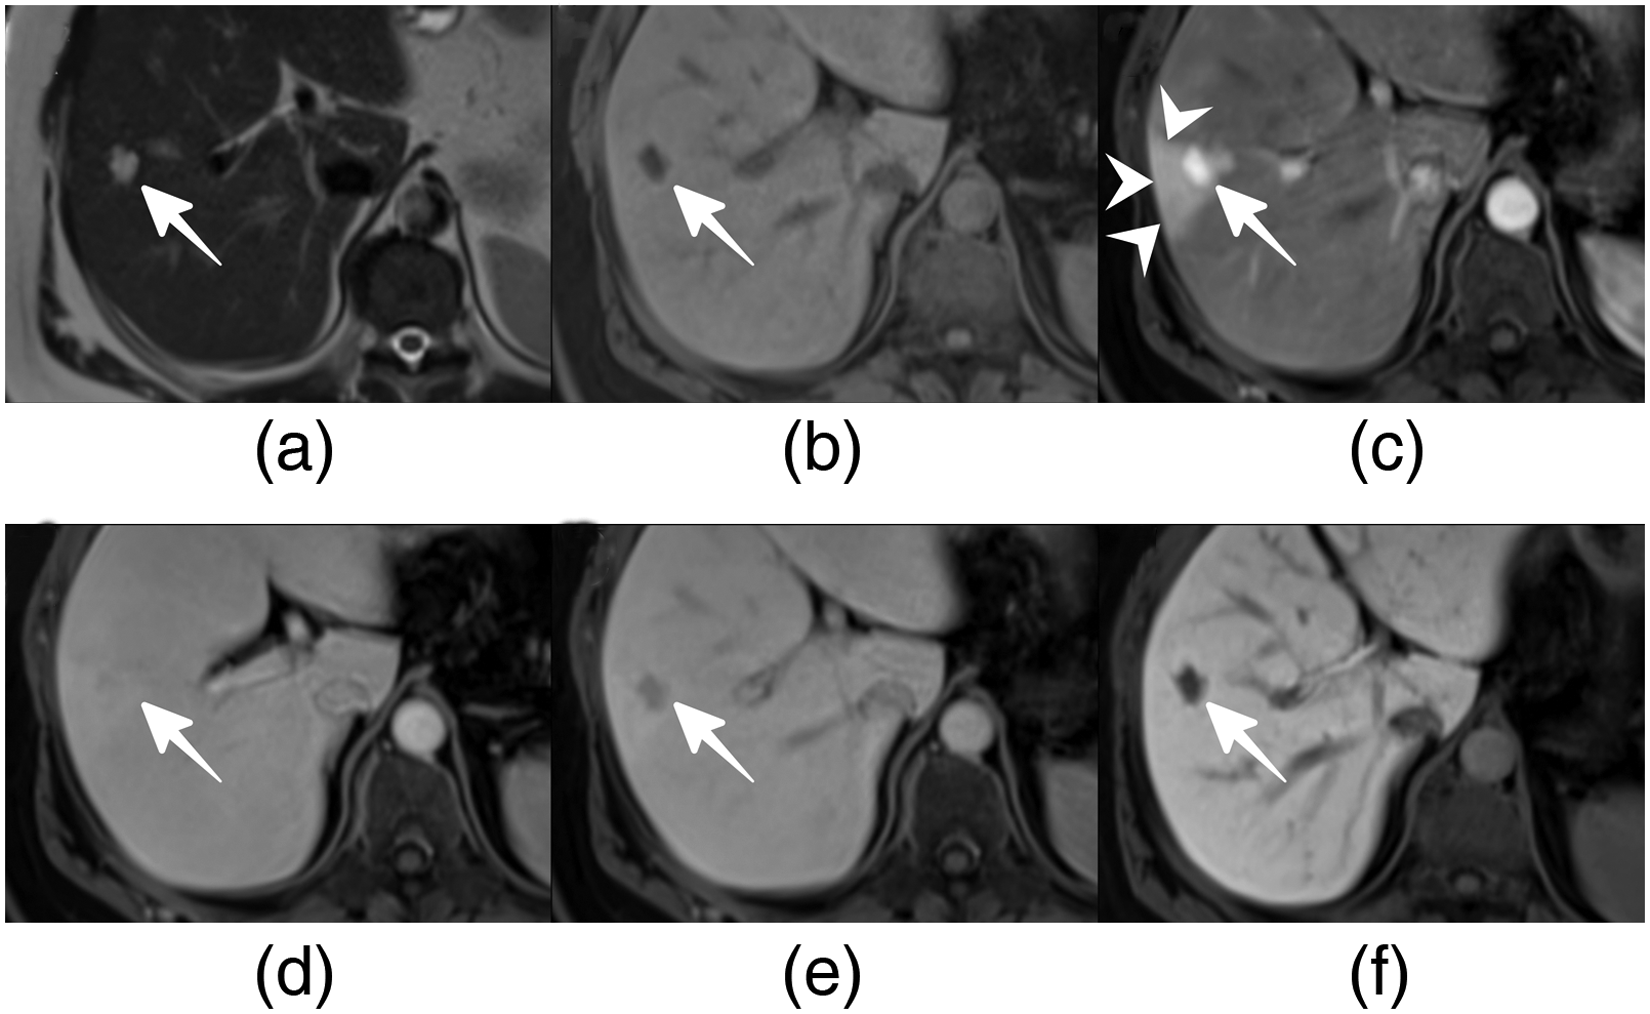
A 48-year-old woman with hemangioma with pseudo-washout sign on GA-enhanced MRI. (a) Axial T2W image shows a bright high SI lesion in hepatic segment VIII (arrow). (b) The lesion shows low SI on the axial precontast T1W MRI (arrow). (c) On the AP, the lesion shows rapid enhancement (arrow) and arteriovenous shunts (arrowheads), and the visual enhancement grade is classified as 4. (d) On the PVP, the lesion shows isointensity (arrow) compared with liver parenchyma, and the visual enhancement grade is classified as 2. (e) On the TP, the lesion shows the pseudo-washout sign (arrow), and the visual enhancement grade is classified as 1. (f) On the HBP, the lesion shows low SI (arrow), and the visual enhancement grade is classified as 0. AP, arterial phase; GA, gadoxetic acid; HBP, hepatobiliary phase; MRI, magnetic resonance imaging; PVP, portal venous phase; SI, signal intensity; T1W/T2W, T1/T2-weighted; TP, transitional phase.
Frequencies of visual assessment imaging features of all hemangiomas on GA-enhanced MRI.
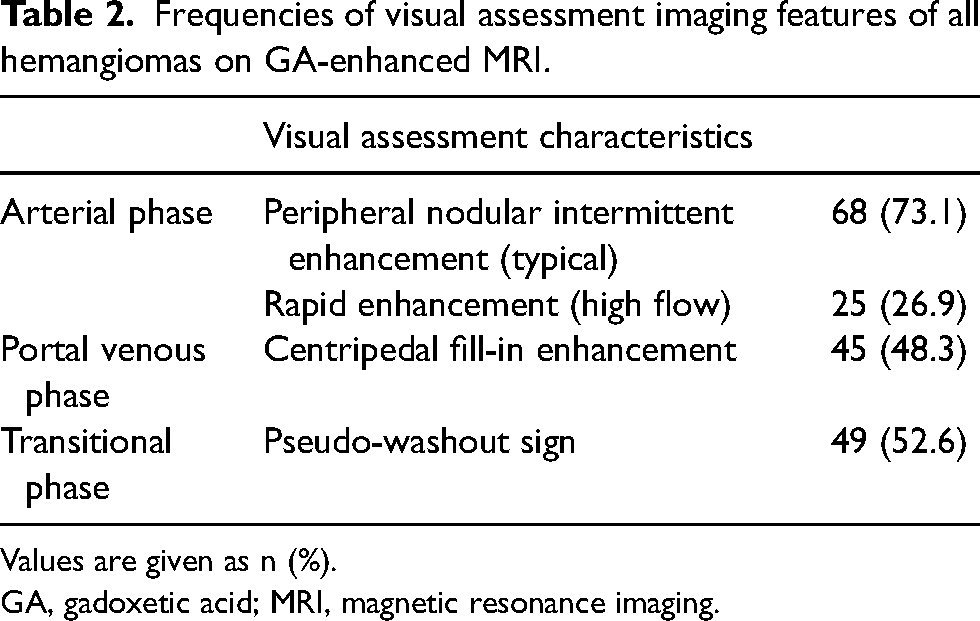
Values are given as n (%).
GA, gadoxetic acid; MRI, magnetic resonance imaging.
Predominant visual enhancement grade of 93 hemangiomas with and without pseudo-washout sign in each phase on dynamic contrast-enhanced MRI obtained using GA.
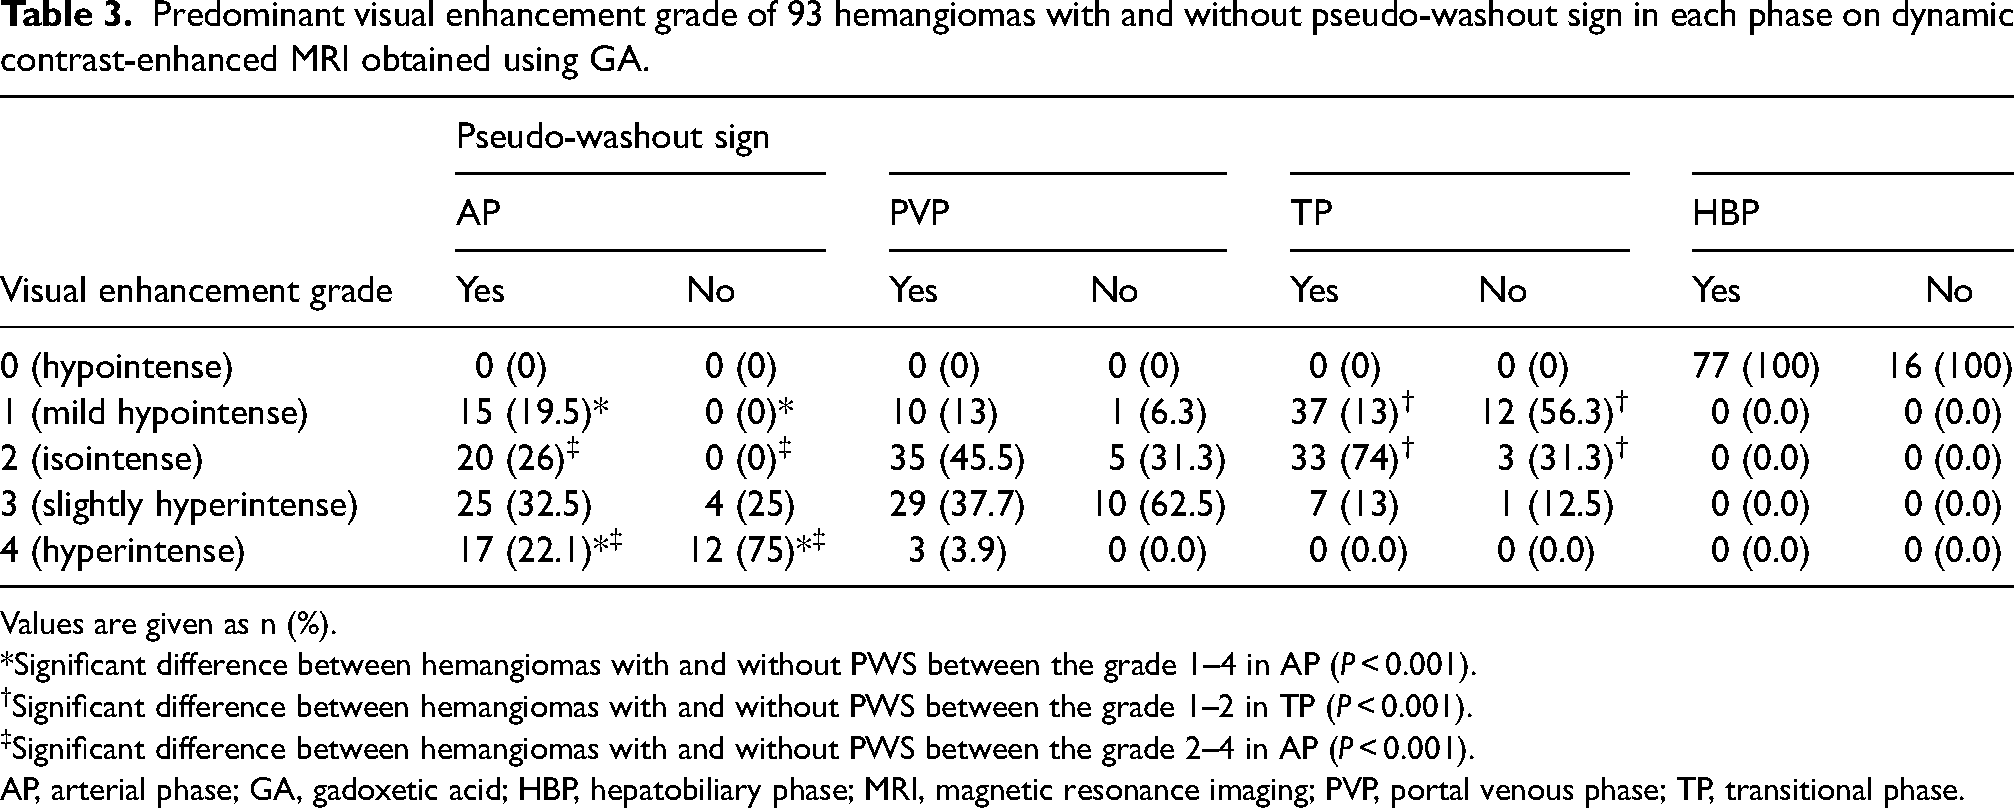
Values are given as n (%).
*Significant difference between hemangiomas with and without PWS between the grade 1–4 in AP (P < 0.001).
Significant difference between hemangiomas with and without PWS between the grade 1–2 in TP (P < 0.001).
Significant difference between hemangiomas with and without PWS between the grade 2–4 in AP (P < 0.001).
AP, arterial phase; GA, gadoxetic acid; HBP, hepatobiliary phase; MRI, magnetic resonance imaging; PVP, portal venous phase; TP, transitional phase.
Quantitative analysis of all hemangiomas
SI measurements of all hemangiomas, PV, liver parenchyma, and right paravertebral muscle were performed successfully. Figs. 5 and 6 summarize the results of the quantitative analysis. The mean SINorm of hemangiomas showed the highest value in the AP and then subsequently decreased. Except for the pairwise comparison of the AP and the PVP, the mean SINorm values found in the comparisons between all phases were statistically significant (P = 0002 to P < 0.001).
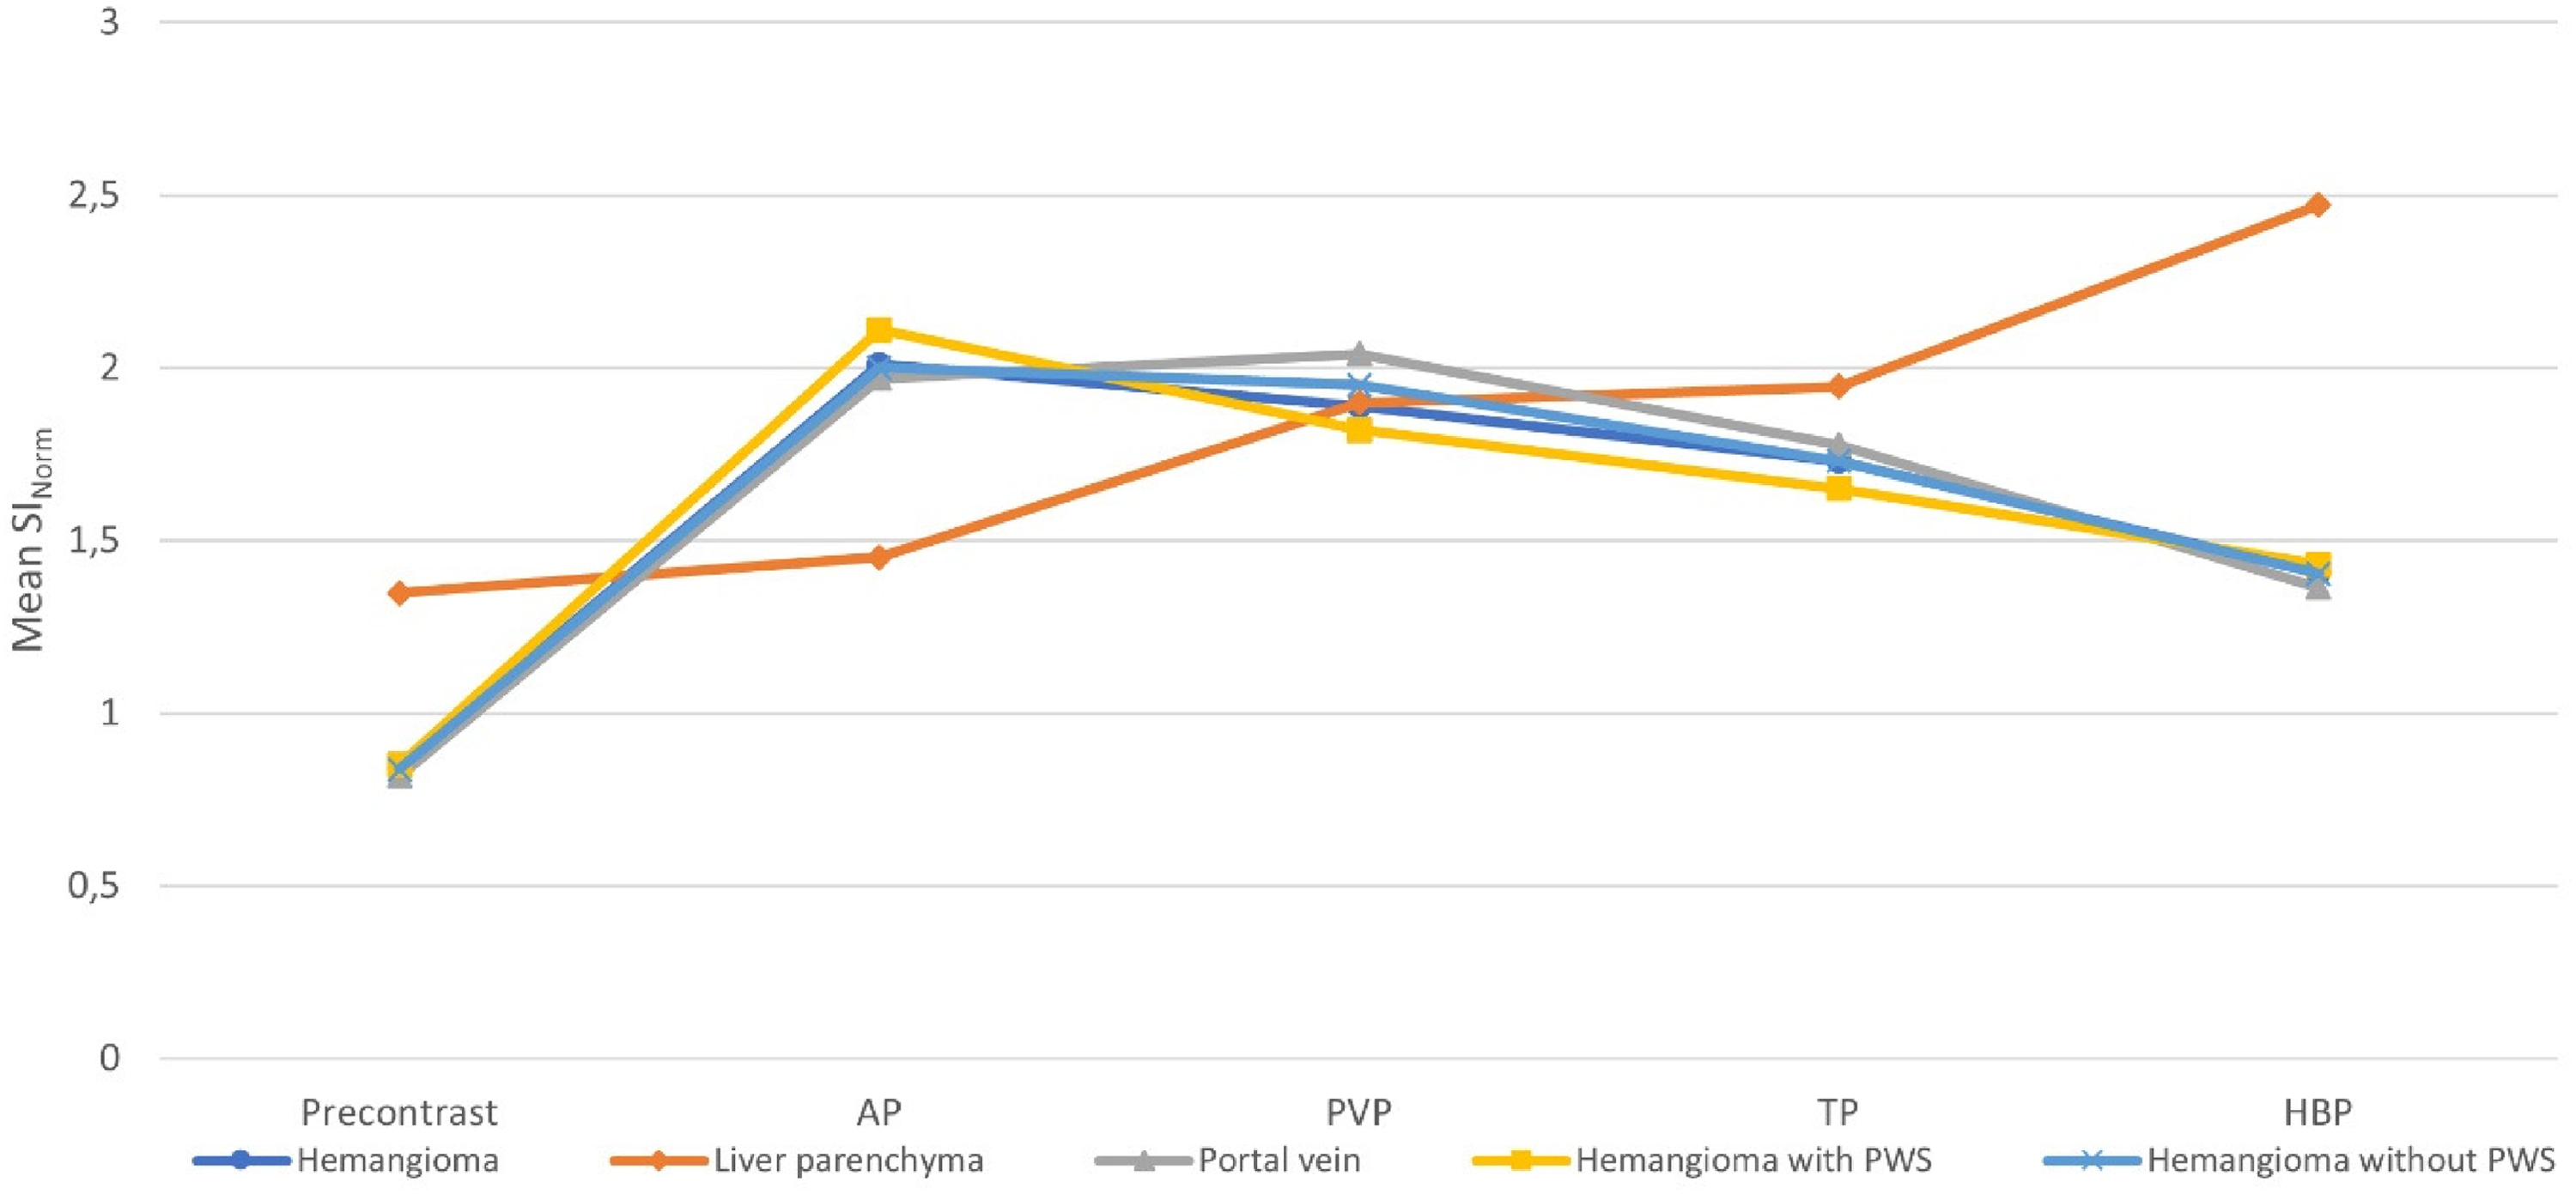
The plot shows mean signal-to-norm ratios (SINorms) of the liver parenchyma, all hemangiomas, hemangiomas with and without PWS, and portal vein (PV) before and during dynamic contrast-enhanced MRI after GA injection in 93 hemangiomas. The mean SINorm of the liver parenchyma increased significantly until HBP after GA administration. The mean SINorms of all 93 hemangiomas showed highest value on AP and subsequently decreased over time. The mean SINorms of hemangiomas with and without PWSs were significantly different in the AP and the PVP, but the patterns of time to SINorms curves were equivalent (arterial enhancement following gradually decreased enhancement pattern). Patterns of time to SINorm curves of two hemangioma types were similar to those of PV. AP, arterial phase; GA, gadoxetic acid; HBP, hepatobiliary phase; MRI, magnetic resonance imaging; PVP, portal venous phase; PWS, pseudo-washout sign; TP, transitional phase.
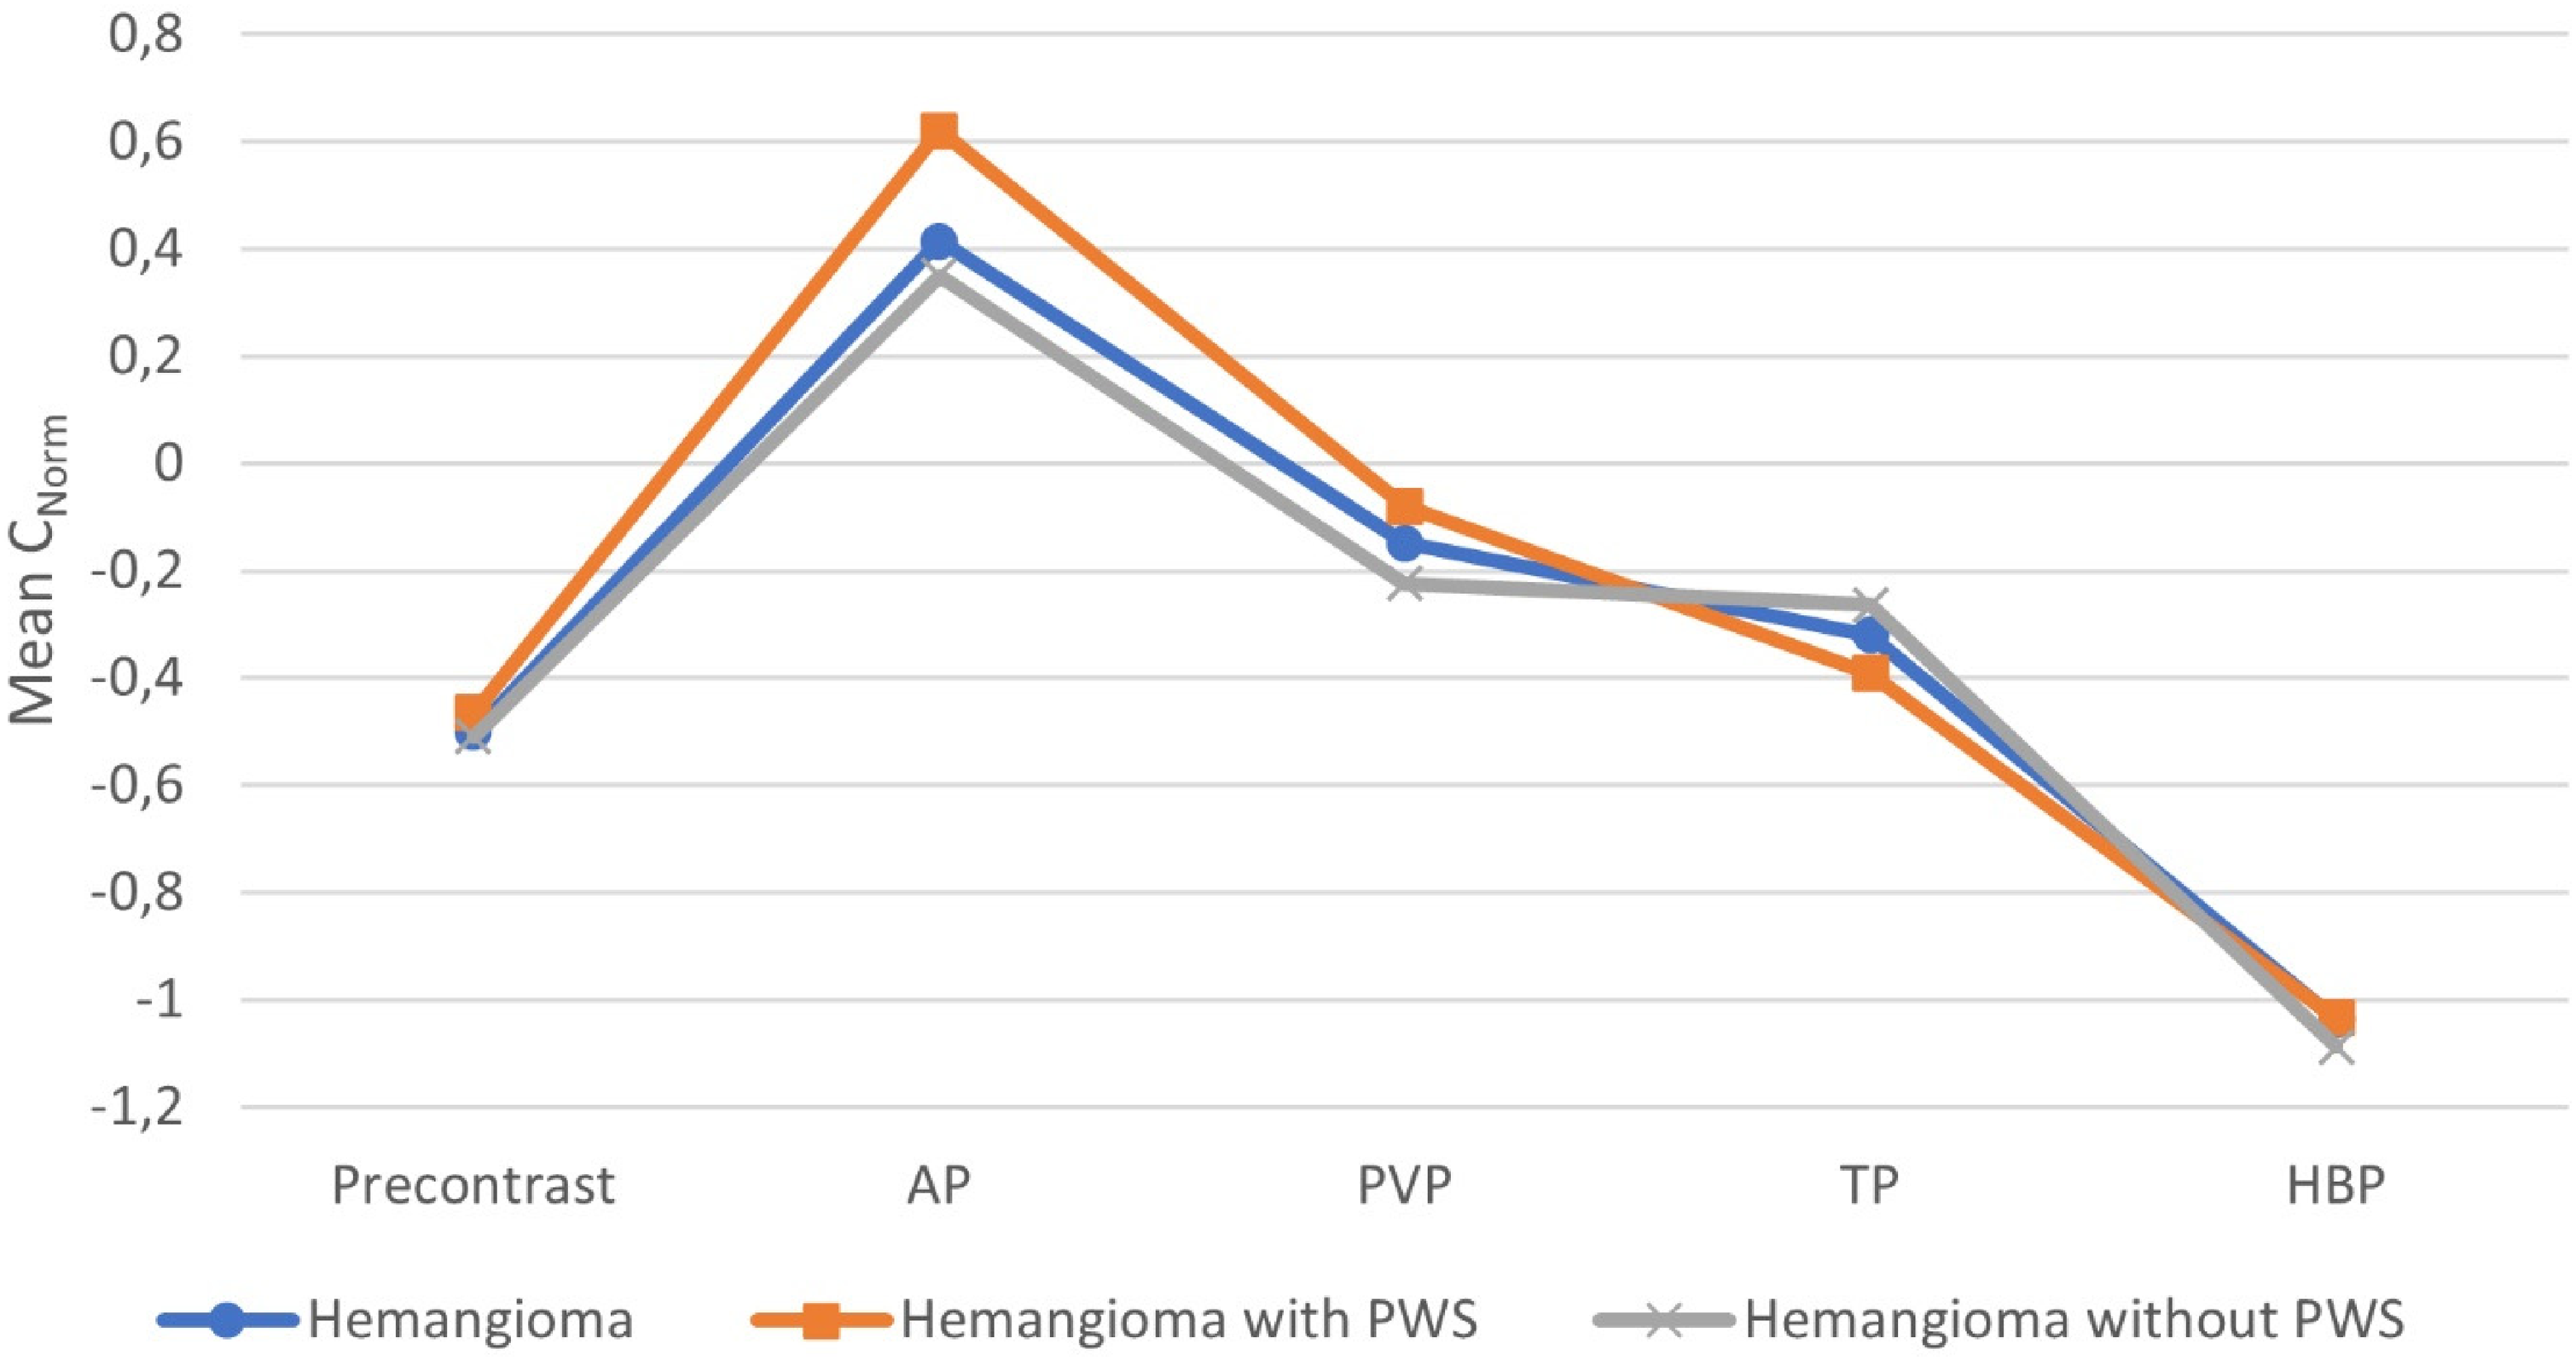
The plot shows mean hemangioma-to-liver contrast-to-muscle ratio (Cnorm) before GA injection and during the AP, PVP, TP, and HBP of dynamic contrast-enhanced MRI obtained with GA in all 93 hemangiomas, with and without PWSs. AP, arterial phase; GA, gadoxetic acid; HBP, hepatobiliary phase; MRI, magnetic resonance imaging; PVP, portal venous phase; TP, transitional phase.
The mean SINorm of the liver parenchyma increased significantly over time from precontrast to the HBP, and there was a significant difference between pairwise comparisons of phases (P = 0.004 to P < 0.001). The mean SINorm of the PV peaked in the PVP and then decreased. Except for the comparison between the AP and the PVP in pairwise comparisons, the mean SINorm values obtained were statistically significant (P = 0.023 to P < 0.001). The mean CNorms showed positive values in the AP and gradually decreased to have negative values in other subsequent phases. There were statistically significant differences in mean CNorms between all phases (P = 0.017 to P < 0.001).
Comparison of qualitative and quantitative imaging features between the hemangiomas with and without PWSs
The qualitative and quantitative imaging features of hemangiomas with and without PWSs are presented in Table 4. Hemangiomas with PWSs were significantly smaller in size than those without PWSs (16.6 ± 24.5 vs. 28.6 ± 23.8 mm, P = 0.043). Rapid enhancement in the AP was greater in hemangiomas with PWSs (42.9%) than in those without (9.1%) (P < 0.001). Again, statistically significant differences were found in peripheral nodular enhancement in the AP and centripedal fill-in enhancement in the PVP between hemangiomas with and without PWSs (57.1% vs. 90.9%, P < 0.001; 22.4% vs. 77.2%, P < 0.001). There was a significant difference between hemangiomas with and without PWSs between the visual enhancement grades 1–4 and 2–4 in the AP, and between the visual enhancement grades 1–2 in the TP (P < 0.001) (Table 3).
Comparison of qualitative and quantitative imaging features of hemangiomas with and without pseudo-washout sign on GA–enhanced MRI.
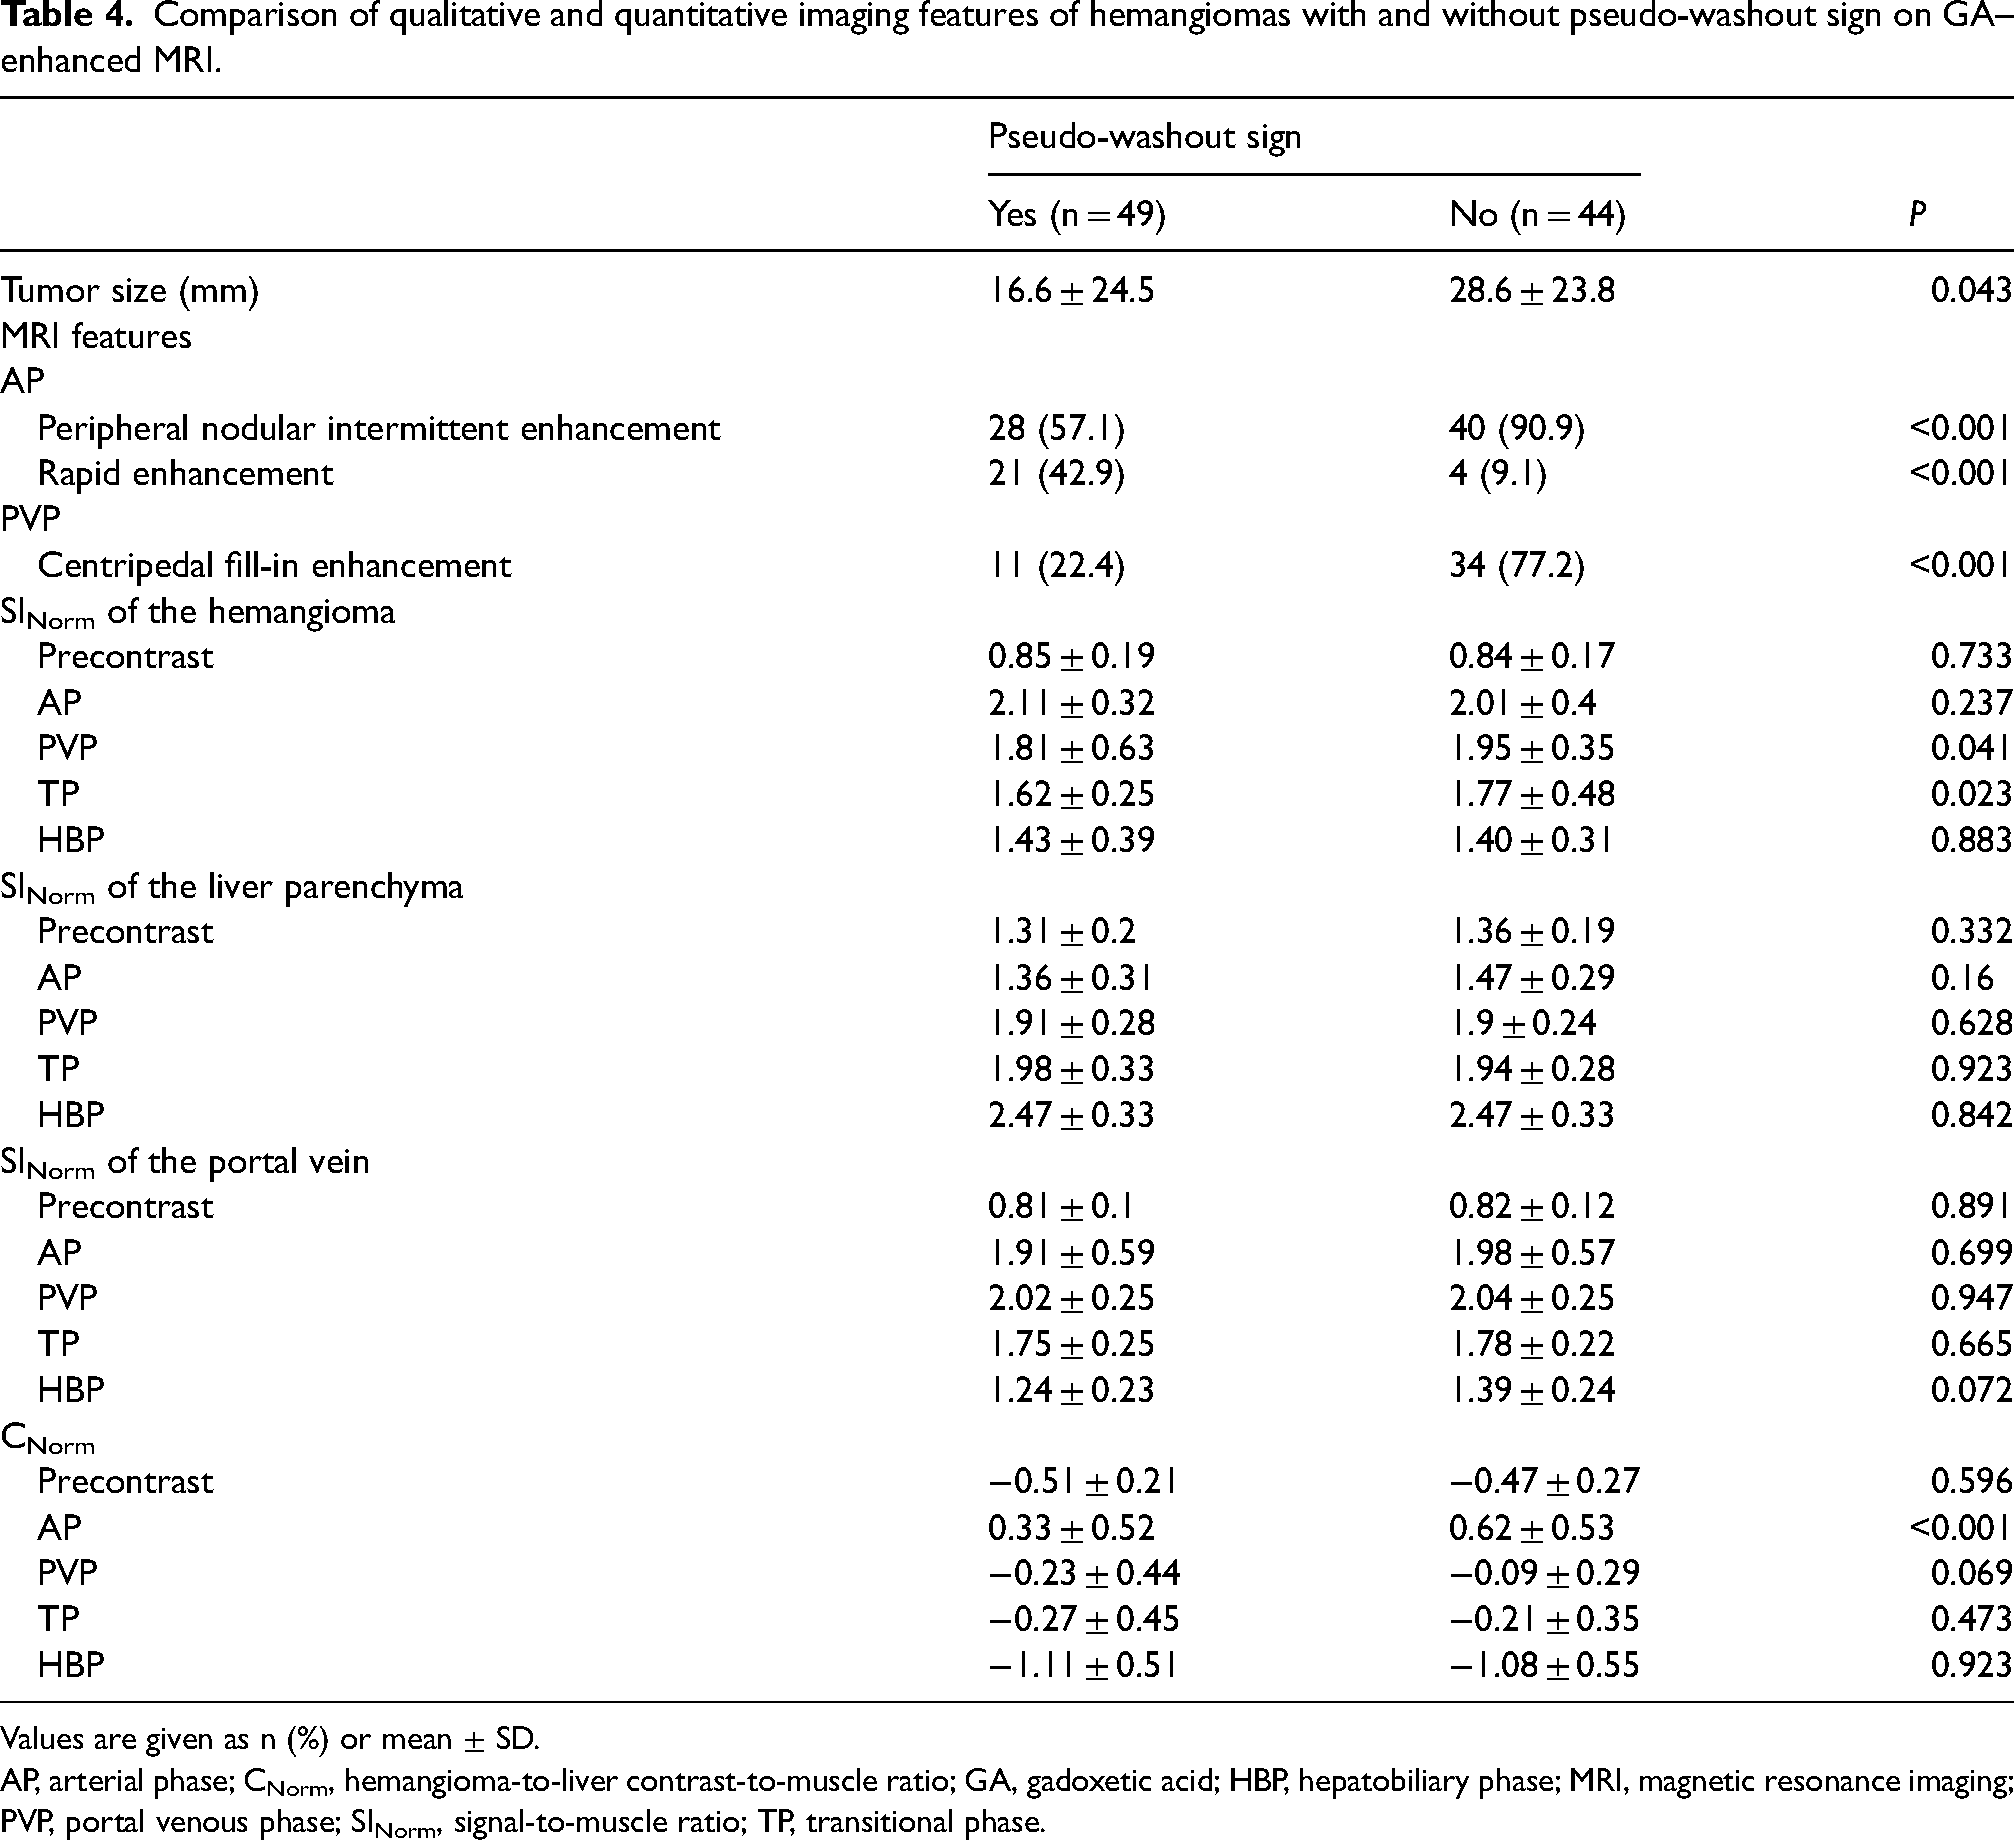
Values are given as n (%) or mean ± SD.
AP, arterial phase; CNorm, hemangioma-to-liver contrast-to-muscle ratio; GA, gadoxetic acid; HBP, hepatobiliary phase; MRI, magnetic resonance imaging; PVP, portal venous phase; SINorm, signal-to-muscle ratio; TP, transitional phase.
The mean SINorm was lower in the PVP and TP in hemangiomas with PWSs than in those without PWSs but did not differ in the AP and HBP (P = 0.041, 0.023, 0.237, and 0.883, respectively) (Table 4). The mean liver parenchyma SINorm between hemangiomas with and without PWS was not significantly different in all phases (P = 0.16 to P = 0.923). The mean PV SINorm values in hemangiomas with and without PWSs did not differ significantly across all phases but decreased gradually from the PVP to the HBP (P = 0.072 to P = 0.947). In addition, the mean PV SINorm plots were similar to the mean SINorm plots of hemangiomas with and without PWSs (Fig. 5).
While the mean CNorm showed a significant difference in the AP between hemangiomas with and without PWSs, it did not differ significantly in other phases (P < 0.001, and P = 0069 to P = 0.923) (Fig. 6).
Discussion
According to the results of the quantitative analyses we conducted in our study, after the GA injection, hemangiomas showed peak enhancement in the AP and then gradually decreased until the HBP, whereas the liver parenchyma increased gradually from the precontrast period to the HBP. In addition, while the mean CNorm, which measures the absolute contrast difference between the liver parenchyma and the hemangioma, was positive in the AP, it gradually decreased and turned negative in the following phases. Again, in the visual enhancement analysis we conducted, most of the hemangiomas were hyperintense in the AP (62.3%), isointense in the PVP (41.9%), hypointense in the TP (52.6%), and hypointense in the HBP (100%). Our results are similar to those previously reported in the literature and revealed that the enhancement effect of GA on hemangiomas in the TP and HBP is different from the enhancement findings obtained with purely extracellular gadolinium chelates (1,13–15). In addition, in our subgroup analysis of the imaging features of hemangiomas with and without PWSs, we showed that the rapid enhancement in the AP and hemangiomas <2 cm was higher than that of peripheral nodular enhancement and hemangiomas >2 cm (P < 0.001 and P = 0.043). Centripedal fill-in enhancement in the PVP is more common in hemangiomas without PWSs than in those with PWSs (P < 0.001). These results have been previously reported by Doo et al. (12), Kim et al. (14), Tateyama et al. (15), and Huppetz et al. (19).
It has been suggested that there are two factors that cause the SI values of hemangiomas to decrease in the TP and HBP after GA injection. First, based on the pharmacokinetics of GA compared with extracellular contrast agents, the contrast agent is expected to wash out relatively early from the rich vascular spaces of hemangiomas. The low dose of gadolinium in GA also contributes to the early washout effect. Tamada et al. showed that the SI value of intrahepatic arteries was lower in MRI obtained with GA compared to MRI obtained with extracellular contrast material during the TP, and they suggested that this was due to faster washout of GA vascular areas (13). Second is the increased enhancement effect of GA injection on the liver parenchyma from the AP to the HBP, which causes a relative decrease in the SI of hemangiomas. This phenomenon has also been reported in many previous studies (10,11,13,19). In our study, we found that most of the hemangiomas were hyperintense in the AP (62.3%) and hypointense in the TP (52.6%) in the qualitative visual enhancement evaluations. In the quantitative analysis, we showed that the mean hemangioma SINorm values peaked in the AP and gradually decreased in the following phases, and in pairwise comparisons there were significant differences between all phases except the AP and PVP (P = 0.002 to P < 0.001). We showed that the mean SINorm value of the liver parenchyma increased significantly in the progressive phases (P = 0.004 to P < 0.001) and the mean CNorm value decreased significantly from the AP to have negative values in the progressive phases (P = 0.017 to P < 0.001). Although our results are similar to those previously reported in the literature, we think that performing quantitative evaluation in addition to qualitative evaluation in GA-enhanced MRI would be beneficial for the correct diagnosis of hemangiomas.
Recognition of contrast enhancement patterns of hemangiomas on GA-enhanced MRI is of great importance for radiologists (20). In the subgroup analysis of hemangiomas with and without PWSs in our study, we found that PWSs were more common in small (<2 cm) and rapidly enhanced hemangiomas (P = 0.043 and P < 0.001). In addition, centripedal fill-in enhancement in the PVP was more common in hemangiomas without PWSs (P < 0.001). In quantitative evaluation, we showed that the mean SINorm value of hemangiomas with PWSs was significantly lower in the PVP and the TP compared to those without PWSs (P = 0.041, and 0.023, respectively), and the mean CNorm was significantly higher in the AP in hemangiomas with PWSs (P < 0.001). Doo et al. reported that rapid enhancement of hemangiomas in the AP showed PWSs upon GA-enhanced MRI (12). Tateyama et al. reported that 7 of 8 (86%) rapidly enhancing hemangiomas in the AP had PWSs in the TP (15). The higher incidence of PWSs in small and rapidly enhanced hemangiomas may be attributed to the narrow and small vascular spaces and the rapid blood flow cycle after the AP (15). Yamashita et al. suggested that the centripedal fill-in enhancement seen in the PVP in hemangiomas without PWSs may be due to large vascular spaces, unlike hemangiomas with PWSs (21). Our results are similar to the qualitative imaging features described in the literature. In addition, we think that quantitative evaluation is useful to acquire a clearer interpretation in the evaluating of hemangiomas with and without PWSs.
In the quantitative evaluation results of our study, the mean SINorm plots of hemangiomas with and without PWSs were similar to the PV SINorm plots. This finding indicates that the enhancement pattern of hemangiomas both with and without PWSs on GA-enhanced MRI is equivalent to that of the PV over time (22). In short, our findings suggest that caution should be exercised when evaluating small hemangiomas that show rapid enhancement in the AP, and PWSs in the TP upon GA-enhanced MRI because this imaging finding is highly similar to findings of hepatocellular carcinomas and hypervascular tumors. In light of these findings, we think that while evaluating hemangiomas with PWS similar to those previously reported in the literature in addition to quantitative measurements, attention should be paid to findings such as bright SI on T2W images and matching the SI with that of the PV in all dynamic phases (10,13,14,23).
The present study has some limitations. First, there is a possibility of selection bias due to the retrospective design of the study. Second, the hemangiomas were histologically unconfirmed. Diagnosis was based on imaging findings. As is known, histological confirmation of hemangiomas is risky due to the high probability of bleeding so is not routinely performed until it is necessary to distinguish these lesions from malignancies. However, because we included lesions that were unchanged for at least 12 months and showed imaging findings typical of hemangiomas on at least two conventional imaging studies, we believe that undesirable inclusion of lesions other than hemangiomas is highly improbable. Finally, we did not compare the GA-enhanced MRI findings of hemangiomas and hypervascular tumors. In particular, the imaging findings of rapidly enhanced hemangiomas with PWSs and hypervascular tumors are similar. It is clear that more work is needed on this subject. However, the aim of the present study was to evaluate the qualitative and quantitative features of hemangiomas on GA-enhanced MRI and to compare the imaging features of hemangiomas with and without PWSs. Despite the limitations, our study is the first to evaluate the qualitative and quantitative imaging features of hemangiomas on GA-enhanced MRI and to compare the qualitative and quantitative imaging features of hemangiomas with and without PWSs. We think that it will prove to be a pioneering study on the subject.
In conclusion, our study revealed that hemangiomas showed hypointensity in the TP and the HBP after peak enhancement in the AP on GA-enhanced MRI images, unlike the typical enhancement pattern seen in triphasic CT and dynamic MRI images using extracellular gadolinium chelates. The incidence of PWSs was higher in the TP, particularly in small hemangiomas that showed rapid enhancement. When evaluating GA-enhanced MRI, radiologists should utilize quantitative measures in addition to qualitative assessment and should be aware that SI matching with PV in all phases can be a distinguishing finding in the diagnosis of hemangioma.
Footnotes
Availability of data and material
Data generated or analyzed during the study are available from the corresponding author by request.
Declaration of conflicting interests
The author(s) declared no potential conflicts of interest with respect to the research, authorship, and/or publication of this article.
Funding
The author(s) received no financial support for the research, authorship, and/or publication of this article