
Abstract
Background
Extramural venous invasion (EMVI) is an important prognostic factor of rectal adenocarcinoma. However, accurate preoperative assessment of EMVI remains difficult.
Purpose
To assess EMVI preoperatively through radiomics technology, and use different algorithms combined with clinical factors to establish a variety of models in order to make the most accurate judgments before surgery.
Material and Methods
A total of 212 patients with rectal adenocarcinoma between September 2012 and July 2019 were included and distributed to training and validation datasets. Radiomics features were extracted from pretreatment T2-weighted images. Different prediction models (clinical model, logistic regression [LR], random forest [RF], support vector machine [SVM], clinical-LR model, clinical-RF model, and clinical-SVM model) were constructed on the basis of radiomics features and clinical factors, respectively. The area under the curve (AUC) and accuracy were used to assess the predictive efficacy of different models. Sensitivity, specificity, positive predictive value (PPV), and negative predictive value (NPV) were also calculated.
Results
The clinical-LR model exhibited the best diagnostic efficiency with an AUC of 0.962 (95% confidence interval [CI] = 0.936–0.988) and 0.865 (95% CI = 0.770–0.959), accuracy of 0.899 and 0.828, sensitivity of 0.867 and 0.818, specificity of 0.913 and 0.833, PPV of 0.813 and 0.720, and NPV of 0.940 and 0.897 for the training and validation datasets, respectively.
Conclusion
The radiomics-based prediction model is a valuable tool in EMVI detection and can assist decision-making in clinical practice.
Introduction
Extramural venous invasion (EMVI) is defined as the appearance of tumor cells in the veins beyond the muscularis propria. EMVI status plays a vital role in the preoperative evaluation and is an independent prognostic factor of rectal cancer (1,2). It is relevant with local recurrence, distant metastases, and overall reduction in survival time (3–5). An accurate assessment of EMVI status is of great clinical significance for making decisions and improving the prognosis of patients. Generally, EMVI status can be obtained through postoperative pathology specimens. However, in this condition, the information about EMVI was not available preoperatively and the treatment plans could not be adjusted according to the EMVI status.
Magnetic resonance imaging (MRI) has good soft-tissue resolution and is used in the routine examination of rectal cancer. It is used to evaluate the preoperative EMVI status. The European Society for Medical Oncology recommends that MRI-detected EMVI (mrEMVI) be considered when making treatment plans (6). For patients with positive mrEMVI, more active strategies are needed. However, the performance of mrEMVI still needs to be improved. Previous studies reported that the sensitivity of mrEMVI was relatively low and the range was wide (28.2%–62.0%) (7–10). In addition, MRI evaluation of EMVI might be influenced by the experience and professional knowledge level of radiologists. Furthermore, some patients did not appear with typical manifestations of positive EMVI, such as obvious vascular expansion and tumor signals in the lumen, which increased the difficulty of judgment. Finally, conventional MRI was limited in detecting vessels with a diameter <3 mm (11–13). Therefore, a reliable, stable, and objective EMVI evaluation method needs to be developed.
Radiomics is a promising field and has been widely applied to medical diagnosis, treatment, and prognosis (14–16). It extracts quantitative features and deeply mined invisible information, providing help for clinical decisions (17). Although some studies have investigated the diagnostic efficiency of radiomics in EMVI of rectal cancer, most of them only chose one machine learning algorithm to build a radiomics model; some used different algorithms and the effectiveness of different radiomics models in diagnosing EMVI is unclear. The aims of the present study were to use different algorithms to construct several radiomics prediction models and combine them with clinical risk characteristics, to explore the optimal model for predicting the EMVI status of rectal cancer, and to provide decision support for the individualized treatment options in clinical practice.
Material and Methods
Patients
The Ethics Committee of our hospital approved this retrospective study (No. sydwg2r2020-094) and the requirement for informed consent was waived. A total of 212 patients with rectal adenocarcinoma between September 2012 and July 2019 were included in the study, and their clinical and imaging data were derived from medical records. The inclusion criteria were as follows: (i) pathologically confirmed as rectal adenocarcinoma; (ii) received MRI within two weeks before resection; and (iii) completed clinical and pathological data. The exclusion criteria were patients who received antitumor treatment before MRI or had insufficient imaging quality. The patients were randomly distributed to the training (n = 148) and validation datasets (n = 64) at a proportion of 7:3.
MRI examination and image segmentation
MRI scanning was performed using a Discovery MR750w 3.0-T MRI scanner (GE Healthcare, Milwaukee, WI, USA) with a phased-array body coil. Patients were instructed to fast for 4 h and empty intestinal contents before the examination. Two radiologists with rich expertise in abdominal imaging diagnosis manually delineated the region of interest (ROI) along the tumor edge on the axial T2-weighted (T2W) images through MITK software (18) (Fig. 1). The radiologists were blinded to the pathological results and completed the segmentation of ROI independently. In total, 30 patients were randomly selected and radiologist 1 repeated the ROI delineation two weeks later.
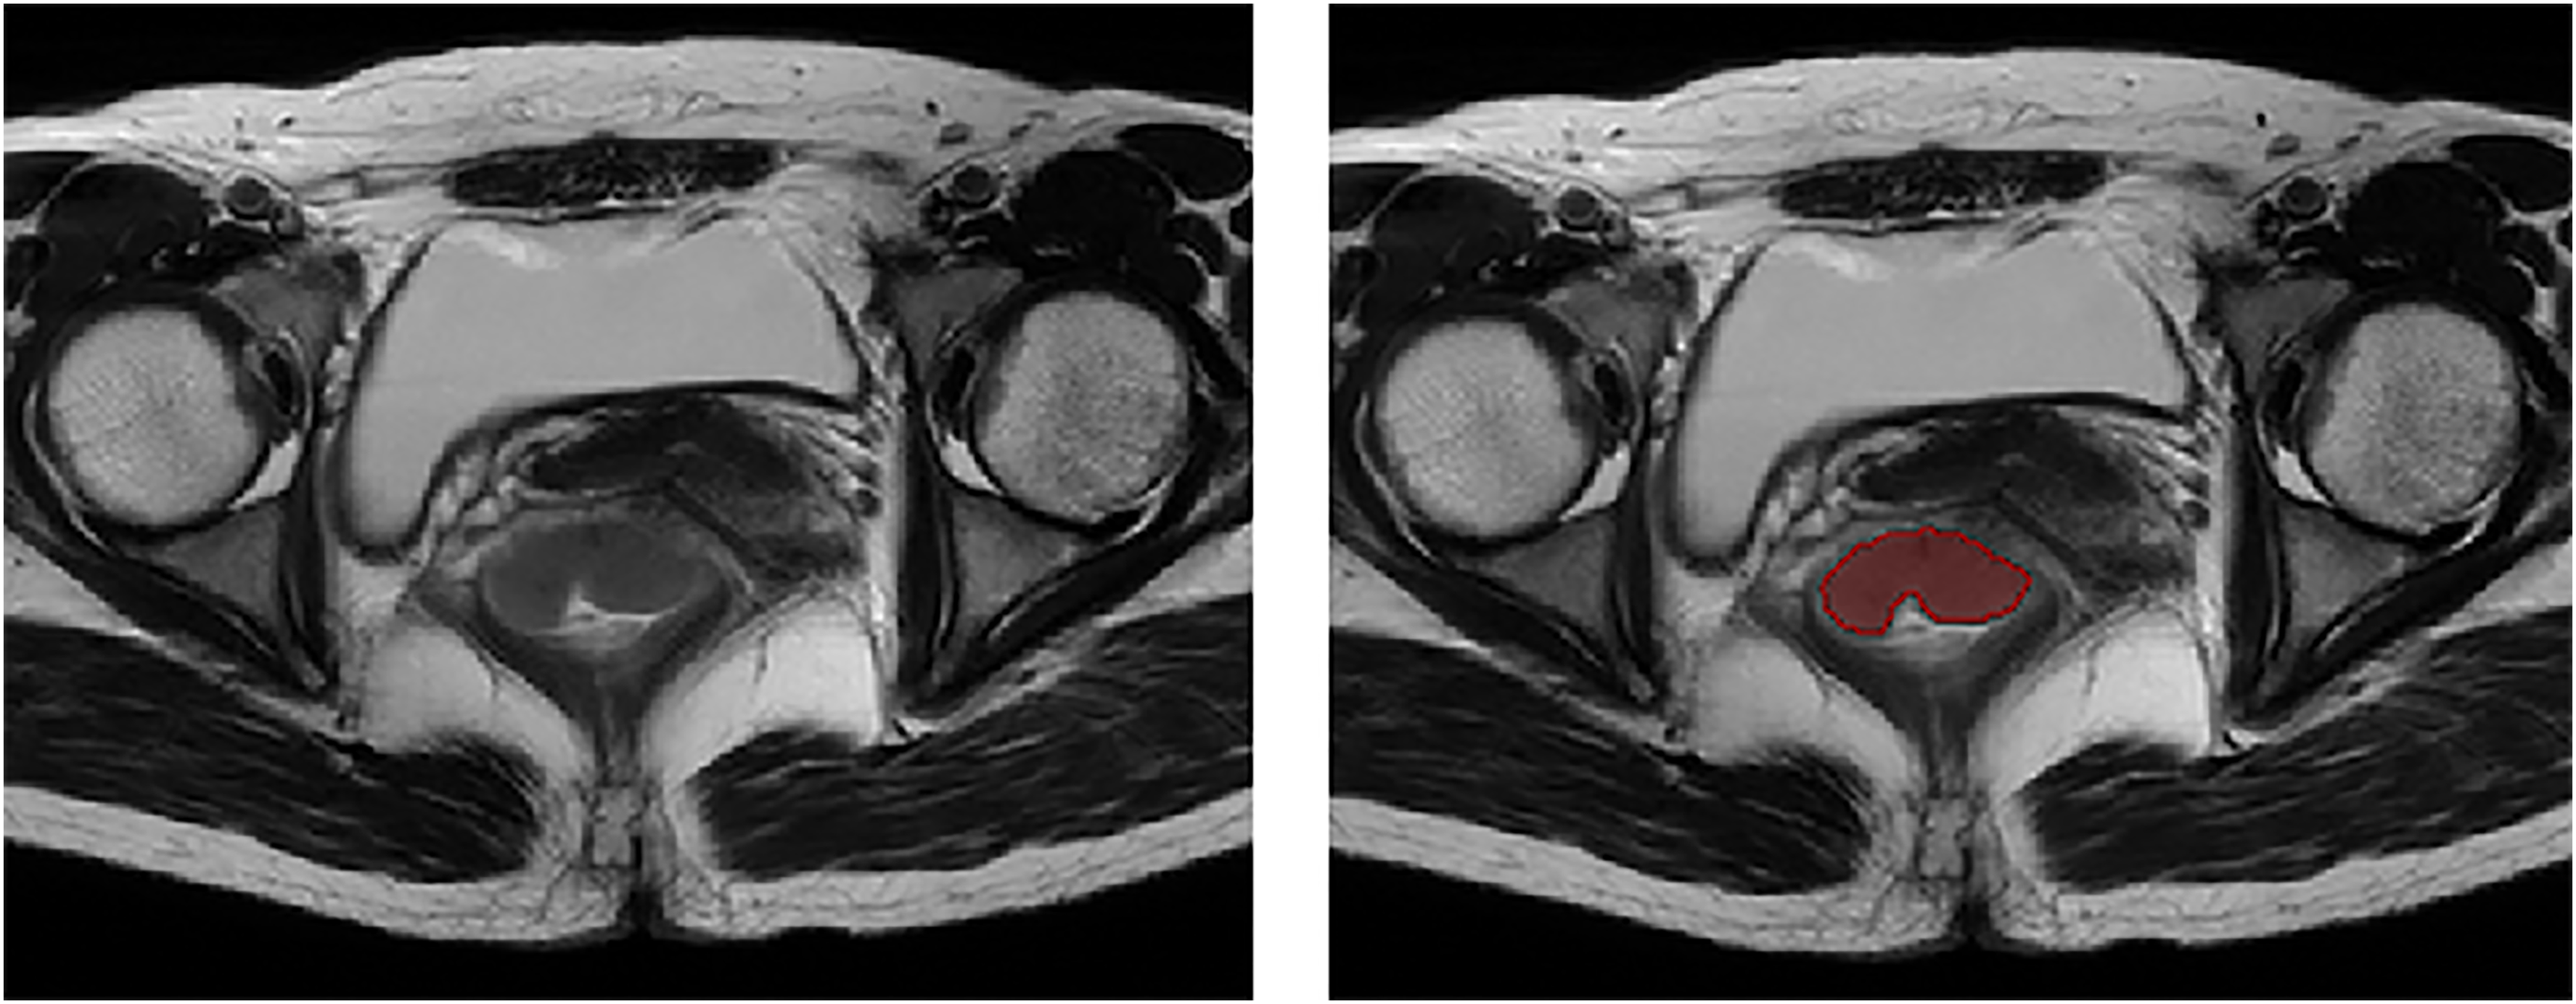
Tumor segmentation.
Radiomics features extraction and selection
Radiomics features were extracted through Pyradiomics (19) software and each patient obtained 960 features. These features included first-order features, shape and size features, gray-level dependence matrix features, gray-level size zone matrix features, gray-level run length matrix features, and gray-level co-occurrence matrix features. The repeatability of features was evaluated through the intra-class correlation coefficient (ICC). Features with ICC >0.75 were retained for subsequent analysis and a Z-score transformation was performed to normalize the features. The feature selection process was completed by the least absolute shrinkage and selection operator (LASSO) method. The parameter λ was verified by 10-fold cross-validation and the radiomics models were constructed on the basis of features with non-zero coefficients.
Model construction and validation
After radiomics features dimensionality reduction, three radiomics models were constructed, including logistic regression (LR), random forest (RF), and support vector machine (SVM). The receiver operating characteristic (ROC) curves were performed to assess the effectiveness of radiomics models and the area under the curve (AUC) values were calculated for quantification. Moreover, we calculated the accuracy (ACC), sensitivity, specificity, positive predictive value (PPV), and negative predictive value (NPV).
The clinical model was built through logistic regression. First, univariate logistic regression was performed on clinical factors, including age, sex, carcinoembryonic antigen (CEA), carbohydrate antigen 199 (CA199), tumor differentiation, diameter, location, T staging, and N staging. Second, the multivariate logistic regression analysis was performed to confirm the independent clinical characteristics that could predict EMVI status. Finally, the clinical model was constructed based on the result of the multivariate logistic regression and the performance was verified in the validation dataset.
The multi-scale comprehensive models (clinical-LR model, clinical-RF model, and clinical-SVM model) based on clinical factors and radiomics features were built, respectively, aiming to predict EMVI status from multi-dimensional perspectives. The values of AUC and ACC were used to compare the diagnostic efficiency of each model and screen out the optimal model for predicting EMVI status.
Statistical analysis
R software was used for the statistical analysis. The categorical variables were compared using the chi-square test and the continuous variables were compared using the independent samples t-test or Mann–Whitney U test. P < 0.05 was considered statistically significant.
Results
Patients
Our study contained 212 patients (145 men, 67 women; mean age of the patients in training and validation datasets = 60.70 and 59.31 years, respectively). The prevalence of positive EMVI was 32.4% in the training dataset and 39.1% in the validation dataset. No significant differences were found in the clinical factors between the training and validation datasets. Details could be found in Table 1.
Characteristics of patients.
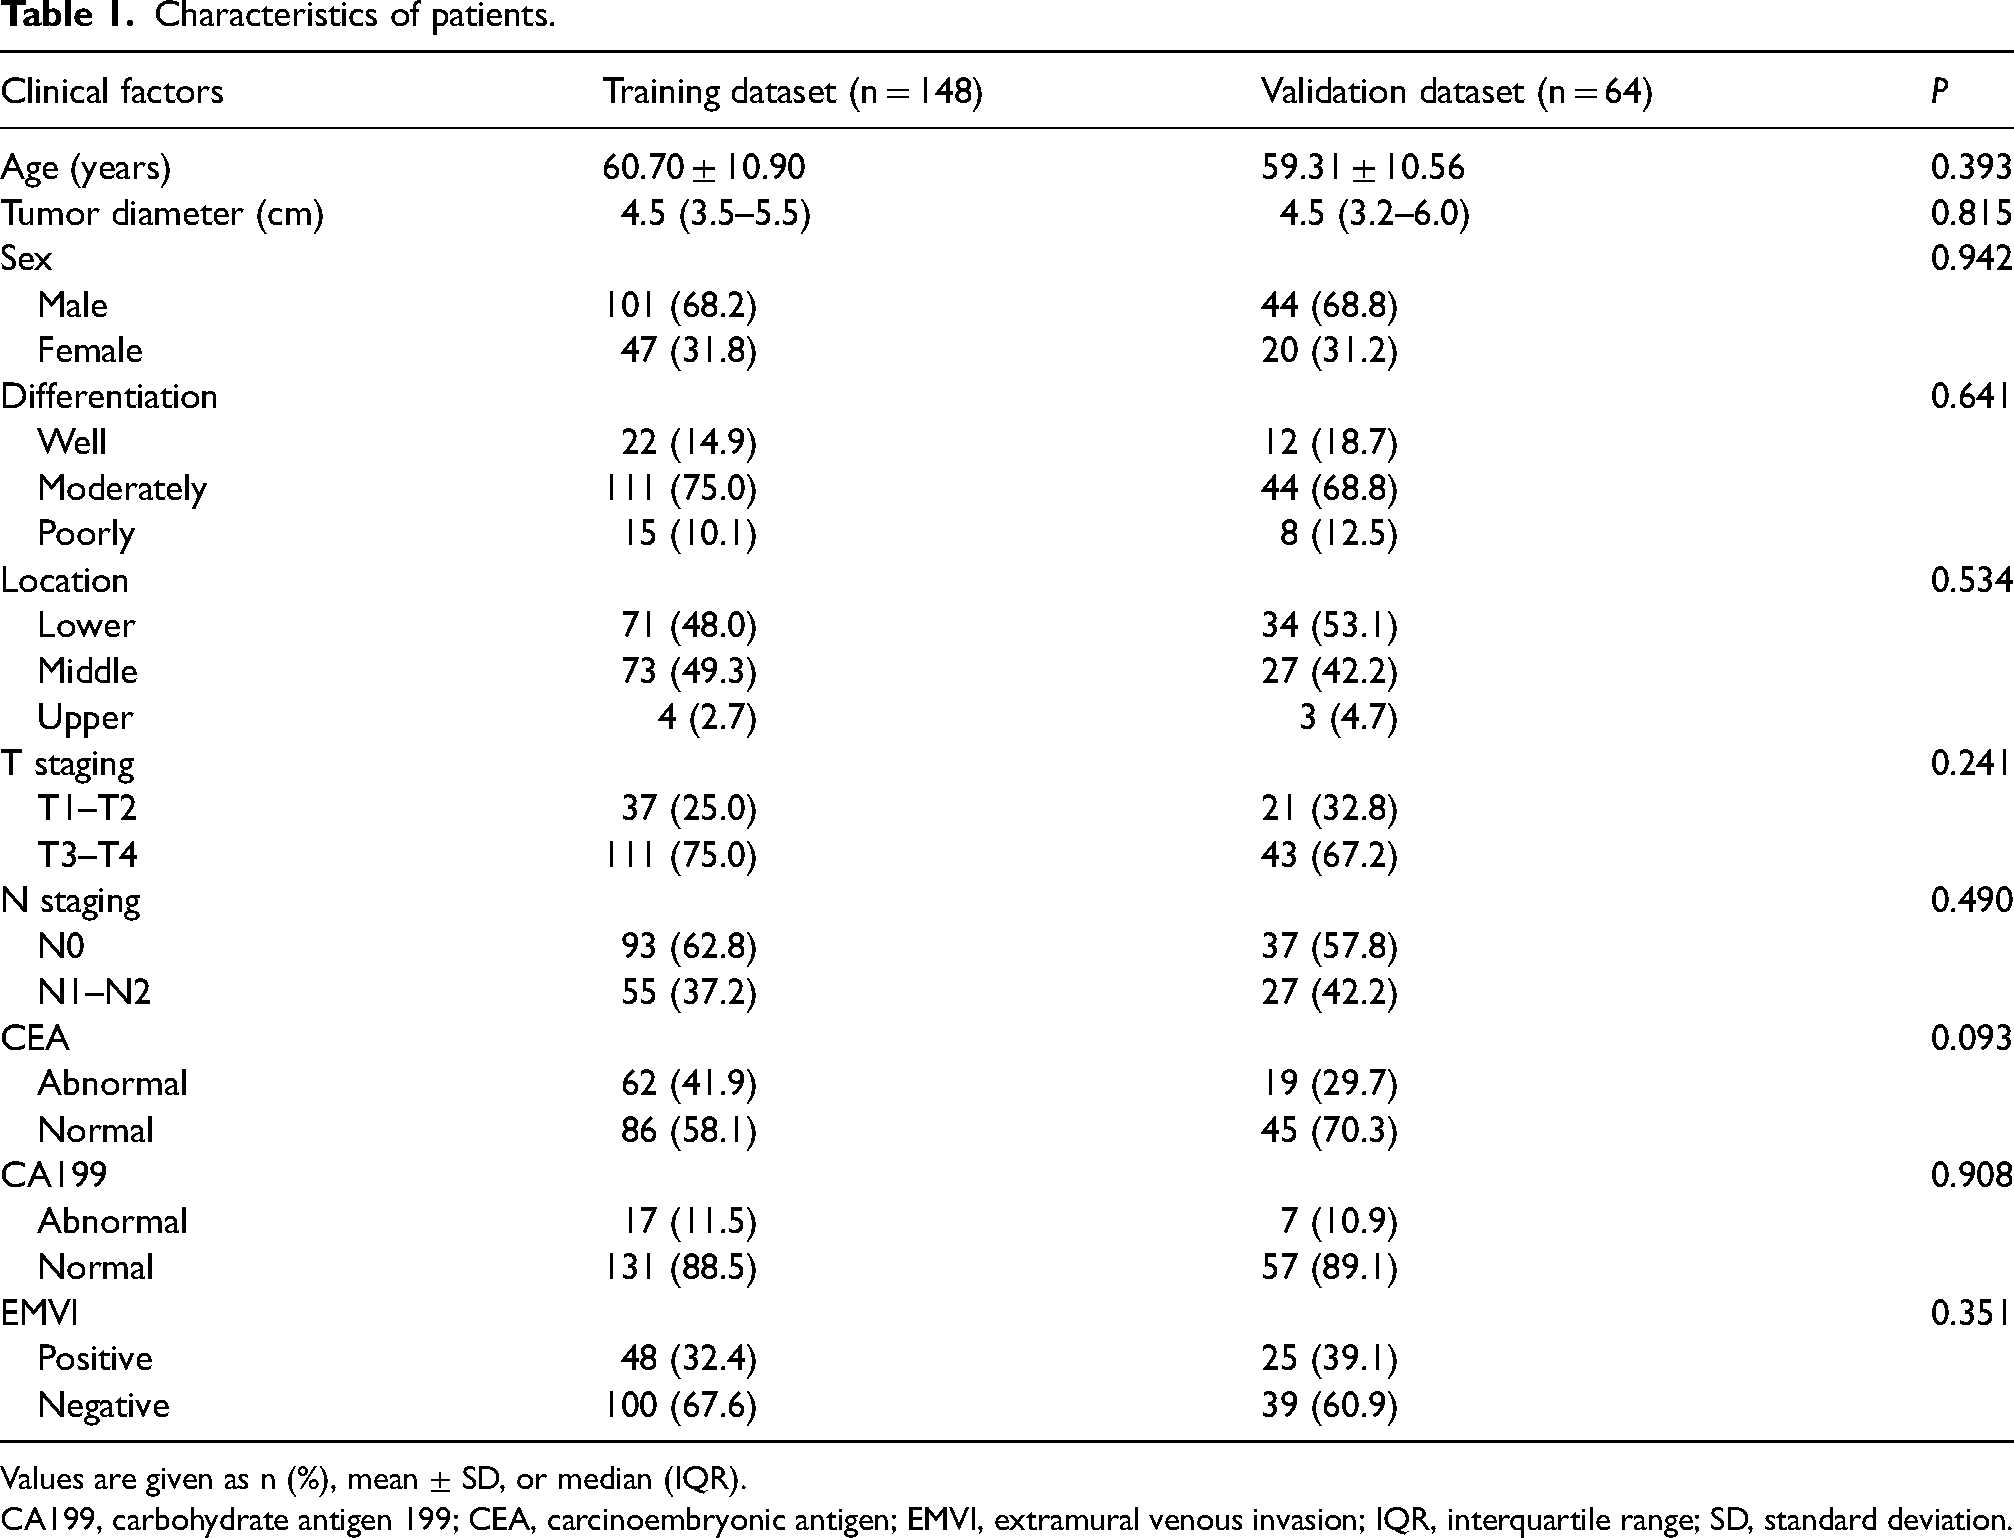
Values are given as n (%), mean ± SD, or median (IQR).
CA199, carbohydrate antigen 199; CEA, carcinoembryonic antigen; EMVI, extramural venous invasion; IQR, interquartile range; SD, standard deviation.
Features selection
After removing the features with ICC <0.75 and LASSO selection analysis, the following 15 features were retained for radiomics models construction: original_firstorder_Kurtosis; original_shape_Elongation; original_firstorder_Minimum; wavelet-HHL_glcm_Idm; wavelet-HHL_firstorder_90 Percentile; wavelet-HLH_firstorder_Skewness; wavelet-HLL_glcm_Id; wavelet-HLL_glcm_DifferenceEntropy; wavelet-HLL_firstorder_Interquartile Range; wavelet-HLL_firstorder_10 Percentile; wavelet-LLH_firstorder_Kurtosis; wavelet-LHL_firstorder_Kurtosis; wavelet-LHH_glcm_Autocorrelation; wavelet-HHL_glcm_Id; and wavelet-HHH_firstorder_90 Percentile (Fig. 2a and b).
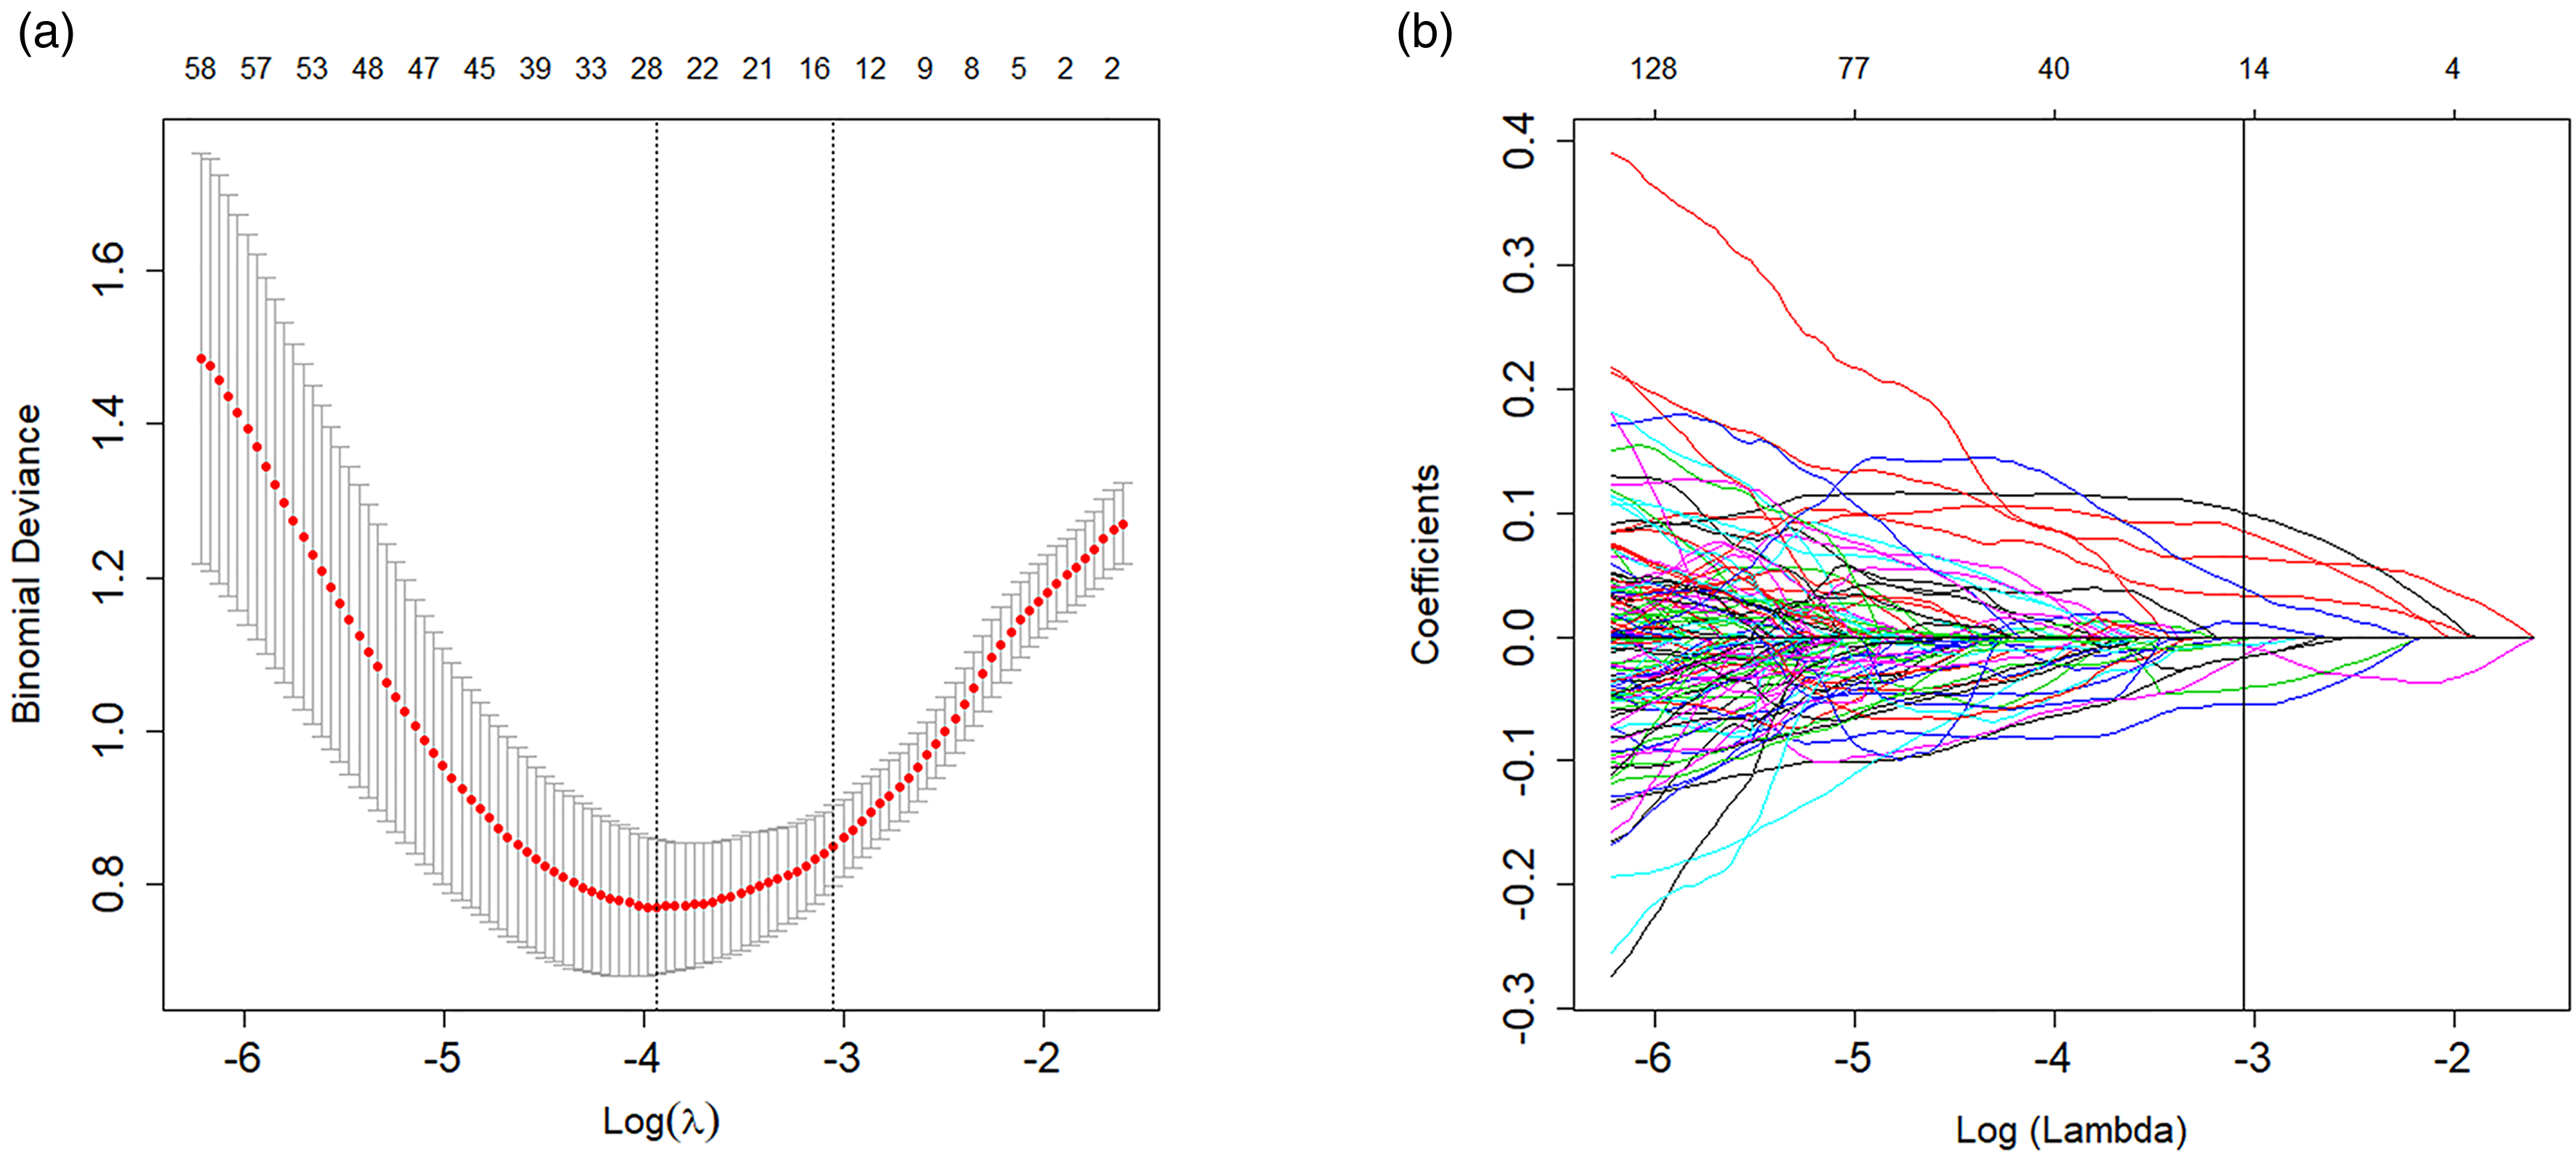
LASSO selection analysis for radiomics features. (a) The tuning parameter (λ) was chosen using 10-fold cross-validation via minimum criteria (1-SE criteria). (b) The LASSO coefficient profiles. The vertical line was drawn at the value confirmed by cross-validation. LASSO, least absolute shrinkage and selection operator.
Performance of different prediction models
Three radiomics models exhibited favorable performance. The AUC of the LR model, RF model, and SVM model for the training dataset was 0.959 (95% confidence interval [CI] = 0.932–0.986), 0.861 (95% CI = 0.800–0.922), and 0.981 (95% CI = 0.963–0.998), respectively, and 0.846 (95% CI = 0.744–0.948), 0.831 (95% CI = 0.724–0.937), and 0.861 (95% CI = 0.761–0.960), respectively, for the validation dataset.
Univariate logistic regression analysis demonstrated that CA199, T staging, and N staging were potential characteristics in predicting EMVI status. Multivariate logistic regression analysis further identified T staging and N staging as independent characteristics (Table 2). The clinical model was constructed based on the result of multivariate logistic regression. The AUC of the clinical model for the training and validation datasets was 0.667 (95% CI = 0.583–0.751) and 0.615 (95% CI = 0.478–0.753), respectively.
Risk factors for EMVI-positive patients.
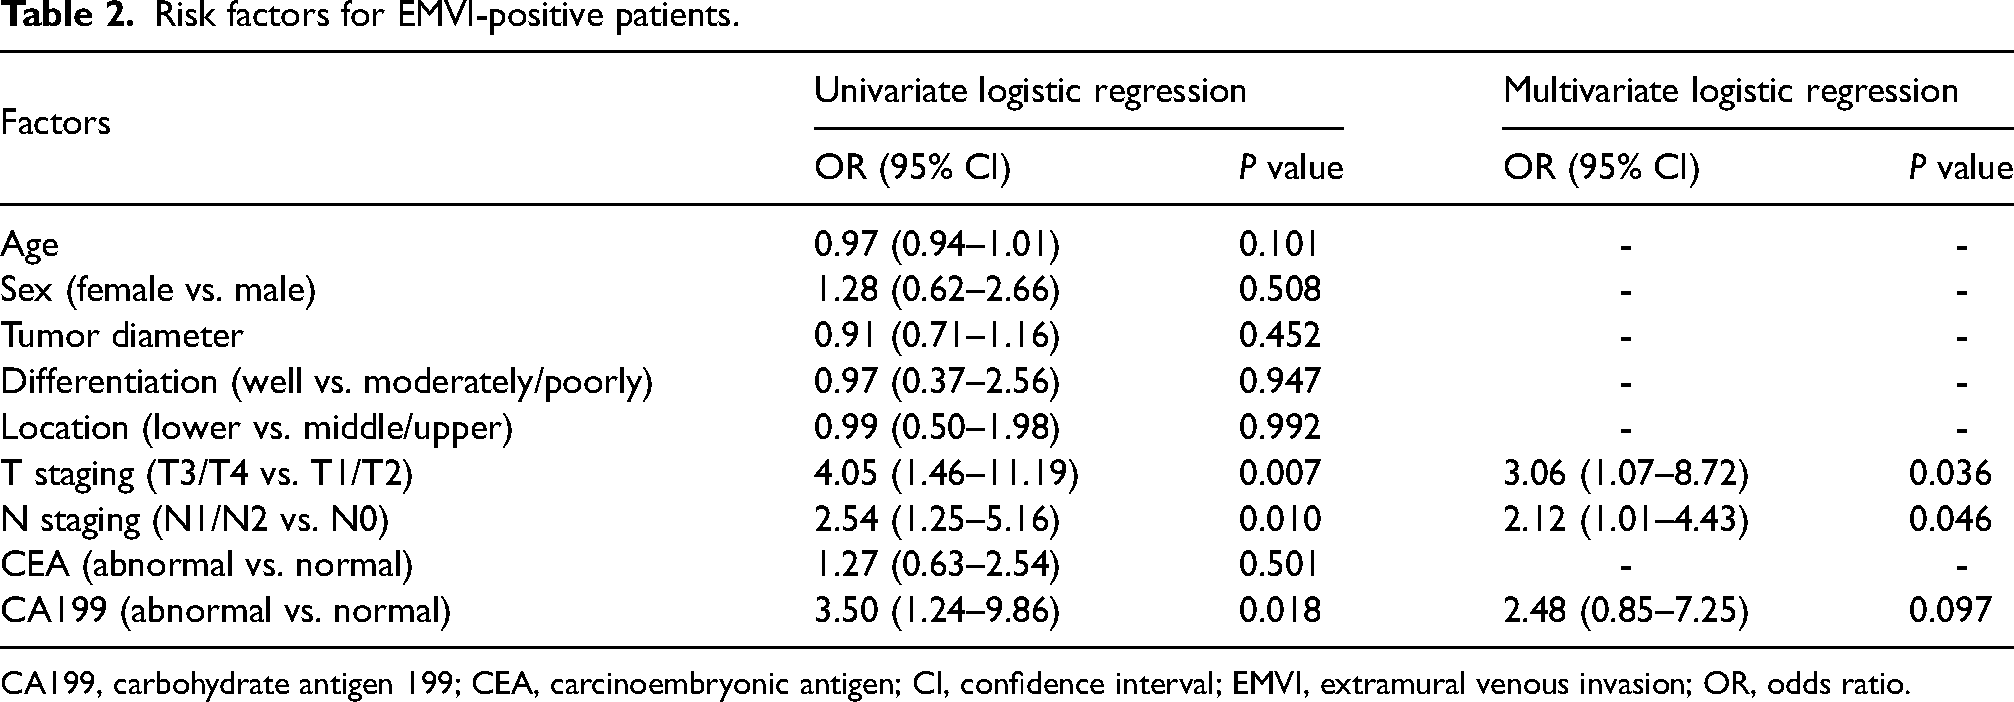
CA199, carbohydrate antigen 199; CEA, carcinoembryonic antigen; CI, confidence interval; EMVI, extramural venous invasion; OR, odds ratio.
The diagnostic efficacy of these prediction models was assessed on the validation dataset and reflected by the AUC values. Table 3 and Fig. 3 show the AUC values and ROC curves. The clinical-LR model exhibited the best performance and was deemed the optimal model. The AUC and ACC of the clinical-LR model were 0.962 (95% CI = 0.936–0.988) and 0.899 for the training dataset, and 0.865 (95% CI = 0.770–0.959) and 0.828 for the validation dataset. The sensitivity, specificity, PPV, and NPV were 0.867, 0.913, 0.813, and 0.940, respectively, for the training dataset, and 0.818, 0.833, 0.720, and 0.897, respectively, for the validation dataset.
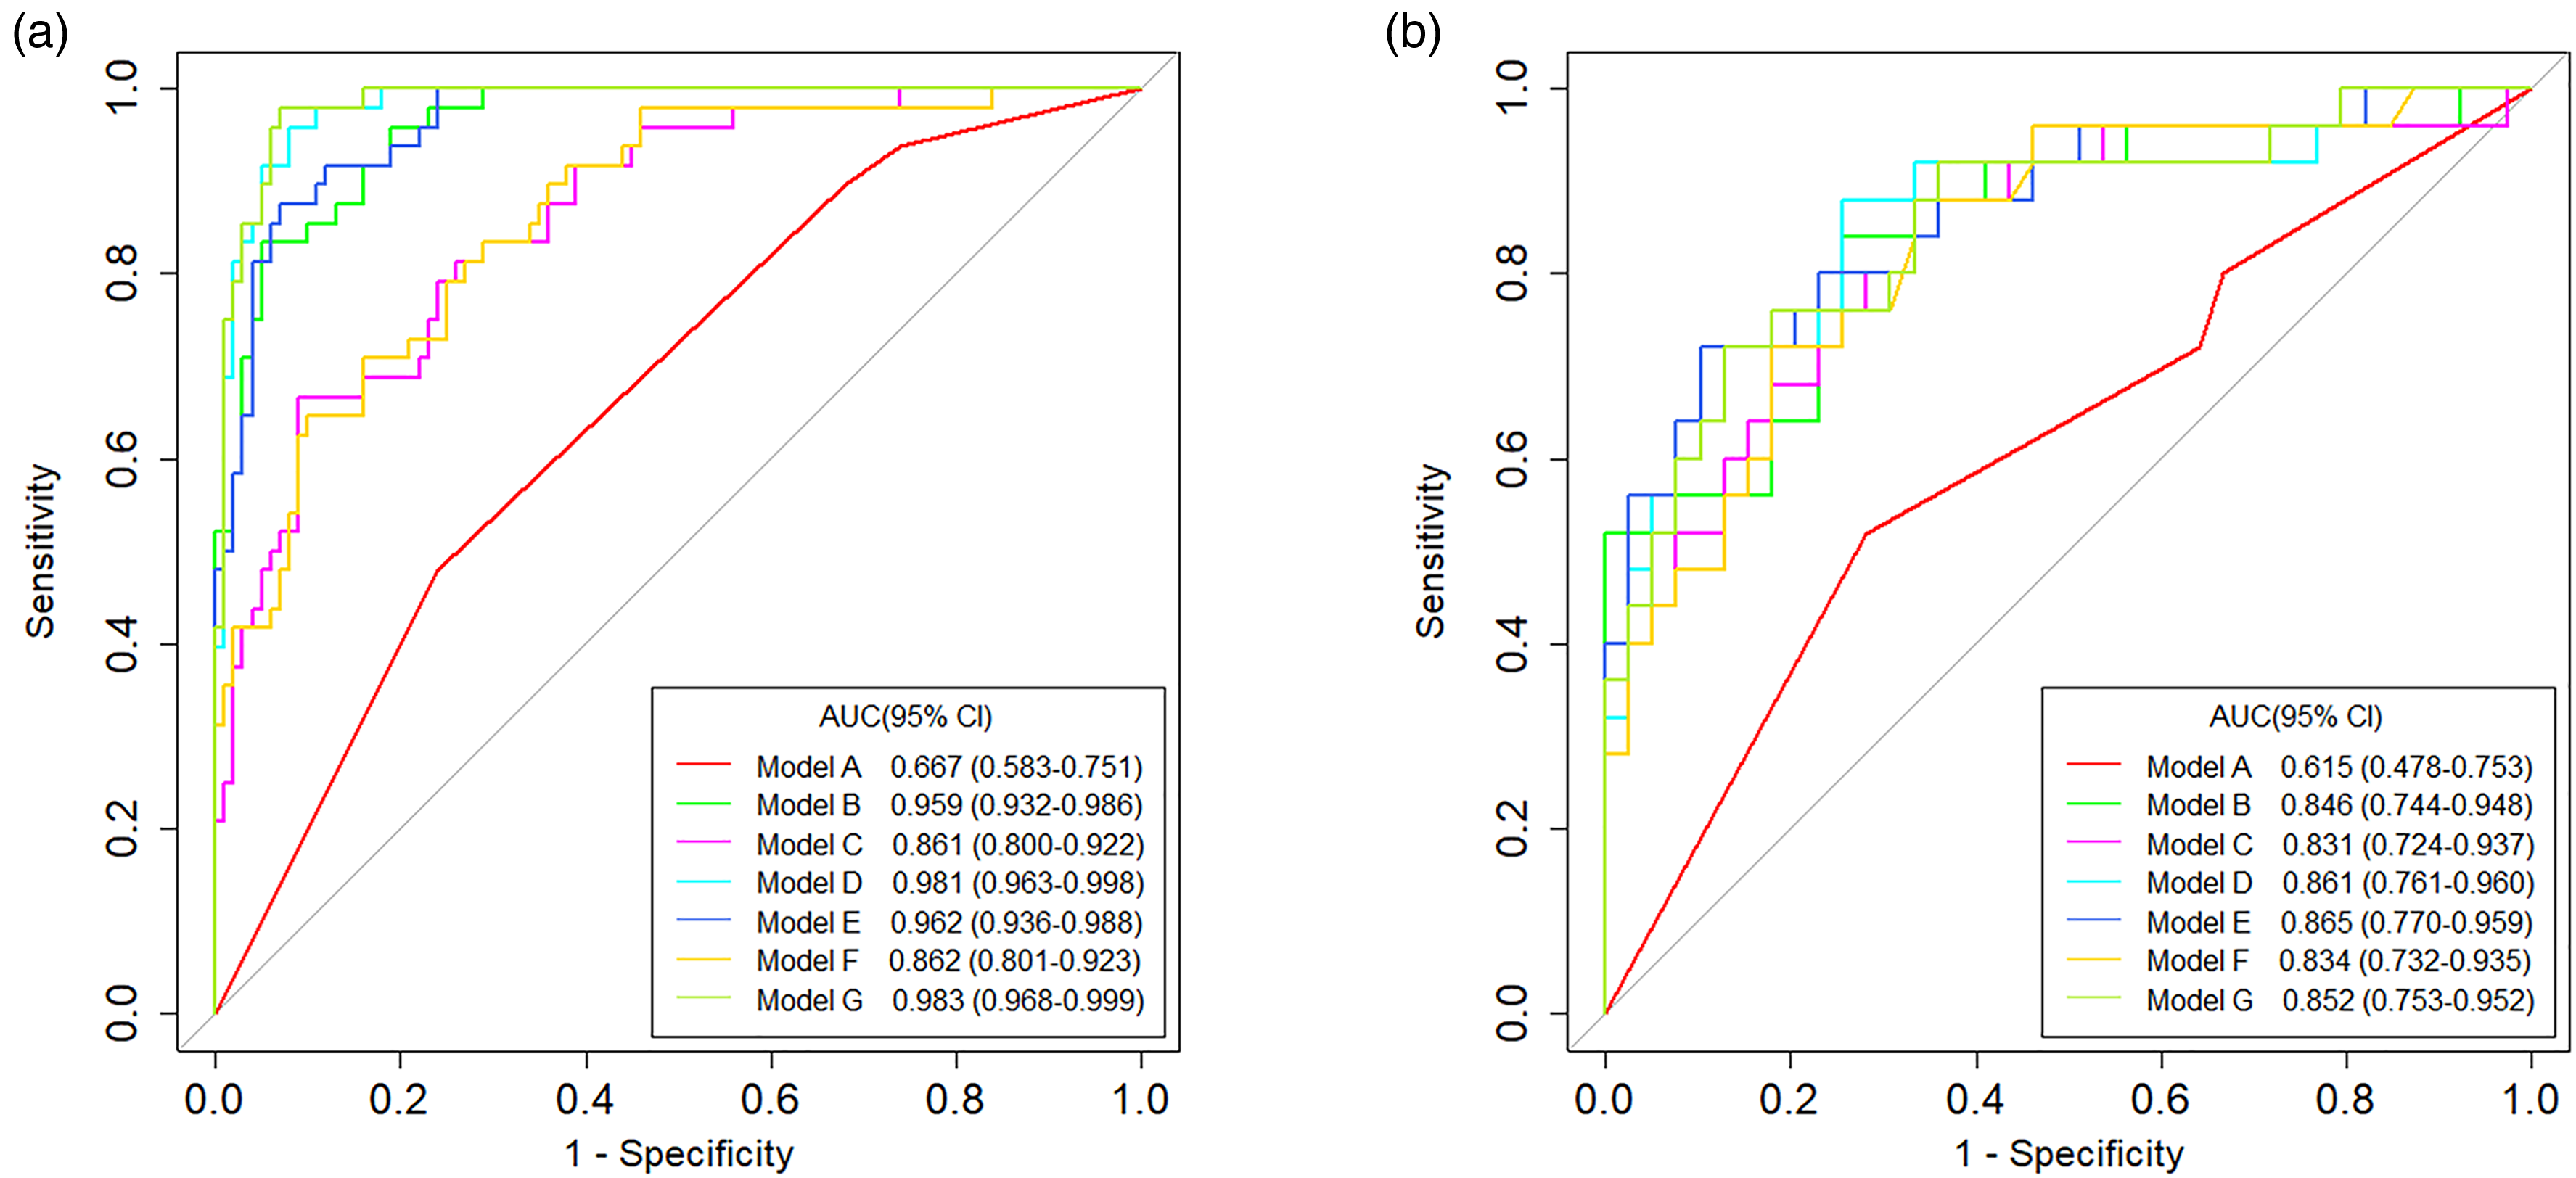
The ROC curves of the (a) training and (b) validation datasets for the predictive models. Models A to G were the clinical model, logistic regression model (LR), random forest model (RF), support vector machine model (SVM), clinical-LR model, clinical-RF model, and clinical-SVM model, respectively. ROC, receiver operating characteristic.
The performance of different prediction models.
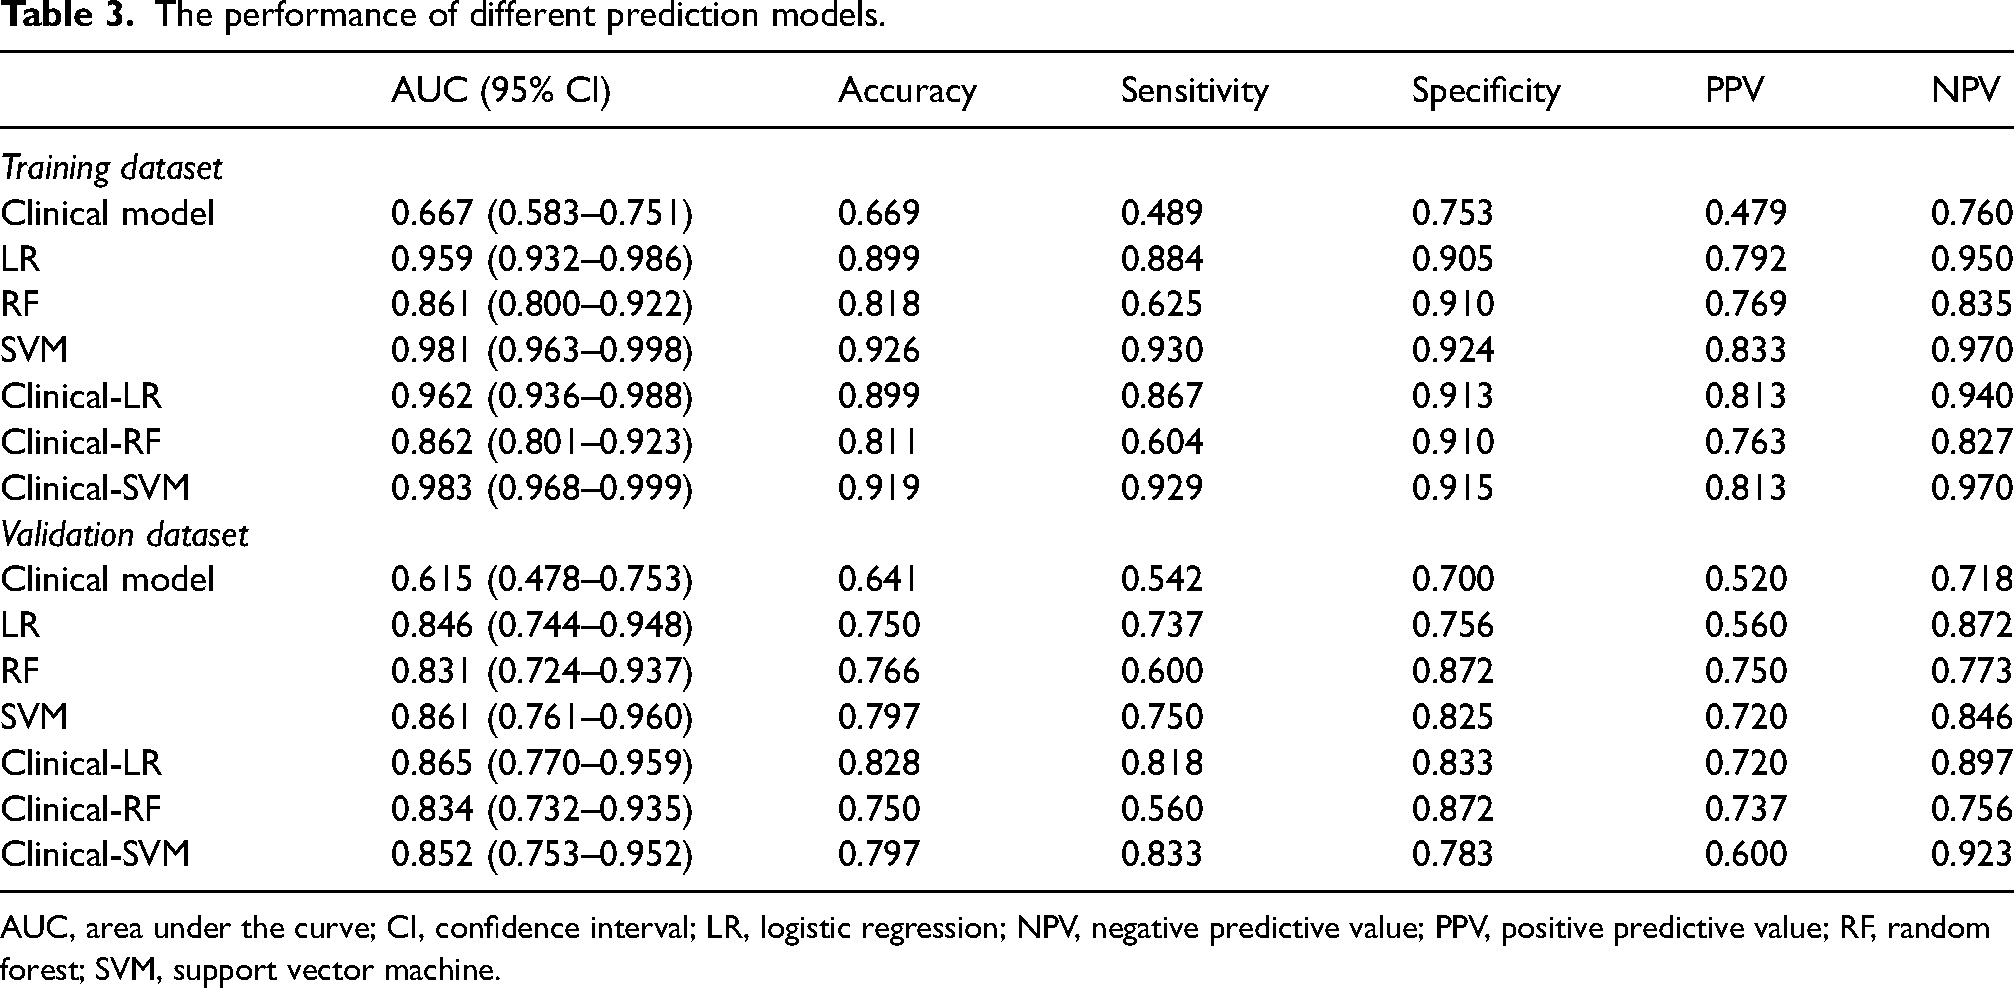
AUC, area under the curve; CI, confidence interval; LR, logistic regression; NPV, negative predictive value; PPV, positive predictive value; RF, random forest; SVM, support vector machine.
Discussion
In the present study, we constructed different prediction models and screened out the optimal model, which had the best performance in predicting the EMVI status. The optimal model was a multi-scale comprehensive model, and the diagnostic efficiency was good both in the training and validation datasets. As a non-invasive evaluation tool, this prediction model may provide support in clinical risk stratification.
Computed tomography (CT) and MRI are common diagnosis and evaluation methods for rectal cancer. Due to the lack of ideal soft-tissue resolution, the application of CT in the evaluation of EMVI status is limited (20). MRI has good resolution and did not involve radiation damage (21). In the present study, we used MRI images for feature extraction and radiomics model construction. T2W imaging shows better stability and is less affected by susceptibility artifacts or distortion than diffusion-weighted imaging (DWI), so T2W imaging is a better choice to assure the robustness of tumor segmentation and feature extraction. Compared with diffusion-weighted imaging (DWI), T2W imaging shows better stability and is less affected by susceptibility artifacts or distortion, which assures the robustness of tumor segmentation and feature extraction (22). Furthermore, a previous study (23) attempted to assess the added value of DWI in evaluating EMVI status for patients with rectal cancer. The results showed that the performance was not significantly improved, and the researchers considered that T2W imaging alone was sufficient to evaluate EMVI. Synthetic MRI scans were used in the study conducted by Zhao et al. (24). A total of 94 patients with rectal cancer were recruited and a multi-dynamic multi-echo (MDME) sequence was performed to obtain relaxation maps images. The results of their study were satisfying, and the validation cohort attained an AUC of 0.877. However, the validation cohort only contained 29 patients and its robustness might be limited to the small sample; a more varied patient dataset is needed to validate the performance of the model. On the other hand, the MDME sequence used in their study was not a routine sequence. It will increase the scanning time and may also increase the financial burden of the patients.
Radiomics features can deeply mine the pathophysiological characteristics of tumors, which cannot be directly found by humans (25). Elongation presents the relationship between the two largest principal components. Kurtosis measures the peakedness of the values in the ROI. The minimum belongs to first-order features and shows the minimum gray-level intensity. Autocorrelation measures the coarseness and fineness of texture. The 10th and 90th percentiles represent the 10th and 90th percentiles of the voxel distribution intensity, respectively. The interquartile range represents the distance between the 25th and 75th percentiles of the image array. Difference entropy is a measure of the variability in neighborhood intensity value differences. Id and Idm measure the local homogeneity of an image. Skewness measures the asymmetry of the distribution of values about the mean value. These radiomics features revealed tumor heterogeneity in a quantitative method. Our optimal prediction model included the above radiomics features and had a better diagnostic performance compared with previous studies. Yu et al. (26) enrolled 106 patients with rectal cancer in their study. They used radiomics features derived from dynamic contrast-enhanced images to predict the EMVI status. A total of 792 features were obtained and four features were identified as potential predictors after features selection. Then, a clinical-radiomics model on the basis of clinical risk factors and radiomics predictors was constructed; the AUC was 0.812. Liu et al. (27) extracted radiomics features from enhanced CT images, enhanced T1-weighted images and T2W images, respectively. Three radiomics signatures were built through the above images, and the result showed that T2W image-based radiomics signatures had the best AUC with a value of 0.717. Shu et al. (28) used multiparameter MRI radiomics to develop the prediction model for EMVI status in patients with rectal cancer and confirmed that the model that combined Bayes-based radiomics signature and clinical radiological characteristics performed best; the AUC was 0.835.
In addition to radiomics features, the clinical predictors were introduced into our model. T and N staging were identified as independent risk characteristics, which was consistent with the results of previous studies (29,30). T and N staging are important prognosis characteristics for patients with rectal cancer (31,32). Patients with locally advanced rectal cancer and lymph node metastasis generally had poor prognosis. Meanwhile, Guner et al. (33) confirmed that EMVI-positive patients with rectal cancer had worse disease-free survival (DFS) and overall survival and EMVI status was a significant predictor. Meng et al. (34) evaluated 171 patients with locally advanced rectal cancer and found the three-year DFS of EMVI-positive patients was lower than that of EMVI negative patients; in addition, positive EMVI was an independent adverse prognostic factor. Similarly, the prognostic significance of EMVI was proved in the study by Lee et al. (35). They retrospectively analyzed the data of 200 patients with rectal cancer and demonstrated that the EMVI status was correlated with mean DFS. The mean DFS for EMVI-positive and -negative patients was 57.56 and 72.46 months, respectively. Finally, Shiraishi et al. (36) revealed that EMVI was associated with survival outcomes and the patients with positive EMVI had a worse prognosis. The five-year distant metastasis-free survival in their study for EMVI-positive and -negative patients was 49.7% and 83.7%, respectively. These studies indicated that EMVI is of great importance to patients with rectal cancer. An accurate preoperative diagnosis is helpful for risk stratification so that patients can get the best benefit from individualized treatment.
The present study has some limitations. First, the study design was retrospective. However, the patients were consecutively and accurately retrieved from the database and this would partly offset the disadvantage. Second, the patients were from one center because of data confidentiality, and external data are needed for further validation. Third, the sample size was relatively limited. Multi-center, large-scale, and prospective studies are the focus of our future work.
In conclusion, we constructed different prediction models through several algorithms and identified the optimal model, which had the best predictive performance. The optimal prediction model is a meaningful method for clinical practice and can support decision making.
Footnotes
Declaration of conflicting interests
The author(s) declared no potential conflicts of interest with respect to the research, authorship, and/or publication of this article.
Funding
The author(s) disclosed receipt of the following financial support for the research, authorship, and/or publication of this article: This work was supported by the National Key Research and Development Program of China (grant no. 2019YFC0118100); the National Natural Science Foundation of China (grant nos. 81671760, 81873910, 62171167, 62172401, 12026602); the Guangdong Key Area Research and Development Program (grant no. 2020B010165004); the Shenzhen Key Basic Science Program (grant no. JCYJ20180507182437217); and the China Postdoctoral Science Foundation (grant no. 2021MD703827).