
Abstract
Background
The lymphovascular space invasion (LVSI) status of endometrial cancer (EC) has guiding significance in lymph node dissection. However, LVSI can only be obtained after surgery. Researchers have tried to extract the information of LVSI using magnetic resonance imaging (MRI).
Purpose
To evaluate the ability of preoperative MRI to predict the LVSI status of EC.
Material and Methods
A search was conducted by using the PubMed/MEDLINE, EMBASE, Web of Science, and the Cochrane Library databases. Articles were included according to the criteria. Methodological quality was assessed using the Quality Assessment of Diagnostic Accuracy Studies 2. A bivariate random effects model was used to obtain pooled summary estimates, heterogeneity, and the area under the summary receiver operating characteristic curve (AUC). A subgroup analysis was performed to identify sources of heterogeneity.
Results
A total of nine articles (814 patients) were included. The risk of bias was low or unclear for most studies, and the applicability concerns were low or unclear for all studies. The summary AUC values as well as pooled sensitivity and specificity of LVSI status in EC were 0.82, 73%, and 77%, respectively. According to the subgroup analysis, radiomics/non-radiomics features, country/region, sample size, age, MR manufacturer, magnetic field, scores of risk bias, and scores of applicability concern may have caused heterogeneity.
Conclusion
Our meta-analysis showed that MRI has moderate diagnostic efficacy for LVSI status in EC. Large-sample, uniformly designed studies are needed to verify the true value of MRI in assessing LVSI.
Introduction
Endometrial cancer (EC) is a common malignancy of the reproductive system in women. Early EC is treated mainly by total hysterosalpingo-oophorectomy. Gynecologists use risk stratification as the primary reference when deciding whether to perform lymphadenectomy and postoperative adjuvant therapy. According to the European Society of Medical Oncology (ESMO) guideline (1), risk stratification is assessed by the histopathologic subtype, histologic grade, International Federation of Gynecology and Obstetrics (FIGO) stage, and lymphovascular space invasion (LVSI), among which LVSI is of great importance (2–5). However, LVSI cannot be confirmed by endometrial biopsy preoperatively and is usually only confirmed after a hysterectomy (6,7). Therefore, it is essential to explore an accurate method to assess LVSI preoperatively and non-invasively.
Magnetic resonance imaging (MRI) is a non-invasive detection tool with high soft-tissue resolution and multisequence imaging capabilities that plays an indispensable role in the preoperative staging of EC (8). Many studies have confirmed that MRI is the most accurate method for the preoperative evaluation of the FIGO stage of EC, and it is widely used in clinical practice. MRI can reveal local tumor features (9,10), such as deep myometrial invasion and cervical interstitial invasion, in addition to overall features (11–13), such as lymph node metastasis and distant metastasis. Furthermore, the feasibility of using MRI to evaluate LVSI has been investigated within the recent decades. Some studies have reported that morphological features (6,14,15) observed on MRI (including tumor volume and short axis of the tumor) can predict LVSI status. For example, the sensitivity and specificity of the short axis of the tumor for distinguishing LVSI are 56.5% and 83.5%, respectively, and tumor volume ratio (TVR) allows LVSI to be predicted with a sensitivity of 77% and specificity of 83%. Diffusion-weighted imaging (DWI)-derived parameters, functional imaging features, and other new techniques are also used to predict LVSI status (16–19). Recently, the application value of radiomics analysis based on MRI for assessing the status of LVSI in EC was explored, with sensitivity in the range of 66.7%–92.8% and specificity in the range of 59%–78.6% in different models (20–25). However, studies that assessed LVSI based on MR images used various sample sizes, and their findings also differed.
Evidence-based medicine has not been supported by the diagnostic ability of MRI to detect LVSI. In 2019, Yan et al. (26) conducted a meta-analysis for ADC to distinguish tumor grade, deep myometrial invasion, and LVSI in EC; however, only two original studies were included in the assessment of LVSI. Recently, a systematic review (26) of three studies assessed the role of radiomics in the preoperative assessment of LVSI in EC. As more studies are reported, it is necessary to conduct additional meta-analyses to evaluate the cumulative research findings regarding LVSI.
Therefore, the aim of the present study was to evaluate the ability of preoperative MRI to predict LVSI status in EC.
Material and Methods
This meta-analysis followed the recommendations of the Preferred Reporting Items for Systematic Reviews and Meta-Analysis (PRISMA) (27) to assess the accuracy of the diagnostic tests. Two reviewers (with four and eight years of gynecologic imaging experience) independently performed the literature screen, data extraction, and quality assessment. Any disagreements were resolved through discussion with a third reviewer (with 13 years of gynecologic imaging experience).
Literature search
A comprehensive search of all original studies assessing the diagnostic efficacy of LVSI status in EC by MRI was performed using the PubMed/MEDLINE, Web of Science, Embase, and Cochrane Library databases. The search queries included “endometrial cancer,” “MRI,” “LVSI,” and synonyms for these keywords. Details of the search strategy are listed in the supplement file. The search ended on 30 June 2022, and EndNote X9 (Thomas Reuters, New York, NY, USA) was used for the literature screen. Furthermore, we manually verified the references of the included articles.
Inclusion and exclusion criteria
The inclusion criteria were as follows: (i) all patients with postoperative pathologically confirmed EC regardless of histologic subtype; (ii) the reference standard was to evaluate the status of LVSI with post-hysterectomy specimens; (iii) the article was published in English; (iv) the information on true positives, false positives, true negatives, and false negatives could be extracted from the article or could otherwise be obtained by contacting the authors to reconstruct the 2 × 2 tables; and (v) when data were repeatedly published, the most recently published article was selected.
The exclusion criteria were as follows: (i) patients who received any adjuvant therapy before surgery; (ii) cancer foci that could not be visualized on MR images; (iii) articles in the form of conference abstracts, case reports, studies that included <5 patients, editorials, guidelines, or letters; and (iv) non-human studies.
Data extraction and quality assessment
Extracted data were divided into the following categories: patient characteristics (including country/region, year, average age, sample size, distribution of FIGO stage, histopathologic subtypes and histopathologic grades); study characteristics (including study design, recruitment methods, the time interval between the index test and the reference standard, blindness to the index test during the reference test and blindness to the reference test during the index test); and imaging characteristics (including magnetic field and MR manufacturers). It was also necessary that critical data, including true positives, false positives, true negatives, and false negatives, could be extracted. These data were imported into Excel 2016 (Microsoft, Redmond, WA, USA). Optimal parameters were selected when multiple parameters with diagnostic accuracy were reported. When a training cohort or test/validation cohort was involved, the test/validation cohort was selected.
The Quality Assessment of Diagnostic Accuracy Studies 2 (QUADAS-2) was used to assess the quality of the included literature in two dimensions: risk of bias and applicability concerns. The risk of bias was assessed in four domains: patient selection; index test; reference standard; and flow and timing. Risk levels were categorized as high risk, unclear risk, and low risk, which corresponded to scores of 3, 2, and 1, respectively. Applicability concerns were assessed in three dimensions and scored in the same manner as the risk of bias.
Pathological diagnosis of LVSI in EC
LVSI usually refers to the presence of tumor cells in spaces surrounded by flat endothelial cells outside the neoplasm (2,28). It can be defined as the presence of tumor cells in the lymphatic and/or vascular spaces within the myometrium in EC. The status of LVSI is described as LVSI positive or LVSI negative.
Statistical analysis
The QUADAS-2 (29) was evaluated using Review Manager 5.3 (Cochrane Collaboration, Copenhagen, Denmark) software. Meta-Disc 1.4 (Ramony Cajal Hospital, Madrid, Spain) (30) software was used to perform the Spearman correlation test to explore possible threshold effects.
The meta-analysis was performed using the MIDAS command (31) and a bivariate random-effects model (32) in Stata 16 (StataCorp, College Station, TX, USA) software. A combination of Cochran Q tests and I2 factors (33) was used to assess heterogeneity among the original studies, and a value of P < 0.05 was considered statistically significant. The value of I2 was suggestive of the degree of interstudy heterogeneity, with I2 >50% indicating heterogeneity (34). A sensitivity analysis and subgroup analysis were used to explore the sources of heterogeneity. The subgroup analysis was performed with the following groupings: radiomics/non-radiomics features, country/region, sample size, age, MR manufacturer, magnetic field, scores of risk, and scores of applicability concern.
The pooled sensitivity, specificity, positive likelihood ratio, negative likelihood ratio, and diagnostic advantage ratio, as well as their corresponding 95% confidence intervals (CIs), were calculated to assess the performance of MRI in diagnosing LVSI. Forest plots were constructed to demonstrate sensitivity and specificity, and summary receiver operating characteristic (SROC) curves were plotted to estimate diagnostic performance.
A linear regression test was performed to assess funnel plot asymmetry, and Deeks’ funnel plots were used to clarify the publication bias of the included studies. A slope coefficient of P < 0.10 indicated significant asymmetry.
Results
Literature search
We retrieved a total of 137 records through a comprehensive search. The literature screen was performed with EndNote X9, and 45 records were identified as duplicates. We excluded 12 reviews, 13 conference abstracts, eight case reports/case series, and four systematic reviews/meta-analyses. In addition, 34 unrelated studies, 10 studies with insufficient data to construct 2 × 2 tables, one non-English study, and one study with an overlapping population were further excluded after reading the full texts. Finally, nine studies that met the inclusion and exclusion criteria were included (Fig. 1). Of the nine studies, almost all were published within the last five years, and six were conducted in China.
Data extraction and quality assessment
Table 1 summarizes specific information on the data extracted from the nine included studies. The QUADAS-2 scores, which indicate the methodological quality of each study, are presented in Fig. 2; the risk of bias was low or unclear for most studies. For all studies, applicability concerns were low or unclear. In the patient selection domain, two studies had an unclear risk of bias because one did not describe the method of patient recruitment as continuous or discontinuous, and the second did not indicate whether the research design was prospective or retrospective. All studies had low applicability concerns in terms of patient selection.
Characteristics of the included studies.
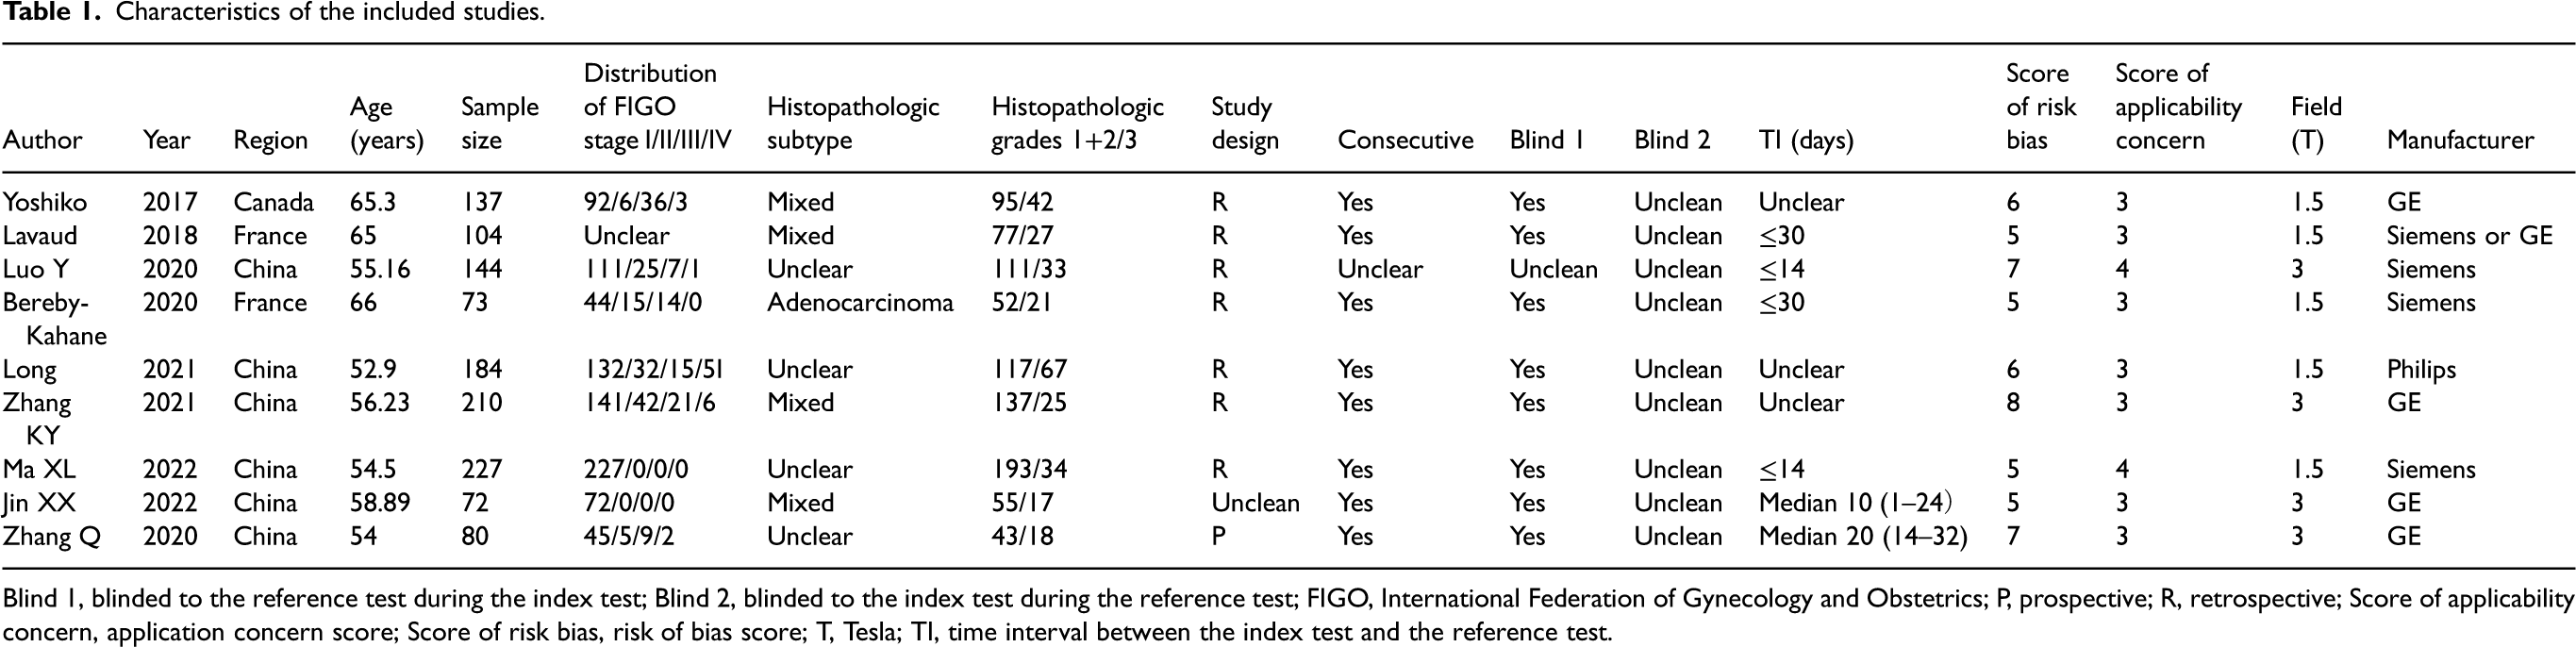
Blind 1, blinded to the reference test during the index test; Blind 2, blinded to the index test during the reference test; FIGO, International Federation of Gynecology and Obstetrics; P, prospective; R, retrospective; Score of applicability concern, application concern score; Score of risk bias, risk of bias score; T, Tesla; TI, time interval between the index test and the reference test.
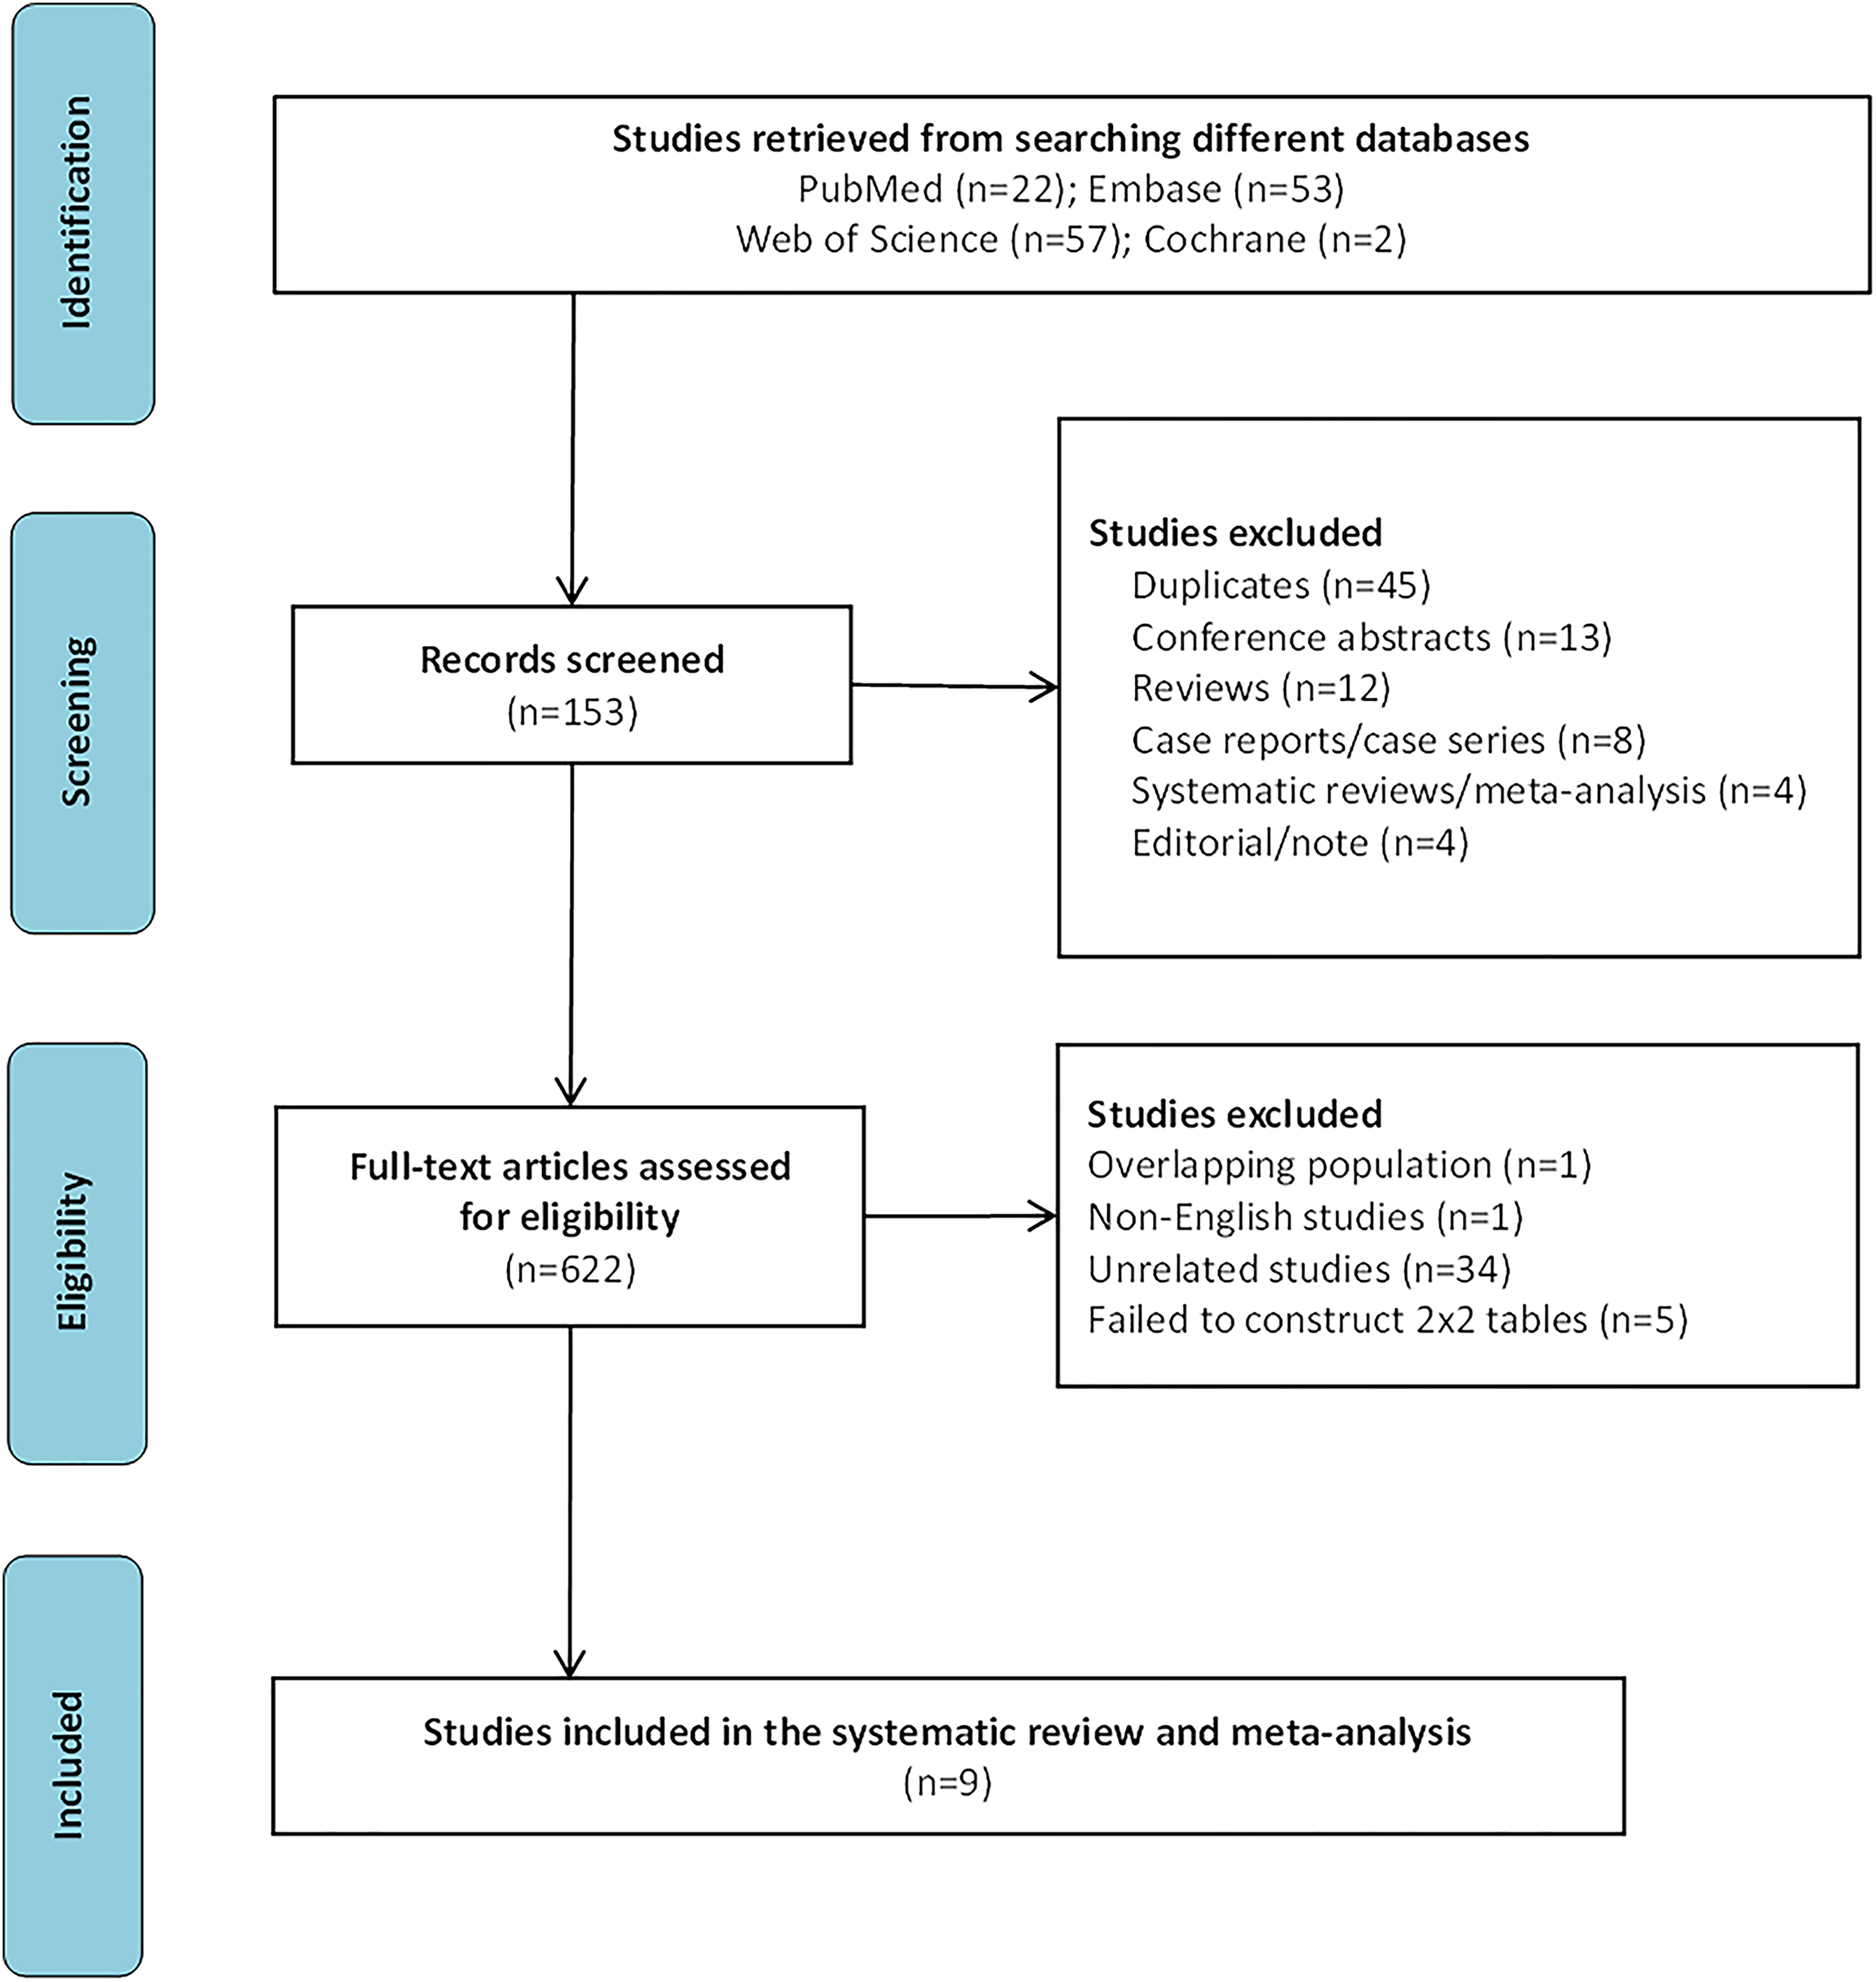
Flowchart of study selection.
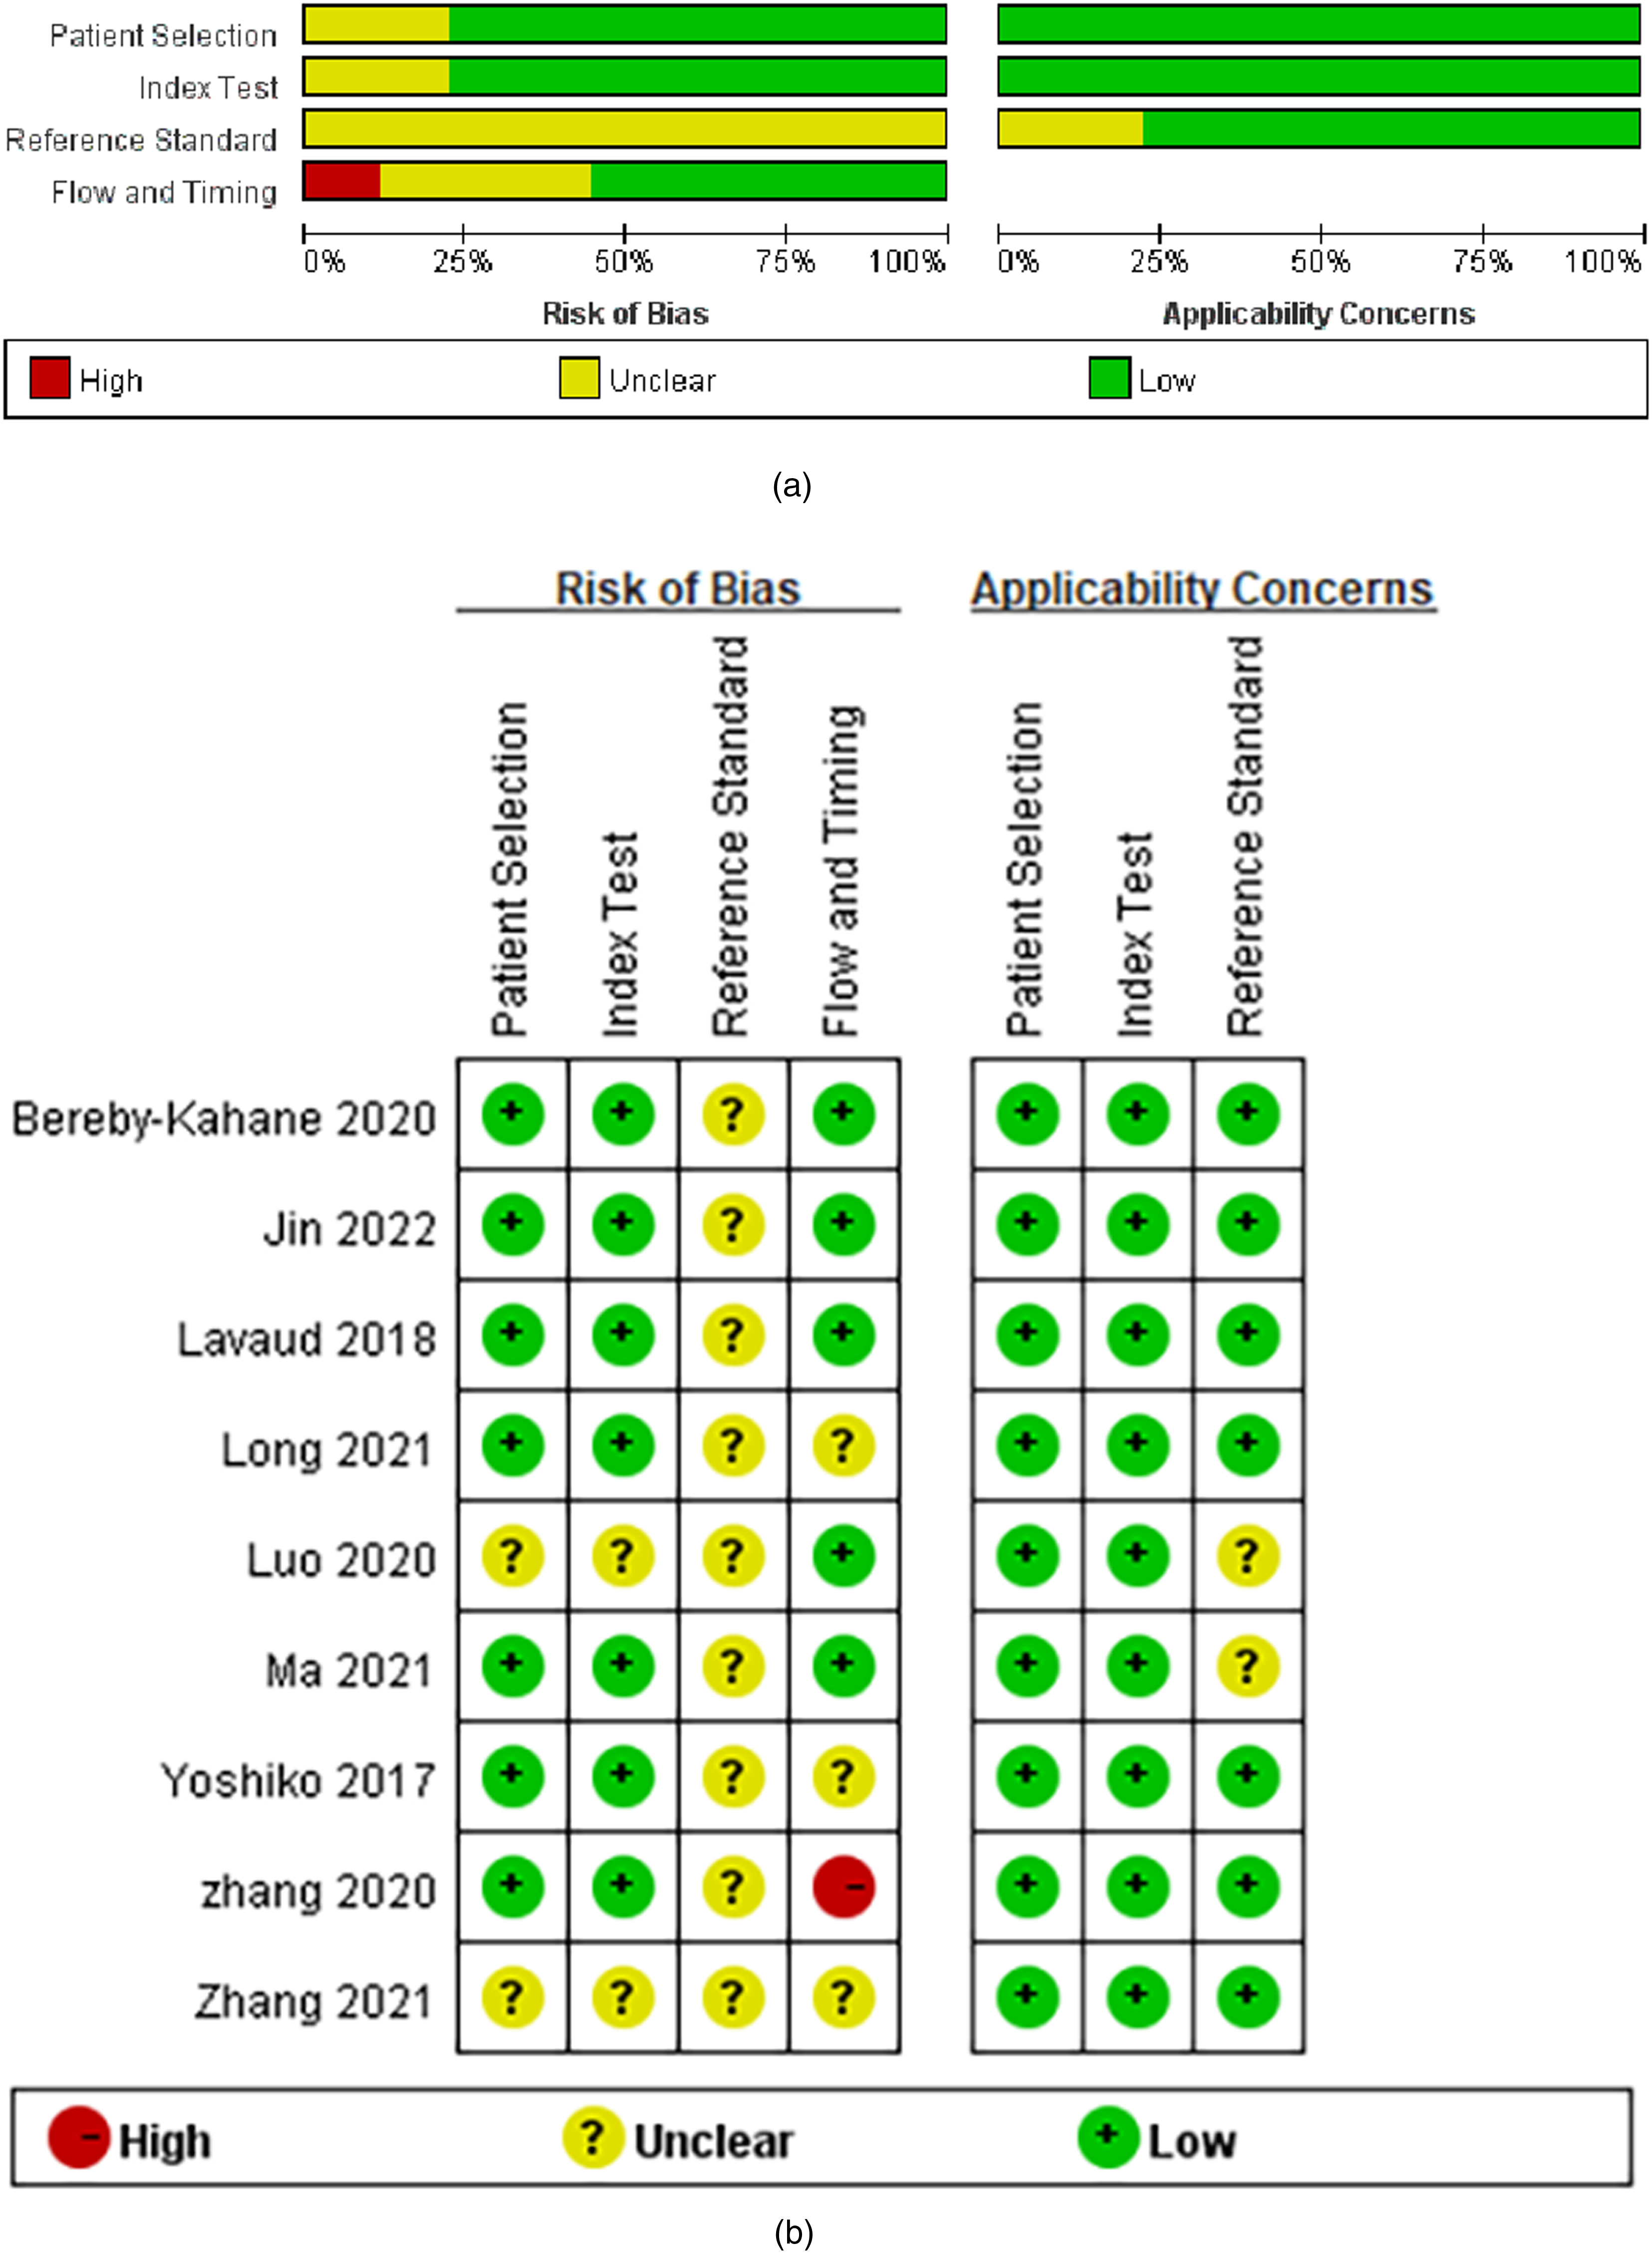
Stacked bar charts of the Quality Assessment of Diagnostic Accuracy Studies 2 scores used to assess methodologic study quality: these scores provide an overview of study quality in the whole meta-analysis.
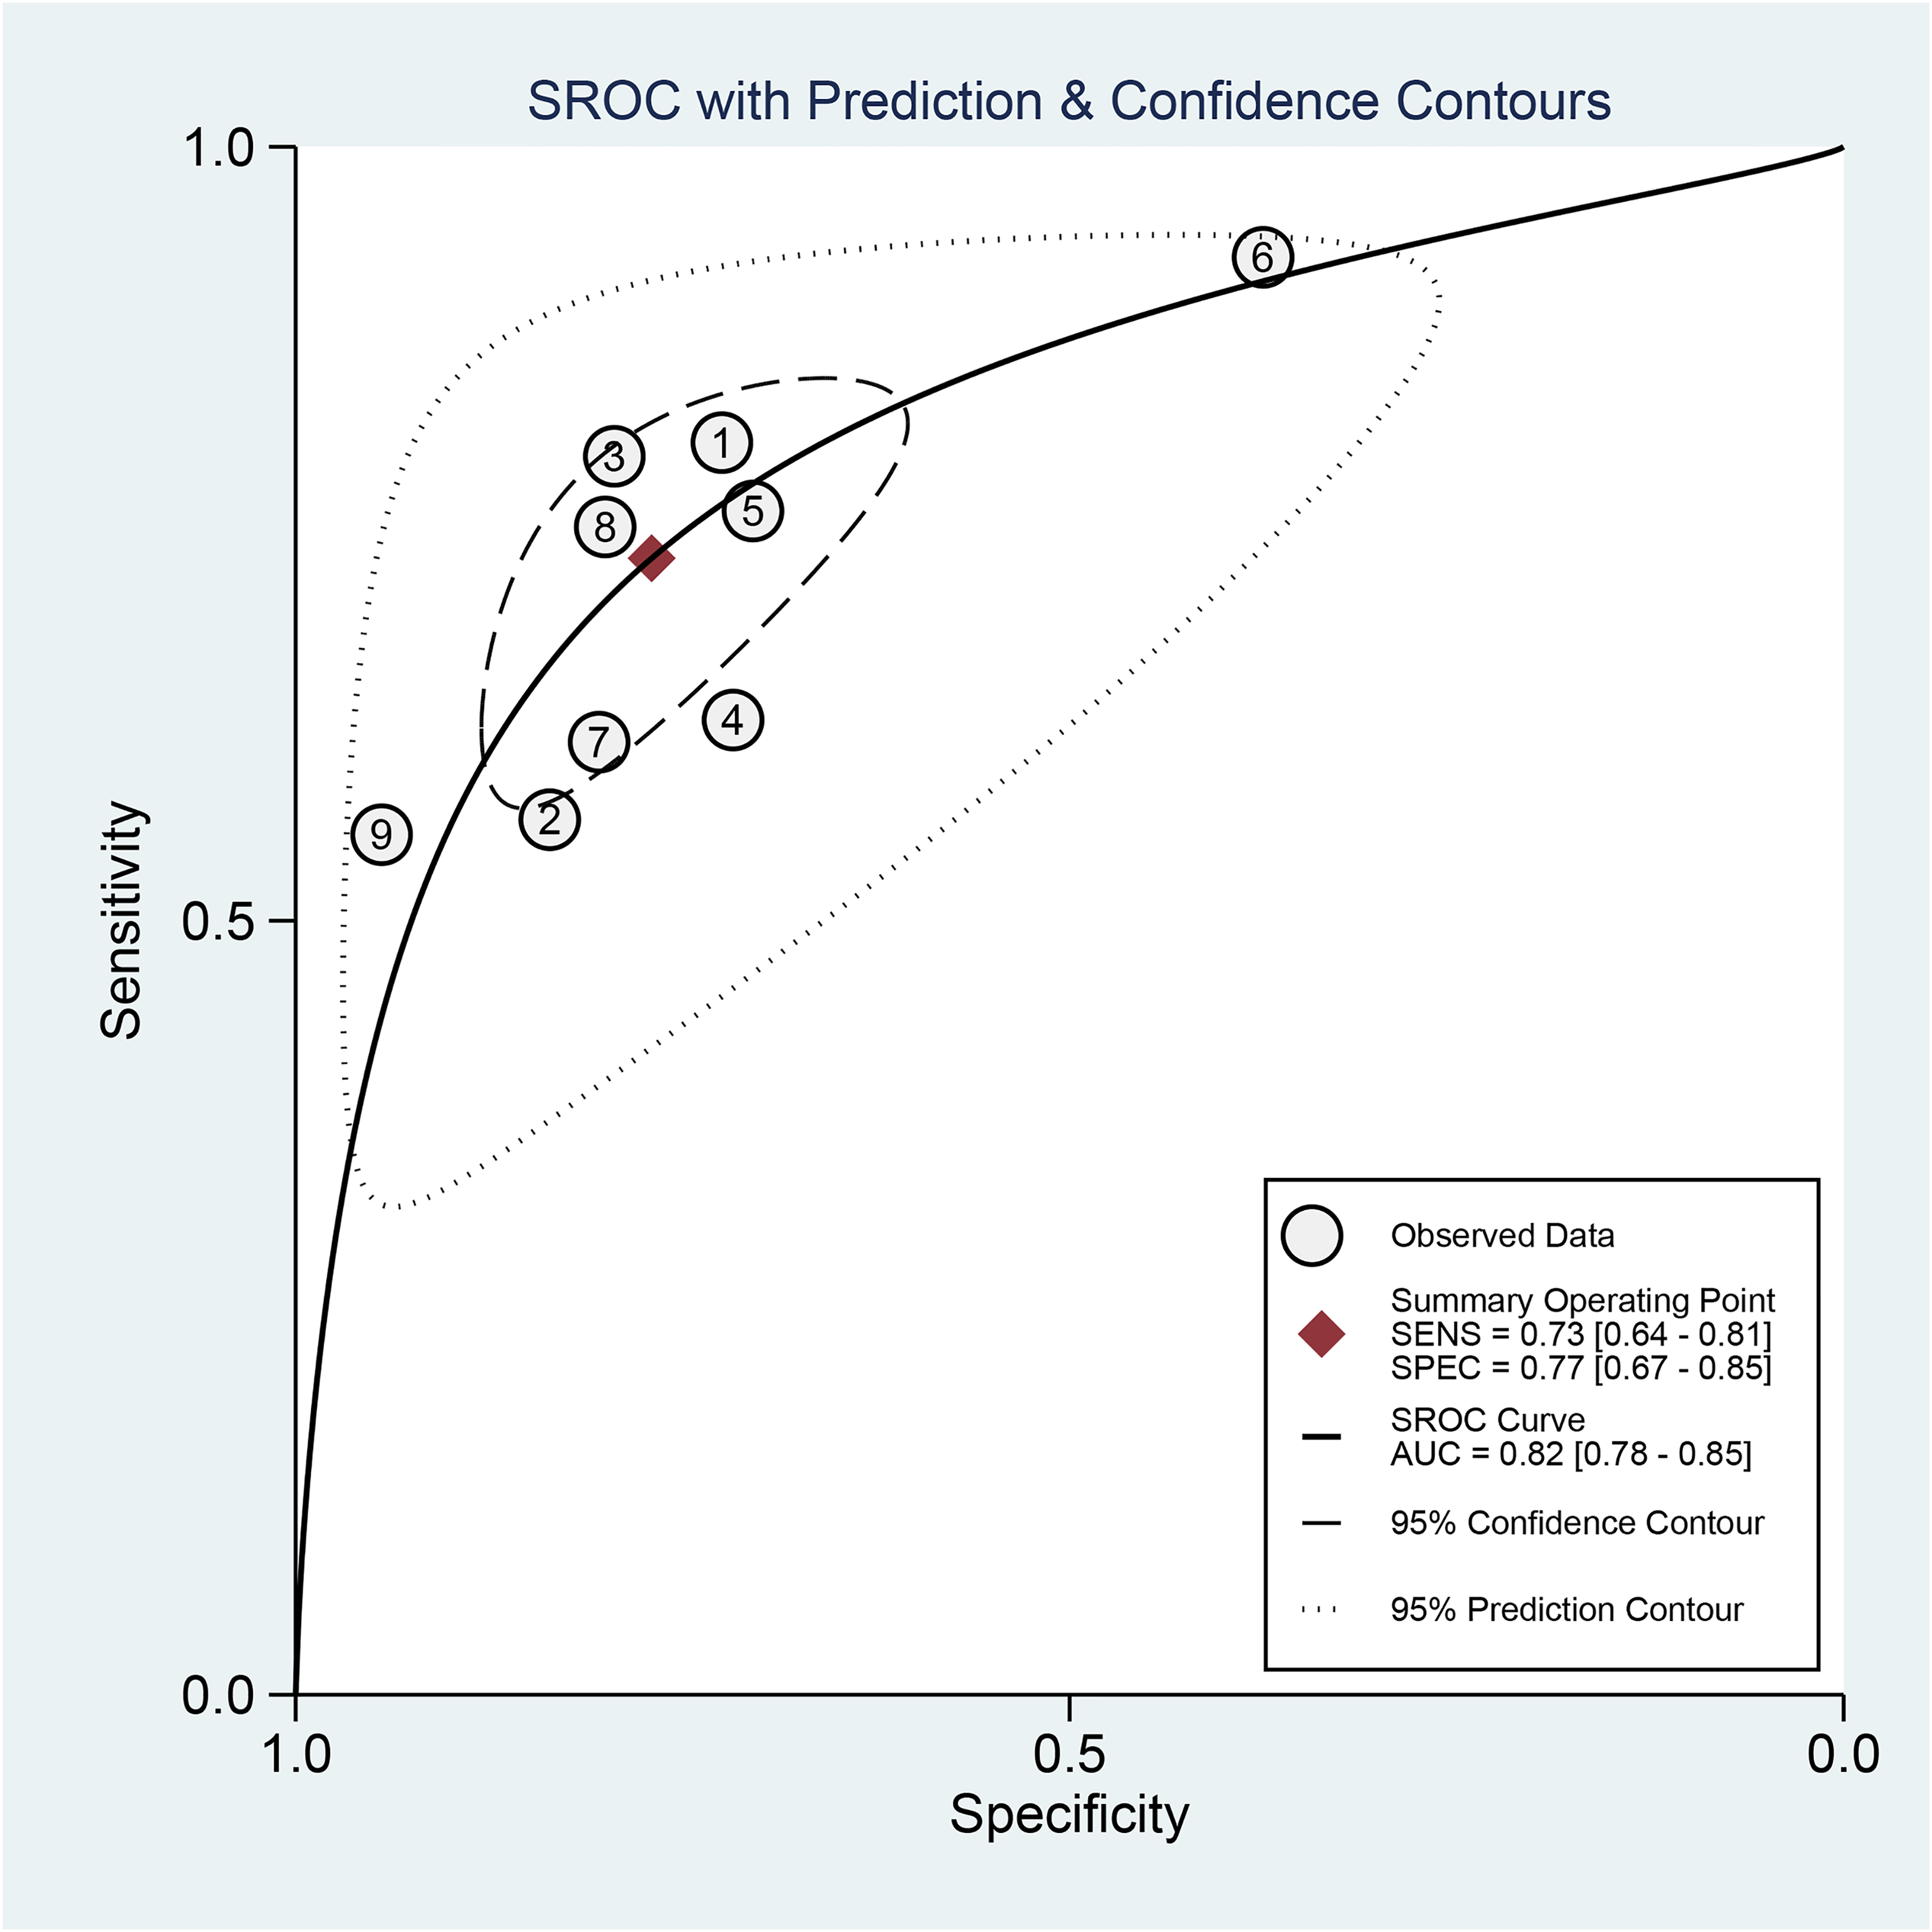
SROC plots of MRI for discriminating LVSI status.
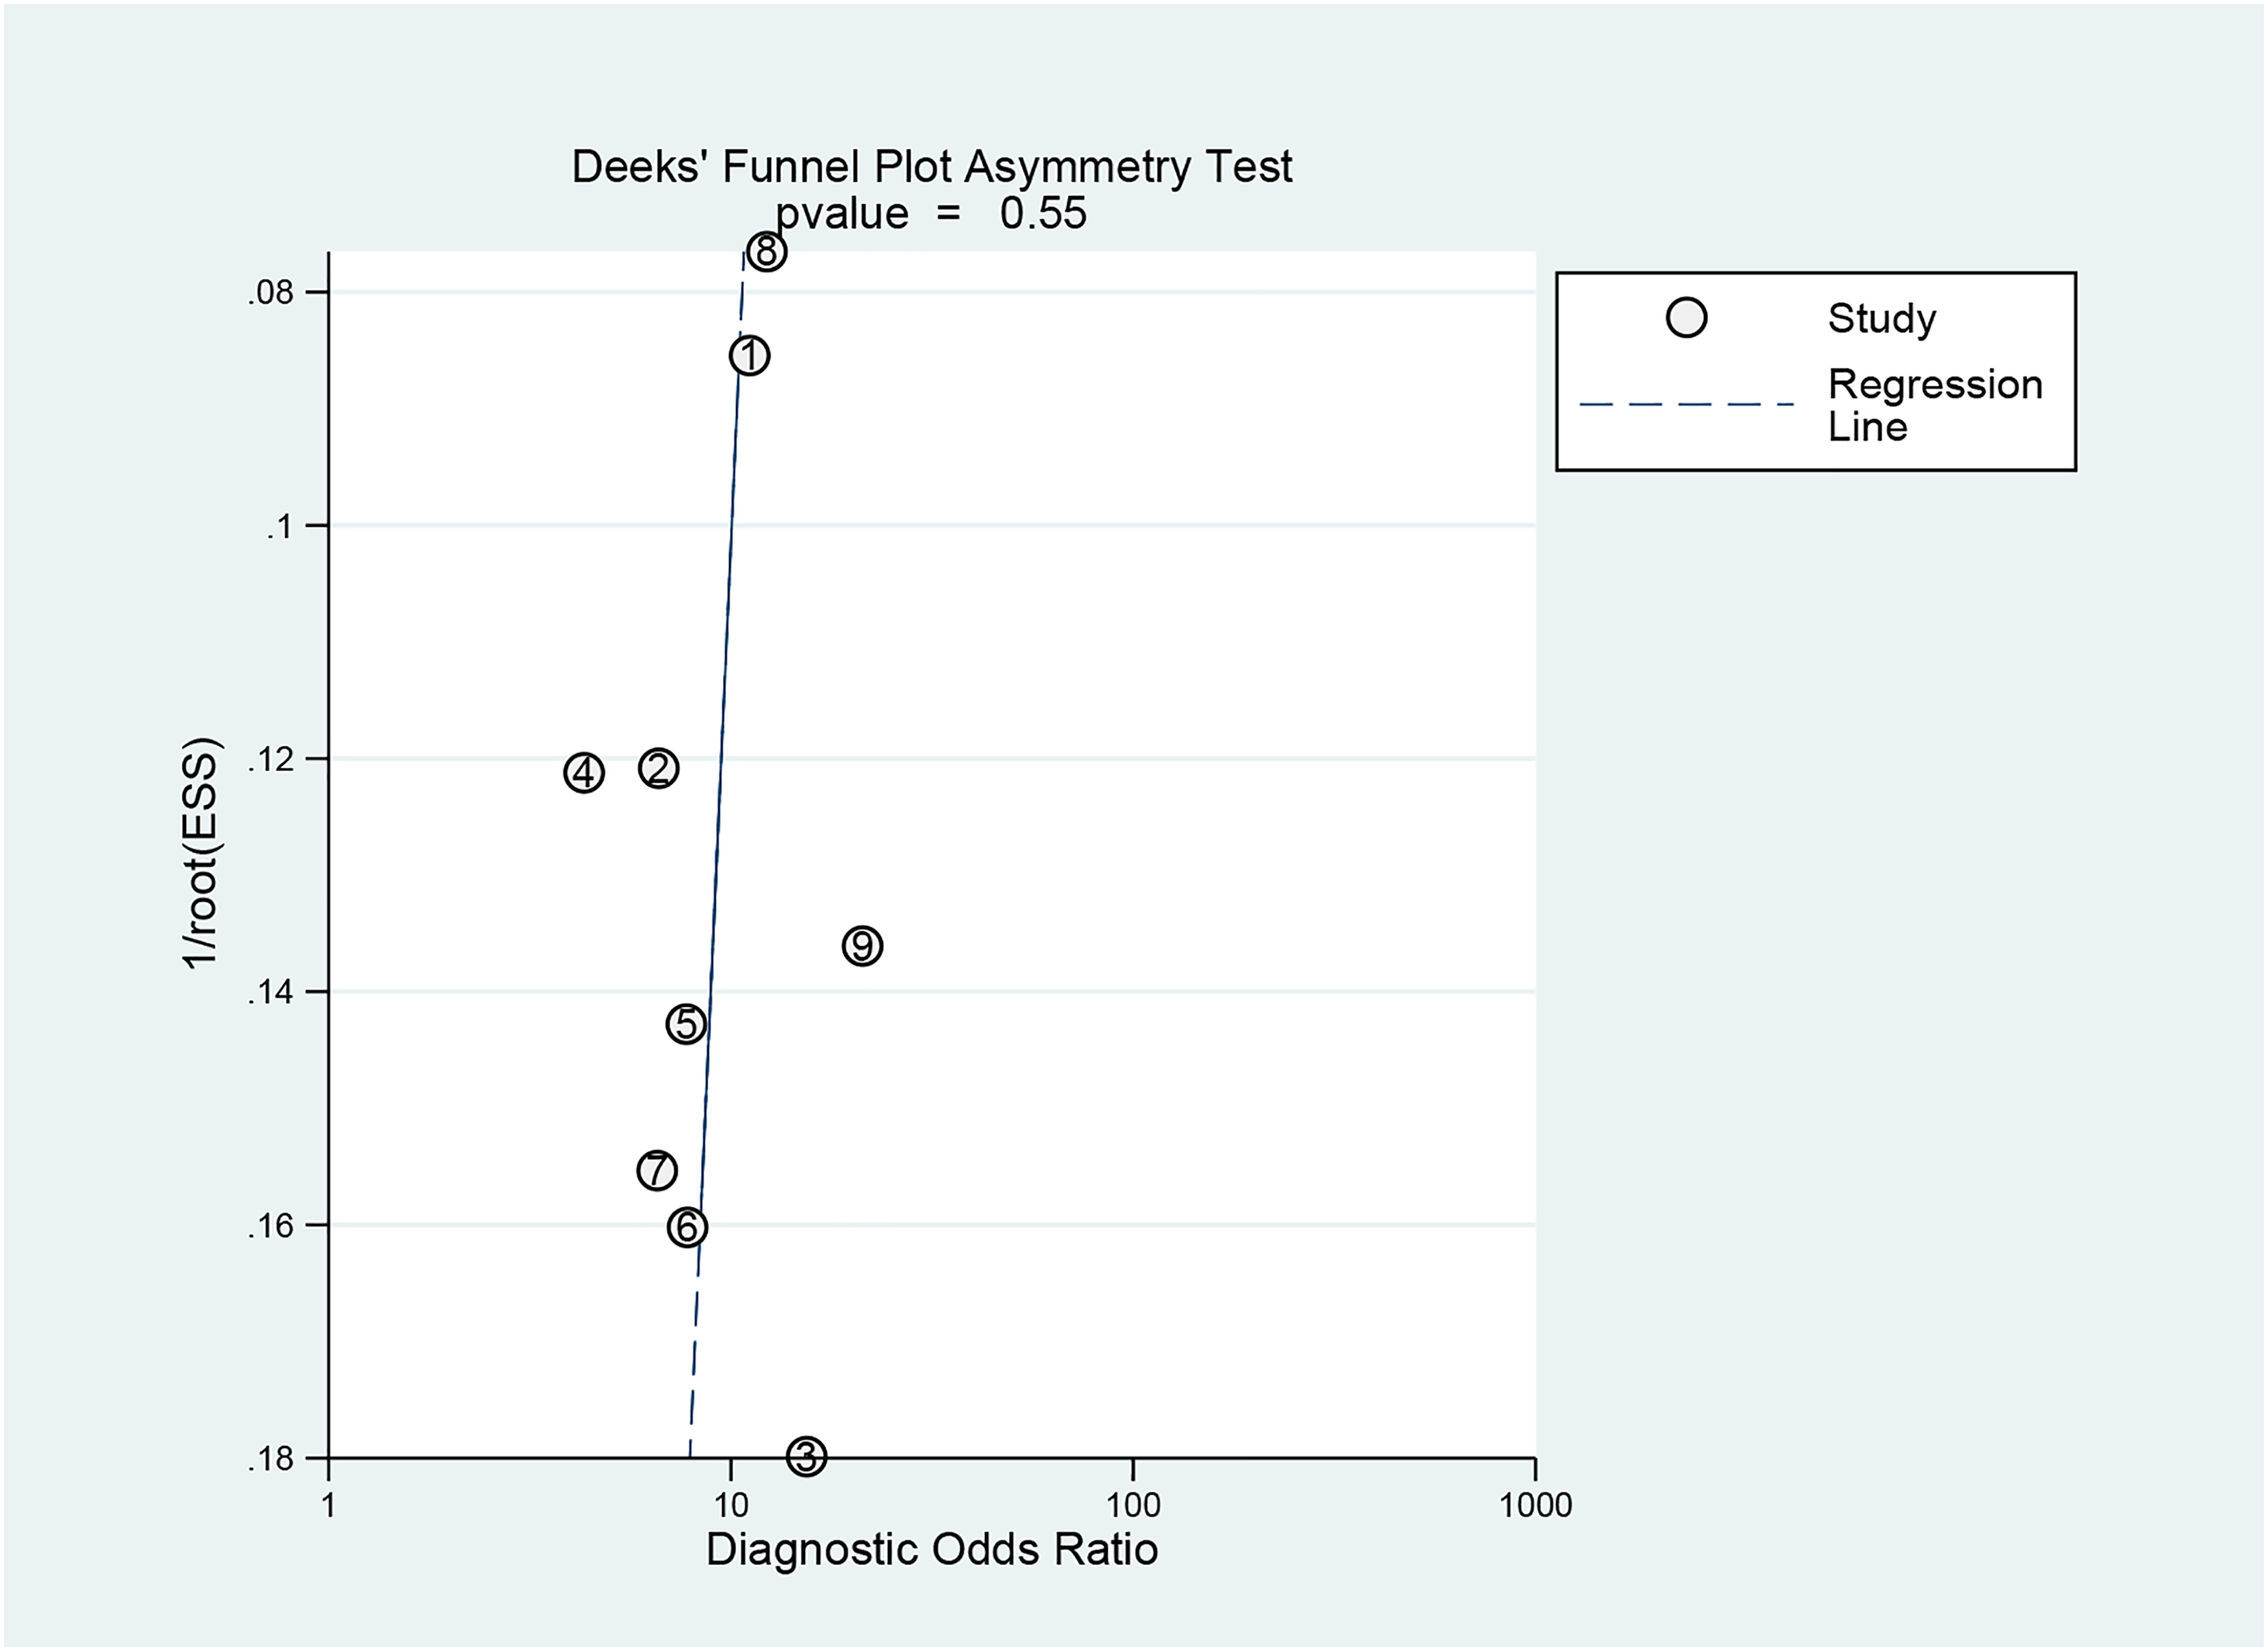
Deeks’ funnel plot for the publication bias test.
Regarding the index text domain, two studies had an unclear risk of bias because they did not present information regarding blinding to the reference test.
In the reference standard domain, all studies were considered to have an unclear risk of bias because they did not explain whether the pathology results were blinded to the MRI results. In addition, two studies had unclear applicability concerns because they had limited information about the interpretation of the gold standard. In the flow and timing domain, three studies were judged to have an unclear risk of bias due to the unclear time interval between the pathological examination and surgery. One study was considered to have a high risk of bias due to a time interval that was longer than 30 days.
Detection of LVSI in EC
Nine studies (828 patients) evaluated the diagnostic accuracy of MRI in identifying LVSI of EC. Table 2 summarizes the ability of MRI to detect LVSI in EC. The sensitivity, specificity, positive likelihood ratio, negative likelihood ratio, and diagnostic advantage ratio for this meta-analysis were 73% (95% confidence interval [CI] = 0.64–0.81), 77% (95% CI = 0.67–0.85), 3.2 (95% CI = 2.2–4.4), and 0.35 (95% CI = 0.26–0.45), respectively. The area under the ROC curve (AUC) value was 0.82 (95% CI = 0.78–0.85) (Fig. 3).
Diagnostic accuracy of MRI in assessing LVSI in EC.
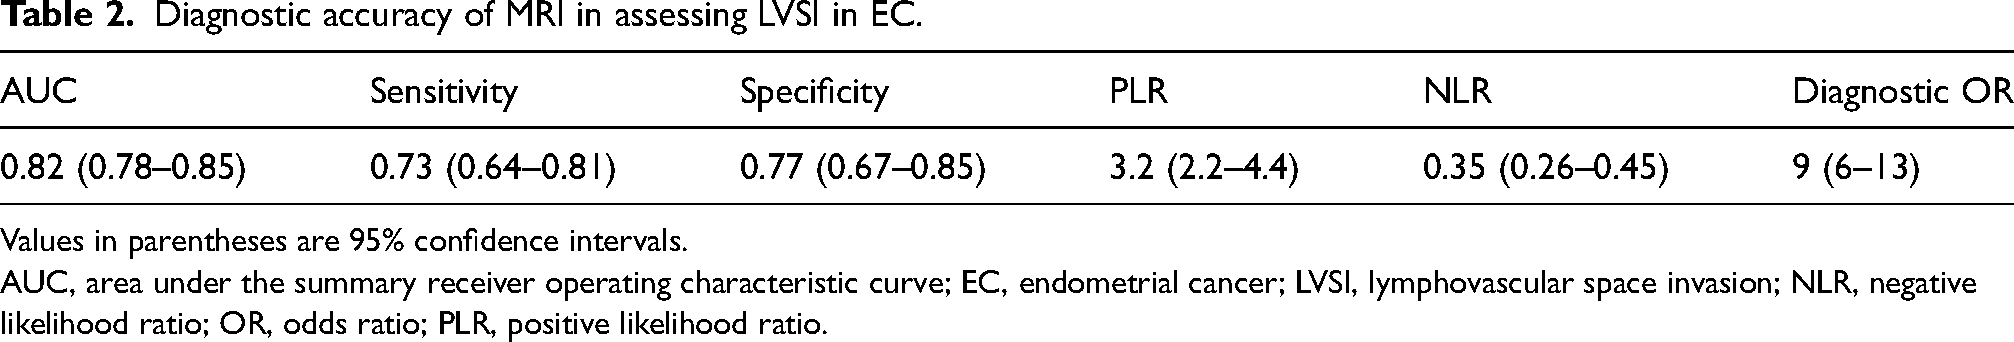
Values in parentheses are 95% confidence intervals.
AUC, area under the summary receiver operating characteristic curve; EC, endometrial cancer; LVSI, lymphovascular space invasion; NLR, negative likelihood ratio; OR, odds ratio; PLR, positive likelihood ratio.
Significant heterogeneity (I2 = 91, 95% CI = 82–100) among the original studies was observed in this meta-analysis. Deeks’ funnel plot (Fig. 4) showed no significant publication bias (P = 0.55) regarding the ability of MRI to detect the status of LVSI in EC. However, there was an interstudy threshold effect (P = 0.007).
Sensitivity analysis and subgroup analysis
Because significant heterogeneity among the original studies was observed, we performed a further sensitivity analysis, and the results are shown in Fig. 5. The box line plot (Fig. 6) shows that study 6 and study 9 fall outside the box plot, suggesting the presence of heterogeneity. Heterogeneity decreased when studies 6 and 9 were removed, and the most significant decrease was observed after study 6 was removed. The results of the subgroup analysis are shown in Table 3. In the subgroup analysis, P > 0.05 or I2 <50% was considered to indicate a lack of heterogeneity among studies. In this meta-analysis, the following covariates had no significant subgroup effects: the countries/regions; manufacturer; magnetic field intensity; blindness to the index test; time interval between assessments; and applicability concern scores. These subgroup effects may have accounted for the inclusion of fewer original studies.
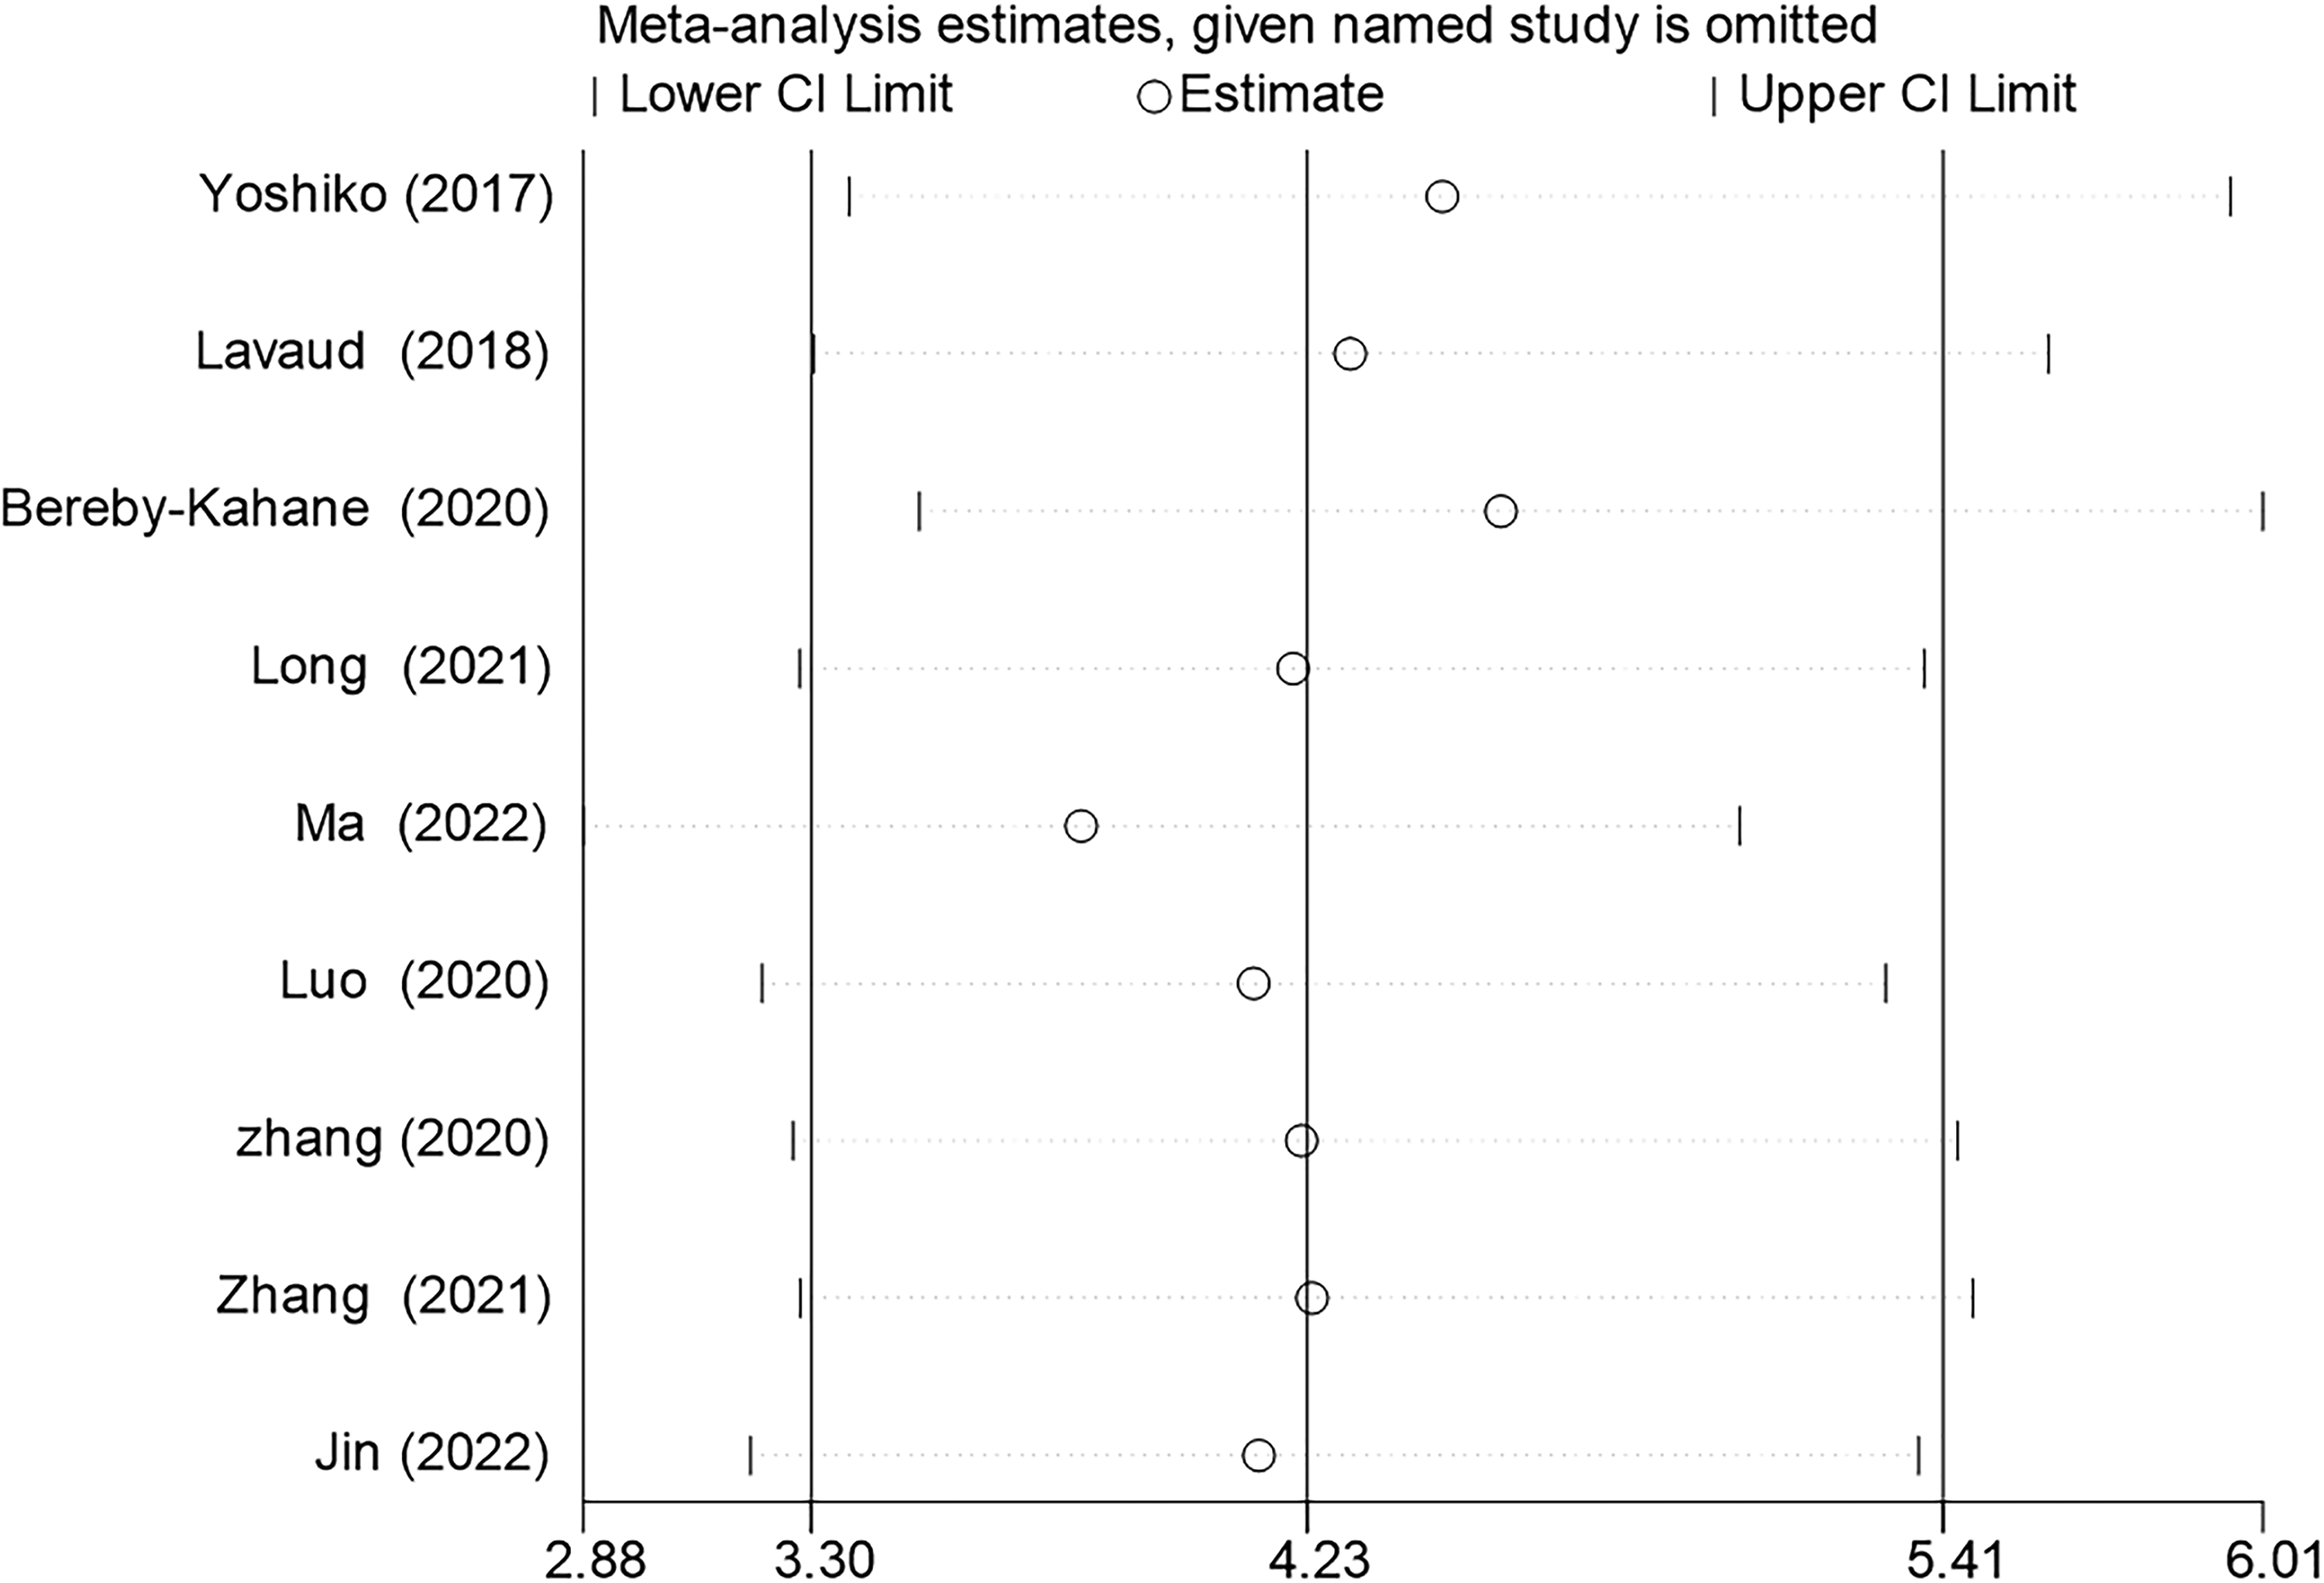
Sensitivity analysis of the stepwise rejection method shows that the results are most stable after excluding study 6 (23).
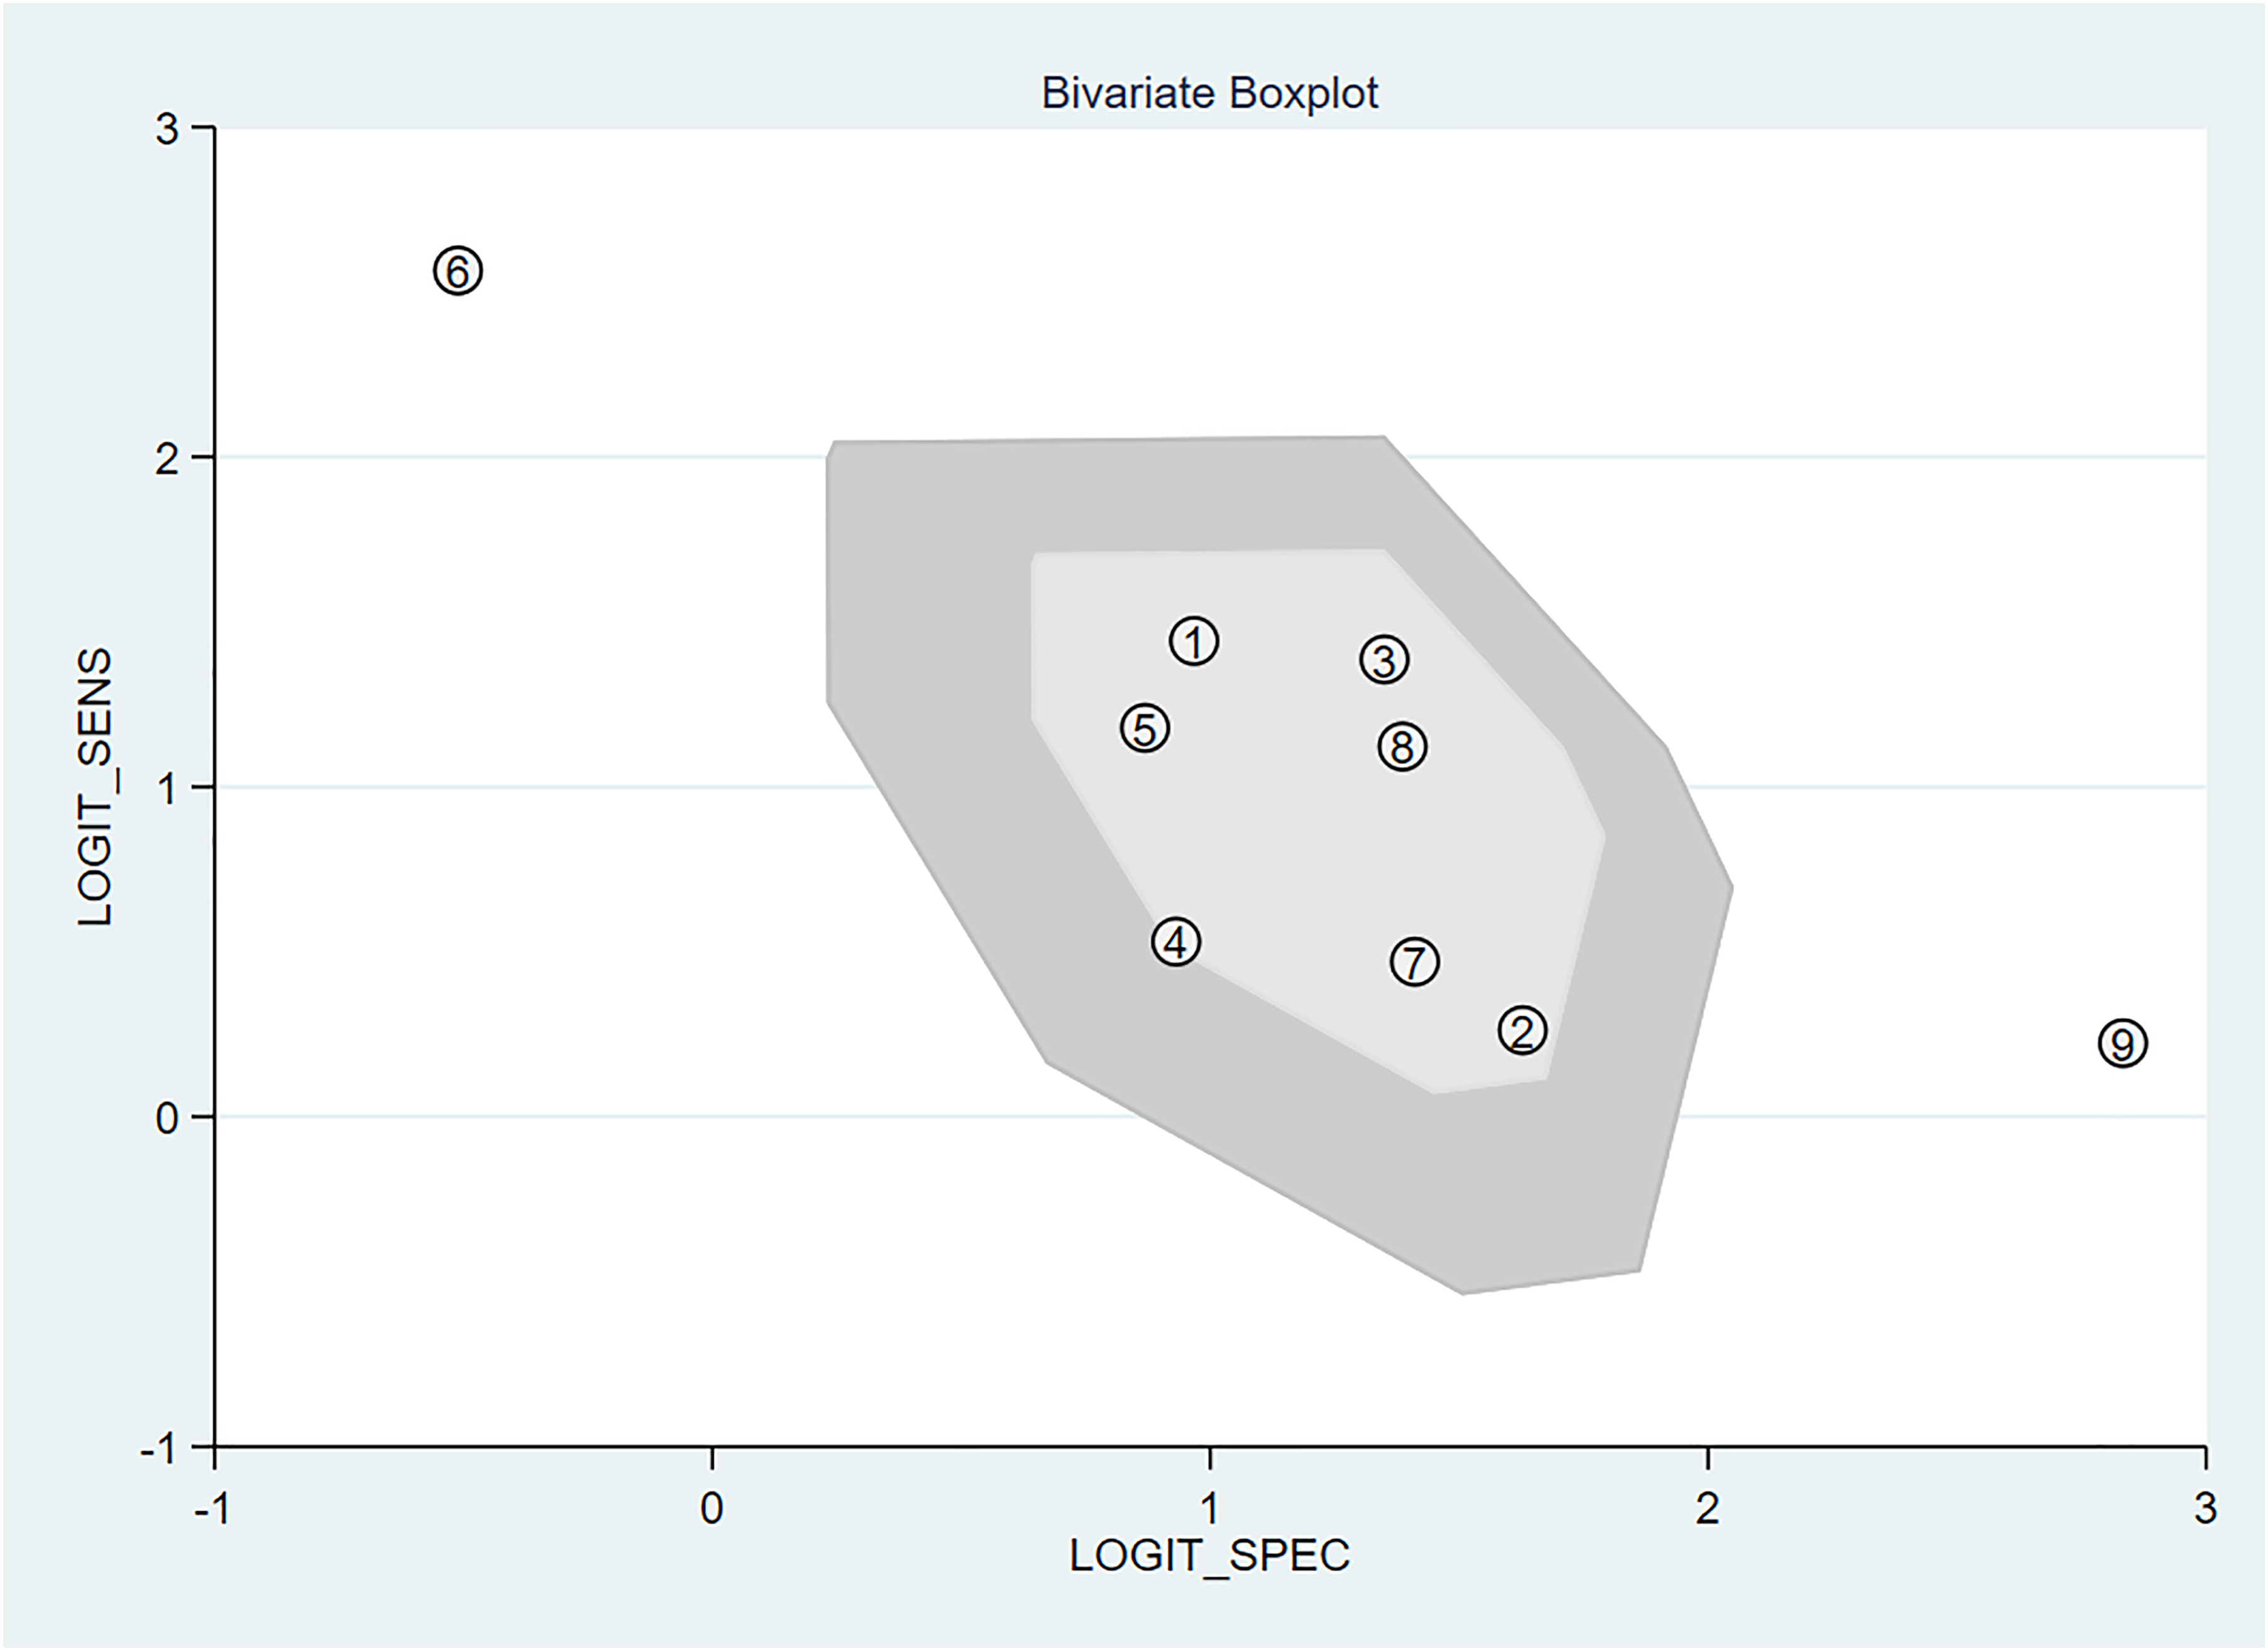
Bivariate boxplot of test results.
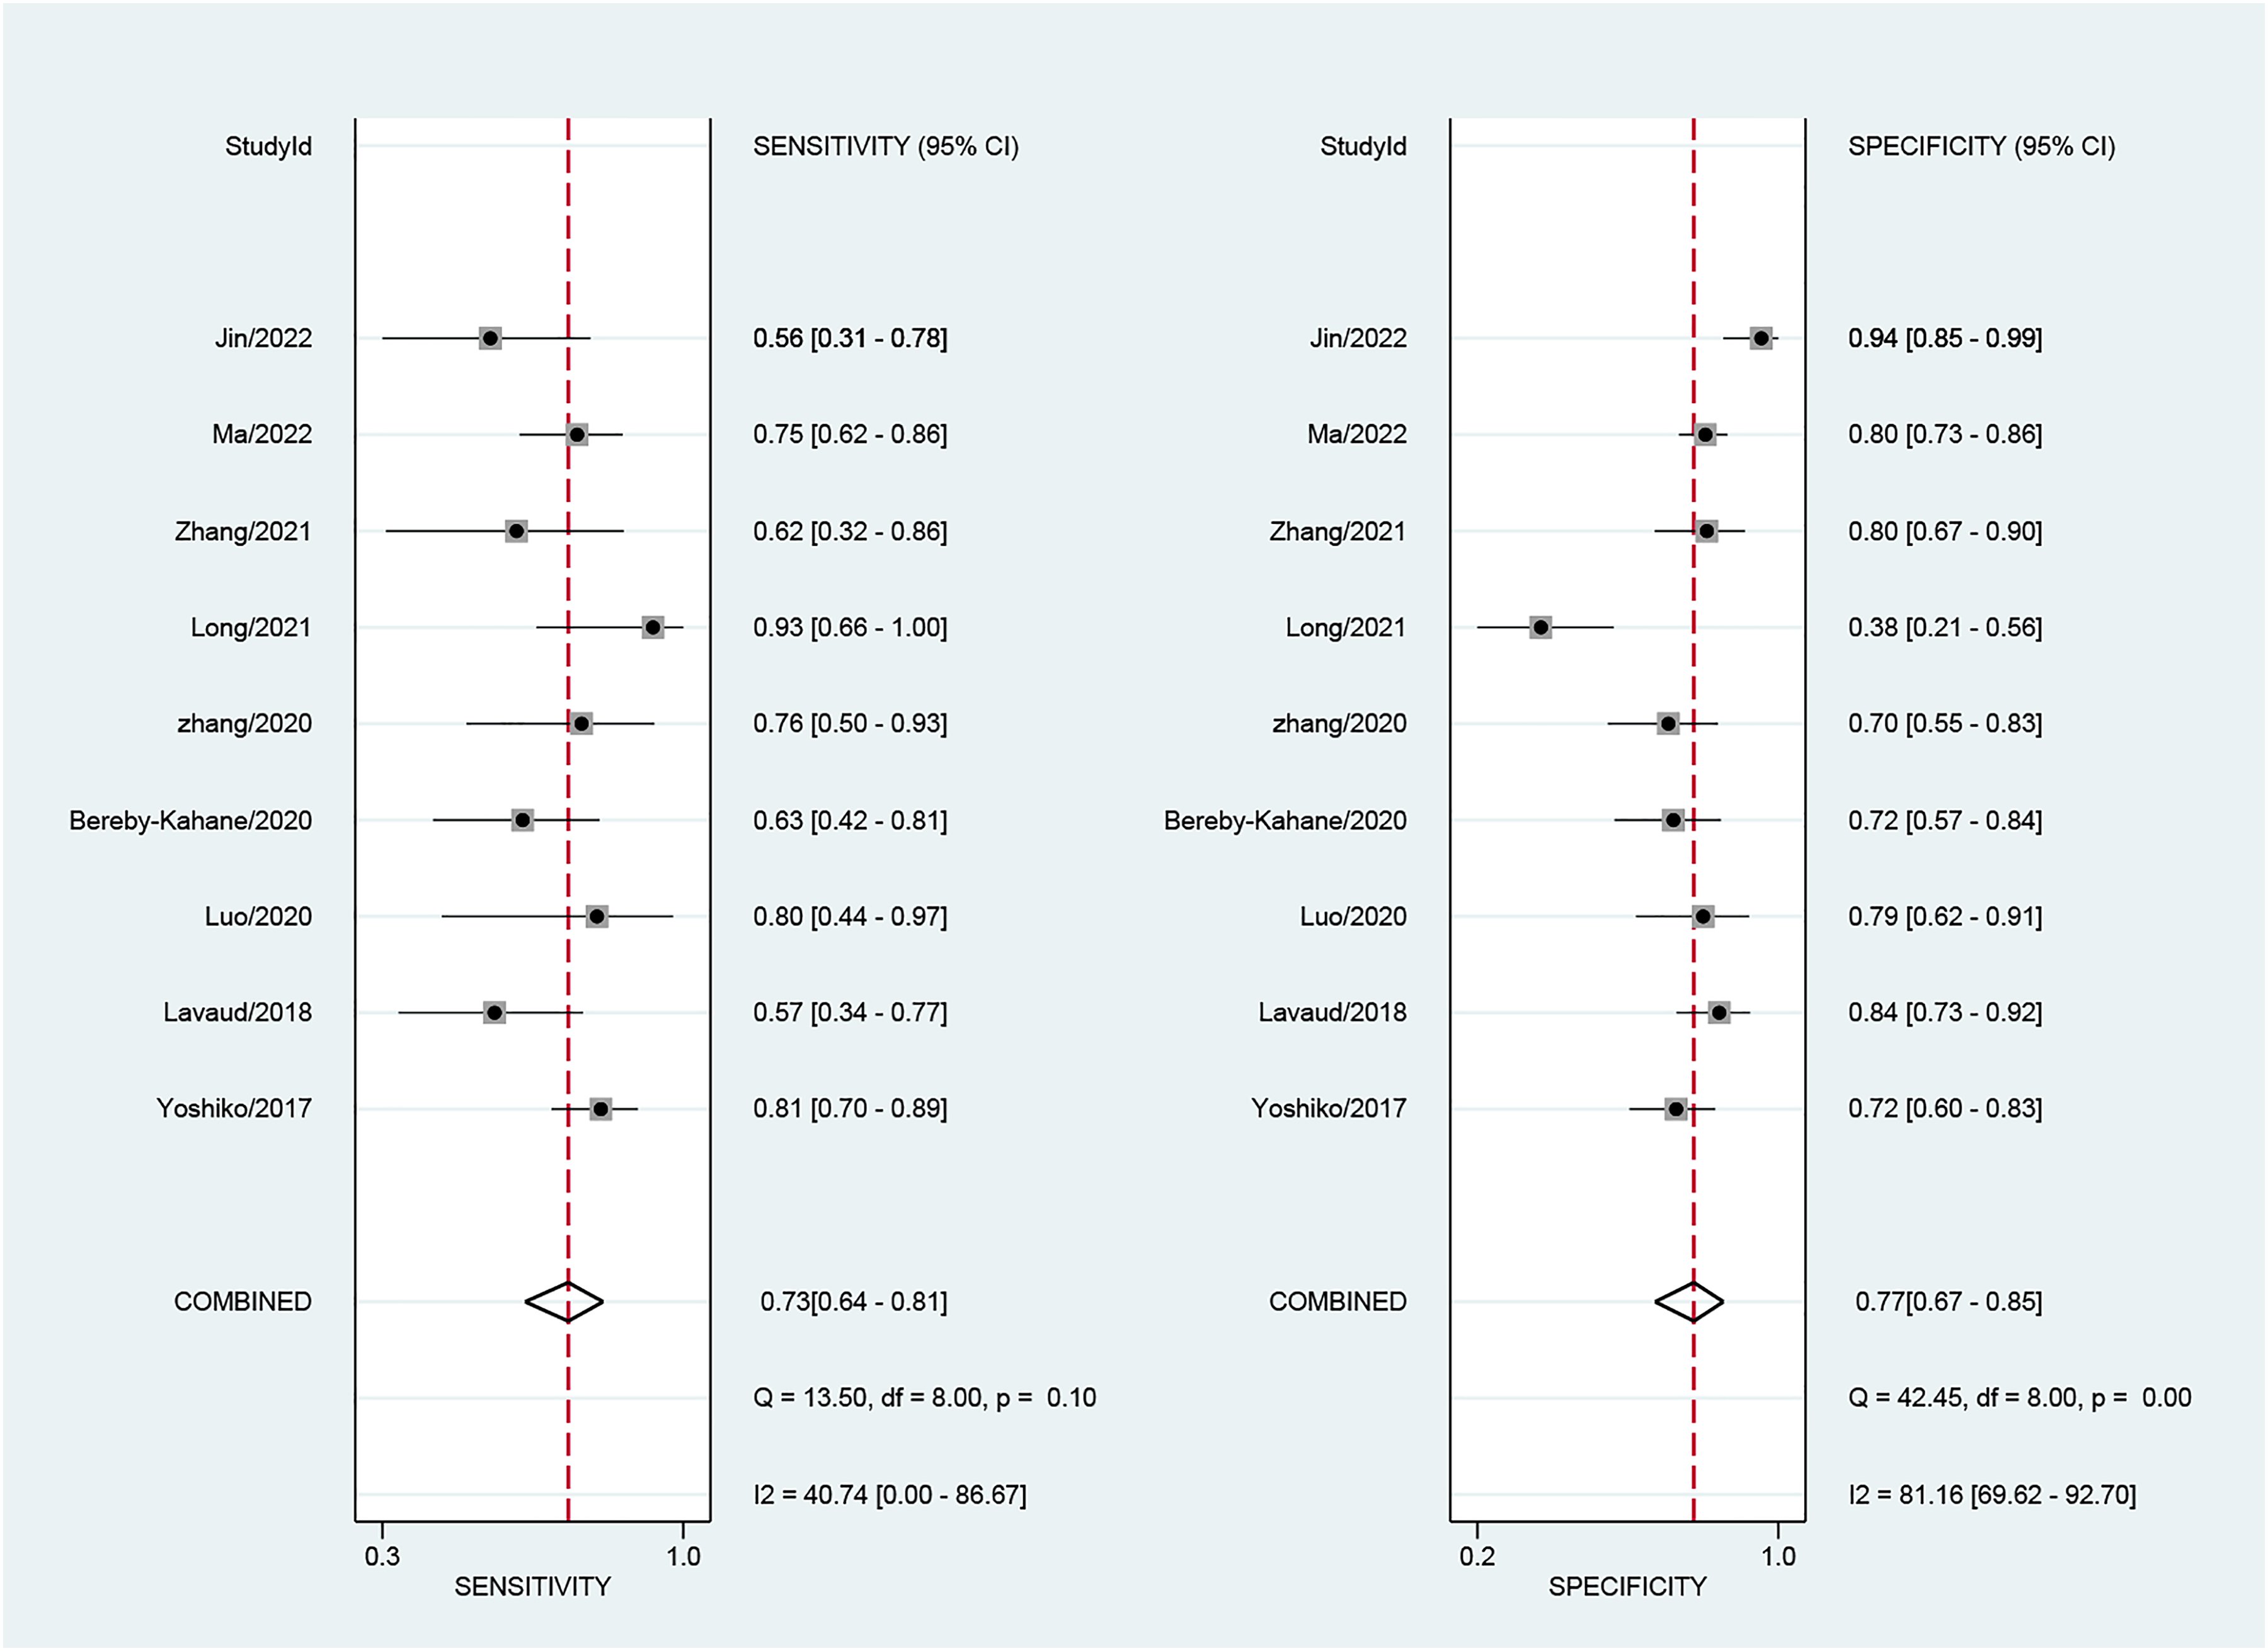
Forest plots of test results. The accuracy estimates (sensitivity and specificity) of MRI for diagnosing LVSI in EC.
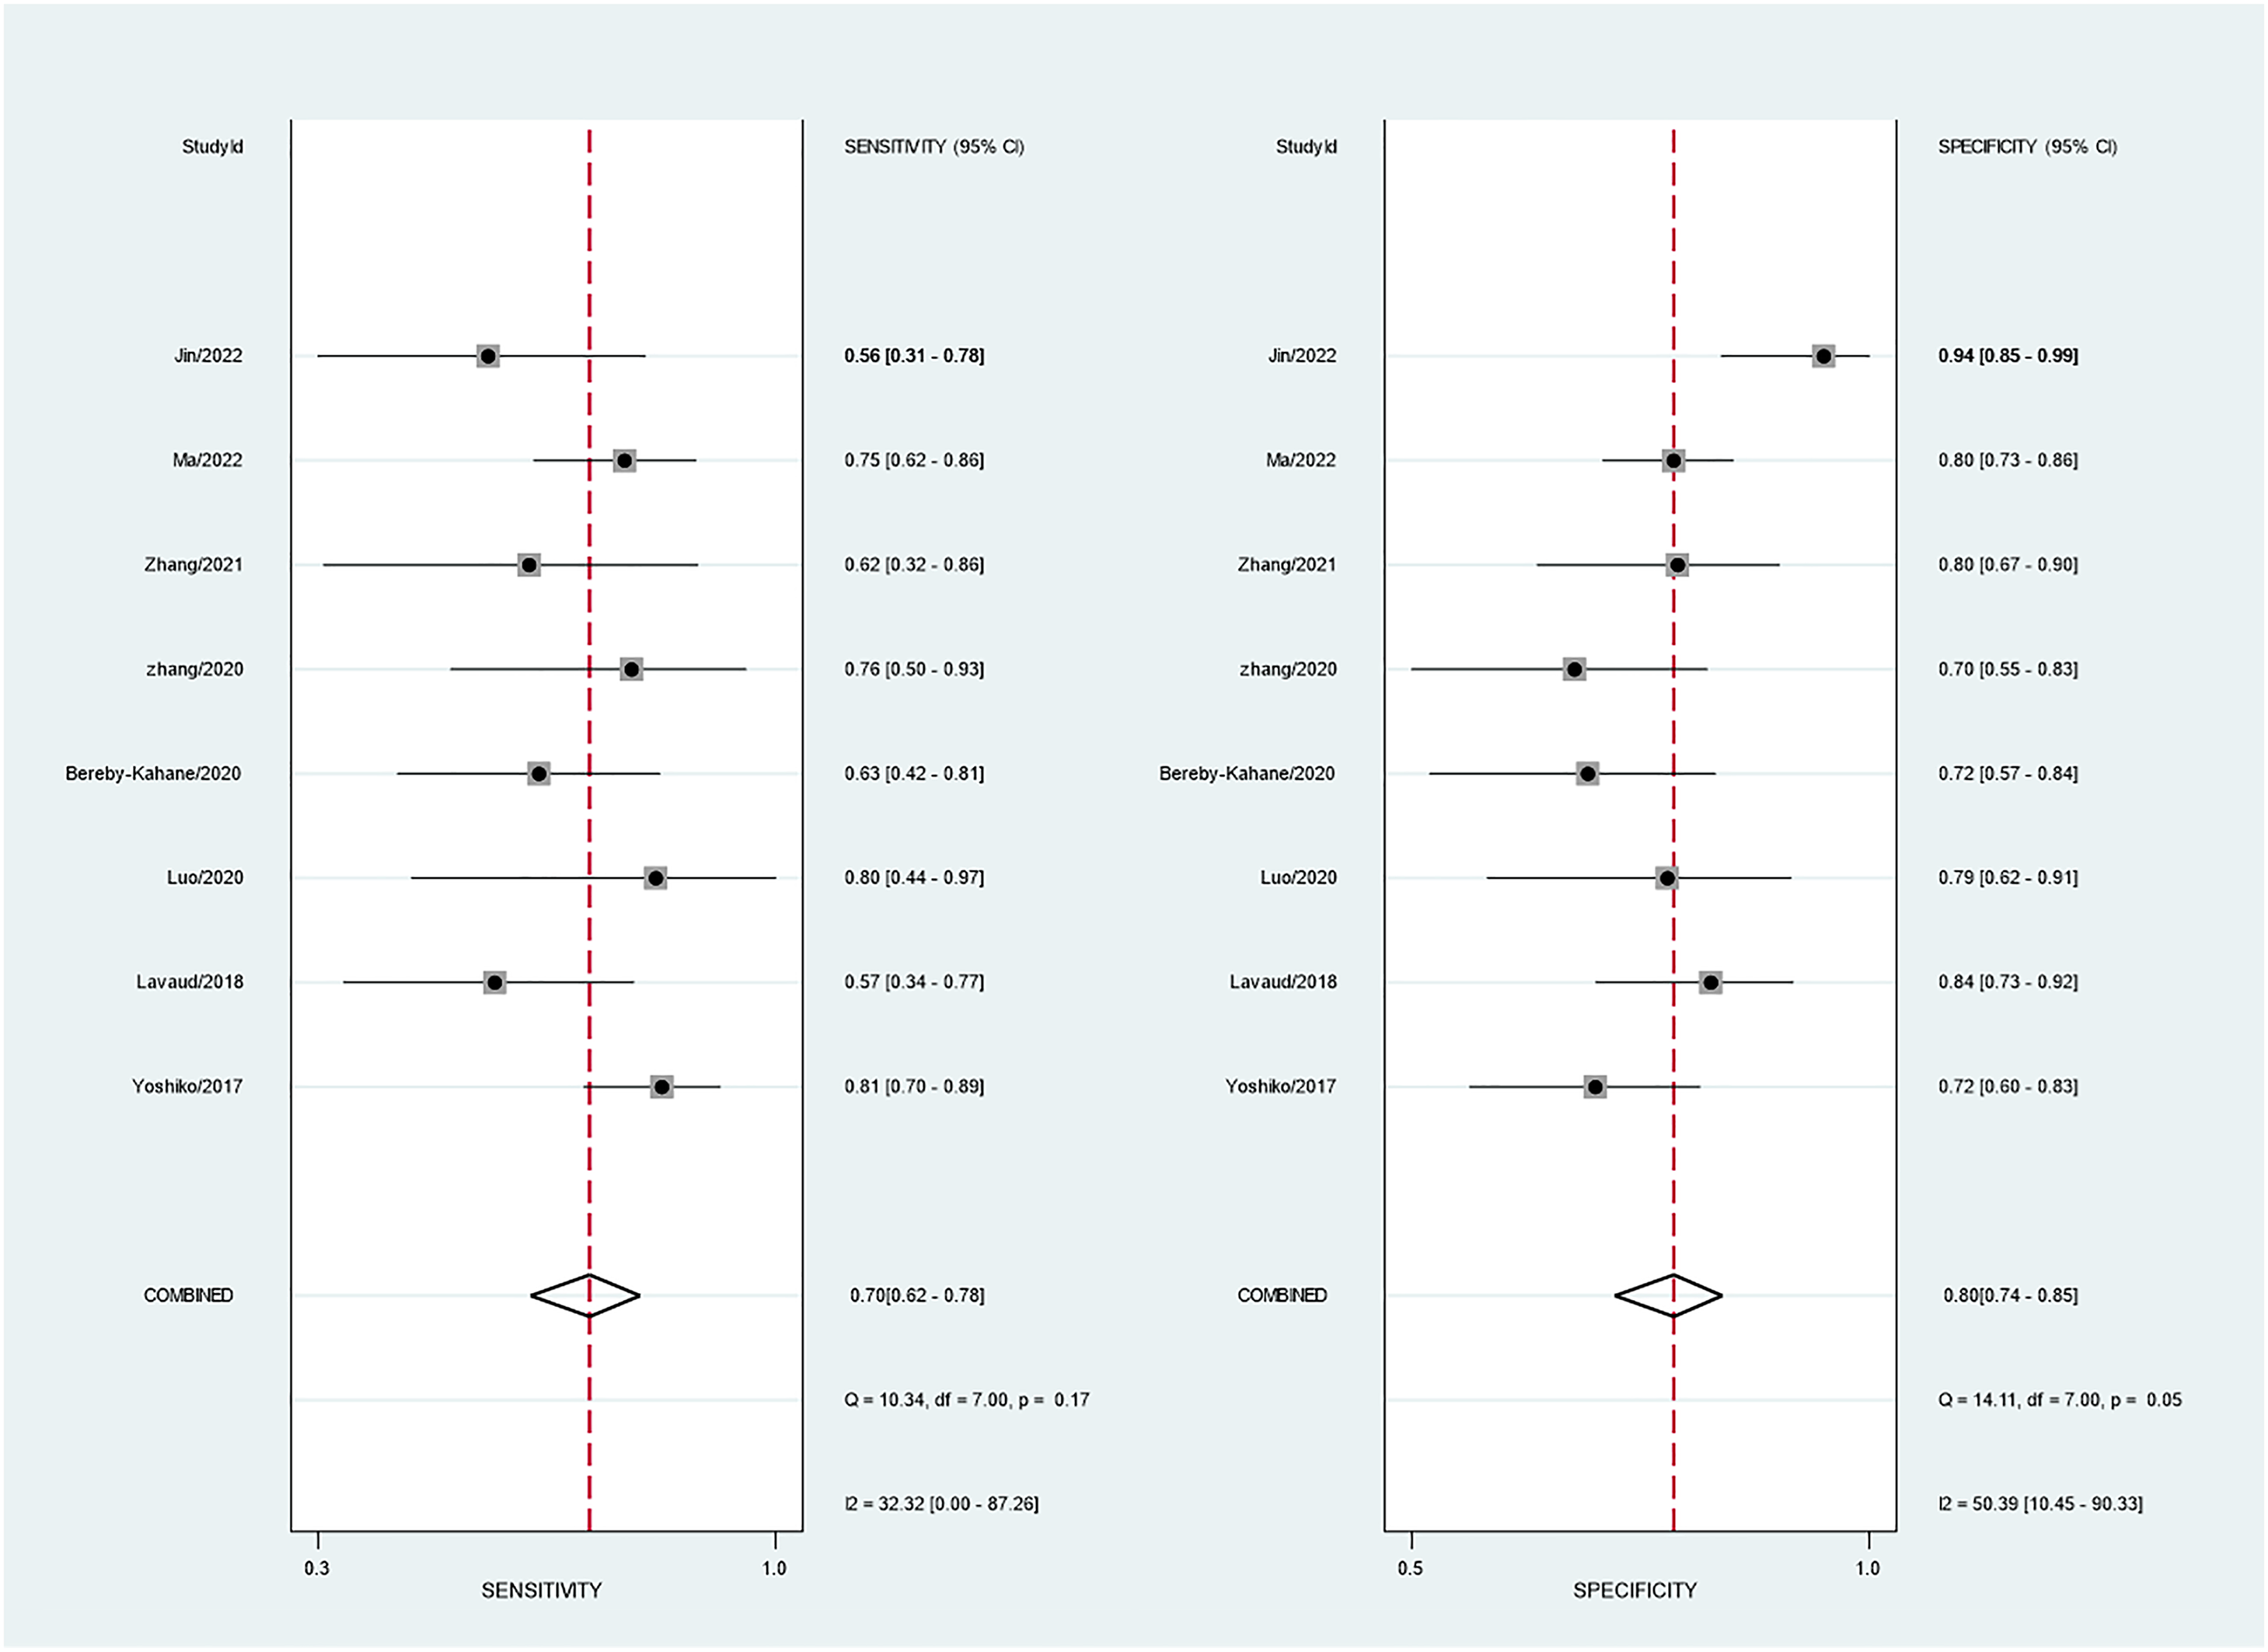
Forest plots after removing study 6 (23). The accuracy estimates (sensitivity and specificity) of MRI for diagnosing LVSI in EC are shown.
Subgroup analysis results of MRI for discriminating an LVSI-positive status in endometrial cancer.
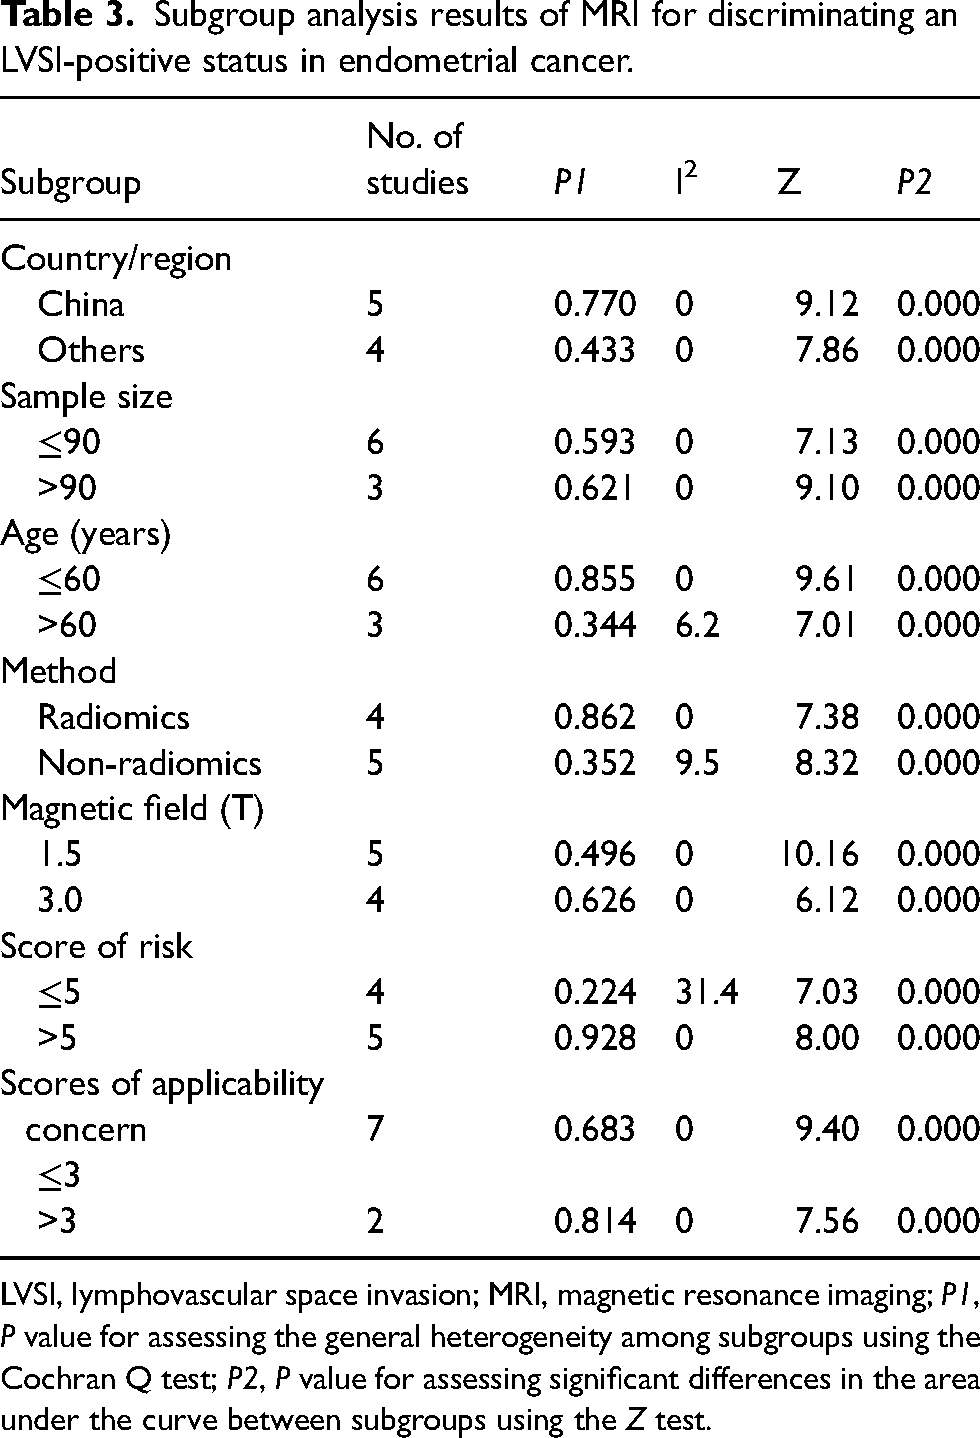
LVSI, lymphovascular space invasion; MRI, magnetic resonance imaging; P1, P value for assessing the general heterogeneity among subgroups using the Cochran Q test; P2, P value for assessing significant differences in the area under the curve between subgroups using the Z test.
Discussion
We reviewed nine studies (814 patients) that investigated the diagnostic ability of MRI when assessing LVSI status in EC. These studies included 247 LVSI-positive and 567 LVSI-negative patients. Our study showed that MRI has good diagnostic ability when assessing LVSI status in EC, with an AUC value of 0.82. The combined sensitivity and specificity were 73% and 77%, respectively Fig. 7.
The original studies included in our meta-analysis could be categorized into radiomics and non-radiomics studies. The non-radiomics studies assessed LVSI via the short axis of the tumor on T2-weighted (T2W) imaging and apparent diffusion coefficient (ADC) parameters (6,17,18). For ADC parameters, the investigators used volumetric ADC histogram analysis to assess LVSI status (18). In this study, the parameter mean ADC had a negative predictive value of 92%, with an AUC value of 0.844, which was better than the results of this meta-analysis. In addition, the inter-observer reproducibility of the ADC histogram was very good (intraclass correlation coefficient = 0.9843, range = 0.9715–0.9914). This indicates that volumetric ADC histogram analysis may be effective in diagnosing LVSI status in early EC. We also noted that positron emission tomography (PET)/computed tomography (CT) has been used to predict LVSI status. Liu et al. (35) examined 41 patients with EC and showed that the AUC for metabolic tumor volume (MTV) and total lesion glycolysis (TLG) to predict LVSI were 0.832 and 0.782, respectively, while the AUC for maximum standard uptake value (SUVmax) to predict LVSI was 0.609. Mostafa et al. (36) showed that SUVmax, MTV, and TLG were all able to discriminate LVSI. For a TLG value >179.374, the sensitivity, specificity, and AUC values were 100%, 66.7%, and 0.889, respectively. MTV and TLG exhibit promising diagnostic capabilities.
We also performed a sensitivity analysis, which showed that the results were more stable after excluding study 6 (23) and study 9 (19). Forest plots after removing study 6 (23) are shown in Fig. 8. We reviewed studies 6 and 9 again and speculated that the main reason that these two studies were outliers could be attributed to their small sample sizes, which may have led to selection bias. The results of this meta-analysis are not sufficiently stable and may reflect the variable results of current LVSI studies. Much more work is needed before MRI can be clinically used to predict LVSI. Future studies with larger sample sizes and methods that are more feasible and easy to apply in clinical settings should be performed.
We noted that although the assessment instruments were based on MRI, there were some subtle differences in the methods used. There was great heterogeneity in this study, so it is necessary to further explore the source of the heterogeneity. In the subgroup analysis, we found that radiomics/non-radiomics features, country/region, sample size, age, MR manufacturer, magnetic field, scores of risk bias, and scores of applicability concern were possible sources of heterogeneity. The heterogeneity due to radiomics/non-radiomics features may be attributable to differences in the analysis methods, even though both approaches were based on MR images. We also found differences in the equipment manufacturer to be a source of heterogeneity. We speculate that there are parameter differences in MRI between manufacturers, leading to inconsistent results in radiomics feature extraction or quantification analysis; however, this does not mean that the results are not credible. The field strength also contributed to the heterogeneity of this study. The 3-T MR scanner has a higher magnetic field than the 1.5-T MR scanner, providing a higher signal-to-noise ratio and higher accuracy.
The present study has some limitations. First, some of the included studies had small sample sizes, which may have affected the diagnostic accuracy. Second, the assessment methods used in these studies were heterogeneous, which may have caused the conclusions to have a certain degree of bias. Third, we restricted the review to original articles published in English because most of the articles searched were in English, and only a few non-English articles met the inclusion criteria.
In conclusion, the results of our meta-analysis suggest that MRI has moderate diagnostic ability for assessing LVSI status in EC. The original studies that used MRI to assess LVSI were highly heterogeneous, and the current results have poor clinical applicability. Large-sample, uniformly designed studies are needed to verify the true value of MRI for assessing LVSI.
Supplemental Material
sj-doc-1-acr-10.1177_02841851231165671 - Supplemental material for Diagnostic accuracy of MRI for assessing lymphovascular space invasion in endometrial carcinoma: a meta-analysis
Supplemental material, sj-doc-1-acr-10.1177_02841851231165671 for Diagnostic accuracy of MRI for assessing lymphovascular space invasion in endometrial carcinoma: a meta-analysis by Xuxu Meng, Dawei Yang, Yuhui Deng, Hui Xu, He Jin and Zhenghan Yang in Acta Radiologica
Footnotes
Acknowledgments
We thank AJE Inc. for the scientific editing of this manuscript.
Declaration of conflicting interests
The author(s) declared no potential conflicts of interest with respect to the research, authorship, and/or publication of this article.
Funding
The author(s) received no financial support for the research, authorship, and/or publication of this article.
Supplemental material
Supplemental material for this article is available online.
References
Supplementary Material
Please find the following supplemental material available below.
For Open Access articles published under a Creative Commons License, all supplemental material carries the same license as the article it is associated with.
For non-Open Access articles published, all supplemental material carries a non-exclusive license, and permission requests for re-use of supplemental material or any part of supplemental material shall be sent directly to the copyright owner as specified in the copyright notice associated with the article.