
Abstract
Background
Multiple sclerosis (MS) and cerebral small vessel disease (CSVD) are relatively common radiological entities that occasionally necessitate differential diagnosis.
Purpose
To investigate the differences in magnetic resonance imaging (MRI) signal intensity (SI) between MS and CSVD related white matter lesions.
Material and Methods
On 1.5-T and 3-T MRI scanners, 50 patients with MS (380 lesions) and 50 patients with CSVD (395 lesions) were retrospectively evaluated. Visual inspection was used to conduct qualitative analysis on diffusion-weighted imaging (DWI)_b1000 to determine relative signal intensity. The thalamus served as the reference for quantitative analysis based on SI ratio (SIR). The statistical analysis utilized univariable and multivariable methods. There were analyses of patient and lesion datasets. On a dataset restricted by age (30–50 years), additional evaluations, including unsupervised fuzzy c-means clustering, were performed.
Results
Using both quantitative and qualitative features, the optimal model achieved a 100% accuracy, sensitivity, and specificity with an area under the curve (AUC) of 1 in patient-wise analysis. With an AUC of 0.984, the best model achieved a 94% accuracy, sensitivity, and specificity when using only quantitative features. The model's accuracy, sensitivity, and specificity were 91.9%, 84.6%, and 95.8%, respectively, when using the age-restricted dataset. Independent predictors were T2_SIR_max (optimal cutoff=2.1) and DWI_b1000_SIR_mean (optimal cutoff=1.1). Clustering also performed well with an accuracy, sensitivity, and specificity of 86.5%, 70.6%, and 100%, respectively, in the age-restricted dataset.
Conclusion
SI characteristics derived from DWI_b1000 and T2-weighted-based MRI demonstrate excellent performance in differentiating white matter lesions caused by MS and CSVD.
Keywords
Introduction
Multiple sclerosis (MS) is a chronic progressive inflammatory disease of the brain that causes long-term disability through demyelination, inflammation, gliosis, and neurodegeneration (1–3). The diagnosis of MS requires the evaluation of radiologic findings, clinical symptoms, and laboratory results. Magnetic resonance imaging (MRI) is the primary imaging modality for diagnosing lesions associated with MS (4). In certain instances, however, MRI's specificity may diminish. Multiple infectious, neoplastic, vascular, toxic, and metabolic disorders can share neuroradiological similarities with MS and imitate the disease (4–8). Radiological diagnosis of MS is based on the revised McDonald criteria of 2017 (9).
Cerebral small vessel disease (CSVD) is a common finding on routine MRI scans of the elderly population. It has been defined as all pathologic changes affecting the brain's small blood vessels including arterioles, venules, and capillaries (10–13). Typical radiological manifestation of CSVD is T2-hyperintense lesions in the deep and periventricular regions of the cerebral white matter. To quantify cerebral white matter hyperintensities (WMHs) associated with CSVD, the Fazekas scale has been described (14–16).
On MRI, both demyelinating MS lesions and CSVD lesions consist of multiple, patchy WMHs. Consequently, they may have comparable MRI findings. MS and CSVD are therefore relatively frequent radiological entities requiring differential diagnosis (17–21). In some instances, the patient's age can be deceiving, despite its usefulness for differentiation. Although most cases of MS are diagnosed in young adults, the disease can also affect older individuals and infants (18). Conversely, CSVD is more prevalent in older patients, but approximately 20% of cases occur in patients aged <50 years (19). Therefore, distinguishing MS from CSVD can be difficult in uncertain cases, despite the fact that laboratory results and clinical findings provide valuable information.
In this study, we hypothesized that the hyperintensity on b1000 diffusion-weighted imaging (DWI_b1000) and signal intensity ratio (SIR) values on T2-weighted (T2W) imaging, DWI_b1000 images, and apparent diffusion coefficient (ADC) map would differ between inactive MS and CSVD lesions in the patient- and lesion-wise analyses. The aim of the present study was to compare the SI of white matter lesions between patients with MS and CSVD.
Material and Methods
Study design
All patients’ medical records were retrospectively analyzed for clinical diagnosis and acceptability to participate in this investigation between January 2020 and March 2022.
Ethics information
For this comparative retrospective study, institutional review board approval was obtained from the medical Ethics Committee of University of Health Sciences (No. 2022.04.123; approval date: 27 April 2022). The requirement of written informed consent was waived by the ethics committee as the study had a retrospective design and all data were anonymized. However, informed written consent for the MRI examination was obtained from each patient.
Participants
In this study, patients with MS and CSVD were included. All patients were clinically inactive and stable.
Inclusion/exclusion criteria
The inclusion criteria for the patients with MS and CSVD were as follows: (i) a definitive clinical diagnosis of MS according to the revised McDonald criteria (9); (ii) for CSVD, patients were selected among those who had WMHs on T2W and fluid-attenuated inversion recovery (FLAIR) images and diagnosed as CSVD by radiologists in consensus according to Fazekas scale (16); and (iii) patients aged 18–70 years.
The exclusion criteria for MS and CSVD were as follows: (i) present or previous history of stroke, malignancy, cranial surgery, radiotherapy, or chemotherapy; (ii) cases of MS with a clinical exacerbation that shows contrast enhancement and surrounding vasogenic edema on postcontrast T1-weighted (T1W) imaging; (iii) posterior fossa lesions; and (iv) lesions <3 mm and lacunes. In addition, lesions other than WMHs were excluded. Cases of MS with active demyelination or cases of CSVD with acute/subacute ischemia were excluded.
MRI protocol and image acquisition
All MRI scans were conducted with a 3.0-T (Ingenia, Philips, Best, The Netherlands) or a 1.5-T MRI scanner (Ingenia, Philips, Best, The Netherlands; Echelon, Hitachi, Tokyo, Japan). All patients’ conventional MRI scans included axial T2W spin echo (SE), 3D-T2 FLAIR, and DWI-ADC maps using echo-planar imaging (EPI) sequences. The MRI sequence parameters are detailed in Supplementary Table 1. Postcontrast T1W SE imaging was obtained for patients with MS to exclude active demyelination.
Image analysis
Two radiologists with at least five years of experience in MS and CSVD lesion analysis reviewed all anonymized MRI data. Radiologists were blinded to all clinical information regarding patients. For the purpose of assessing the reliability of quantitative and qualitative analysis, 50 lesions were independently evaluated at random. On the T2W and FLAIR images, all lesions were identified. The radiologists were instructed to visually identify the hyperintense signal of lesions on DWI_b1000 for each patient and to acquire a region of interest (ROI) measurement on T2W imaging, DWI_b1000, and ADC map as outlined below. In the qualitative analysis by visual inspection (relative brightness of signal intensity of lesions), the radiologists independently determined the presence or absence of hyperintense lesions on DWI_b1000 images pertaining to the adjacent white matter that appeared normal. The qualitative analysis was performed only on DWI_b1000 for both patient-wise and lesion-wise analyses.
In the quantitative analysis, ROI measurements were performed on T2W imaging, DWI_b1000, and ADC_map. Each patient's T2W, DWI_b1000, and ADC maps were co-registered with a rigid registration algorithm using 3D Slicer v4.13.0 (22). Before the ROI analyses, the observers were asked to determine each hyperintense lesion visible on the axial FLAIR and T2W image for a patient. Then, these slices were referred to as anatomical references. The free-hand ROI was placed within the lesion on T2W images. Then, DWI_b1000 images were co-registered to the T2W images using the general registration (BRAINS) module in 3D Slicer v4.13.0 (22). The T2W imaging sequence was the target of registration. Mean signal intensity (SImean) and maximum signal intensity (SImax) values in the ROI in each lesion on DWI_b1000, T2W imaging, and ADC maps were measured, and the mean SI of the ipsilateral normal-appearing thalamus (SIt) was used as a reference. To normalize signal differences, SImean and SIt were rated, and performed the lesion signal intensity ratio (SIR_mean). SIR_mean and SIR_max were calculated using the following formula: SIR_mean = SImean/SIt, SIR_max = SImax/SIt. SIR_mean and SIR_max measured on DWI_b1000, T2W imaging, and ADC maps were evaluated for each lesion. In addition, minimum signal intensity ratio (SIR_min) values for ADC map images were obtained using a similar formula. Measurements of the ipsilateral normal-appearing thalamus were made using standard-sized ROIs (Supplemental Fig. 1). All measurements were made three times by the same radiologist and the averages of results were recorded.
Statistical analysis
The statistical analysis was performed in JASP v0.16.2 in R and MedCalc v20.110. Descriptive statistics are presented as mean, median, standard deviation, and interquartile range. Normality was assessed with the Shapiro–Wilk test. Depending on the group distributions, a parametric or non-parametric test was used to assess the statistical differences of continuous variables between groups. The difference between categorical variables was assessed with the chi-square test or Fisher’s exact test, depending on the count of the cells in the contingency tables. Correlation analysis between continuous variables was assessed with Spearman's Rho. Inter-observer agreement for quantitative and qualitative variables was assessed with intraclass correlation coefficient (ICC) and Cohen's kappa statistics, respectively. First, quantitative and qualitative imaging features were assessed with univariable logistic regression. Then, features achieving statistical significance in univariable analysis were grouped and analyzed in stepwise multivariable logistic regression. Independent predictors were determined with multivariable analysis followed by univariable analysis. Estimates were obtained through 1000 bootstraps. In addition to the combined evaluation, a quantitative-only feature group was also assessed with multivariable analysis. The best model was selected with the Akaike information criterion (AIC). Features with statistical significance in multivariable modeling were also assessed with receiver operating characteristic (ROC) curve analysis to determine clinically useful cutoff values. The optimal cutoff of the test values was determined with a graphical strategy that maximized both sensitivity and specificity. Predictive and diagnostic performance metrics used were area under the ROC curve (AUC), accuracy, sensitivity, specificity, and precision. All the analyses were applied to the lesion-wise (i.e. using values for each lesion) and patient-wise (i.e. using values for all lesions in a patient) datasets. P values <0.05 were considered statistically significant. In multiple comparisons, a Bonferroni correction was applied. Additional analyses were given within a limited age range of 30–50 to highlight the model's real-world clinical value. Further unsupervised fuzzy c-means clustering was also applied to the same age-restricted dataset to reveal inherent cluster patterns possibly related to MS and CSVD. A post hoc power analysis was done for the sub-group analysis for the 30–50 age group, with G*Power v 3.1.9.7.
Results
Participants
In this study, a total of 50 patients with MS who met the criteria were enrolled. An equal number of 50 patients with CSVD were included in the study. The patients with MS had a total of 380 demyelinating lesions while the patients with CSVD had 395 cerebral white matter lesions related to CSVD. In total, 775 WMHs (380 in patients with MS and 395 in patients with CSVD) were evaluated.
Demographic features
There was no significant difference between the MS and CSVD groups regarding sex (P = 0.383). However, a significant difference was observed between the MS and CSVD groups with regard to age. Cases of CSVD were older than those of MS, with a significant difference (P < 0.001). All demographic features of the two groups are presented in Supplemental Table 2.
Inter-observer reproducibility for imaging analysis
In the visual analysis (i.e. relative DWI_b1000 brightness or intensity of lesions), there was a very good inter-observer correlation between the two radiologists using Cohen's kappa statistics (Cohen's κ = 0.874; 95% confidence interval [CI] = 0.736–1.000).
On quantitative analysis, all imaging parameters had excellent inter-observer agreement. The ICC values were in the range of 0.905–0.986. The ICC values for all imaging parameters are detailed in Supplemental Table 3.
Patient-wise analysis
In the patient-wise analysis, there was no normal distribution, and the Mann–Whitney U test was used to detect group differences. T2_SIR_max, T2_SIR_mean, DWI_b1000_SIR_max, and DWI_b1000_SIR_mean values were significantly different between the groups (P < 0.001) (Table 1). These four quantitative parameters and the DWI_b1000_brightness parameter showed statistical significance in univariable logistic regression analysis (P < 0.001). In correlation analysis, T2_SIR_max and DWI_b1000_SIR_mean parameters were selected due to the lowest correlation with each other (Supplemental Fig. 2).
Imaging features of groups and group differences.
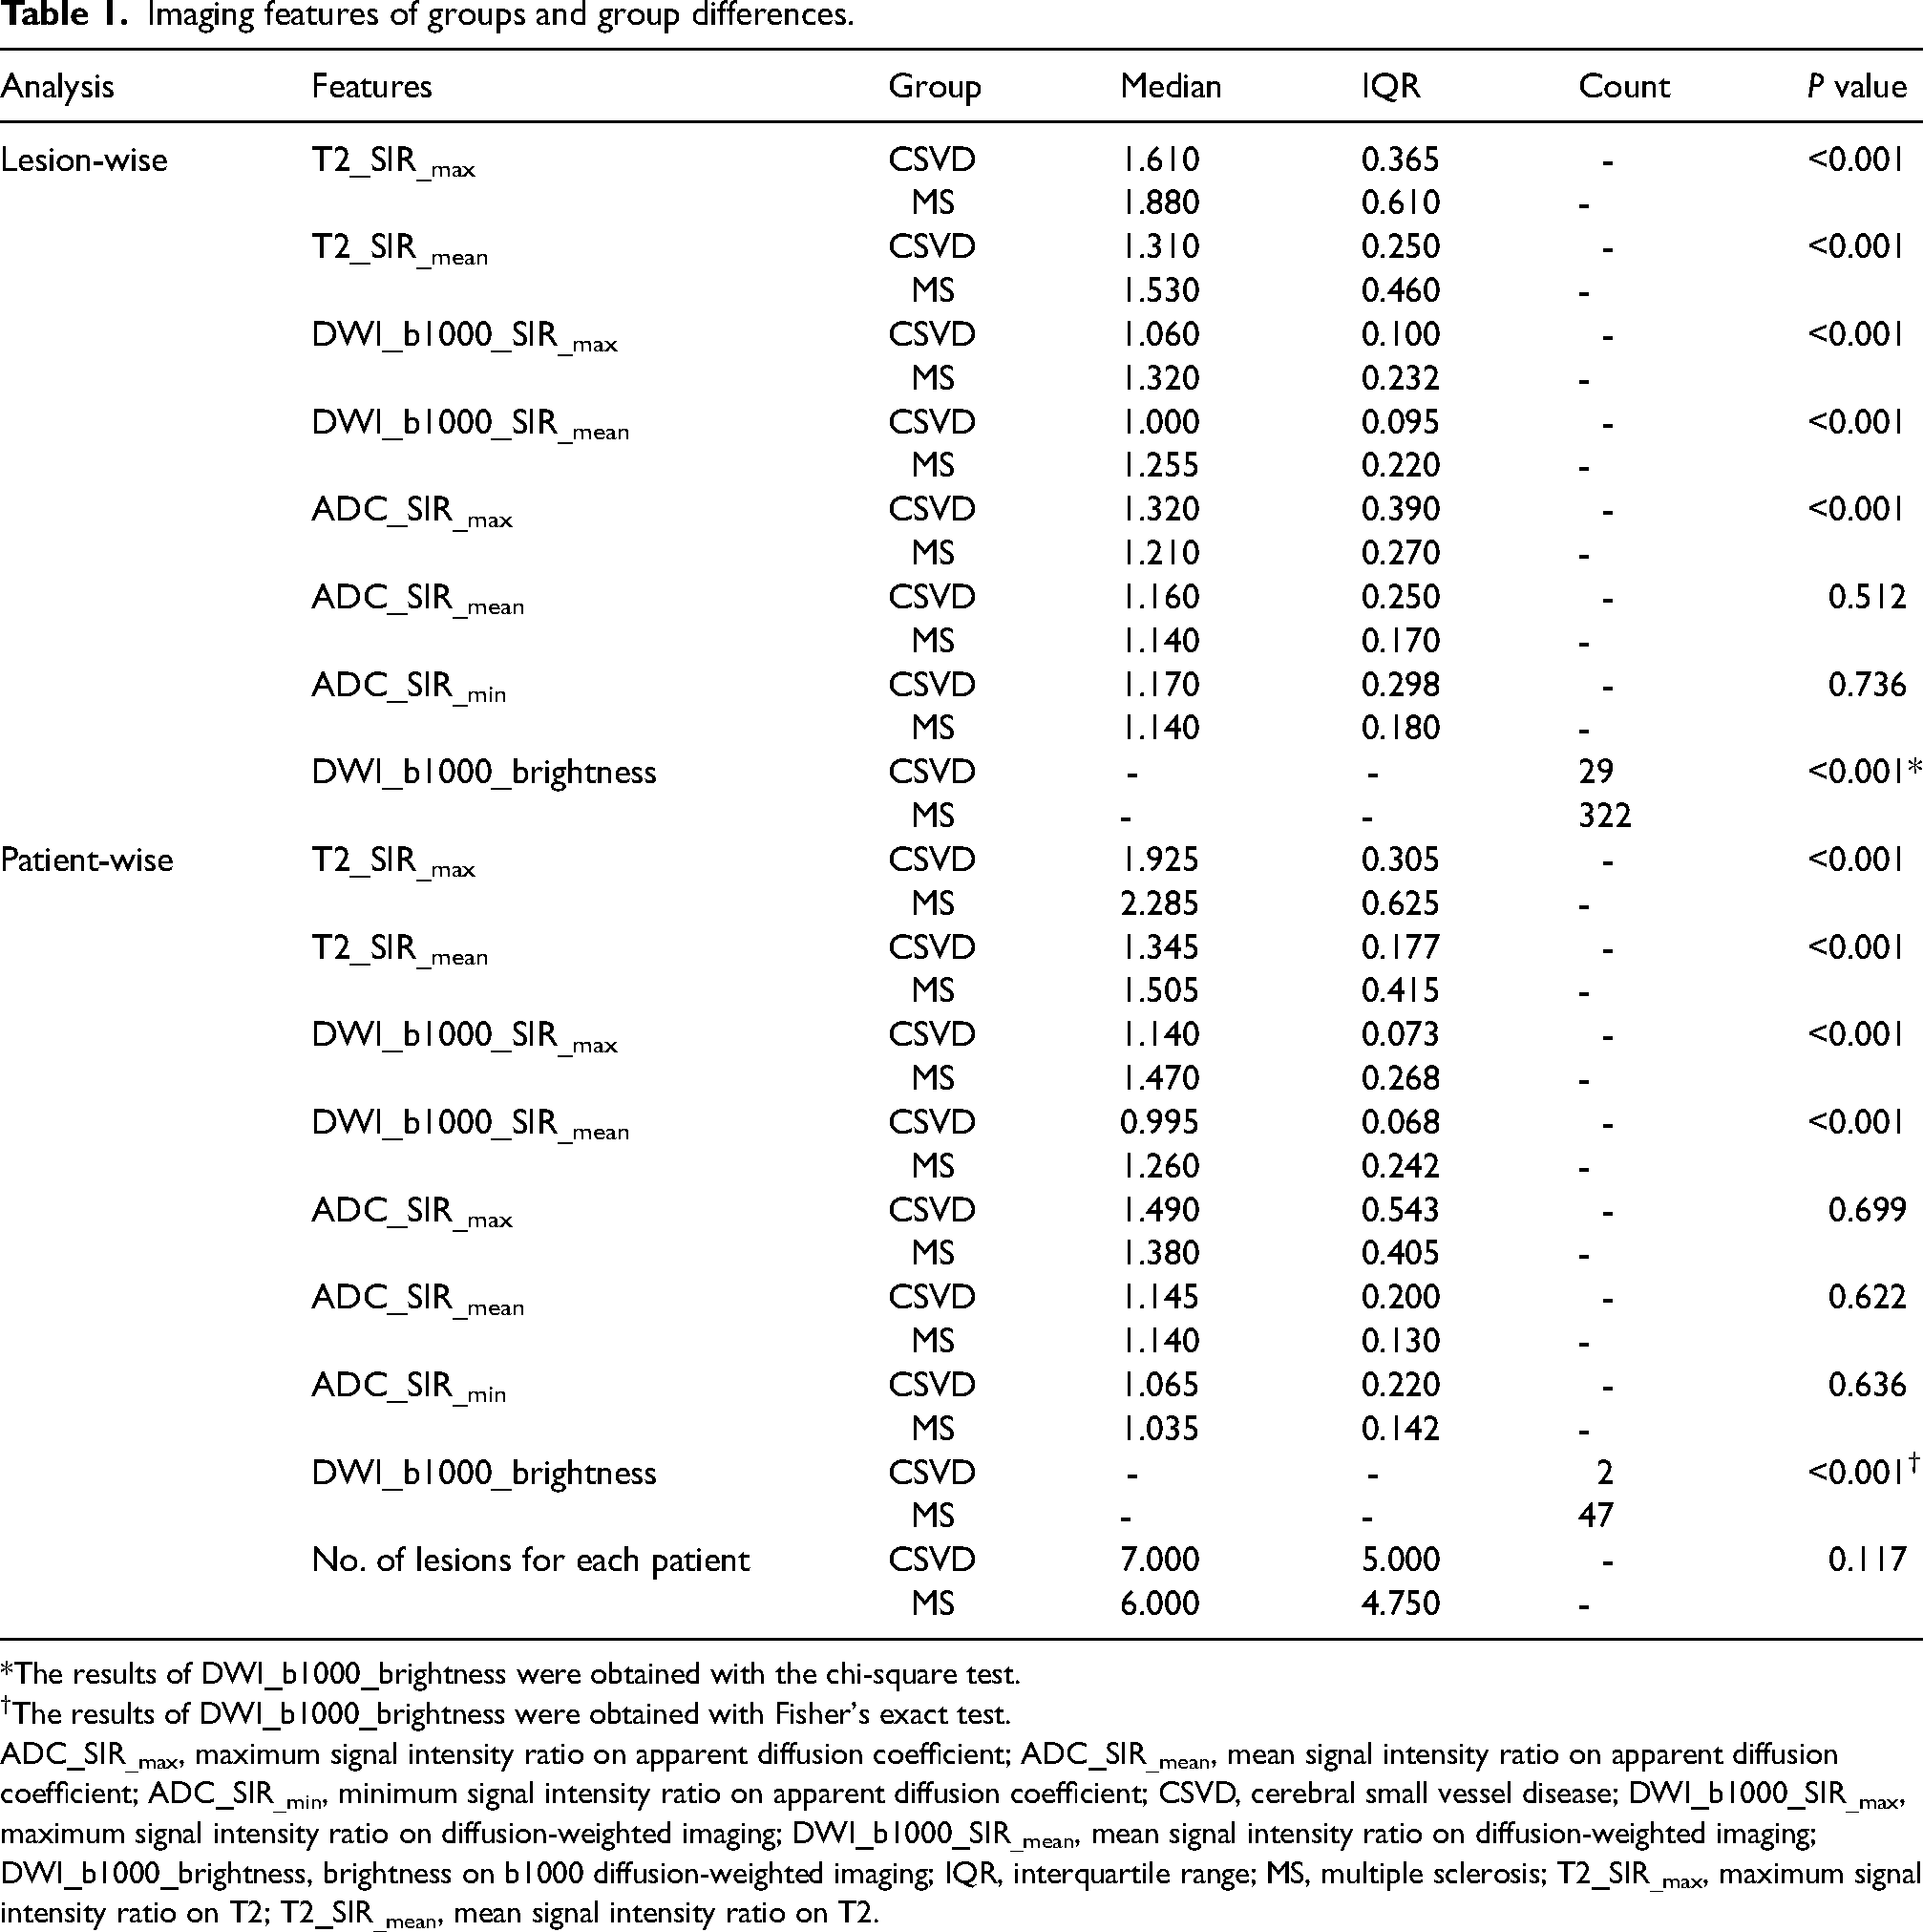
*The results of DWI_b1000_brightness were obtained with the chi-square test.
The results of DWI_b1000_brightness were obtained with Fisher's exact test.
ADC_SIR_max, maximum signal intensity ratio on apparent diffusion coefficient; ADC_SIR_mean, mean signal intensity ratio on apparent diffusion coefficient; ADC_SIR_min, minimum signal intensity ratio on apparent diffusion coefficient; CSVD, cerebral small vessel disease; DWI_b1000_SIR_max, maximum signal intensity ratio on diffusion-weighted imaging; DWI_b1000_SIR_mean, mean signal intensity ratio on diffusion-weighted imaging; DWI_b1000_brightness, brightness on b1000 diffusion-weighted imaging; IQR, interquartile range; MS, multiple sclerosis; T2_SIR_max, maximum signal intensity ratio on T2; T2_SIR_mean, mean signal intensity ratio on T2.
Multivariable logistic regression analysis was performed separately for quantitative and qualitative features and only quantitative features (Table 2 and Supplemental Table 4). The best performing quantitative and qualitative model included T2_SIR_max, DWI_b1000_SIR_mean, and DWI_b1000_brightness (Fig. 1). The diagnostic performance metrics of this modeling are presented in Table 3, and none of the parameters were independent predictors (P > 0.05) in this analysis.
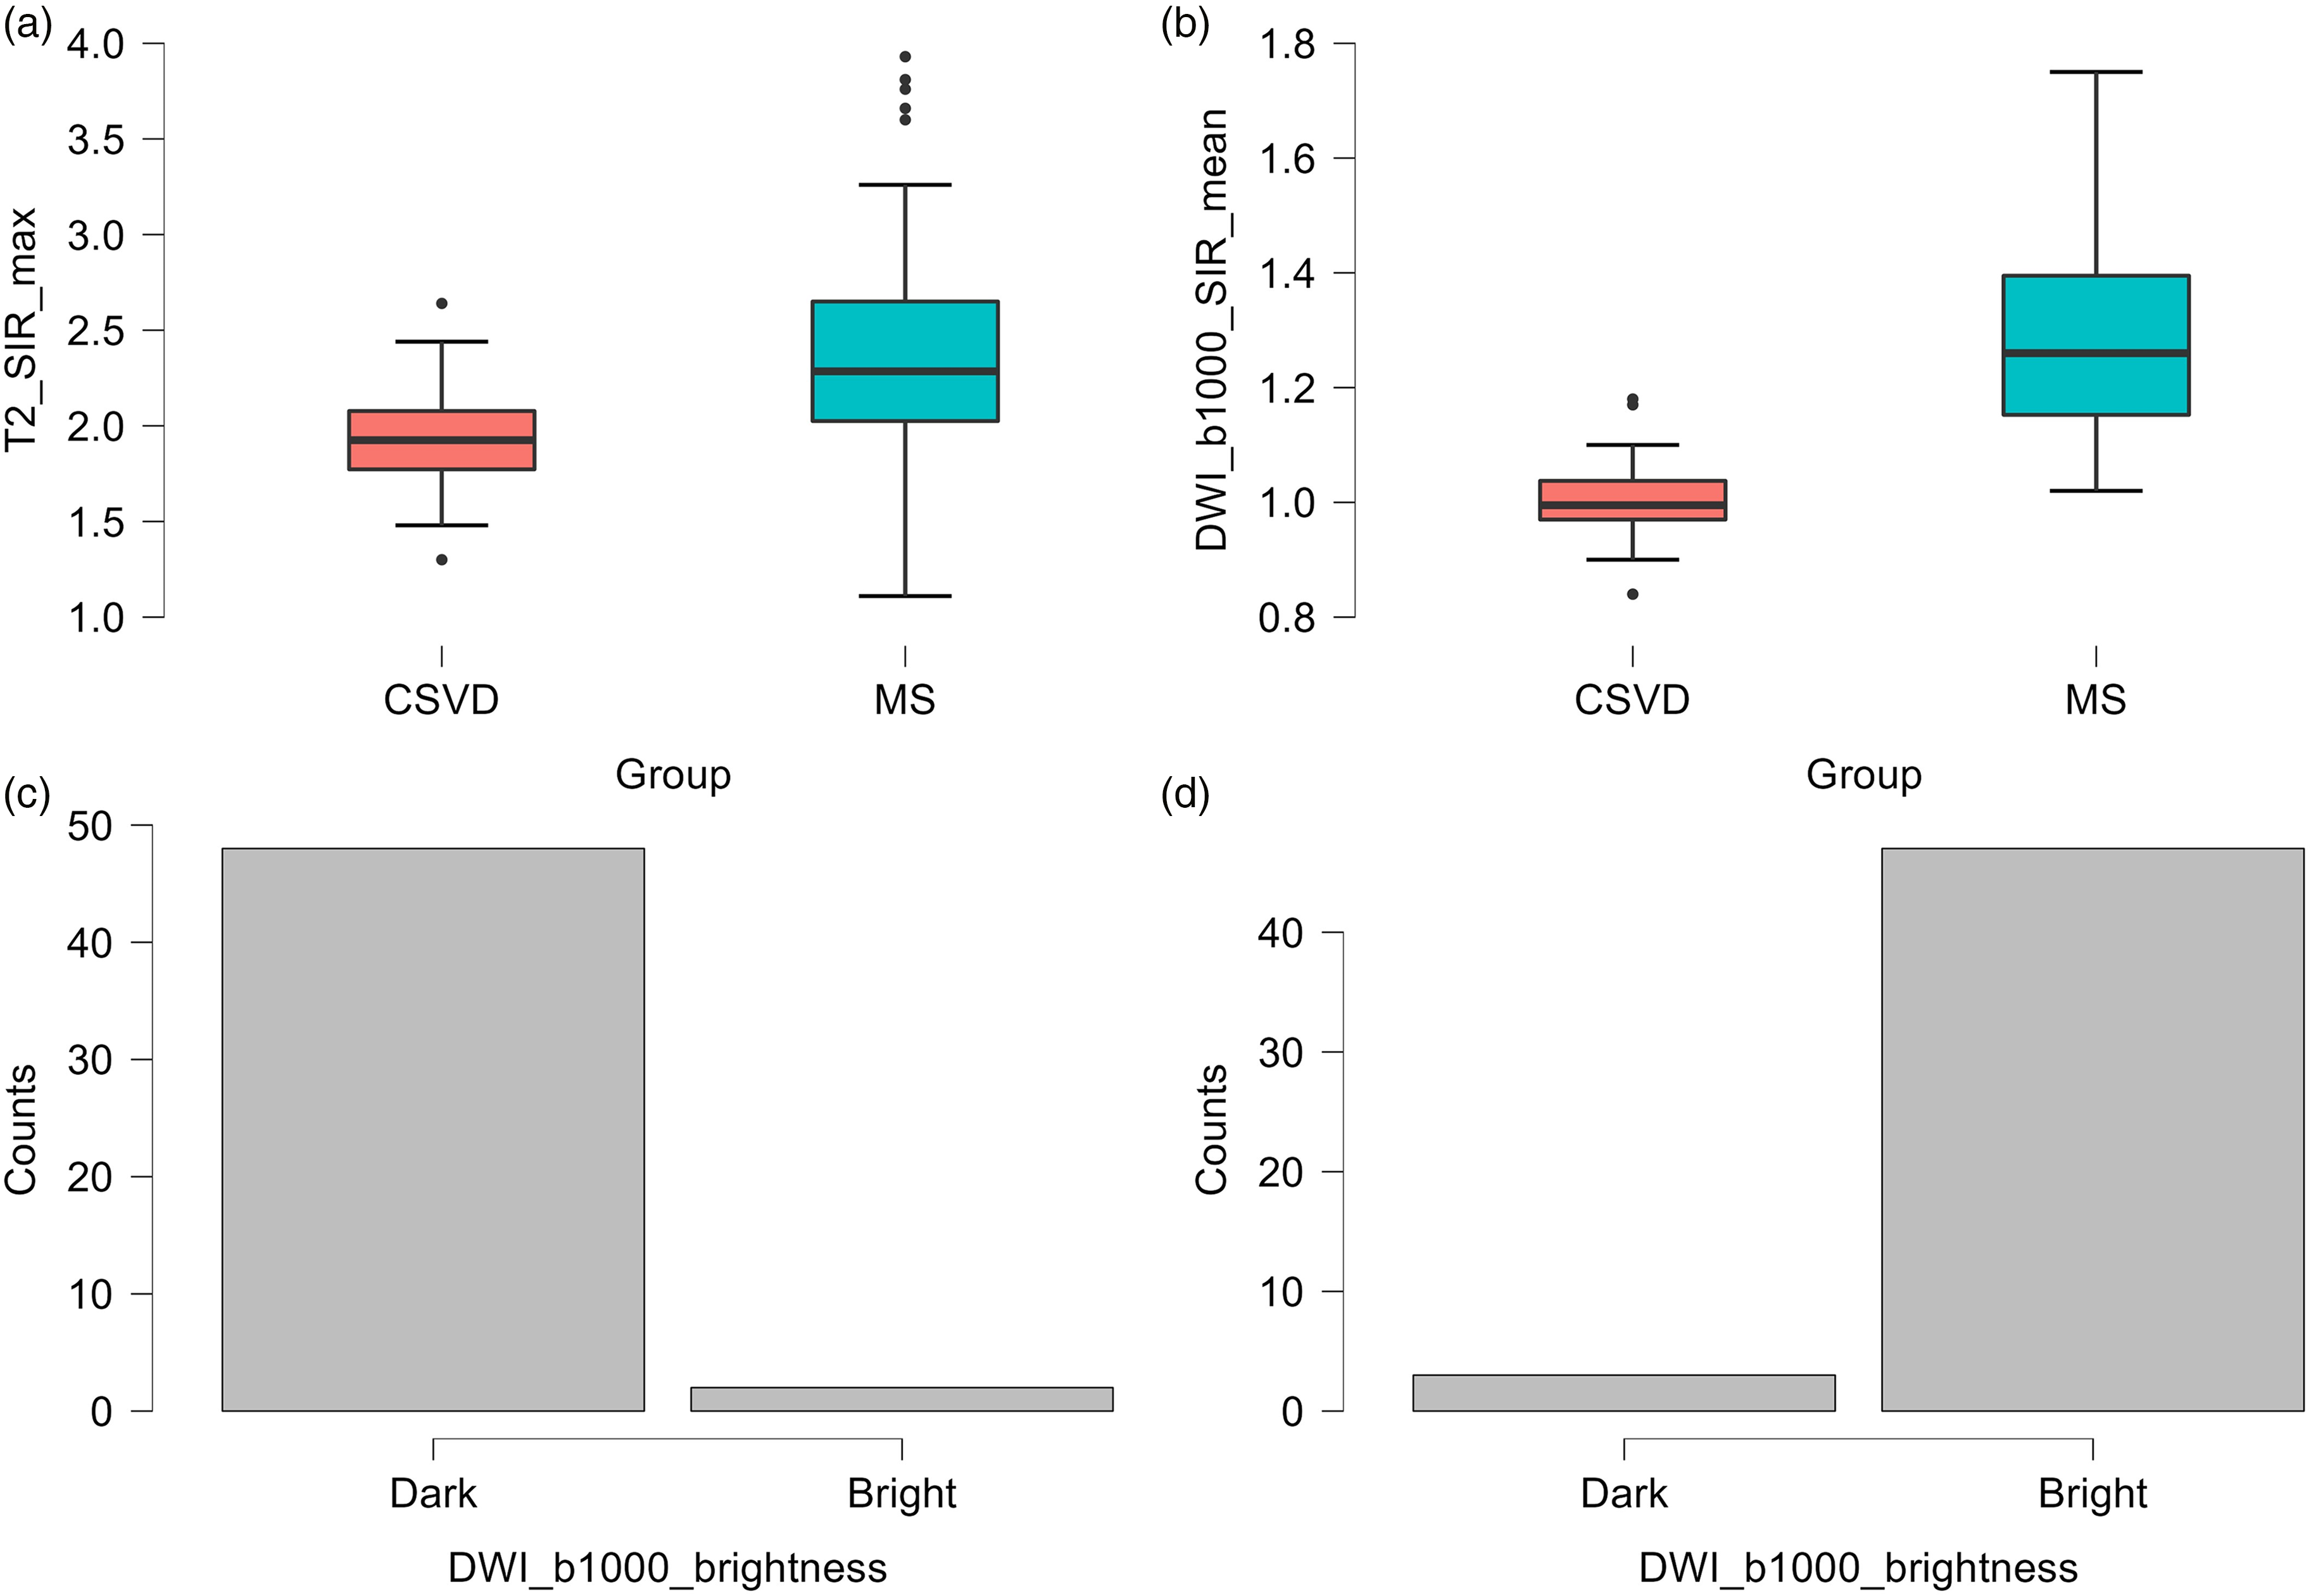
Boxplot (a, b) and (c, d) bar-plot (panel c, cerebral small vessel disease; panel d, multiple sclerosis) of the variables that were used in patient-wise multivariable analysis. CSVD, cerebral small vessel disease; MS, multiple sclerosis.
Lesion-wise and patient-wise multivariable logistic regression analysis results.
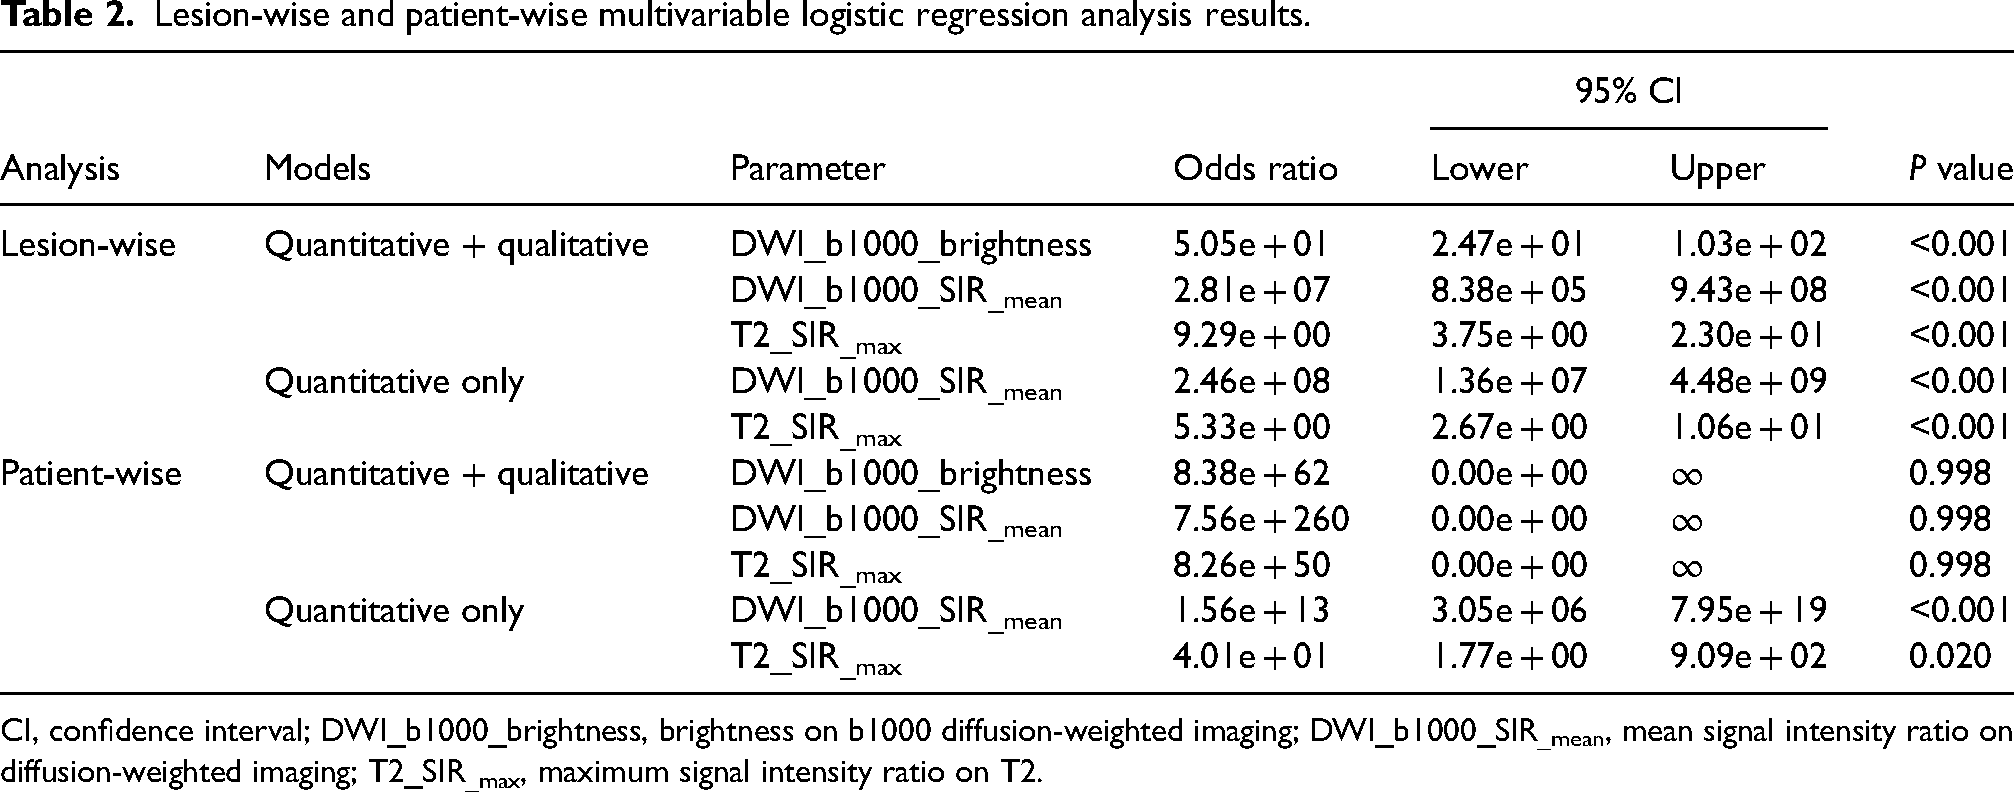
CI, confidence interval; DWI_b1000_brightness, brightness on b1000 diffusion-weighted imaging; DWI_b1000_SIR_mean, mean signal intensity ratio on diffusion-weighted imaging; T2_SIR_max, maximum signal intensity ratio on T2.
Performance metrics for lesion-wise and patient-wise multivariable logistic regression analysis.
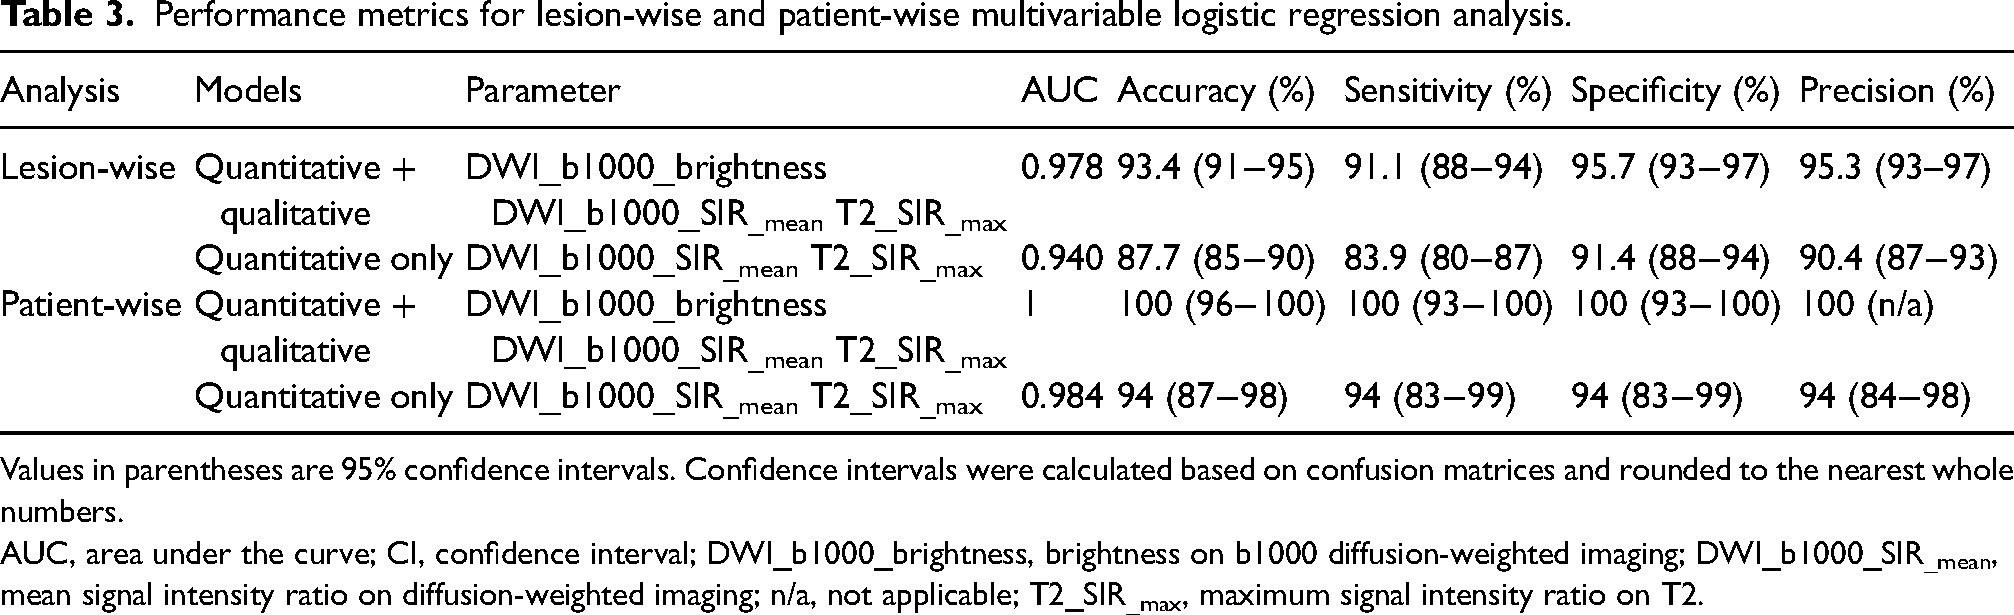
Values in parentheses are 95% confidence intervals. Confidence intervals were calculated based on confusion matrices and rounded to the nearest whole numbers.
AUC, area under the curve; CI, confidence interval; DWI_b1000_brightness, brightness on b1000 diffusion-weighted imaging; DWI_b1000_SIR_mean, mean signal intensity ratio on diffusion-weighted imaging; n/a, not applicable; T2_SIR_max, maximum signal intensity ratio on T2.
In the quantitative-only multivariable logistic regression analysis, the best model included T2_SIR_max and DWI_b1000_SIR_mean. The diagnostic performance metrics of this modeling are presented in Table 3, and both T2_SIR_max and DWI_b1000_SIR_mean parameters were found to be independent predictors (P = 0.020 and P < 0.001 respectively). ROC curves, cutoff selection, and performance metrics are shown in Fig. 2. The best cutoff values were found as 1.1 for DWI_b1000_SIR_mean and 2.1 for T2_SIR_max. Diagnostic performance metrics with the best cutoff values are presented in Supplemental Table 5.

Independent predictors for patient-wise analysis. (a–c) DWI_b1000_SIR_mean; (d–f) T2_SIR_max. DWI_b1000_SIR_mean, mean signal intensity ratio on diffusion-weighted imaging; T2_SIR_max, maximum signal intensity ratio on T2.
An additional analysis was carried out for patients aged 30–50 years to assess more realistic clinical implications of the results in distinguishing between 25 patients with MS and 12 patients with CVSD. The analysis was only performed using a patient-wise dataset. For the patient-wise multivariable logistic regression, the accuracy, sensitivity, and specificity were 91.9% (95% CI = 78.09–98.30), 84.62% (95% CI = 54.55–98.08), and 95.83% (95% CI = 78.88–99.89), respectively. Diagnostic performance metrics for DWI_b1000_SIR_mean with a cutoff of 1.1 and T2_SIR_max with a cutoff of 2.1 are detailed in Supplemental Table 6. Using both independent features, a fuzzy c-means unsupervised clustering revealed two significant clusters (Supplemental Fig. 3). When using these clusters to predict MS and CSVD groups, it achieved an accuracy, specificity, and specificity of 86.49%, 70.59%, and 100.00%, respectively (Supplemental Table 6). Differences between the T2_SIR_max (mean = 1.895 ± 0.197 for CSVD; 2.490 ± 0.715 for MS) and DWI_b1000_SIR_mean (mean = 1.008 ± 0.078 for CSVD; 1.264 ± 0.150 for MS) between MS and CSVD groups were assessed with the Student’s t-test because of the normal distribution as assessed with Shapiro–Wilk test. There were statistically significant differences for both independent predictors, with P < 0.05 for both. For T2_SIR_max, the post hoc power was 0.881 with an effect size d of 1.13. For DWI_b1000_SIR_mean, the post hoc power was 0.999 with an effect size d of 2.14.
Lesion-wise analysis
In the lesion-wise analysis, there was no normal distribution, and the Mann–Whitney U test was used. T2_SIR_max, T2_SIR_mean, DWI_b1000_SIR_max, DWI_b1000_SIR_mean, and ADC_SIR_max values were significantly different between the groups (P < 0.001) (Table 1). Univariable logistic regression analysis showed a significant difference for the five quantitative parameters and the DWI_b1000_brightness parameter (P < 0.001). In the correlation analysis, T2_SIR_max and DWI_b1000_SIR_mean parameters that had the lowest correlation with each other were selected. The distribution of these features and correlation matrix are presented in Supplemental Fig. 4 and Supplemental Fig. 2, respectively.
In the multivariable logistic regression analysis of the quantitative and qualitative evaluation, the best model included T2_SIR_max, DWI_b1000_SIR_mean, and DWI_b1000_brightness (Table 2 and Supplemental Table 4). The diagnostic performance metrics of this modeling are presented in Table 3. Consequently, in the quantitative and qualitative modeling analysis, all the parameters were independent predictors (P < 0.001).
In the quantitative-only multivariable logistic regression analysis, the best model included T2_SIR_max, and DWI_b1000_SIR_mean (Table 2 and Supplemental Table 4). The diagnostic performance metrics of this modeling are presented in Table 3. As a result, both T2_SIR_max and DWI_b1000_SIR_mean parameters were found to be independent predictors (P < 0.001). In the ROC analysis, the best cutoff values were found as 1.1 for DWI_b1000_SIR_mean and 1.7 for T2_SIR_max (Supplemental Fig. 5) and diagnostic performance metrics with the best cutoff values are presented in Supplemental Table 5. Example images of patients with MS and CSVD are shown in Fig. 3.
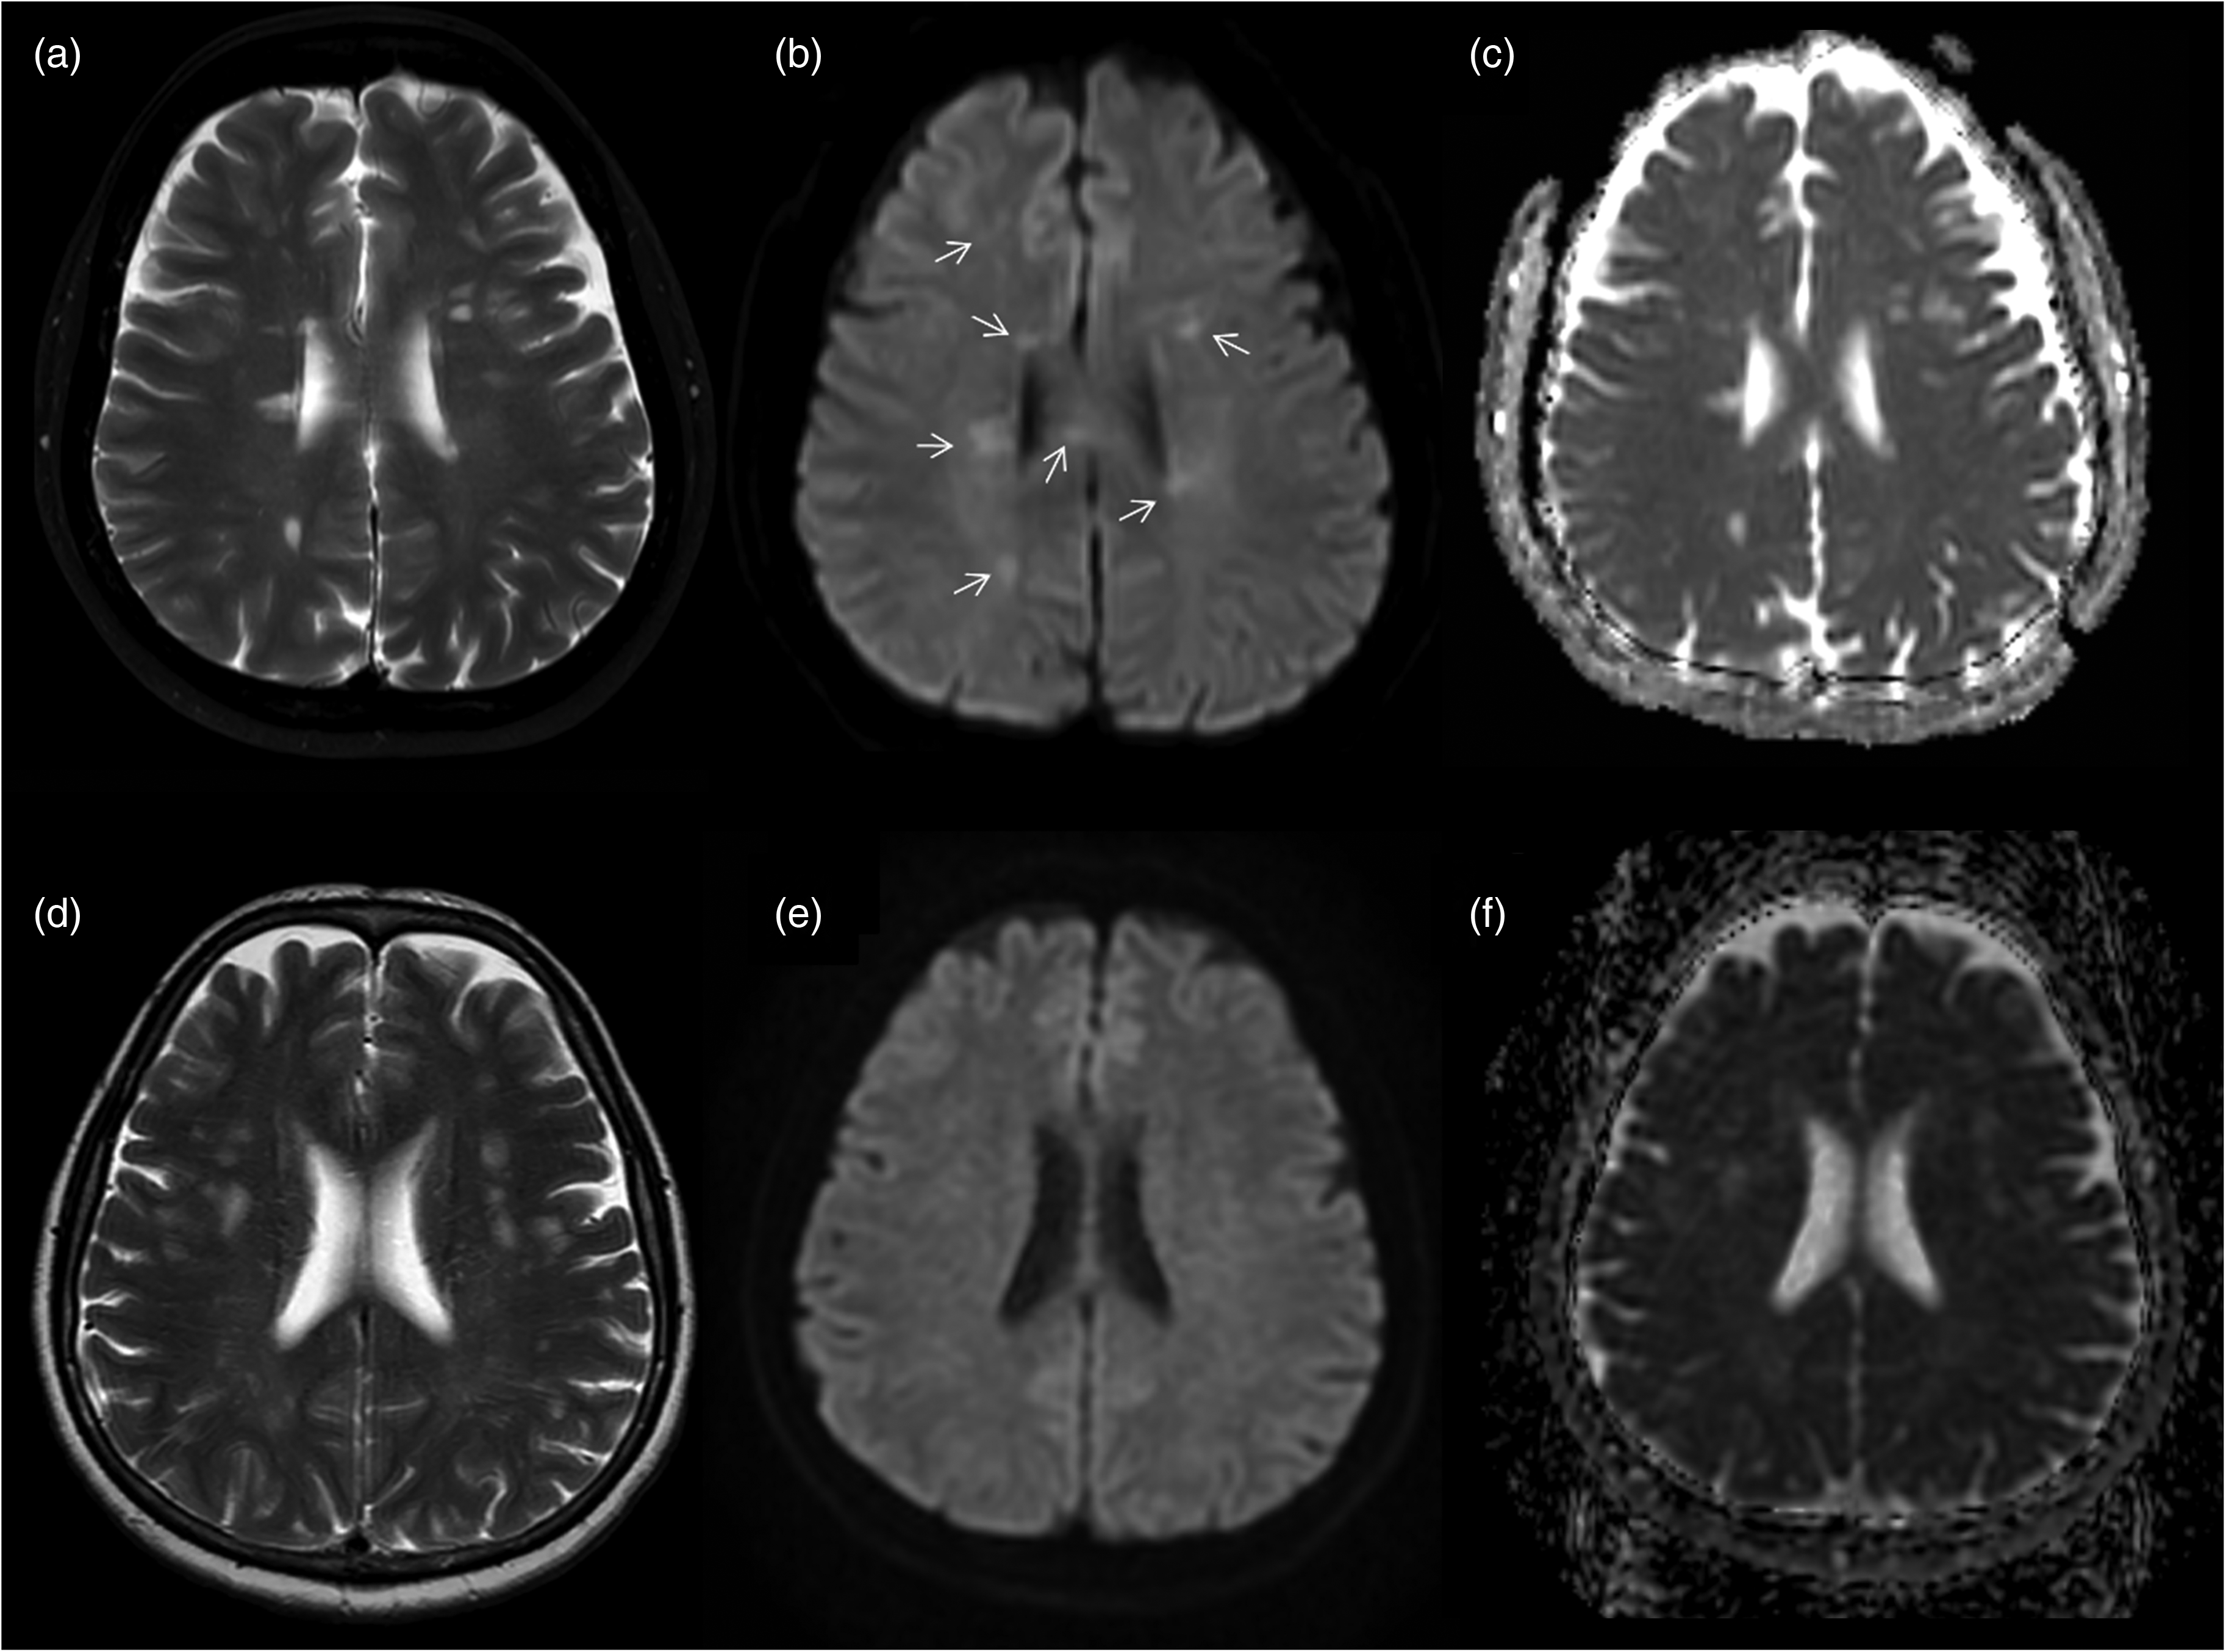
(a–c) A 41-year-old female patient with MS. (a) Axial T2W sequence shows multiple focal WMH (inactive demyelinating lesions) in both cerebral hemispheres, with periventricular predominance. (b, c) b1000 DWI sequence demonstrates hyperintensity in most of the lesions (arrows) with high signal on ADC map. (d–f) A 58-year-old female patient with cerebral small vessel disease. (d) Axial T2W sequence demonstrates multiple focal WMH related to the CSVD in both cerebral hemispheres. (e) On b1000 DWI sequence, none of the lesions are visible. (f) On ADC map, lesions show high signal due to increased diffusion. ADC, apparent diffusion coefficient; CSVD, cerebral small vessel disease; DWI, diffusion-weighted image; MS, multiple sclerosis; T2W, T2-weighted; WMH, white matter hyperintensities.
MRI sub-group analysis
For the patient-wise analysis, 67 patients (25 with MS and 42 with CSVD) were scanned in a 1.5-T scanner; 33 patients (25 with MS and 8 with CSVD) were scanned in the 3.0-T MRI unit. For the lesion-wise analysis, 499 lesions (182 MS and 317 CSVD) were scanned in a 1.5-T scanner; 276 (198 MS and 78 CSVD) were in the 3-T MRI unit.
For both the patient-wise and lesion-wise analyses, the distribution of quantitative SIR parameters that were selected as independent predictors were evaluated based on the magnetic field strength (1.5 T vs. 3 T). Statistically significant differences were observed in the distribution of T2_SIR_max and DWI_b1000_SIR_mean (P < 0.05) (Supplemental Table 7). Using the best cutoff values obtained in the combined analysis, the diagnostic performance of these independent predictors was studied as a sub-group analysis. Diagnostic performance metrics showed comparable results and are presented in Supplemental Table 8.
Discussion
In this study, we investigated DWI_b1000, T2W imaging, and ADC_map differences in white matter lesions among patients with MS and CSVD. We performed a patient-wise and lesion-wise analysis in all participants as well as a patient-wise analysis in patients aged 30–50 years. We found that nearly all multivariable models yielded an accuracy >85% and an AUC value of 0.900. We have also identified independent predictors that can solely be used for distinguishing MS and CSVD. In the patient-wise analysis, DWI_b1000_SIR_mean yielded an accuracy >90% with a cutoff value of 1.1. Similar performance metrics were also achieved in the patient-wise analysis restricted to the patients’ age range of 30–50 years. Unsupervised clustering also showed clusters that resemble MS and CSVD with satisfying prediction performance.
In a study, Oztoprak et al. (23) evaluated 50 patients with CSVD and 35 patients with MS. Their study aimed to identify the microstructural changes in the thalamus using ADC values and to determine the difference between MS and CSVD. The mean ADC value of the thalamus was significantly higher in patients with CSVD compared to the controls (P < 0.001). However, there was no significant difference between MS and the control group. According to this study, ADC values of the thalami may help to differentiate MS and CSVD. In their study, qualitative and quantitative features on T2W imaging and DWI_b1000 sequences have not been studied, which is the main difference and advantage of our study. In addition, our study was conducted using patient and lesion datasets with a larger MS population. Contrary to their study, we did not use the real ADC values that require calculations by MRI console unit workstations. We suggest a new practical approach using only SIR and visual analysis on conventional MRI sequences. In another study, Hakky et al. (14) investigated 103 outpatient brain MRI scans visually on FLAIR and with a ROI on T2W imaging. Their study showed that medial lemniscus T2 hyperintensity in dorsal pons has been reported more frequently in patients with CSVD than in those with MS.
Differentiating demyelinating MS lesions from CSVD lesions on MRI examination can be challenging, notably in patients with atypical clinical presentations (22). SI evaluation on T2W imaging, DWI_b1000, and visual analysis on DWI_b1000 have not been defined before in the literature. We believe that T2W imaging and DWI_b1000, which are conventional MR sequences, can overcome this problem without the need for contrast material. The co-existence of these two sequences instead of ADC could be explained as a result of the T2 shine-through effects on b1000 DWI. We think that being able to differentiate MS and CSVD with a visual analysis of DWI_b1000 is an important issue in diagnostic radiology. We would like to emphasize that these results were obtained by analysis of only inactive MS and chronic CSVD lesions. Distinguishing MS and CSVD in inactive phases may have a clinical significance, especially in cases with nonspecific clinical findings and incidental radiological findings.
The present study has some limitations. These can be listed as the significant difference in terms of patient age between the groups, the retrospective design of the study, the exclusion of posterior fossa lesions, and lesions <3 mm. Although it is practically important, the number of patients in the age-restricted analysis is limited in comparison with the patient-wise analysis. We plan to explore this part of the analysis using a much larger dataset in the future. Although we combined different MRI units in the modeling, we performed sub-group analysis for the SIR-based independent predictors, giving comparable results.
In conclusion, our study demonstrates that DWI_b1000 and T2W imaging have great performance characteristics to differentiate MS and CSVD and can be considered reliable discriminators.
Supplemental Material
sj-docx-1-acr-10.1177_02841851231155608 - Supplemental material for Multiple sclerosis versus cerebral small vessel disease in MRI: a practical approach using qualitative and quantitative signal intensity differences in white matter lesions
Supplemental material, sj-docx-1-acr-10.1177_02841851231155608 for Multiple sclerosis versus cerebral small vessel disease in MRI: a practical approach using qualitative and quantitative signal intensity differences in white matter lesions by Sabahattin Yuzkan, Serdar Balsak, Ufuk Cinkir and Burak Kocak in Acta Radiologica
Footnotes
Declaration of conflicting interests
The author(s) declared no potential conflicts of interest with respect to the research, authorship, and/or publication of this article.
Funding
The author(s) received no financial support for the research, authorship, and/or publication of this article.
Data availability
The datasets generated during the current study are available from the corresponding author on reasonable request.
Supplemental material
Supplemental material for this article is available online.
References
Supplementary Material
Please find the following supplemental material available below.
For Open Access articles published under a Creative Commons License, all supplemental material carries the same license as the article it is associated with.
For non-Open Access articles published, all supplemental material carries a non-exclusive license, and permission requests for re-use of supplemental material or any part of supplemental material shall be sent directly to the copyright owner as specified in the copyright notice associated with the article.