
Abstract
Background
High-dose-rate computed tomography (CT)-guided brachytherapy (HDR-BT) has shown promising results in patients with hepatocellular carcinoma (HCC). While growing evidence shows clear limitations of mRECIST, diffusion-weighted imaging (DWI) has relevant potential in improving the response assessment.
Purpose
To assess whether DWI allows evaluation of short- and long-term tumor response in patients with HCC after HDR-BT.
Material and Methods
A total of 22 patients with 11 non-responding HCCs (NR-HCC; local tumor recurrence within two years) and 24 responding HCCs (R-HCC; follow-up at least two years) were included in this retrospective bi-center study. HCCs were treated with HDR-BT and patients underwent pre- and post-interventional magnetic resonance imaging (MRI). Analyses of DWI were evaluated and compared between pre-interventional MRI, 1.follow-up after 3 months and 2.follow-up at the time of the local tumor recurrence (in NR-HCC) or after 12 months (in R-HCC).
Results
ADCmean of R-HCC increased significantly after HDR-BT on the first and second follow-up (ADCmean: 0.87 ± 0.18 × 10⁻³ mm2/s [pre-interventional]: 1.14 ± 0.23 × 10⁻³ mm2/s [1. post-interventional]; 1.42 ± 0.32 × 10⁻³ mm2/s [2. post-interventional]; P < 0.001). ADCmean of NR-HCC did not show a significant increase from pre-intervention to 1. post-interventional MRI (ADCmean: 0.85 ± 0.24 × 10⁻³ mm2/s and 1.00 ± 0.30 × 10⁻³ mm2/s, respectively; P = 0.131). ADCmean increase was significant between pre-intervention and 2. follow-up (ADCmean: 1.03 ± 0.19 × 10⁻³ mm2/s; P = 0.018). There was no significant increase of ADCmean between the first and second follow-up. There was, however, a significant increase of ADCmin after 12 months (ADCmin: 0.87 ± 0.29 × 10⁻³ mm2/s) compared to pre-interventional MRI and first follow-up (P < 0.005) only in R-HCC.
Conclusion
The tumor response after CT-guided HDR-BT was associated with a significantly higher increase in ADCmean and ADCmin in short- and long-term follow-up.
Keywords
Introduction
Image-guided interstitial high-dose-rate computed tomography (CT)-guided brachytherapy (HDR-BT), a percutaneous ablation technique, was first introduced into clinical practice by Ricke et al. in 2002 (1,2) and has shown promising results with regards to safety, efficiency, local tumor control, and overall survival in patients with hepatocellular carcinoma (HCC) (3,4).
The criteria for an imaging response are usually based on anatomic changes such as size and vascularization. Currently, the modified RECIST (mRECIST) represents the gold standard for the evaluation of a tumor response after treatment for HCC (5,6). However, growing evidence shows clear limitations of mRECIST, since post-treatment contrast enhancement, even several months after therapy, is not the only unique feature of a viable tumor and may also appear in benign tissue due to inflammation and/or granulation (7–10).
Diffusion-weighted imaging (DWI) reflects motion of free water molecules and allows qualitative and quantitative (on apparent diffusion coefficient [ADC] map) evaluation of changes in tissue cellularity (11–13). In oncologic imaging, DWI is routinely used for the detection and characterization of liver lesions since benign lesions tend to show higher ADC values than malignant lesions (14). In addition, DWI seems to be useful in determining tumor grading and histopathological parameters that are associated with ADC values. For example, Surov et al. showed that ADC predicts a non-invasive tumor grade and microvascular invasion (15). Similarly, Huang et al. showed that ADC values are correlated with both Ki-67 and HIF-α expression in HCC (16).
Presumably, ADC may also predict a tumor response. In fact, previous studies have shown the ability of DWI to assess a tumor response after Yttrium-90 radioembolization as well as after transarterial chemoembolization (TACE) in patients with HCC (17,18). Kokabi et al. demonstrated that tumors with an objective response by mRECIST had significantly increased ADC value when compared to “non-responders” following Y-90 therapy in patients with infiltrative HCC with portal vein thrombosis (17). Finally, Drewes et al. showed that ADC can predict HCC treatment response after TACE (19). For the evaluation of therapy response after HDR-BT, Wybranski et al. also showed that DWI is a promising imaging marker for early prediction of tumor response in patients with colorectal liver metastases (20).
However, we believe there are no studies that have investigated the feasibility of DWI to predict and evaluate a tumor response in patients with HCC after HDR-BT in short- and long-term intervals.
Therefore, the aim of the present study was to assess whether DWI allows for the prediction and evaluation of a treatment response after HDR-BT in patients with HCC.
Material and Methods
Study population
This retrospective study was approved by the local research ethics committee. After sample size planning, patients with HCC who were treated with CT-guided HDR-BT with an iridium-192 source between 2014 and 2018 that underwent pre- and post-interventional MRIs were included based on a retrospective search in the radiology patient database of two centers.
In center 1, all patients treated between 2017 and 2018 were evaluated. In center 2, we recruited the remaining patients according to a sample size calculation. Treatments in center 2 were performed between 2014 and 2018 (a longer recruitment period due to the longer existing therapy offer for HDR-BT). The patients recruited in center 2 were also part of the previously published study (21). However, the two studies address different questions and aims; the already published study analyzes the prognostic and predictive value of baseline DWI in HCC before HDR-BT with regard to local tumor control and overall survival. In this study, on the other hand, it is examined whether the DWI is suitable for assessing tumor response and whether local tumor recurrence can be detected with this sequence.
Further inclusion criteria signifies that all patients had received a baseline MRI including DWI before brachytherapy, a follow-up MRI including DWI after three months, and a second follow-up MRI including DWI at the time of the local tumor recurrence (non-responder group) or a follow-up MRI including DWI after 12 months (responder = control group). The exclusion criteria included severe motion artefacts, complications during intervention, lesion size <1 cm, follow-up of responding lesions <24 months, incomplete MRI protocol, or locoregional ablative therapy before HDR-BT.
CT-guided interstitial HDR-BT
All patients included in this study underwent CT-guided HDR-BT based on consensus in an interdisciplinary tumor conference. HDR-BT was performed in one single session as described elsewhere in detail (3,4). After analgesia and sedation, brachytherapy catheters were positioned inside the tumor volume under CT guidance, followed by a planning CT scan. Subsequent HDR-BT using an afterloading technique was performed using a 192Ir source. After irradiation, the catheters were removed while administering absorbable gelatine sponge (gelfoam®) to seal the puncture tract (3,4). The applied dose was a minimum of 15 Gy tumor enclosing (3,22).
MRI
MRI examinations were performed using a 1.5-T MR system (Magnetom Avanto, Magnetom Aera Siemens Healthcare, Erlangen, Germany or Achieva, Philips Healthcare, Best, The Netherlands) and protocol included:
T2-weighted (T2W) single-shot and turbo-spin echo sequences with and without fat suppression T1-weighted (T1W) gradient echo (GRE) sequence with fat suppression before and in the arterial, portal-venous, and late venous phase and hepatobiliary phase after a delay of 20 min after intravenous contrast agent injection (Gd-EOB-DTPA; Primovist, Eovist, Bayer HealthCare, Leverkusen, Germany) DW sequences with b-values of 50, 400, and 800 s/mm2 (center 1) and 0 and 500 s/mm2 (center 2)
Image analysis
Reference standard
The classification into non-responding (NR)-HCC and responding (R)-HCC was based on a consensus reading of follow-up imaging over a period of two years after therapy, using the mRECIST: NR-HCCs were defined as treated lesions with (i) persisting and over time increasing enhancement and size (at least 20%) or (ii) new nodular arterial enhancement with corresponding washout and defect in the hepatobiliary phase, whereas R-HCCs were defined as lesions (i) without vascularization in the sense of a disappearance of any intratumoral arterial enhancement or (ii) with a decrease of vascularized size of at least 30% in the arterial phase without washout and without hypointensity during the hepatobiliary phase.
Quantitative and qualitative image analysis
All MRI data were reviewed in consensus by two radiologists within each department (center 1: observers with 2 and 14 years of experience in abdominal MRI; and center 2: observers with 3 and 16 years of experience in abdominal MRI) in three separate sessions with a two-week interval between the sessions: (i) pre-interventional MRI; (ii) first post-interventional MRI; and (iii) second post-interventional MRI.
Location and size measurements
The location of each lesion was recorded, and size measurements were performed in all MRIs. In order to measure the exact lesion size without post-radiogenic changes we measured the size of each HCC lesion, in consensus with all other acquired sequences on T1W axial images in the liver-specific phase on the slice with the largest tumor diameter on both MR examinations.
DWI with ADC measurements
Pre-interventional DWI were evaluated whether (i) HCC lesions showed restricted diffusion, (ii) no diffusion restriction / invisible on high b-value images, or (iii) whether there is no diffusion restriction with a T2 shine through.
In consensus with all other acquired sequences, a region of interest (ROI) was manually drawn on the slice with the largest viable tumor extent (including necrotic areas, if present) on DWI. Later, the ROIs were transferred to the same slice of the ADC map to measure intralesional ADC values including minimal (ADCmin) and mean (ADCmean) ADC values. ADC measurements were repeated for the same lesions on follow-up MRI images. Furthermore, circular ROIs were also placed in areas of normal liver parenchyma on pre- and post-interventional DWI-MR images.
Statistics
The statistical analysis was performed with SPSS Statistics version 22 (IBM Corp., Armonk, NY, USA) and SAS version 9.4 for Windows (SAS Institute, Inc., Cary, NC, USA).
Sample size planning
Based on an assumption of μ1∼470 ADCmean increase in responders, as well as μ2∼150 ADCmean increase in non-responders, and a standard deviation of σ∼300 for the absolute intra-individual ADCmean change, a sample size of N1 = 24 responders and N2 = 11 non-responders would achieve a power of 81.1% to reject the null hypothesis of equal means with a two-sided significance level of α = 0.05 using a two-sample t-test.
For normally distributed data, such as the ADCmean and ADCmin of target lesions, paired t-tests were used for comparisons between study visits (before vs. after HDR-BT) and two-sample t-tests were used for comparisons between response groups (intra-individual changes in responders vs. non-responders). For non-normally distributed continuous data (such as lesion size), the Mann-Whitney U test and Wilcoxon test were used instead of the two-sample t-test and paired t-test. For categorical data, such as diffusion restriction, McNemar's test was used for comparisons between study visits, and Fisher's exact test or chi-square test was used for comparisons between response groups.
Results
Patients
In total, 22 patients (20 men, 2 women; mean age = 63.6 ± 24.8) with 11 NR-HCC and 24 R-HCC were included (Fig. 1).
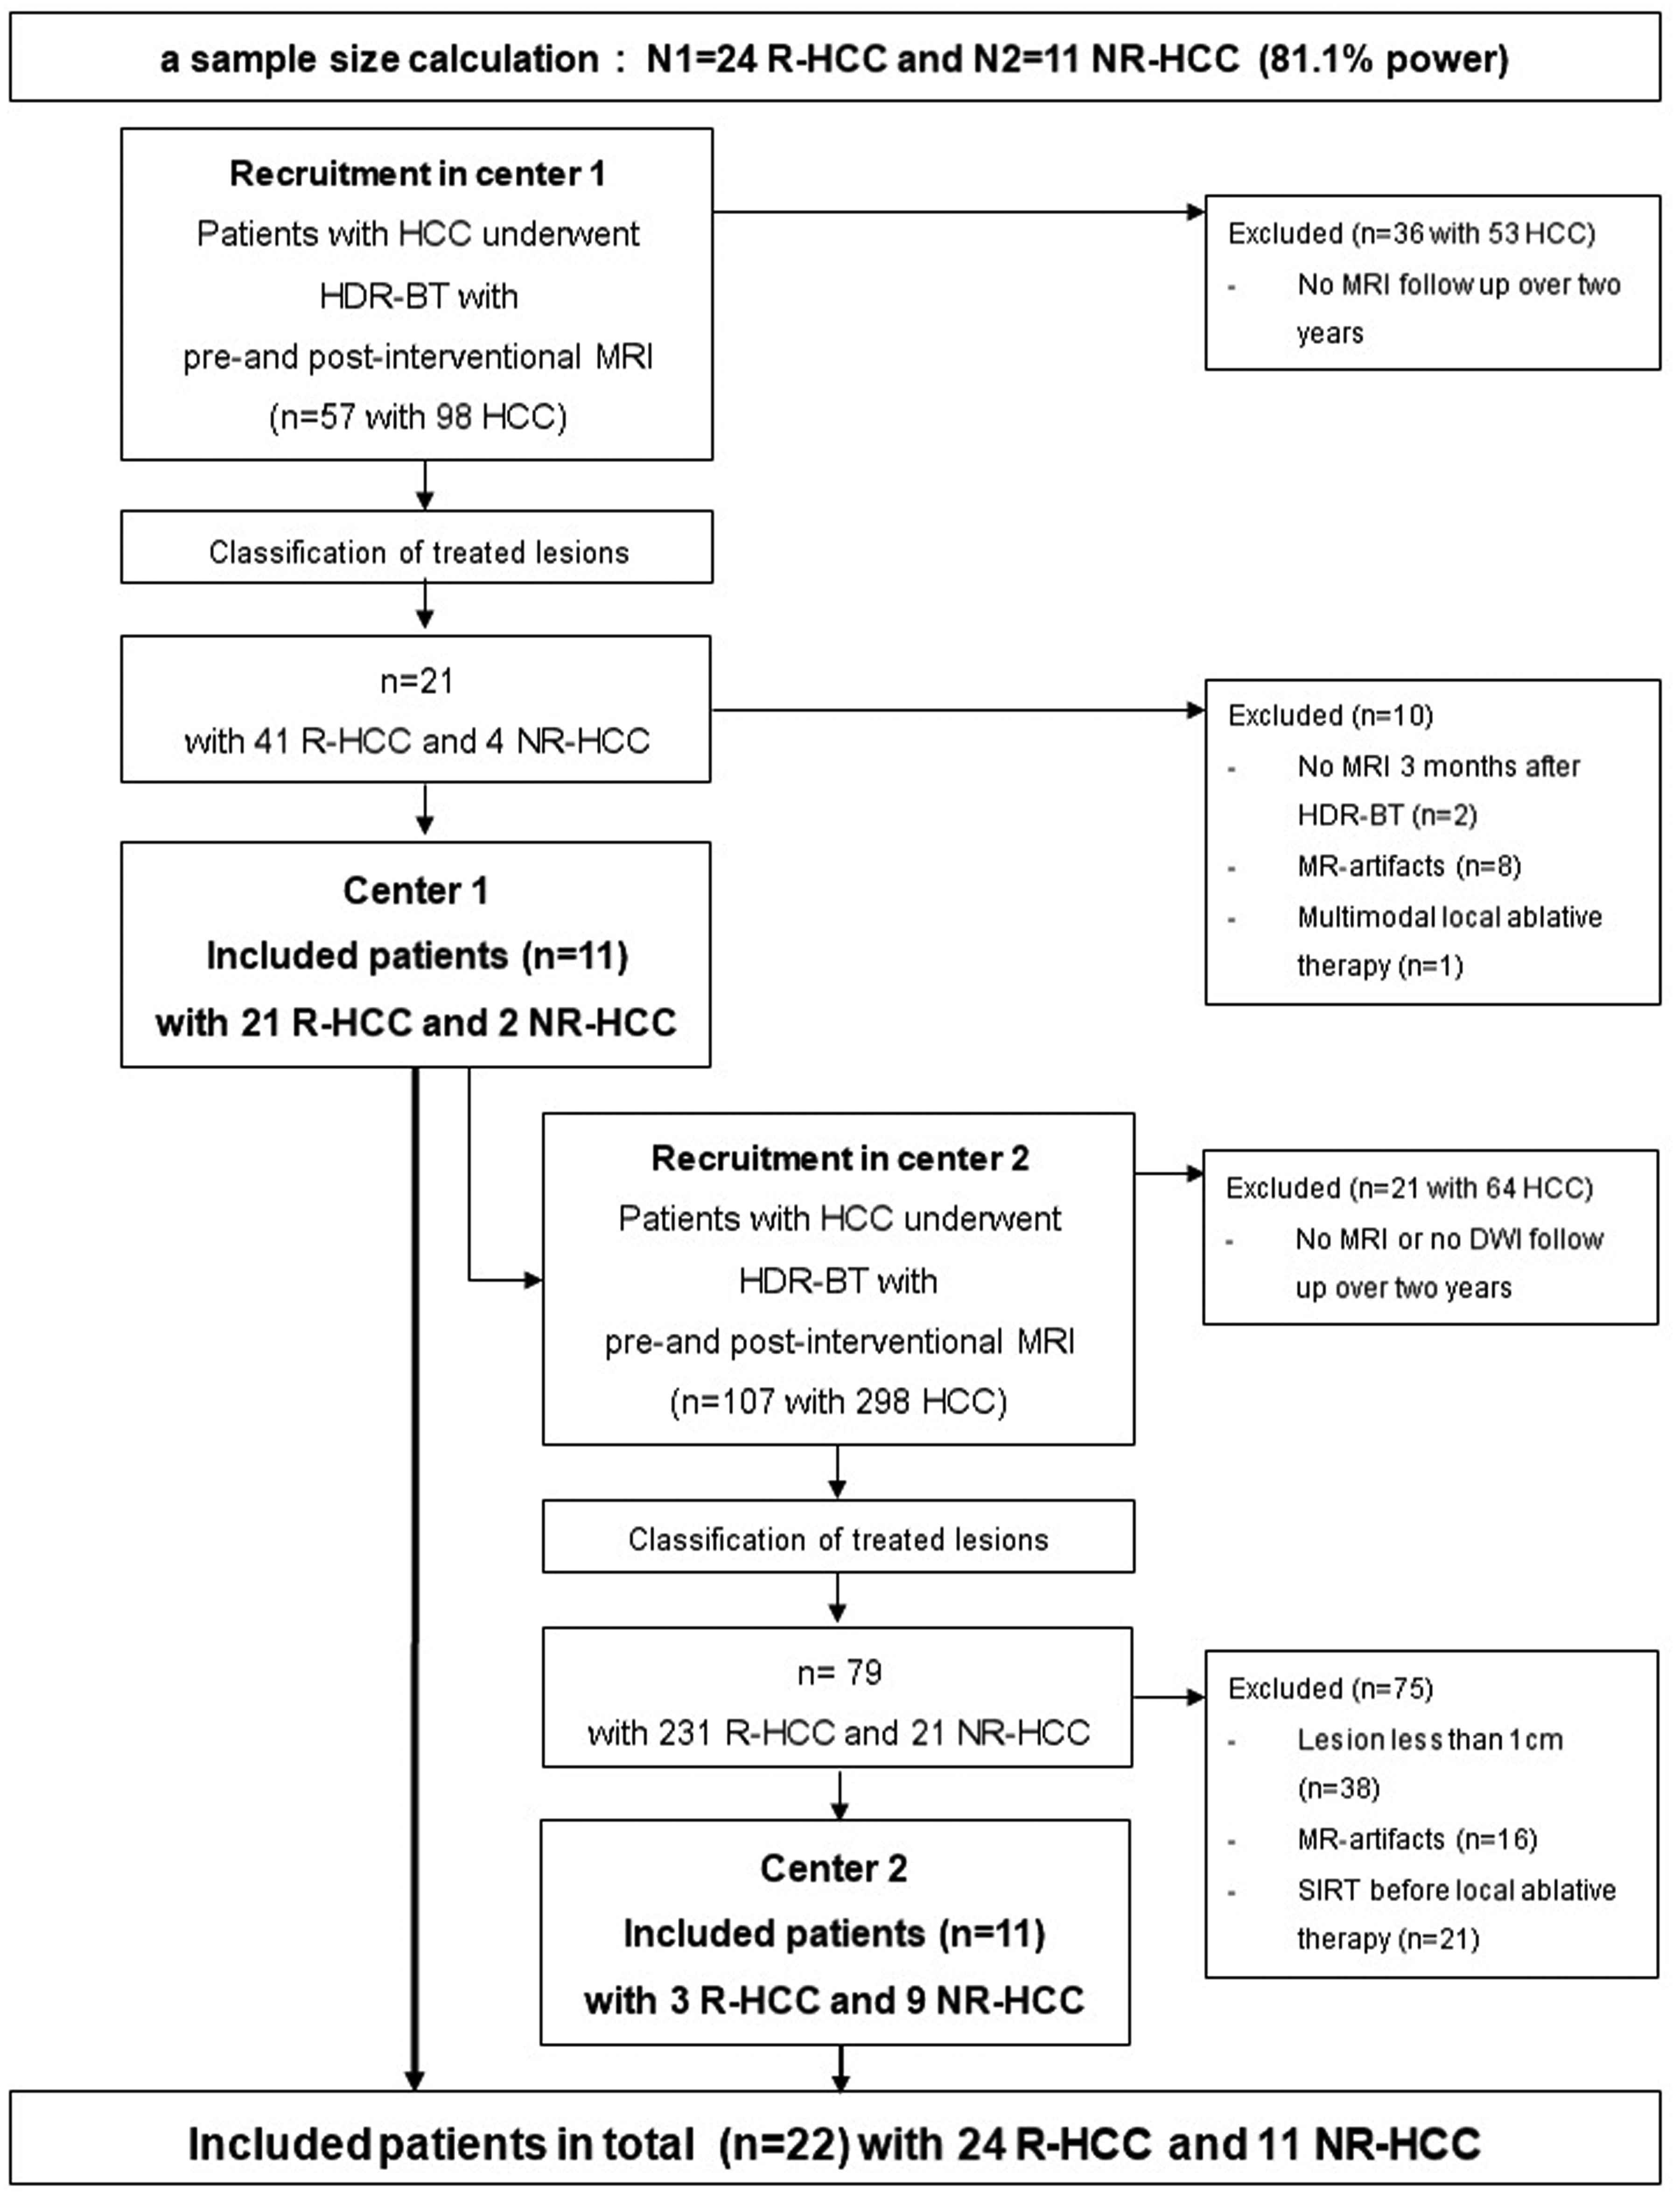
Consort chart. DWI, diffusion-weighted imaging; HCC, hepatocellular carcinoma; HD-BRT, high-dose-rate brachytherapy; NR-HCC, non-responding HCC; R-HCC, responding HCC.
In center 1, a total of 11 patients with 21 R-HCC and 2 NR-HCC were selected. In center 2, we recruited the remaining patients (n = 11, 3 R-HCC and 9 NR-HCC) according to the sample size calculation.
Time frame between pre- and post-interventional MRI, location, and size of HCC
Baseline MRI including DWI was performed a mean of 14 ± 20 days before HDR-BT (R-HCC: 16 ± 23 days, NR-HCC: 11 ± 13 days) and the first follow-up MRI with a mean of 88 ± 33 days after HDR-BT (R-HCC: 87 ± 30 days, NR-HCC: 90 ± 40 days). A second follow-up MRI showing a non-response was acquired with a mean of 469 ± 156 days after HDR-BT and a second follow-up MRI in responding lesions was performed with a mean of 357 days ± 30 days after HDR-BT.
A total of 13 lesions were located in the right lobe, 10 lesions in the left lobe, and two lesions in both lobes.
The mean of the overall diameter of R-HCC was 2.25 ± 1.48 cm on pre-interventional MR images and 2.00 ± 1.05 cm on first post-interventional images. Compared to pre-interventional MRI, there was a significant decrease in size (mean size: 1.47 ± 0.72 cm) on second post-interventional MRI. The mean of the longest diameter of NR-HCC did not significantly differ between pre-interventional MR images versus the first and second post-interventional images (5.03 ± 3.17 cm, 4.39 ± 2.69 cm, and 4.51 ± 3.07 cm, respectively).
DWI
Qualitative analysis of DWI
Visual diffusion restriction decreased significantly in R-HCC after therapy: on pre-interventional MRI, 58.3% (14/24) of R-HCC had a visual diffusion restriction while on the first follow-up only 8.3% (2/24) were diffusion restricted (P = 0.001); on the second post-interventional MRI, no lesion showed any diffusion restriction. On the other hand, there was no significant change in diffusion restriction in the NR-HCC: on pre-interventional MRI, 81.8% (9/11) of NR-HCC had a visual diffusion restriction, while on the first follow up, 54.5% (6/11) were still diffusion restricted; and at the time of the local tumor recurrence, there was even a renewed increase in diffusion-restricted lesions to 63.6% (7/11).
There was no significant difference in visual diffusion restriction between R-HCC and NR-HCC on pre-interventional MRI.
Quantitative analysis of DWI- ADC measurements
The ADCmean of R-HCC increased significantly from 0.87 ± 0.18×10⁻³ mm2/s before treatment to 1.14 ± 0.23 × 10⁻³ mm2/s after treatment (P < 0.001) on first follow-up and showed a further significant increase to 1.42 ± 0.32×10⁻³ mm2/s 12 months after therapy (P < 0.001) (Figs. 2–4).
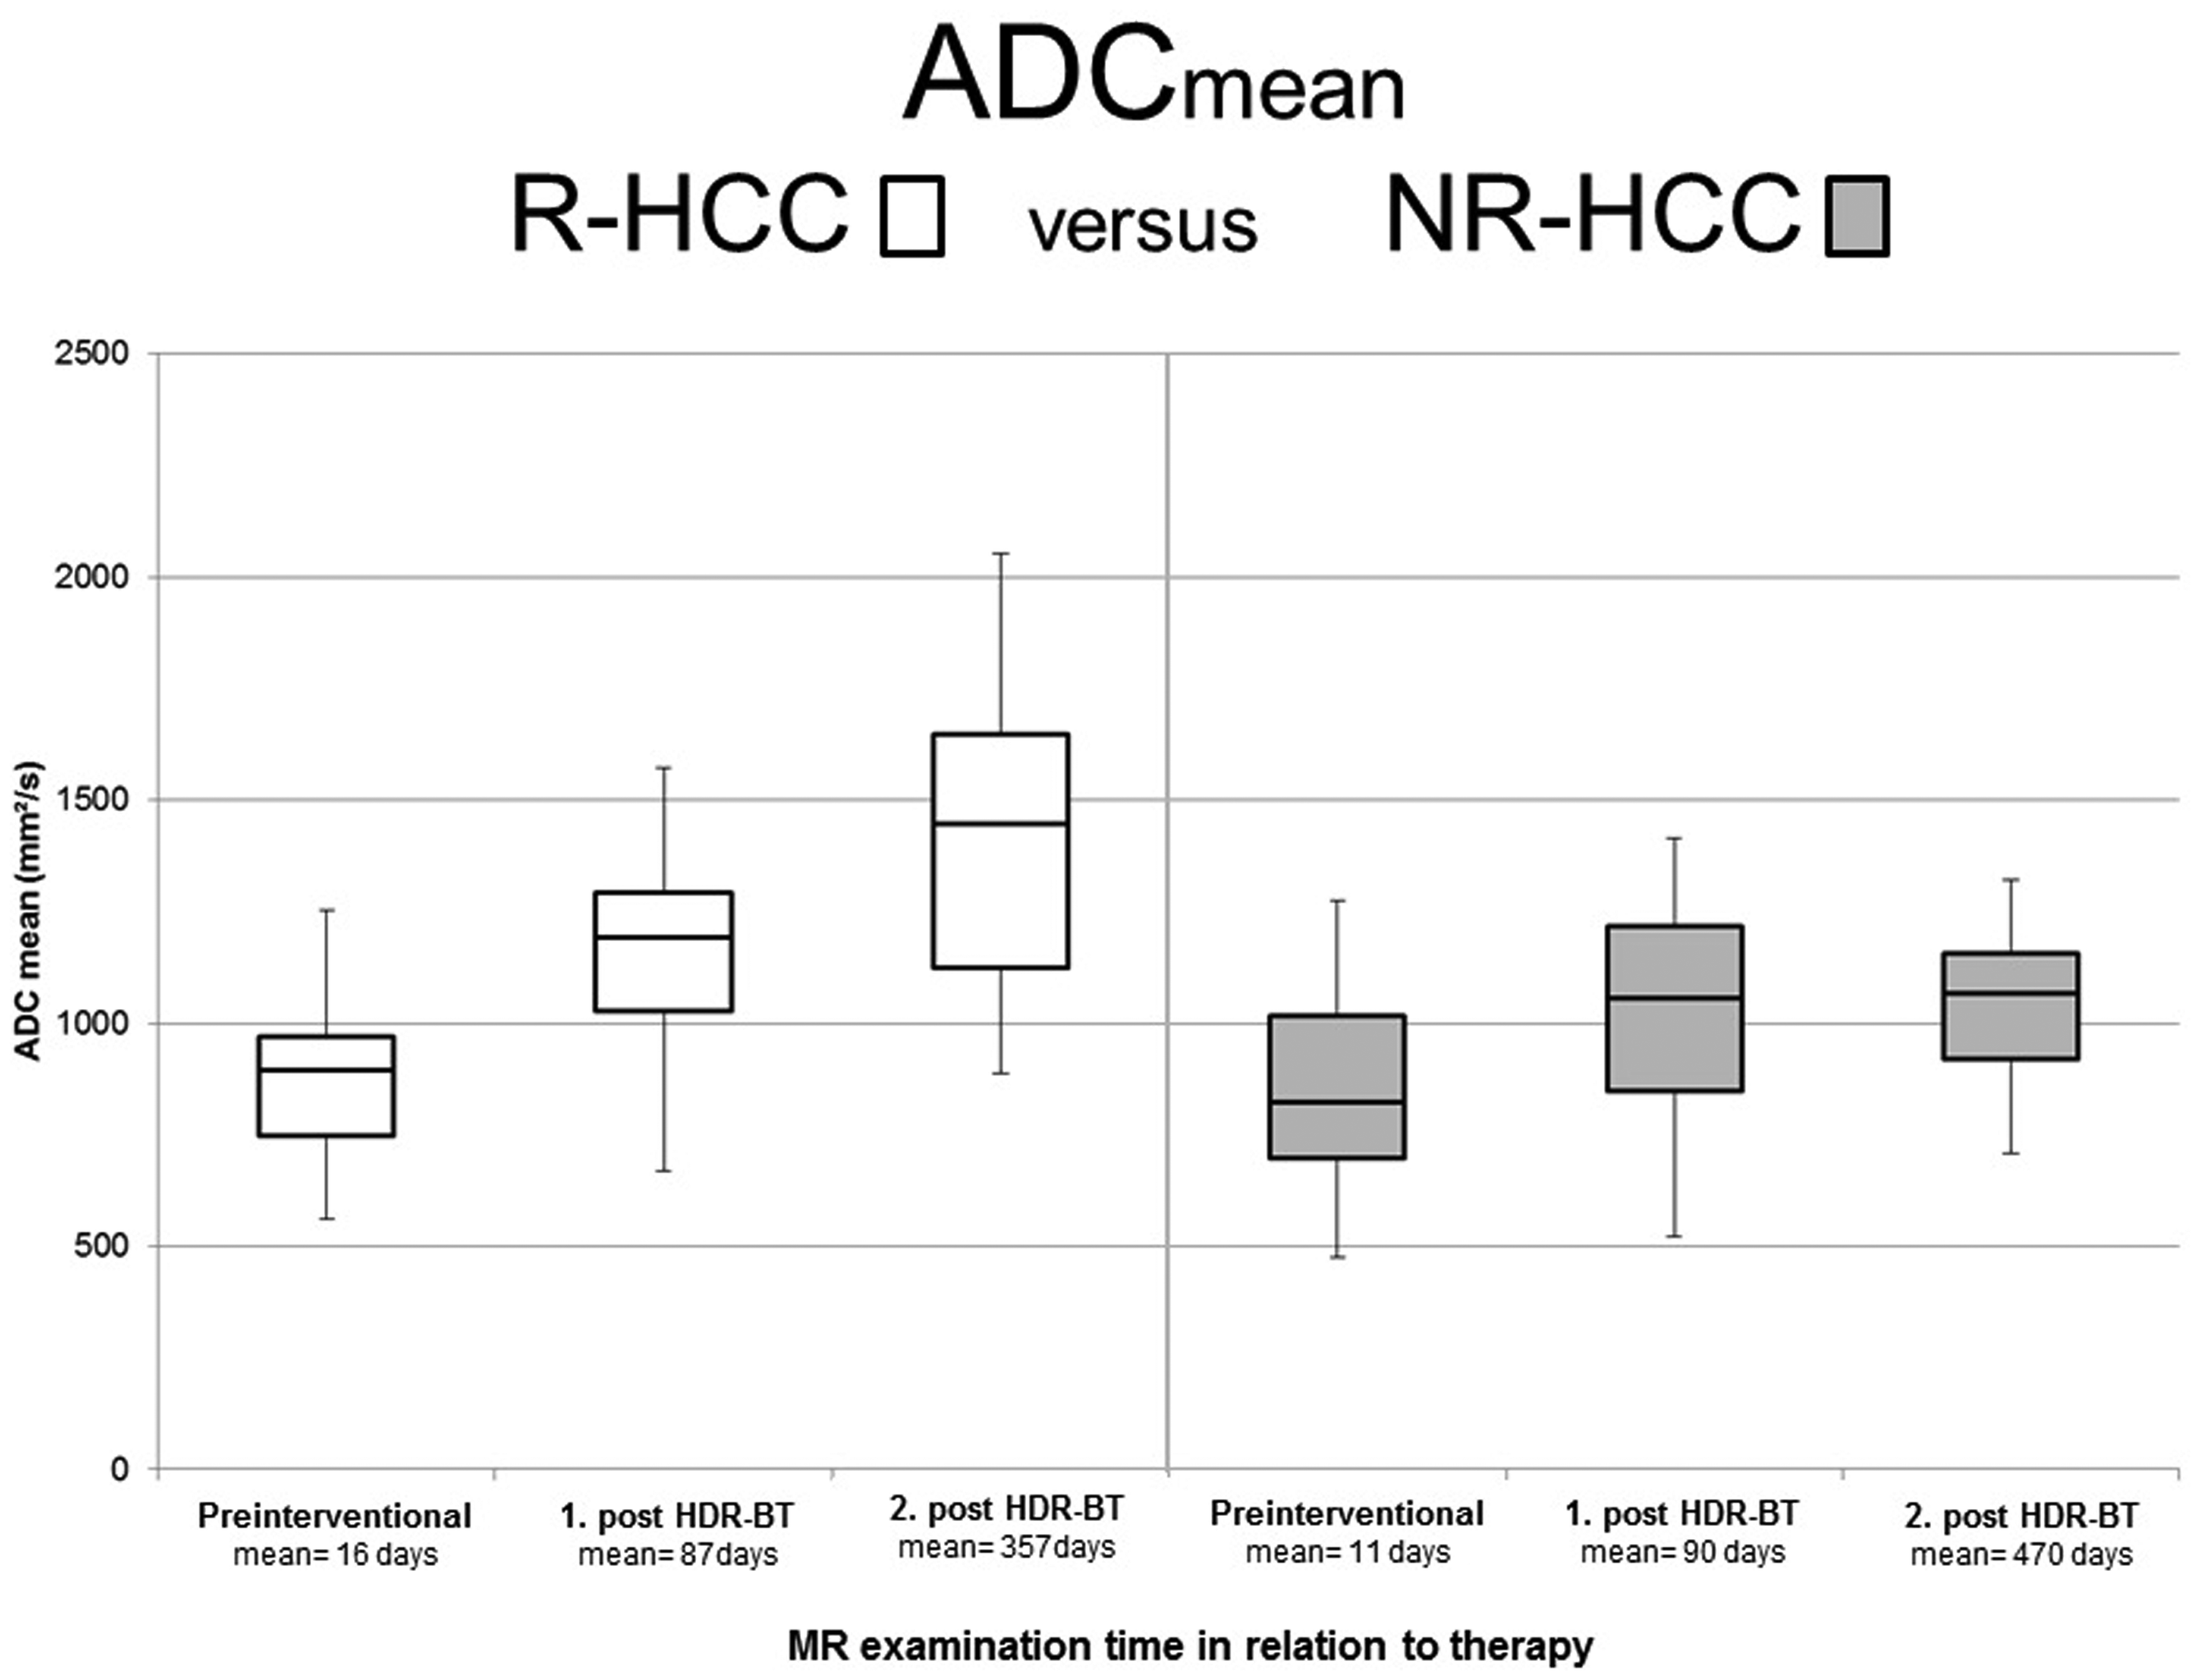
ADCmean in responding and non-responding HCC on pre-interventional MRI, first and second follow-up after HD-BRT. ADCmean of R-HCC increased significantly on first postoperative imaging after treatment and showed a further significant increase of ADCmean 12 months after therapy (P < 0.001). In contrast, there was no significant change of ADCmean of NR-HCC on the first MRI after treatment (P = 0.81) and ADCmean of N-HCC on second follow-up remained almost unchanged compared to first follow-up. ADC, apparent diffusion coefficient; HCC, hepatocellular carcinoma; HD-BRT, high-dose-rate brachytherapy; MRI, magnetic resonance imaging; NR-HCC, non-responding HCC; R-HCC, responding HCC.

Responding HCC in an 83-year-old man. (a, b) The pre-interventional axial contrast-enhanced T1-weighted image (arterial phase) shows a hyper-vascular HCC (circle) in segment 8 with hypointensity on the hepatobiliary phase. (c, d) The HCC shows restricted diffusion with high signal on axial DWI image b = 800 s/mm2 and low signal on ADC map. The pre-interventional ADCmean of the HCC was 0.62 × 10⁻³ mm2/s. (e) After HDR-BT, the lesion shows remaining arterial rim enhancement due to radiation on first follow-up. (f) On hepatobiliary phase, the lesion shows central necrosis with a peripheral post-radiogenic hypo-intense rim. (g, h) On DWI, the HCC demonstrated hyper-intense signal and predominantly hyper-intense signal on the ADC map indicating less restricted diffusion compared to the pre-interventional image. The ADCmean value of the HCC increased to 0.98 × 10⁻³ mm2/. In the second follow-up, there is a shrinkage in the size of the HCC. (i, j) Furthermore, arterial enhancement decreased but was still present due to persisting post-radiogenic changes without a new hypointense defect in the hepatobiliary phase. (k, l) On DWI, the lesions show no restricted diffusion with an increasing ADC value of 1.2 × 10⁻³ mm2/s. ADC, apparent diffusion coefficient; DWI, diffusion-weighted imaging; HCC, hepatocellular carcinoma; HD-BRT, high-dose-rate brachytherapy.

Responding HCC in a 64-year-old man. (a) HCC (circle) shows pre-interventional arterial enhancement, (b) hypo-intensity on the liver-specific phase, and (c, d) restricted diffusion with an ADCmean of 0.75 × 10⁻³ mm2/s. (e, f) After HDR-BT, the HCC shows remaining arterial enhancement and with central necrosis and peripheral post-radiogenic rim hypo-intensity during the hepatobiliary phase. (g, h) On DWI, the HCC demonstrated restricted diffusion with an increasing ADCmean of 1.00 × 10⁻³ mm2/s. (i, j) After 12 months, the lesion decreased in size, showed no arterial enhancement with central necrosis and peripheral post-radiogenic changes in the hepatobiliary phase. (k, l) There was a further increase of ADC value (1.45 × 10⁻³ mm2/s) with high signal on DWI and high signal on ADC map. ADC, apparent diffusion coefficient; DWI, diffusion-weighted imaging; HCC, hepatocellular carcinoma; HD-BRT, high-dose-rate brachytherapy.
There was no significant change of ADCmean of NR-HCC (from 0.85 ± 0.24 × 10⁻³ mm2/s to 1.00 ± 0.30 × 10⁻³ mm2/s) on the first MRI after treatment (P = 0.81). The ADCmean of NR-HCC increased significantly between pre-interventional and second post-interventional MRI (P = 0.018); however, the ADCmean remained almost unchanged at 1.03 ± 0.19 × 10⁻³ mm2/s compared to the first follow-up (Figs. 2 and 5).

Non-responding HCC in a 55-year-old woman. (a–d) On pre-interventional MRI, hyper-vascular HCC (circle) shows a hypo-intense pattern on the liver-specific phase and restricted diffusion with an ADCmean of 0.75 × 10⁻³ mm2/s. (e, f) Three months after HDR-BT, the HCC shows decreased but remaining arterial enhancement and hypo-intensity on the hepatobiliary phase. (g, h) On DWI, the HCC demonstrated visually partial restricted diffusion with an ADCmean of 1.02 × 10⁻³ mm2/s. (i, j) After 11 months, the lesion increased in size, shows new focal arterial enhancement with a new defect on the hepatobiliary phase (arrow) indicating local tumor recurrence. (k, l) On DWI, there is visually an increasing diffusion restriction with a persistently low ADC value of 0.98 × 10⁻³ mm2/s. ADC, apparent diffusion coefficient; DWI, diffusion-weighted imaging; HCC, hepatocellular carcinoma; HD-BRT, high-dose-rate brachytherapy; MRI, magnetic resonance imaging.
The ADCmin in R-HCC did not increase significantly from 0.49 ± 0.22 × 10⁻³ mm2/s before treatment to 0.60 ± 0.28 × 10⁻³ mm2/s after treatment on the first follow-up, but there was a significant increase of ADCmin after 12 months (ADCmin = 0.87 ± 0.29 × 10⁻³ mm2/s) compared to pre-interventional MRI and the first follow-up (P < 0.005).
In NR-HCC, there was no significant change of ADCmin (from 0.49 ± 0.22 × 10⁻³ mm2/s to 0.66 ± 0.39 × 10⁻³ mm2/s to 0.60 ± 0.18 × 10⁻³ mm2/s) over time.
The ADCmean of normal liver parenchyma was 1.02 ± 0.17, 0.89 ± 0.13 and 0.93 ± 0.17 × 10⁻³ mm2/s on pre-interventional MRI, and first and second follow-up, respectively. There were no differences between the ADCmean of normal liver parenchyma between either R-CC and NR-HCC or between the pre-interventional, first post-interventional, and second follow-up. Furthermore, there were no significant differences between the ADCmean of normal liver parenchyma between the patients from center 1 and those from center 2.
Discussion
The aim of this study was to investigate whether DWI and quantitative ADC allow the prediction and evaluation of HDR-BT of HCC. Our results show that the ADCmean of R-HCC increased significantly after therapy in short- and long-term intervals although there was no significant increase of the ADCmean in the non-responder group in the short interval and no significant change between the first and second follow-up after HDR-BT.
Therefore, the ADCmean values, especially intra-individual change in the ADCmean, may be a useful adjunct to evaluate the tumor response of HCC treated by HDR-BT.
The early determination of a tumor response is needed to further improve management of the disease regarding planning reintervention or additional treatments. In addition to the usual morphological image criteria of tumor response, such as size and vascularization, DWI also seems to be able to show therapy effects and therapy response. Previous studies of primary and secondary liver tumors have shown an increase in ADC values after a number of different treatment modalities (23–28). However, currently, to the best of our knowledge, there are no data on ADC values of patients with HCC undergoing HDR-BT in short- and long-term intervals.
In our study, in contrast to NR-HCC, there was a significant increase in the ADCmean value in R-HCC after three months. Therefore, DWI seems to allow the early prediction of treatment response after HD-BRT. Wybranski et al. showed in their study of 30 patients (with 43 unresectable colorectal metastases) that DWI is a promising imaging biomarker for the prediction of a tumor response and therapy monitoring in patients with colorectal liver metastases after HDR-BT (20). They found that the mean tumor ADC decreased significantly at first early MRI (two days after treatment) and increased significantly after three months. This could be explained by the fact that brachytherapy leads to immediate cell necrosis of the tissue in the immediate vicinity of the brachytherapy catheters. However, the study did not discriminate between responding and non-responding lesions.
With regard to long-term evaluation, we found a significant increase in ADCmean and ADCmin in R-HCC between first and second follow-up. We assume this is due to increasing necrosis and declining post-radiogenic changes such as endothelial damage, post-interventional hemorrhage, and cell swelling. In contrast, we could not find any significant change in ADC values for the NR-HCC between the first and second follow-up. Instead, we found a marked increase in the visual diffusion restriction at the time of the recurrence. Similarly, Zhao et al. demonstrated in their meta-analysis of 624 patients (with 712 HCC lesions) that DWI performed better in diagnosing residual or recurrent HCC lesions after TACE and hence ADC values may serve as alternatives for further evaluation of residual or recurrent lesions in patients with HCC after TACE (29).
There is controversial discussion in the current literature regarding the role of pre-treatment ADC values in predicting a tumor response. Yong et al. and Tamm et al. demonstrated that pre-treatment ADCmean values in responding lesions of patients with colorectal and gastric hepatic metastases were significantly lower than those of non-responding lesions, which could be related to necrosis or a dampened immune response (30,31). However, in our study, there were no significant differences in pre-treatment ADC values in different response groups. Nevertheless, we can support the results of the aforementioned studies with our qualitative DWI results.
The present study has some limitations. The response rates to CT-guided brachytherapy have been reported as extending 90% even in tumors exceeding 10 cm (29). Therefore, the number of patients eligible for study inclusion was relatively low. Furthermore, the timing of imaging acquisition before and especially after treatment between the responder and non-responder groups was not entirely similar. It must be noted that MR data acquisition was not standardized between centers. For example, b-values differed and may have affected the results. However, there was no statistical difference of ADC measurements of normal liver parenchyma between the patients in center 1 and those in center 2; the results, therefore, seem to be robust in light of routine MR acquisition with non-standardized DWI at the two centers. In addition, NR-HCC were larger than R-HCC, which may have an effect on ADC measurements, though there were no significant differences between ADCmean and ADCmin on pre-interventional MRI. However, larger studies are needed to confirm these results. Furthermore, mRECIST is limited by post-interventional changes. In order to avoid possible post-interventional changes that simulate a local recurrence, we chose a long period of one year after the intervention for the final evaluation.
In conclusion, ADC measurements, especially the increase of ADC values over time, could be a highly useful additional non-invasive diagnostic tool alongside “standard” response analysis for the evaluation of treatment response in early and long-term follow-up after CT-guided HDR-BT in patients with HCC.
Footnotes
Declaration of conflicting interests
The author(s) declared no potential conflicts of interest with respect to the research, authorship, and/or publication of this article.
Funding
The author(s) received no financial support for the research, authorship, and/or publication of this article.