
Abstract
Background
Certain anatomical characteristics of the knee have potential relationships with the risk of anterior cruciate ligament (ACL) rupture. There remains a need for stronger evidence using arthroscopy as well as radiological imaging to accurately clarify these relationships.
Purpose
To compare the anatomic geometry of the knee joint between patients with and without ACL ruptures.
Material and Methods
Case-controlled study of patients with arthroscopically confirmed ACL ruptures (ACL group) compared to patients with arthroscopically confirmed normal ACLs (control group). Magnetic resonance imaging scans were assessed for a total of 14 quantitative radiological variables including medial and lateral tibial slope angles (bone and cartilage measurements), meniscal height, femoral width, intercondylar notch width and tibial depth.
Results
A total of 105 patients were included in the study, 55 in the ACL group and 50 in the control group. There was a significant difference (P < 0.05) of most of the radiological measurements between the two groups. There was also a significant difference (P < 0.05) when comparing the variables between sexes. Multiple logistic regression analysis produced a mathematical model utilizing all the radiological measurements with 92.6% classification accuracy in predicating an ACL rupture with the medial tibial slope angle being the strongest predicator variable (odds ratio = 8.97, P = 0.011).
Conclusion
Greater postero-inferior directed slope measurements of bone and cartilage in both the lateral and medial compartments with a narrower intercondylar notch width increase the risk of ACL rupture. Mathematical modelling can accurately predict the risk of ACL rupture.
Introduction
The influence of intrinsic knee joint morphology on the risk of anterior cruciate ligament (ACL) rupture has been previously evaluated (1–6), as well as extrinsic factors (7). Multiple studies on bony morphology have shown narrower femoral intercondylar notch width predisposes to a higher risk of rupture (1,8,9). Other measurements of the femoral and tibial articulations and cartilage have been investigated for potential correlation (5,10,11).
More postero-inferior directed tibial slopes on lateral radiographs have shown a linear relationship with the amount of ACL graft force experienced (12) as well as the risk of subsequent injury to ACL grafts (13); however, there are discrepancies regarding the significance of slopes in the medial and lateral compartment of the knee (14). There are less data on the significance of cartilage geometry and meniscus height. As well as direct relationship with specific dimensions, combining measures to better quantify risk may yield improved accuracy. Previous research has predominantly been designed as case-control studies with patients undergoing ACL reconstruction being compared to patients with radiological imaging alone to affirm a “normal” knee. A knee arthroscopy is the gold standard for defining the presence or absence of an ACL rupture as it allows for direct visualization of the ligament itself. There is a distinct lack of research that includes patients with arthroscopic confirmation of the ACL integrity. Improving screening tools for ACL injuries has the potential to predict those who are at highest risk and employ targeted and prophylactic measures to help reduce injuries. The ability to quantify risk in pre-morbid individuals will allow for more directed primary interventions (including targeted physiotherapy exercises and specific sport related training regimes) in order to improve outcomes in those individuals with anatomy that tends towards ACL rupture. Growing evidence describing extrinsic factors that increase risk, for example certain playing surfaces and weather conditions in skiing (7,15), gives guidance to primary interventions.
The aim of the present study was to compare the anatomic geometric characteristics of the knee joint between patients with and without ACL ruptures, as confirmed arthroscopically. The hypothesis of the study was that anatomic geometric characteristics of the knee joint are associated with increased risk of ACL rupture.
Material and Methods
Patients
All the patients included in this study were treated by a single consultant orthopedic surgeon with a specialist interest in knee surgery at a district general hospital. This radiological study included patients who attended a specialist knee clinic and underwent arthroscopic knee surgery between April 2017 and December 2019. This study was exempt from institutional review board / ethics committee approval as it was a pragmatic study evaluating the existing clinical practice of the senior author.
The exclusion criteria for both groups consisted of previous ACL reconstruction surgery, posterior cruciate ligament (PCL) rupture, lateral collateral ligament tears / posterolateral complex injury, quadriceps or patellar tendon tears, advanced degenerative joint disease, knee fractures and age <18 years. The ACL group was defined as patients who had a complete ACL rupture confirmed by both a consultant radiologist on magnetic resonance imaging (MRI) scan as well as arthroscopically by a consultant orthopedic surgeon at the time of their ACL reconstruction surgery. All consecutive patients undergoing ACL surgery within the timeframe of the study were included to mitigate any potential selection bias. Patients with meniscus, medial collateral ligament, anterolateral ligament, or capsule tears were not excluded from the ACL group. The control group was defined as patients who had MRI and arthroscopic confirmation of an intact ACL. This group comprised patients undergoing arthroscopic surgery for other reasons (e.g. meniscal tears, removal of loose bodies, etc.). Patients with meniscal tears were not excluded from either group. None of the patients in the control group had advanced degenerative joint disease as arthroscopic surgery is not indicated in these cases. All patients were clinically evaluated both during the initial outpatient clinic consultation and examination under anesthesia at the time of surgery.
Magnetic resonance imaging
MRI scans were obtained using a 1.5-T GE Healthcare SIGNA Artist MRI scanner. The MRI sequences were obtained as per standard knee protocols used by the radiology department and included the following: sagittal, coronal, and axial proton density fat-saturated sequences alongside a sagittal T1-weighted sequence. The parameters for the MRI scans were as follows: slice thickness = 3.5 mm; slice gap = 0.5 mm; matrix = frequency 384/phase 256; TR = 650 ms; TE = 8 ms; echo train length = 3; number of excitations (NEX) = 2; field of view = 15 Å; and bandwidth = 35.71. All MRI scans were reviewed and reported by a consultant radiologist. The MRI findings were confirmed (or refuted) at the time of knee arthroscopy by the consultant orthopedic surgeon where the quality of the ACL was confirmed under direct visualization; a corroboration of findings facilitated inclusion in this study. MRI scans were analyzed using the Picture Archiving and Communication System (PACS) (Centricity version 6; GE Healthcare, Chicago, IL, USA).
Radiological assessment
Fig. 1 illustrates all the radiological variables that were quantitatively measured, the data of which were collected by the first author, a trainee in the host institution. First, the central sagittal slice (Fig. 1a) was determined by identifying the slice between the ACL and PCL attachments (centrally in between the two tibial spines). The axial slice at this point is identified as the most distal cross-section of the femoral articulation (Fig. 1b) with lines representing lateral and medial compartment sagittal planes as an area of 50% articular shadowing either side of the line (16,17). The orientation of the longitudinal axis of the tibia (18) was measured as the angle between a vertical line and a centrally dissecting line of two separate perpendicular measurements of the tibia's width (Fig. 1c).
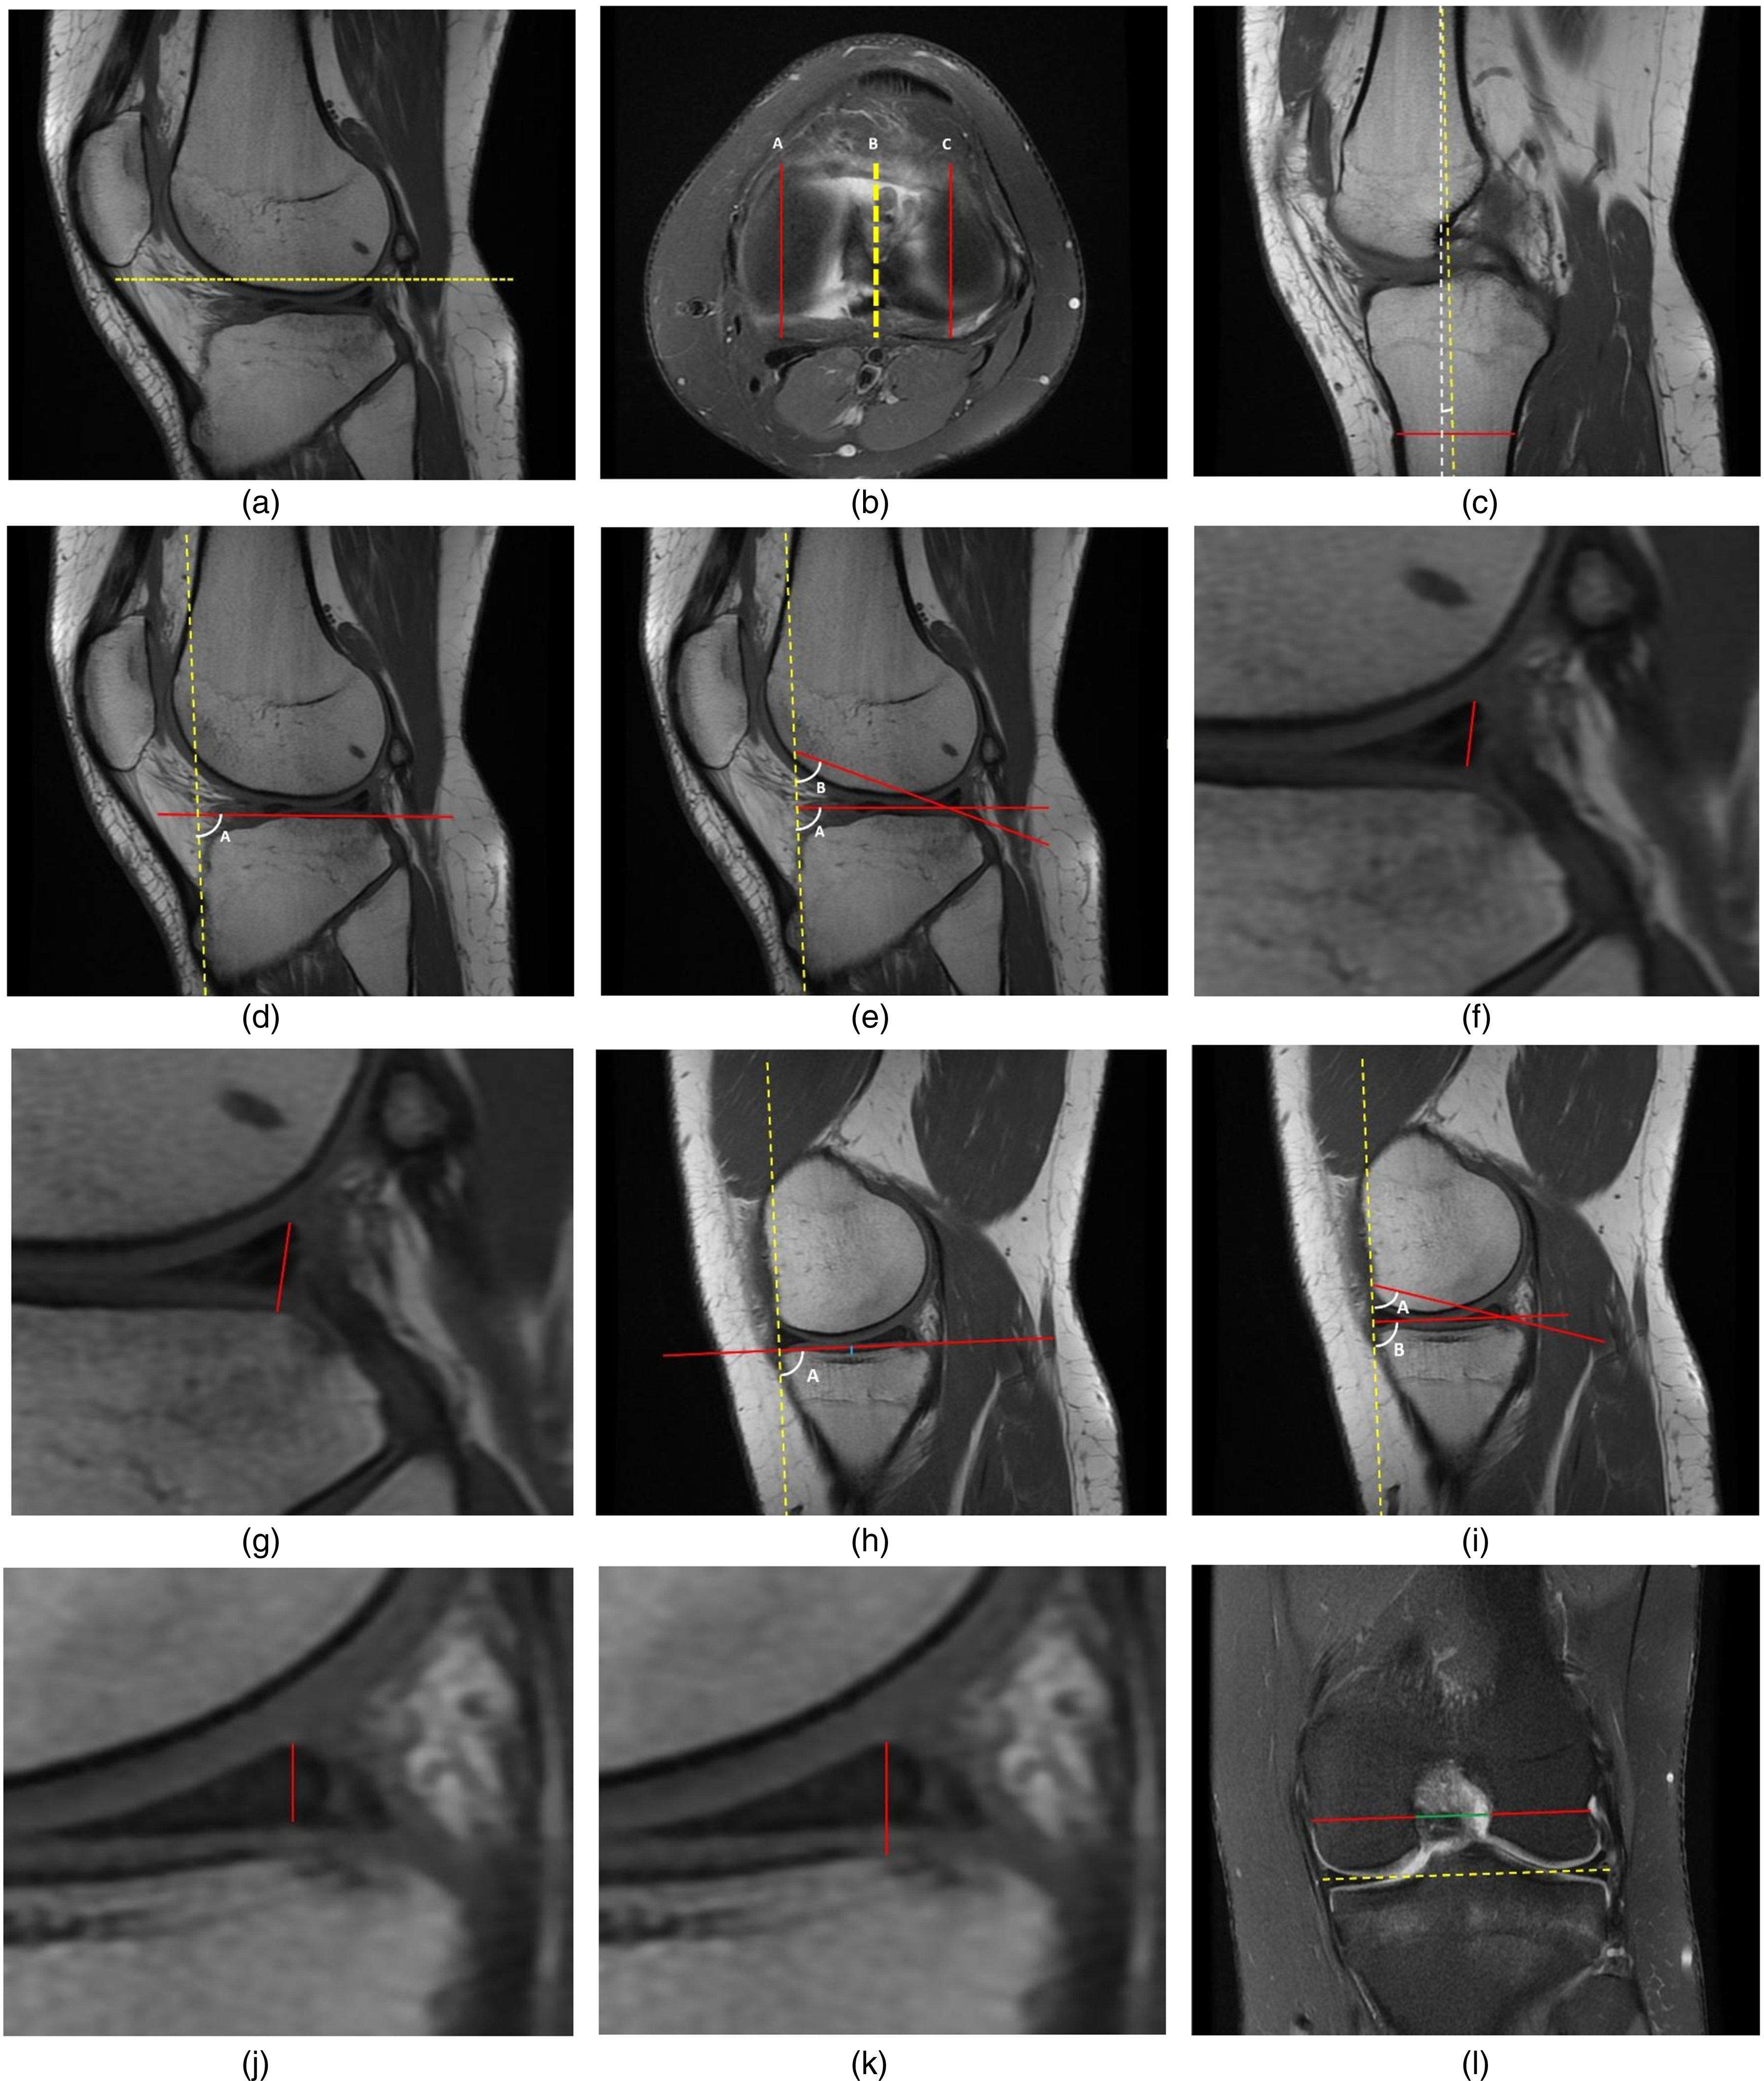
Radiological measurement methodology on MRI scan. (a) Dashed line shows the axial plane used for determining the medial and lateral compartment and the plane used for determining tibial angle. (b) Axial plane as represented by panel (a), identifying the lateral compartment plane (line C) and medial compartment plane (line A) as area of 50% articular shadowing either side of the line. Line B represents the line used for determining the tibial angle. (c) Yellow dashed line represents the angle of the tibia determined by passing through the center of two perpendicular red lines placed a few centimeters apart. Angle against the dashed white line represents the vertical 90° plane of the images determined. (d) Lateral tibial slope angle A, yellow dashed line represents the angle of the tibia as determined in panel (c). (e) Middle lateral cartilage slope angle using angle A, posterior lateral cartilage slope angle using angle B. (f) Lateral meniscus cartilage to cartilage height (measured from superior angle of meniscus to tibial cartilage at the shortest distance). (g) Lateral meniscus cartilage to bone height (measured from superior angle of meniscus to tibial bone at shortest distance). (h) Medial tibial slope angle A, medial tibial depth in blue. (i) Middle medial cartilage slope angle using angle A, posterior medial cartilage slope angle using angle B. (j) Medial meniscus cartilage to cartilage height (measured from superior angle of meniscus to tibial cartilage at the shortest distance). (k) Medial meniscus cartilage to bone height (measured from superior angle of meniscus to tibial cartilage at shortest distance). (l) Yellow dashed line representing the angle of the joint line. Line from deepest inflection of popliteal groove used to measure femoral width (red line) and intercondylar width (green line).
The tibial slope angle was defined as the angle between the longitudinal tibial axis and a line drawn between the inferior and posterior crests of the tibial plateau (Fig. 1d, lateral tibial slope angle; Fig. 1h, medial tibial slope angle) (16,17). The tibial depth was measured using a line perpendicular to the tibial slope at the greatest concavity of the medial tibial plateau (Fig. 1h). The middle cartilage slope was defined as the angle formed between the line of the longitudinal axis of the tibia and the line joining the most superior anterior and most superior posterior prominences of the middle articular cartilage surface (Fig. 1e, lateral middle cartilage slope, angle A; Fig. 1i, medial middle cartilage slope, angle B). The posterior cartilage slope was defined as the angle between the line of the longitudinal tibial axis and the line overlying the cartilage surface in between the most superior posterior prominence and posterior prominence of the surface underlying the posterior meniscal horn (Fig. 1e, lateral posterior cartilage slope, angle B; Fig. 1i, medial posterior cartilage slope, angle A) (6,19).
Meniscal measurements were taken from the superior angle of the posterior horn; a cartilage-to-cartilage height was determined using the shortest length line to inferior articular surface (19) (Fig. 1f, lateral; Fig. 1j, medial). Cartilage-to-bone height was determined by extending the projection of this line to the surface between the tibial articular cartilage and the tibial bone (Fig. 1g, lateral; Fig. 1k, medial).
Finally, the femoral width was determined using a line parallel to the joint line on a coronal slice determined by femoral width measured from the deepest inflection of the popliteal groove; the intercondylar width was measured along the same line as used for femoral width (Fig. 1l) and the ratio between these two values was calculated (5,20). This produced a total of 14 radiological variables that were measured for each patient in both groups.
Statistical analysis
The power calculation for this study was derived from the findings of a related previously published radiological study (19). The sample sizes were based on a conventional Type I error of 5% and a Type II error rate of 10% (i.e. 90% power). The calculation revealed that a sample size of 39 individuals per group was required for a clinically relevant between-group mean difference of 4.8°, based on a within-group standard deviation of 6.4°. Plotted histograms with fitted curve lines, box-plots, normal Q-Q plots, and the Kolmogorov-Smirnov statistic were used to confirm that a normal distribution was an appropriate assumption for all the continuous variables in the study. The independent-sample Student's t-test was used for the between-group statistical analyses. Multiple logistic regression was used for the purpose of statistical analysis to produce predictive models in determining the dichotomous dependent variable (presence / absence of ACL rupture) based on the independent (predictor) continuous radiological variables. In order to satisfy the assumptions of logistic regression statistical analysis and avoid the adverse influence of multicollinearity and singularity on the regression model, the independent variables of intercondylar width and femoral width were excluded from the regression analysis due to the high inter-correlations with the independent variable of intercondylar notch width ratio as the former two variables were the subscales used to calculate the latter. Furthermore, 11 cases with ZResid values above 2.5 or less than −2.5 (i.e. clear outliers) were also excluded therefore leaving a total of 94 patients who were subject to the multiple logistic regression analysis. The Hosmer and Lemeshow goodness-of-fit test was used to indicate the reliability of the mathematical model fitness. The Cox and Snell R Square and the Nagelkerke R Square values provided an indication of the amount of variation in the dependent variable explained by the model. The level of statistical significance was set at P < 0.05. Statistical analysis was performed using SPSS for Windows version 26.0 (IBM Corp., Armonk, NY, USA). The power calculation was performed using Minitab statistical software version 17 (Minitab LLC, State College, PA, USA).
Results
After applying the exclusion criteria, a total of 105 patients were included in the study: 55 patients in the ACL group and 50 patients in the control group. The demographics of both groups are shown in Table 1. The mean age was higher in the control group compared to the ACL group, which was a reflection of a higher proportion of sports-related injuries within the latter group. The ACL group had more right-sided knee injuries than the control group, which had a more even spread in terms of index knee laterality.
Patient demographics.
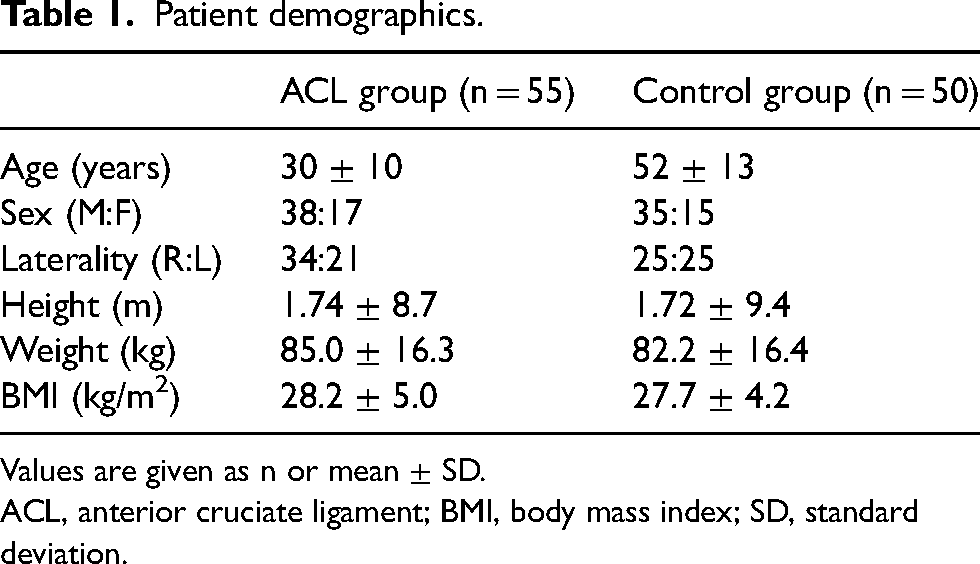
Values are given as n or mean ± SD.
ACL, anterior cruciate ligament; BMI, body mass index; SD, standard deviation.
Table 2 shows the statistical comparison of the mean data of both groups. The lateral middle cartilage slope angle, lateral posterior cartilage slope angle, and the lateral tibial slope all demonstrated a statistically significant difference between groups. A smaller slope angle in these domains is associated with an increased risk of ACL rupture. The intercondylar width and the intercondylar notch width ratio were significantly smaller in the ACL group. Furthermore, significant differences between groups were found in the medial tibial slope angle and the medial middle cartilage. Similar to the results seen in the lateral compartment, the ACL group on average had a significantly smaller angle in the medial tibial slope and medial middle cartilage slope. The only meniscal measurement that showed statistical significance was the medial meniscus cartilage to cartilage height which was smaller in the ACL group.
Group comparison.
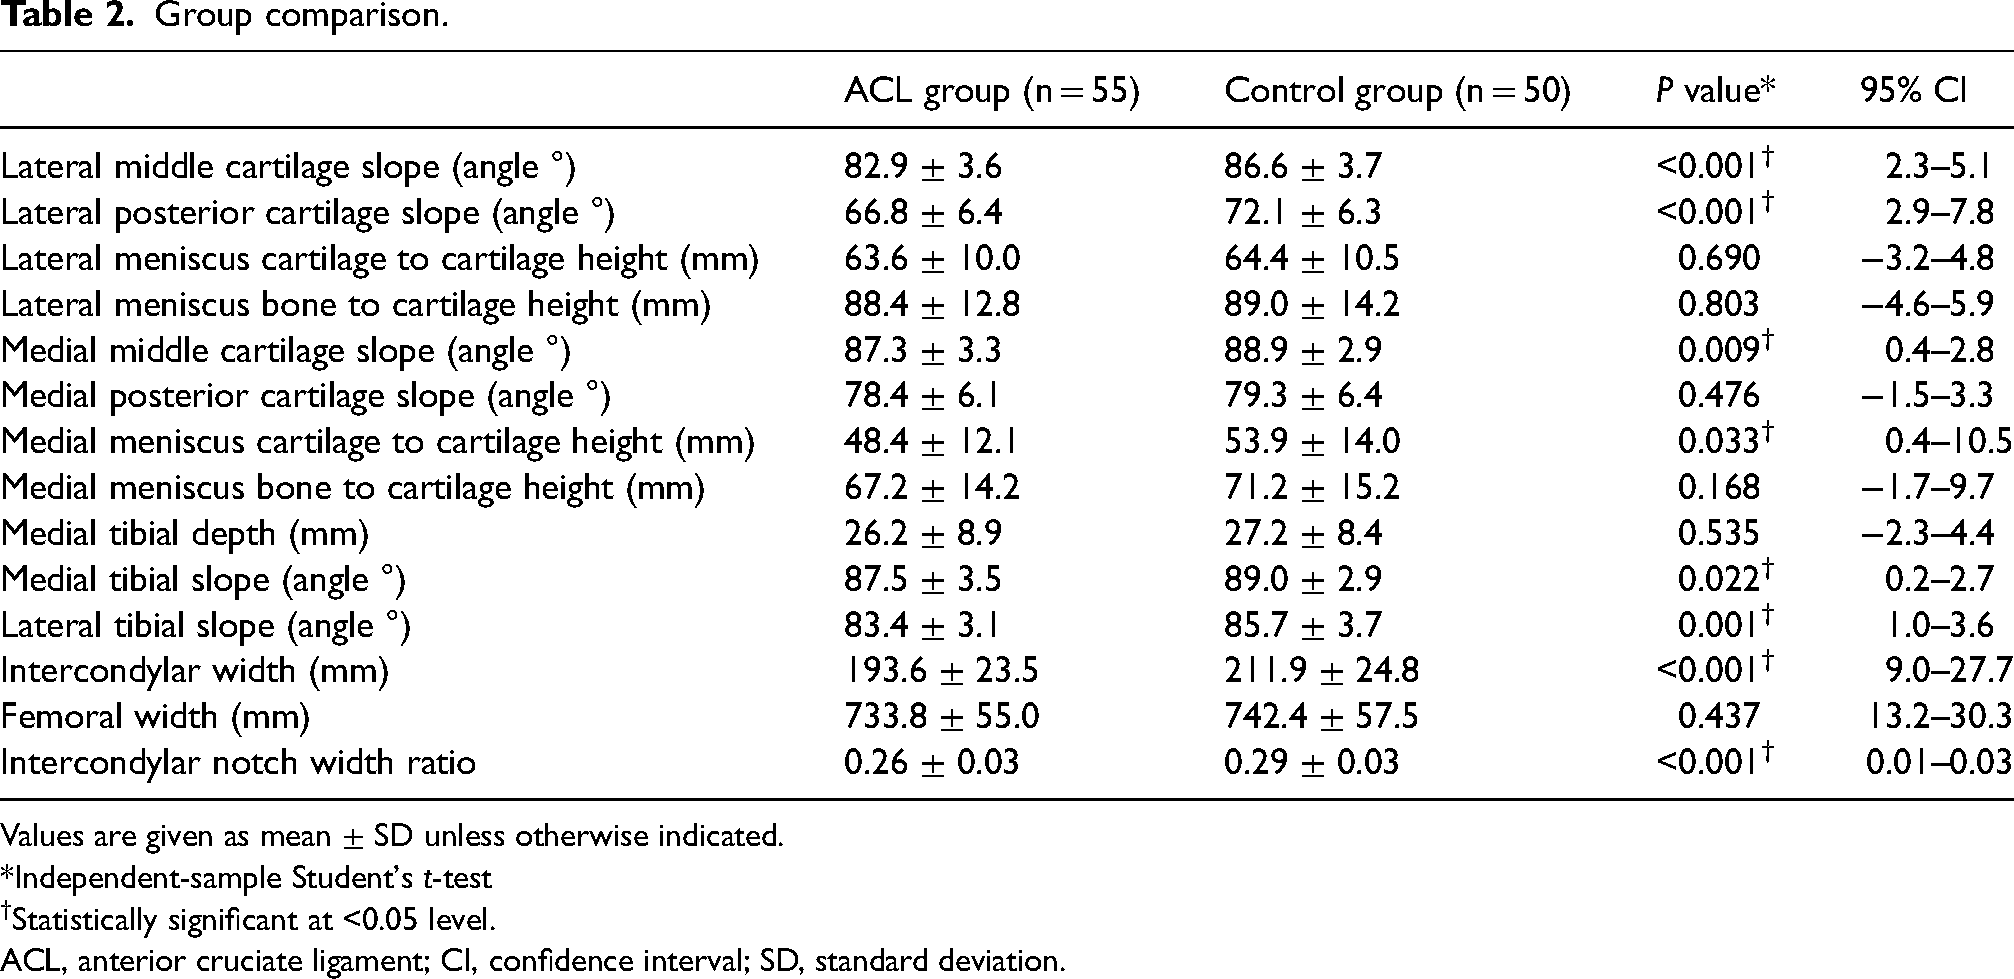
Values are given as mean ± SD unless otherwise indicated.
*Independent-sample Student's t-test
Statistically significant at <0.05 level.
ACL, anterior cruciate ligament; CI, confidence interval; SD, standard deviation.
Table 3 shows the statistical comparison between male and female patients. The female group had significantly smaller slope angles in both medial and lateral bone measurements. The femoral and intercondylar widths were significantly smaller in female participants but no significant difference was seen when comparing notch width ratio. Table 4 shows the data from the multiple logistic regression analysis whereby six of the independent variables showed a statistically significant contribution to the model. The strongest predictor of ACL rupture was the medial tibial slope angle, the second was the lateral tibial slope, the third was the lateral meniscus cartilage to cartilage height, and the fourth was the medial meniscus bone to cartilage height. The summary of the multiple logistic regression model is represented in Table 5; this model had a 92.6% percentage accuracy in classification with a high sensitivity (90.0%) and specificity (95.5%).
Comparison of the sexes.
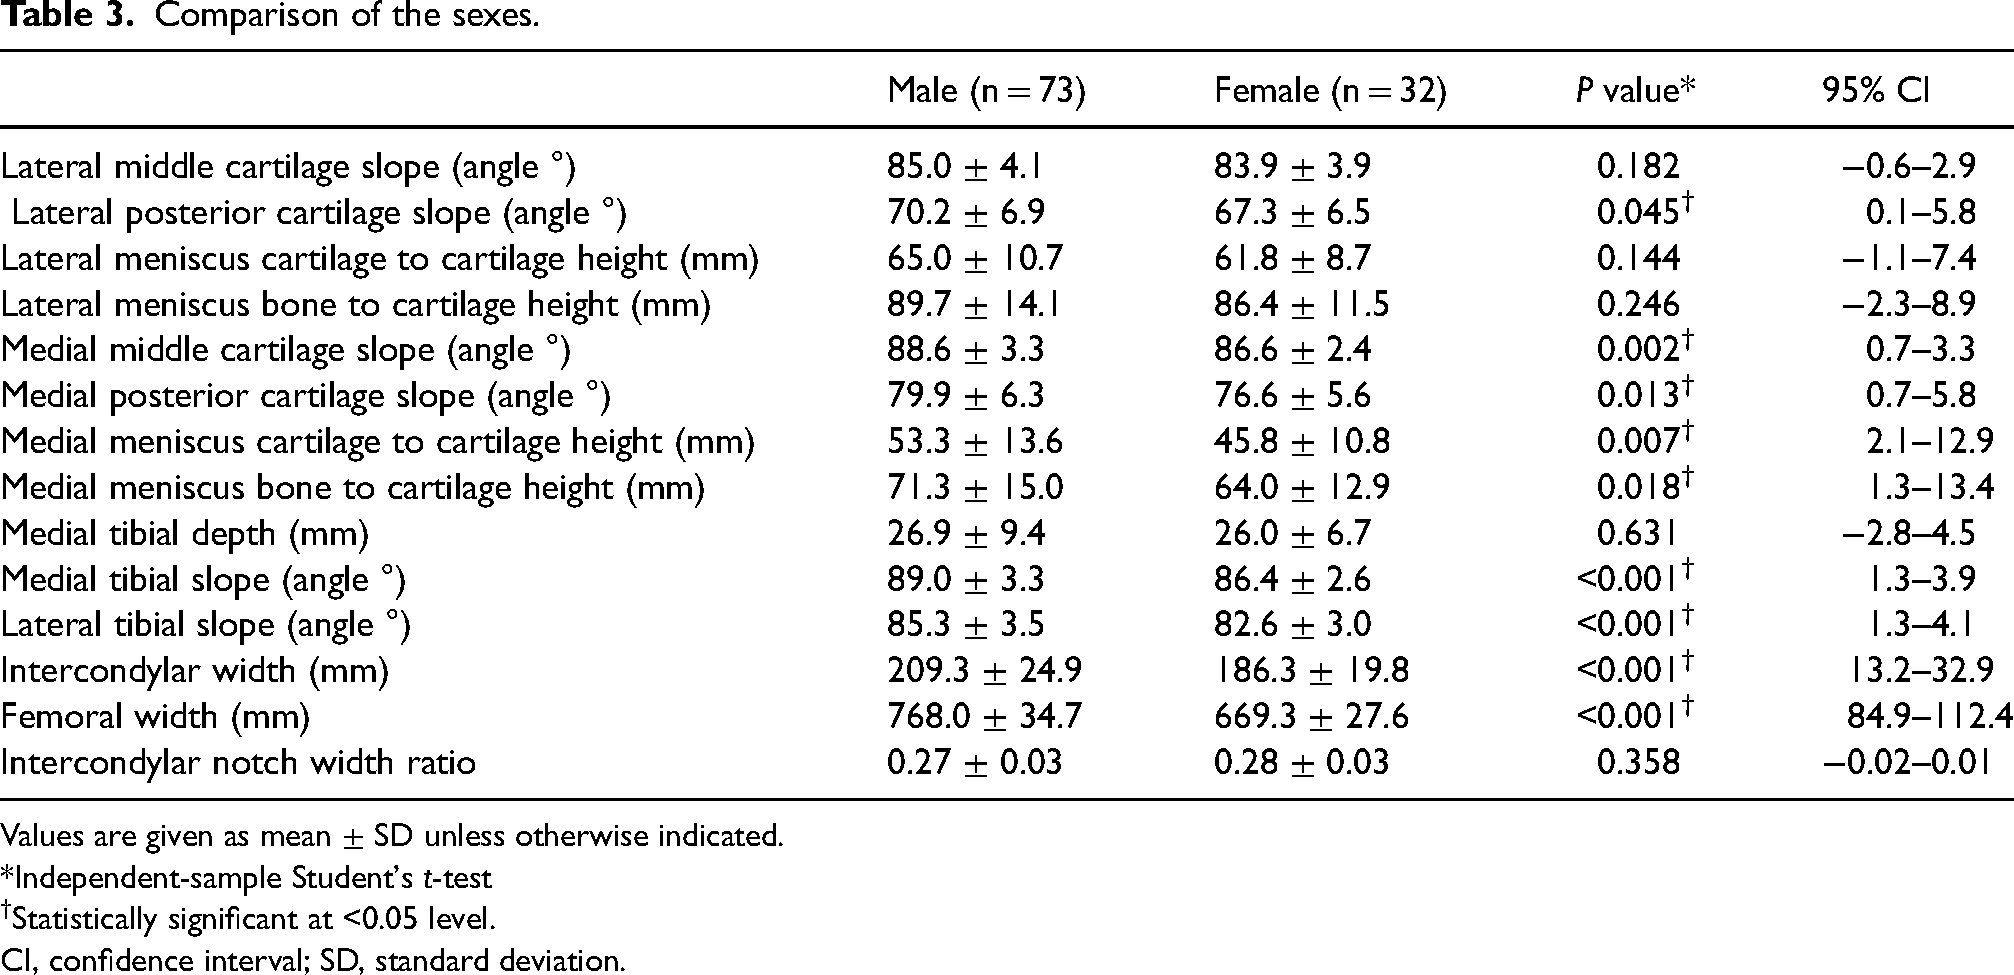
Values are given as mean ± SD unless otherwise indicated.
*Independent-sample Student's t-test
Statistically significant at <0.05 level.
CI, confidence interval; SD, standard deviation.
Multiple logistic regression analysis.
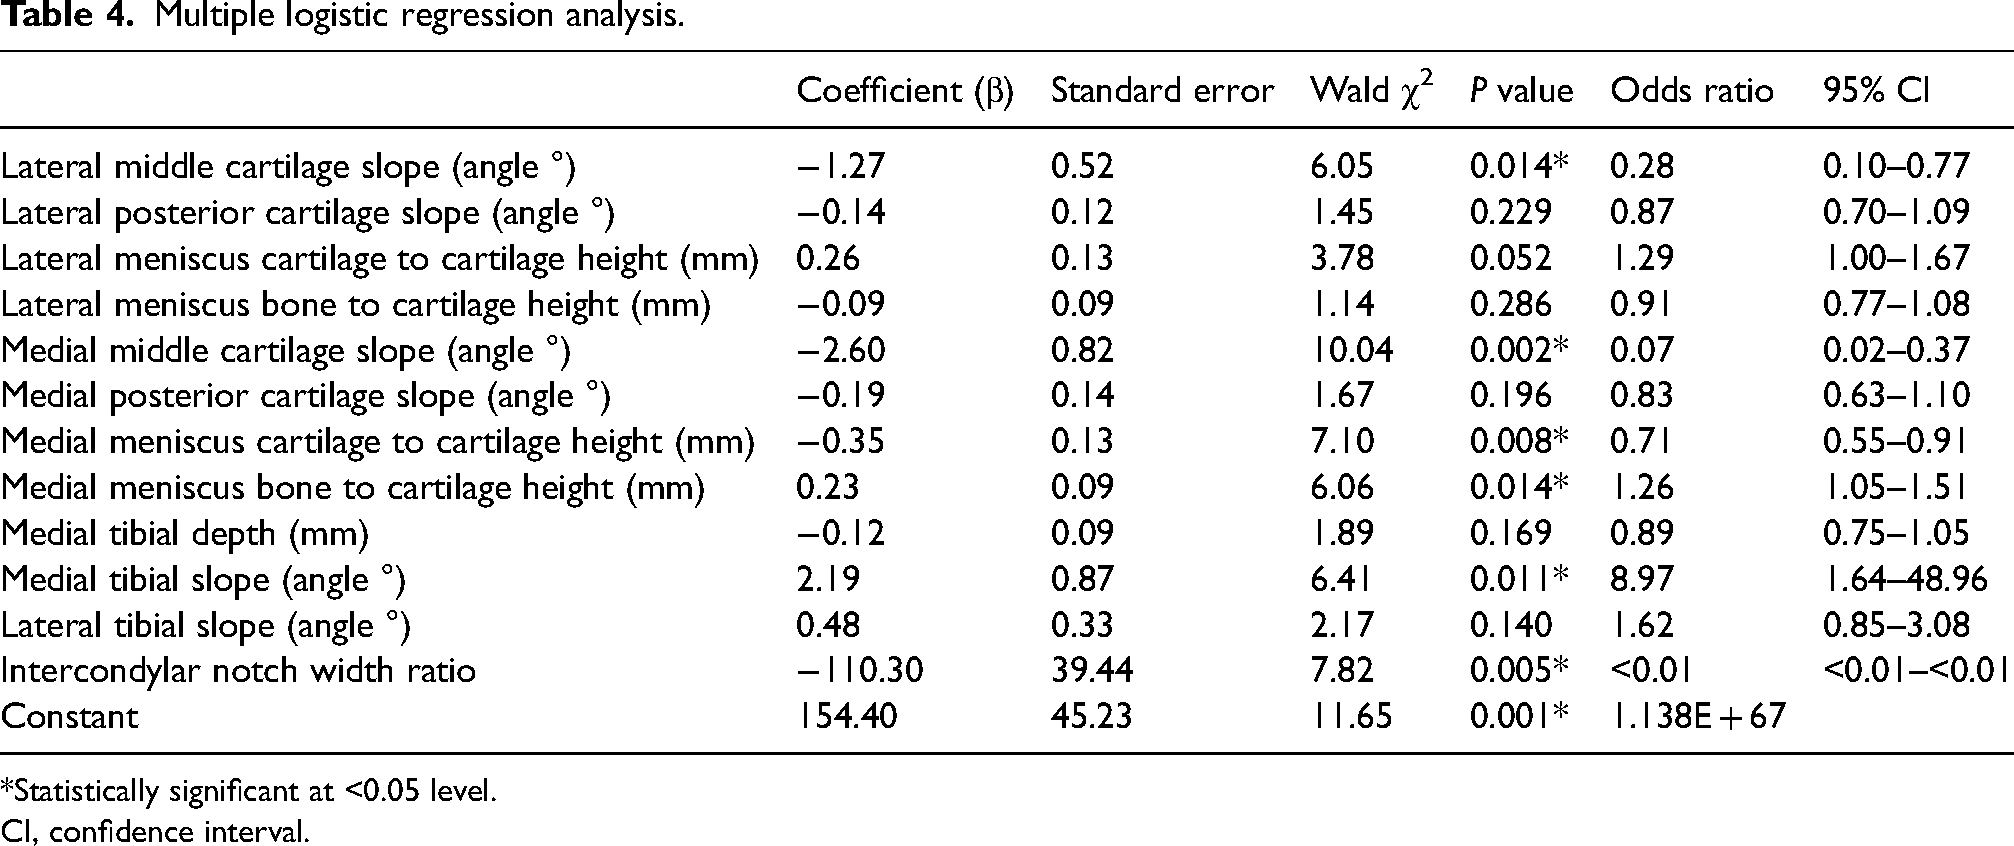
*Statistically significant at <0.05 level.
CI, confidence interval.
Multiple logistic regression full model summary.
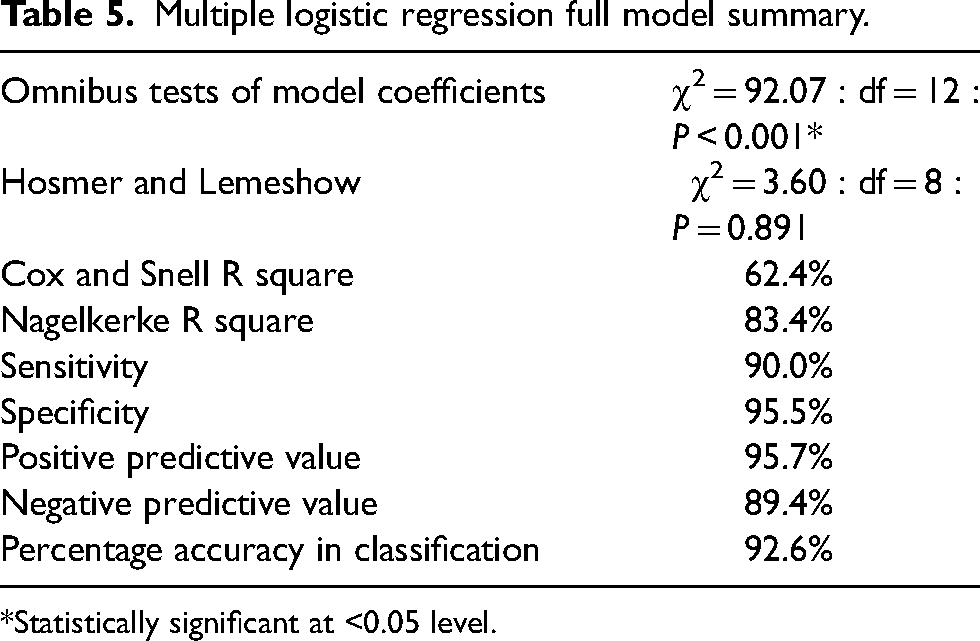
*Statistically significant at <0.05 level.
Discussion
This study demonstrated significantly reduced slope angles of the lateral compartment (middle cartilage slope and posterior cartilage slope as well as tibial slope) in the ACL group. There were similar findings in the medial compartment with the tibial slope angle and middle cartilage slope angle; however, the medial posterior cartilage middle slope did not show a significant difference. There was also a reduced intercondylar notch width ratio in the ACL group compared to the control group.
Case-control studies using MRI scans have shown a narrower intercondylar notch width was associated with a greater risk of ACL rupture (2,3,20). Shelbourne et al. (2) showed an increased association of contralateral ACL rupture in a group with smaller intraoperative notch width measurements. Incorporating arthroscopy further confirms the association between narrower notch width and increased risk of ACL rupture.
Evaluation of the tibial slope angle using lateral plain radiographs indicated that a more inferior-posteriorly directed tibial slope was more associated with patients who had an ACL rupture as compared to the controls (5). Using MRI scans, the lateral and medial tibio-femoral compartments can be measured separately, with Simon et al. (11) showing a significant difference in the lateral tibial slope angle but not the medial slope in patients with ACL rupture. Zeng at al. (10) reported statistically significant differences between steepness of both the lateral and medial tibial slope in the patient groups with ACL rupture.
Further assessment of the articular geometry using cartilaginous landmarks has also revealed potential relationships with the risk of ACL rupture. Sturnick et al. (19) found postero-inferior directed lateral middle and posterior cartilage slope angles were highly associated with the ACL rupture group in female participants. There were significant differences found between sexes in the present study with female participants showing more postero-inferior directed slopes alongside smaller width and height measurements, as seen in Table 3. Higher rates of ACL rupture in women have been evaluated (21) with sex differences in anatomic measurements (smaller notch width alongside more postero-inferior directed tibial and meniscal slopes) being proposed as a causative factor.
Shorter medial meniscus cartilage to cartilage height was the only meniscal measurement that was shown to have a statistically significant relationship with the ACL group. However, Sturnick et al. (19) found that a smaller lateral meniscus cartilage to cartilage height showed the most significant association with the ACL group in women.
Multiple logistic regression was performed to assess the impact of a number of factors on the likelihood of acquiring an ACL rupture of the knee. The model contained 12 independent variables (Table 4). The full model containing all predictors was statistically significant (χ2 = 92.07, P < 0.001), indicating that the model was able to distinguish between patients who were and were not at risk of an ACL rupture. The Hosmer and Lemeshow goodness-of-fit test (P = 0.891) showed no evidence of poor fit and therefore indicated further statistical support in favor of the model. The model as a whole explained between 62.4% (Cox and Snell R square) and 83.4% (Nagelkerke R square) of the variance in ACL status, and correctly classified 92.6% of cases overall (Table 5). As shown in Table 4, six of the independent variables made a unique statistically significant contribution to the model. The strongest predictor of ACL rupture susceptibility was the medial tibial slope angle, recording an odds ratio of 8.97. This indicated that individuals with an increased medial tibial slope were almost nine times more likely to sustain an ACL tear than those with a decreased medial tibial slope angle, controlling for all other factors in the model. The medial tibial slope angle appeared to have a more profound influence than the lateral tibial slope angle in this regard. Other independent variables that displayed an odds ratio above 1 included the lateral tibial slope, the lateral meniscus cartilage-to-cartilage height, and the medial meniscus bone-to-cartilage height.
The clinical applications of the prediction model in defining ACL injury risk are important. First, the ability to inform training regimes and implement preventative strategies for professional athletes who are defined as high risk and modify extrinsic factors (7,15) for ACL rupture would reduce the primary occurrence of such injury. This could take the form of a targeted intervention program but would require MRI screening of asymptomatic athletes that might act as a barrier to its widespread implementation. Furthermore, in routine clinical practice, patients undergoing primary ACL reconstruction surgery or with previous failed ACL reconstruction could be analyzed to identify those at high risk with pathological anatomic geometry of the knee joint and inform changes in surgical management to reduce the risk of further ACL graft re-rupture and subsequent revision surgical interventions. After a first ACL graft re-rupture and certainly after a second ACL graft re-rupture it would be prudent to consider performing an anterior closing wedge proximal tibial osteotomy for slope correction in patients with excessively increased posterior tibial slope as the latter is directly associated with excessively increased anterior tibial translation, which in turn increases the forces propagated through the ACL and ultimately increases the risk of ACL graft failure (22). Further clinical evidence is required to support this notion as an anterior closing wedge proximal tibial osteotomy is a relatively rare but significant surgical intervention.
The present study has some limitations. First, all radiological measurements were taken by one observer; however, previous studies have shown relatively good intraclass correlation coefficients (ICC)—average ICC 0.81 (range = 0.57–0.9) (9) and 0.84 (range = 0.68–0.97) (23)—suggesting that results from one observer are still valid, and not all have used multiple observers (5,8). Second, we noted a difference in age between the ACL group and the control group and this reflects the demographic of younger patients participating in sports-related activities that led to ACL ruptures. The literature has shown that certain anatomical geometry is more greatly associated with ACL rupture and therefore patients with this anatomy are inherently more likely to present with an ACL rupture at any age. We do not expect these risk factors to change significantly with age but the participation in high-level physical activities (more common in younger active patients) in addition to the presence of these anatomic characteristics together will have a synergistic effect in their predisposition of ACL rupture. In this pragmatic clinical study, all the patients in the control group had knee pathology (but an intact ACL) where surgical intervention was indicated and generally this equates to a slightly older cohort of patients than that detailed for a typical patient with an ACL injury. The interpretation of meniscal height measurements may be influenced by the underlying associated pathology given there were individuals with meniscal tears in both groups. Injury to the ACL is often associated with concurrent meniscal tears (24) and meniscal geometry has shown association with risk for injury to the ACL and menisci. Alaqeel et al. (25) showed a reduced meniscal height in patients with ACL rupture compared to controls, whereas Tejani et al. (26) showed an increased height, width, and volume of meniscus in the injured group. It was also noted that a history of trauma was the cause of the ACL injury of all the patients in the ACL group but a history of trauma was not always present in the patients in the control group. The indications for arthroscopy for the control group (e.g. meniscal tears) may mean that these patients have different characteristics to true normal controls.
A major strength of this study was the use of arthroscopy to directly visualize and confirm ACL quality in both the ACL group and the control group. This study clarified previous research findings with the use of two investigations giving greater sensitivity and specificity for identifying patients and controls (27). A further strength is the combination of geometric bone measurements alongside cartilage and soft tissue measurements for generating a predictive risk model. There are limited data utilizing arthroscopically matched controls (6,11); to our knowledge, we present the largest arthroscopically matched dataset that incorporates geometric bone measurements alongside cartilaginous and soft tissue measurements.
In conclusion, this study has shown that patients with arthroscopically and radiologically confirmed ACL ruptures of the knee had significant differences in anatomic geometry compared to the control group. There was also a significant difference in anatomic geometry between men and women. This study has produced an analysis of anatomical variables that could predict a potential increased risk of an ACL rupture utilizing both osseous and soft tissue geometric measurements of the knee joint.
Footnotes
Declaration of conflicting interests
The author(s) declared no potential conflicts of interest with respect to the research, authorship, and/or publication of this article.
Funding
The author(s) received no financial support for the research, authorship, and/or publication of this article.