
Abstract
Background
For the diagnosis of bone marrow edema (BME), spectral computed tomography (CT) has emerged as a promising technique.
Purpose
To study the different performances of spectral CT in the diagnosis of vertebral BME in young and middle-aged versus elderly patients.
Material and Methods
Magnetic resonance imaging (MRI) was used as the gold standard. To determine the existence of BME, spectral CT color-coded images of the vertebral bodies of 82 patients with vertebral compression fractures (VCFs) were visually inspected. A quantitative analysis of the spectral CT vertebral water concentration in the diagnosis of BME was performed using a receiver operating characteristic (ROC) curve. Patients were divided into two groups for comparison: the young and middle-aged group; and the elderly group.
Results
The sensitivity and specificity for visual assessment were 83.7% and 98.3%, respectively, in the young and middle-aged group and 96.8% and 98.2%, respectively, in the elderly group. The elderly group had a higher sensitivity than the young and middle-aged group (P < 0.05). With a threshold of 1046.2 mg/cm3, the ROC curve for the young and middle-aged group displayed an area under the curve (AUC) of 0.870, sensitivity of 86.0%, and specificity of 81.4%. The threshold of 1031.4 mg/cm3 yielded a sensitivity of 95.2% and a specificity of 98.4%, and the AUC of the elderly group was 0.997. The elderly group had a higher level of specificity than the young and middle-aged group (P < 0.05).
Conclusion
Spectral CT can reliably diagnose BME in VCFs, and it performs better in elderly people than in young and middle-aged people.
Introduction
Vertebral compression fractures (VCFs) are frequent axial skeleton injuries, occurring in >30% in adults over the age of 50 years (1,2). VCFs have a particular disability rate and are accompanied by acute or chronic pain. Finding a reliable and efficient diagnostic examination is essential for locating and detecting VCFs, which will allow for the proper management of the condition and the avoidance of any complications is vital (3–5).
An essential tool for identifying and detecting fractures is imaging examinations. For bone injury-related bone marrow edema (BME), MRI is quite sensitive (6). Although it has clear advantages over computed tomography (CT) in the diagnosis of occult bone fractures (7,8), a magnetic resonance imaging (MRI) examination necessitates that the patient hold their body still for a lengthy period of time, which is impossible for those who have just experienced significant trauma (9,10). The X-ray attenuation of human tissues or organs is replaced by the X-ray attenuation of two well-known materials in the material decomposition technique of spectral CT, which can reflect the relative content and changes of material components in human tissues or organs and provide functional information to the human body (11–14). Recently, a few studies have used spectral CT material decomposition technology to analyze BME after spinal and limb joint injuries, demonstrating its great diagnostic efficacy (15–18).
To our knowledge, there is no study evaluating how differing bone ages affect the accuracy of a BME diagnosis by spectral CT. The aim of the present study was to compare the diagnostic performance of visual assessment and quantitative analysis in order to diagnose BME in VCFs in patients of various ages using spectral CT.
Material and Methods
Study population
We identified 89 patients with at least one thoracolumbar fracture who underwent a spectral CT and MRI spinal examination within 48 h between November 2019 and October 2020. Patients with a spinal tumor, spinal infection, severe vertebral body collapse (vertebral body height <4 mm), and after percutaneous vertebroplasty were all excluded from the study (Fig. 1). Finally, we visually evaluated 554 vertebral bodies in 82 patients. A total of 105 vertebral bodies with BME were selected as the case group for the quantitative analysis, while 105 vertebral bodies without BME were selected as the control group. The patients in the control group were chosen using the same criteria for sex and age as the patients in the case group. For a comparison study, the patients were separated into two age groups: the young and middle-aged (<65 years), and the elderly (≥65 years) (19,20). This hospital's institutional review committee approved this study and exempted patients from the requirement for informed consent related to this study.
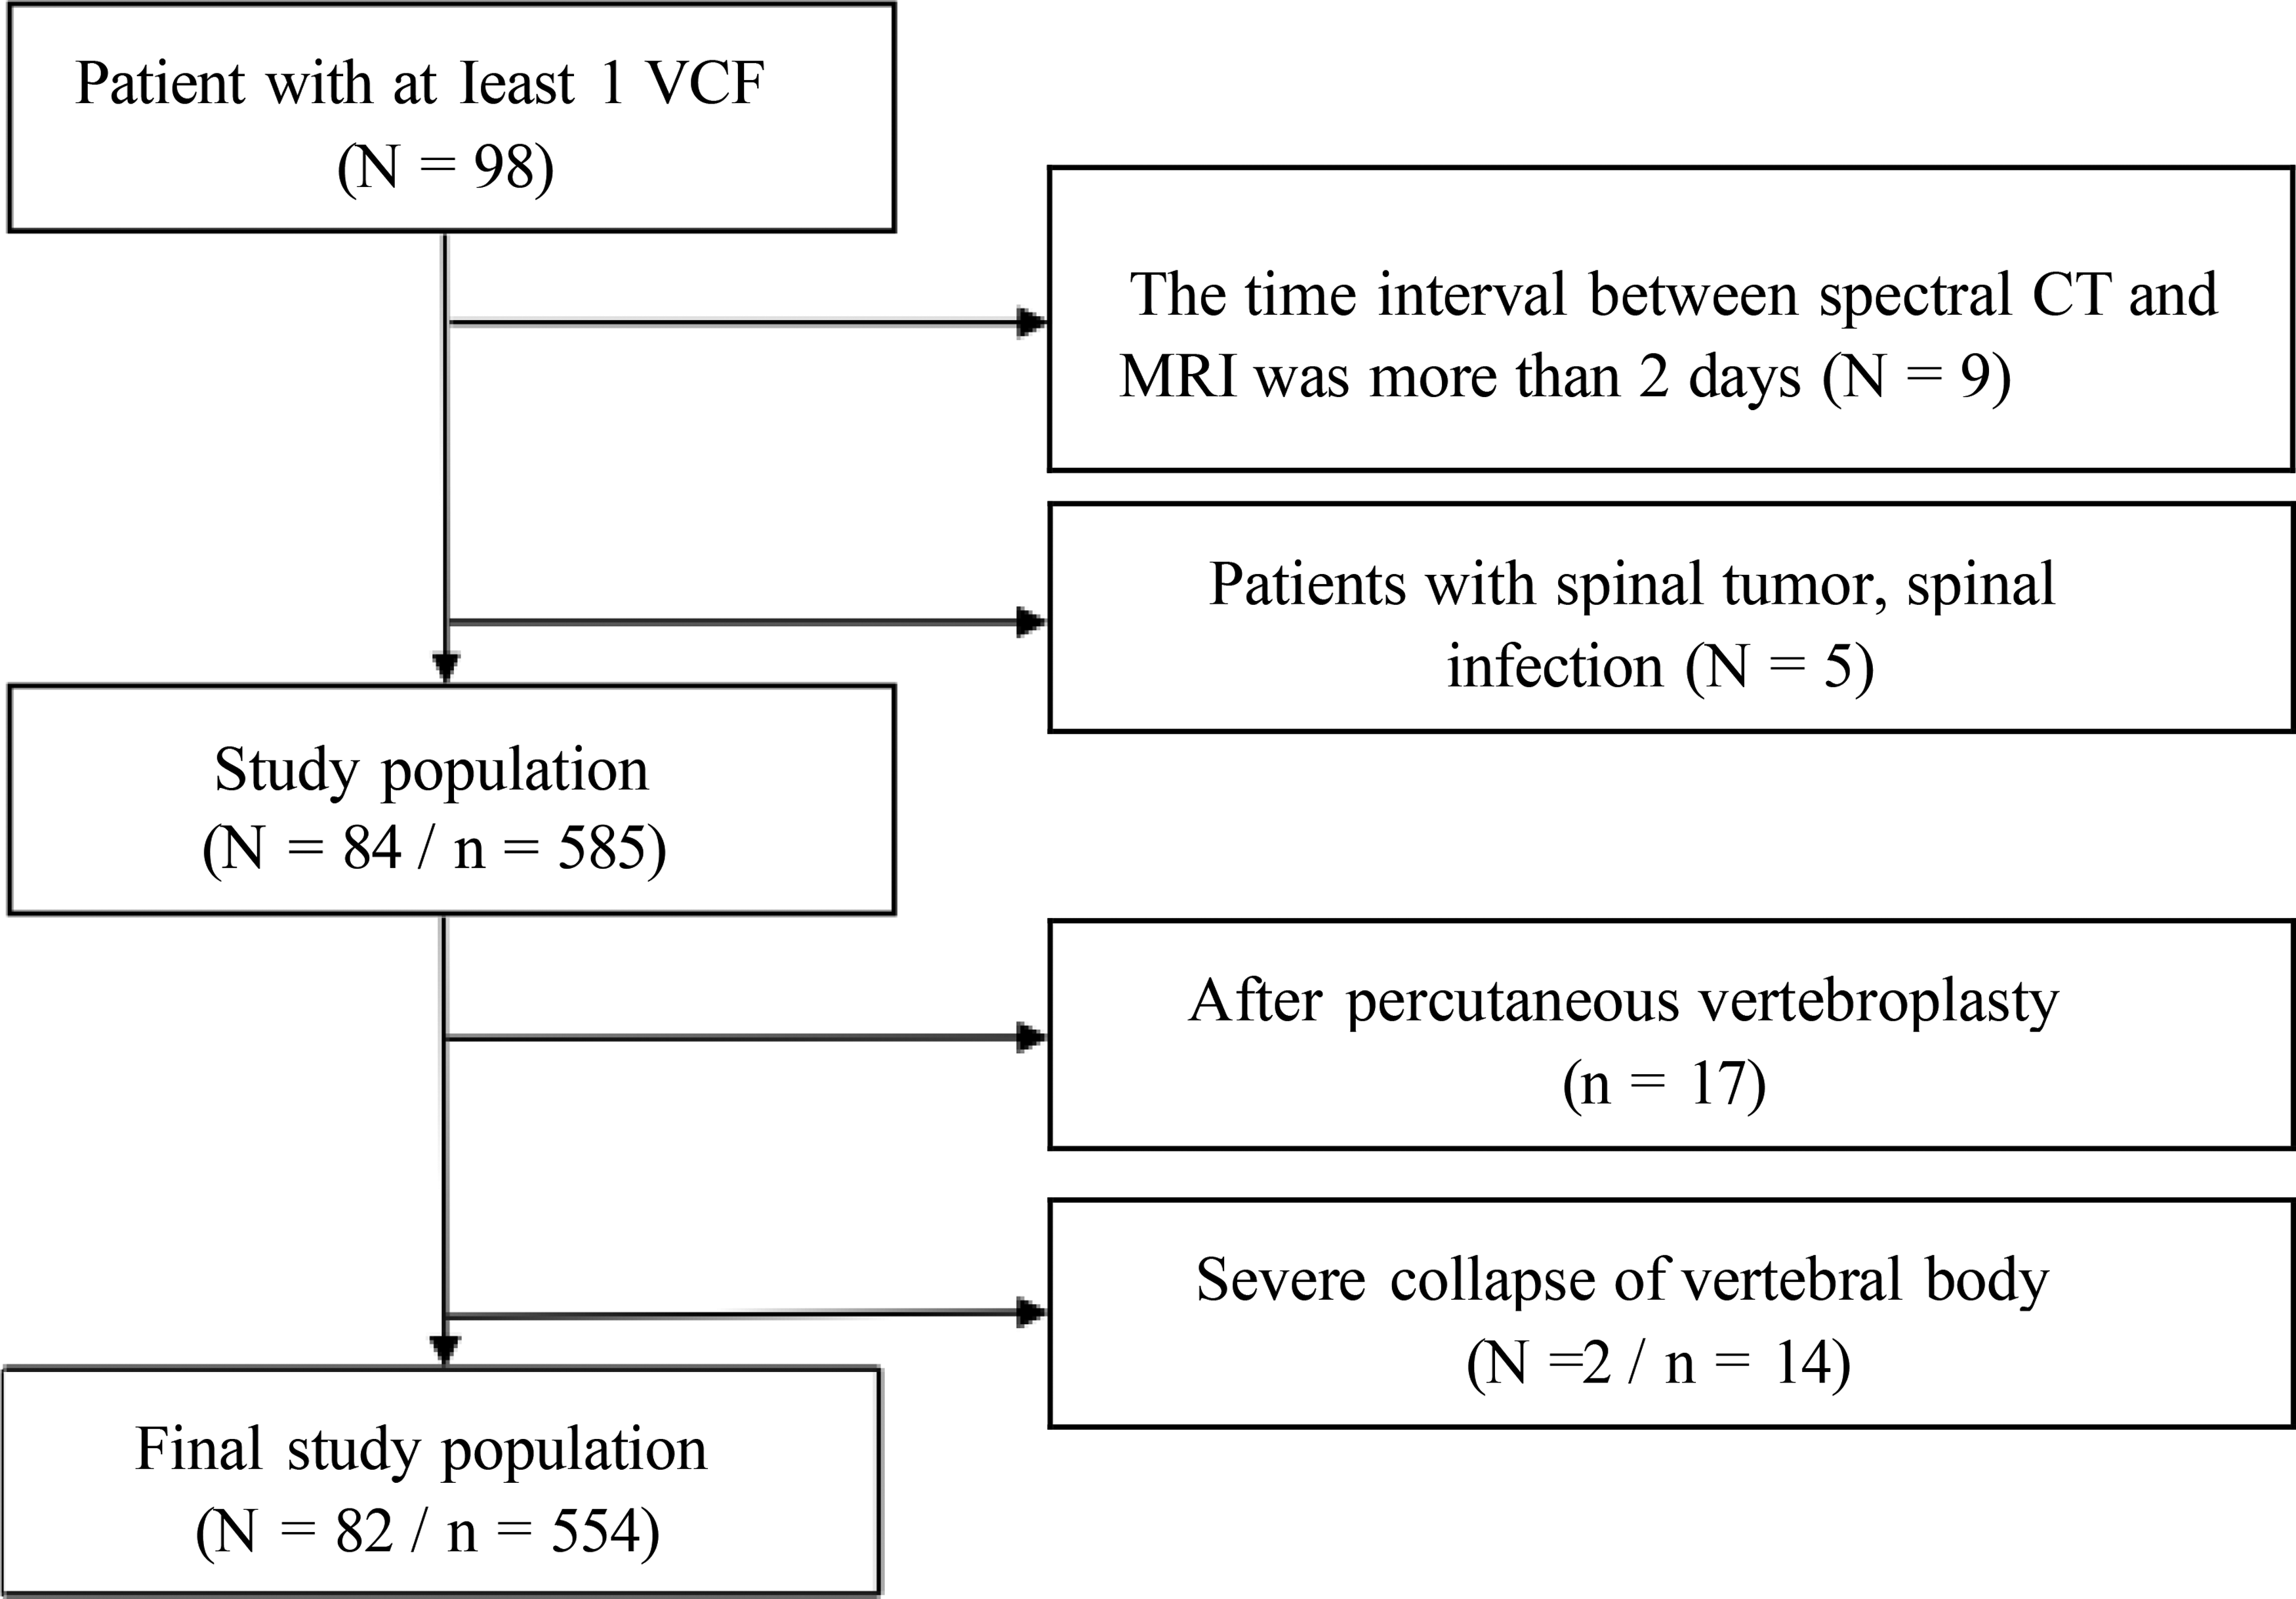
Flow chart showing eligibility criteria of visual assessment. N, number of patients. n, number of vertebral bodies.
Spectral CT protocol
All spectral CT images were obtained using a 256-slice single-source CT scanner (Revolution CT, GE Healthcare, Milwaukee, WI, USA). The imaging parameters included the following: tube voltage = 80/140 kV rapid-kVp-switching; automatic tube current = 250-400 mA; noise index = 14; helical pitch = 0.984:1; speed = 0.50 s/r; slice thickness = 0.625 mm; spacing = 0.625 mm; and 30% pre-adaptive statistical iterative reconstruction-V algorithm (ASIR-V), 50% post-ASIR-V.
MRI protocol
MRI images were captured on a 3.0-T MRI scanner (Philips, Achiva 3.0, Best, Netherlands) with a spinal coil. There were parameters to obtain the sagittal image: T1-weighted fast spin-echo sequence (repetition time [TR] = 500 ms, echo time [TE] = 10 ms, number of excitations [NEX] = 2]; T2-weighted [T2W] fast spin-echo sequence (TR = 2700 ms, TE = 90 ms, NEX = 2); T2W fat-suppressed fast spin-echo sequence (TR = 3000 ms, TE = 60 ms, reversal time = 200 ms, NEX = 2). The above scanning sequence has a slice thickness of 4 mm, a spacing of 0.4 mm, and a matrix of 300 × 210.
Spectral CT image postprocessing
Water–calcium decomposition images were generated using a material decomposition algorithm. Spectral CT color-coded images were generated by fusing water–calcium decomposition images with 70-keV images. On an Advanced Workstation 4.7 (GE Healthcare, Milwaukee, WI, USA) all CT images were reconstructed using an image slice thickness of 1.25 mm and an image slice spacing of 1.25 mm.
Visual assessment
A radiologist with 15 years of diagnostic experience visually assessed MRI images. Using MRI diagnostic standards, BME was identified.
Three radiologists (radiologists 1, 2, and 3 with 3, 10, and 26 years of experience in musculoskeletal imaging) independently and blindly evaluated the spectral CT color-coded images without MRI diagnosis results and clinical information. BME is defined as the presence of visible bone marrow color changes in the vertebral bodies on the color-coded images (0 = no BME, 1 = BME). If there were any discrepancies between radiologists, the group would talk and come to an agreement.
Quantitative analysis
Three radiologists independently selected the regions of interest (ROIs) on the sagittal image of the spectral CT water–calcium decomposition images for the measurement of vertebral water concentration. On the basis of the outcomes of three measurements, the average water concentration of the vertebral body is estimated. According to the MRI images, the ROIs (ROI size = 50.0 mm2) were inserted in the normal vertebral body's anterior and center regions as well as the BME's core region. The vertebral venous plexus, adjacent cortical bone, and regions of sclerotic bone alteration were avoided.
Statistical analysis
Descriptive statistics were used to evaluate the diagnostic efficacy of spectral CT visual assessment. The sensitivity and specificity of visual assessment were compared across age groups using the chi-square test.
The Shapiro–Wilk test or Kolmogorov–Smirnov test was used to determine whether quantitative data were normally distributed, and Levene's test was used to see whether the variance in the data was homogeneous. The formula for continuous variables is expressed as mean ± standard deviation (SD). An independent sample t-test analyzed the differences in water concentration of edematous vertebral bodies and non-edematous vertebral bodies in different age groups. The diagnostic value of vertebral body water concentration in BME of VCFs in various age groups was analyzed by ROC curve in comparison to MRI. The cutoff was established via an analysis of the Jordan index.
For the inter-observer consistency of the quantitative and qualitative data, the intraclass correlation coefficients (ICCs) were calculated.
SPSS version 23.0 software (IBM Corp., Armonk, NY, USA) was used for the statistical evaluation. Statistically significant differences were defined as P < 0.05.
Results
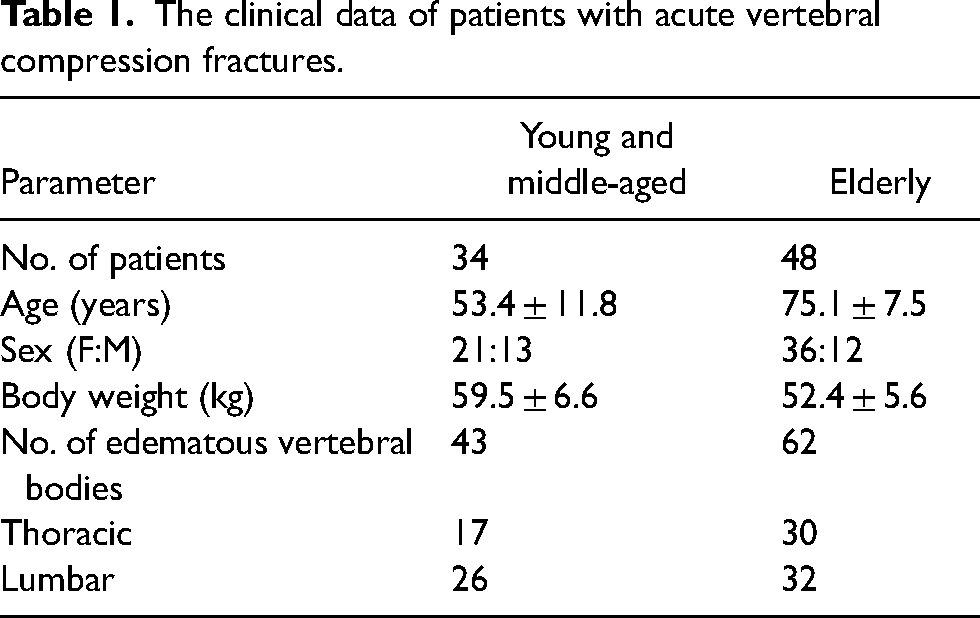
In the case group, there were 82 patients (25 men, 57 women; mean age = 67.1 ± 14.7years; age range = 22–95 years) with VCF. The spectral CT scanning protocol's mean volume CT dose index was 7.96 ± 1.76 mGy (range = 4.41–11.54 mGy). Table 1 provides a summary of the patients’ clinical information. Patients in the control group consisted of 25 men and 57 women (mean age = 66.7 ± 13.2 years; age range = 24–96 years). The spectral CT scanning protocol's mean volume CT dose index was 7.61 ± 2.01 mGy (range = 4.87–12.08 mGy).
The clinical data of patients with acute vertebral compression fractures.
Visual assessment
BME was detected by MRI in 105 of 554 vertebral bodies, including 62 vertebral bodies in the elderly group and 43 vertebral bodies in the young and middle-aged group. Spectral CT showed BME in 104 vertebral bodies, of which 39 were found in the young and middle-aged group and 65 in the elderly group (Fig. 2). The overall inter-observer agreement was 0.967 (P) on spectral CT, indicating an excellent inter-observer agreement. In the young and middle-aged group, spectral CT had a sensitivity of 83.7% (95% confidence interval [CI] = 72.7–94.7) and a specificity of 98.3% (95% CI = 96.4–100.0) for the visual assessment of BME. In the elderly group, sensitivity was 96.8% (95% CI = 92.4–100.0) and specificity was 98.2% (95% CI = 96.8–99.6) (Table 2). In comparison to the young and middle-aged group, the elderly group's visual assessment of vertebral BME had a higher sensitivity (P = 0.046). There was no statistically significant difference in specificity (P = 1.000).
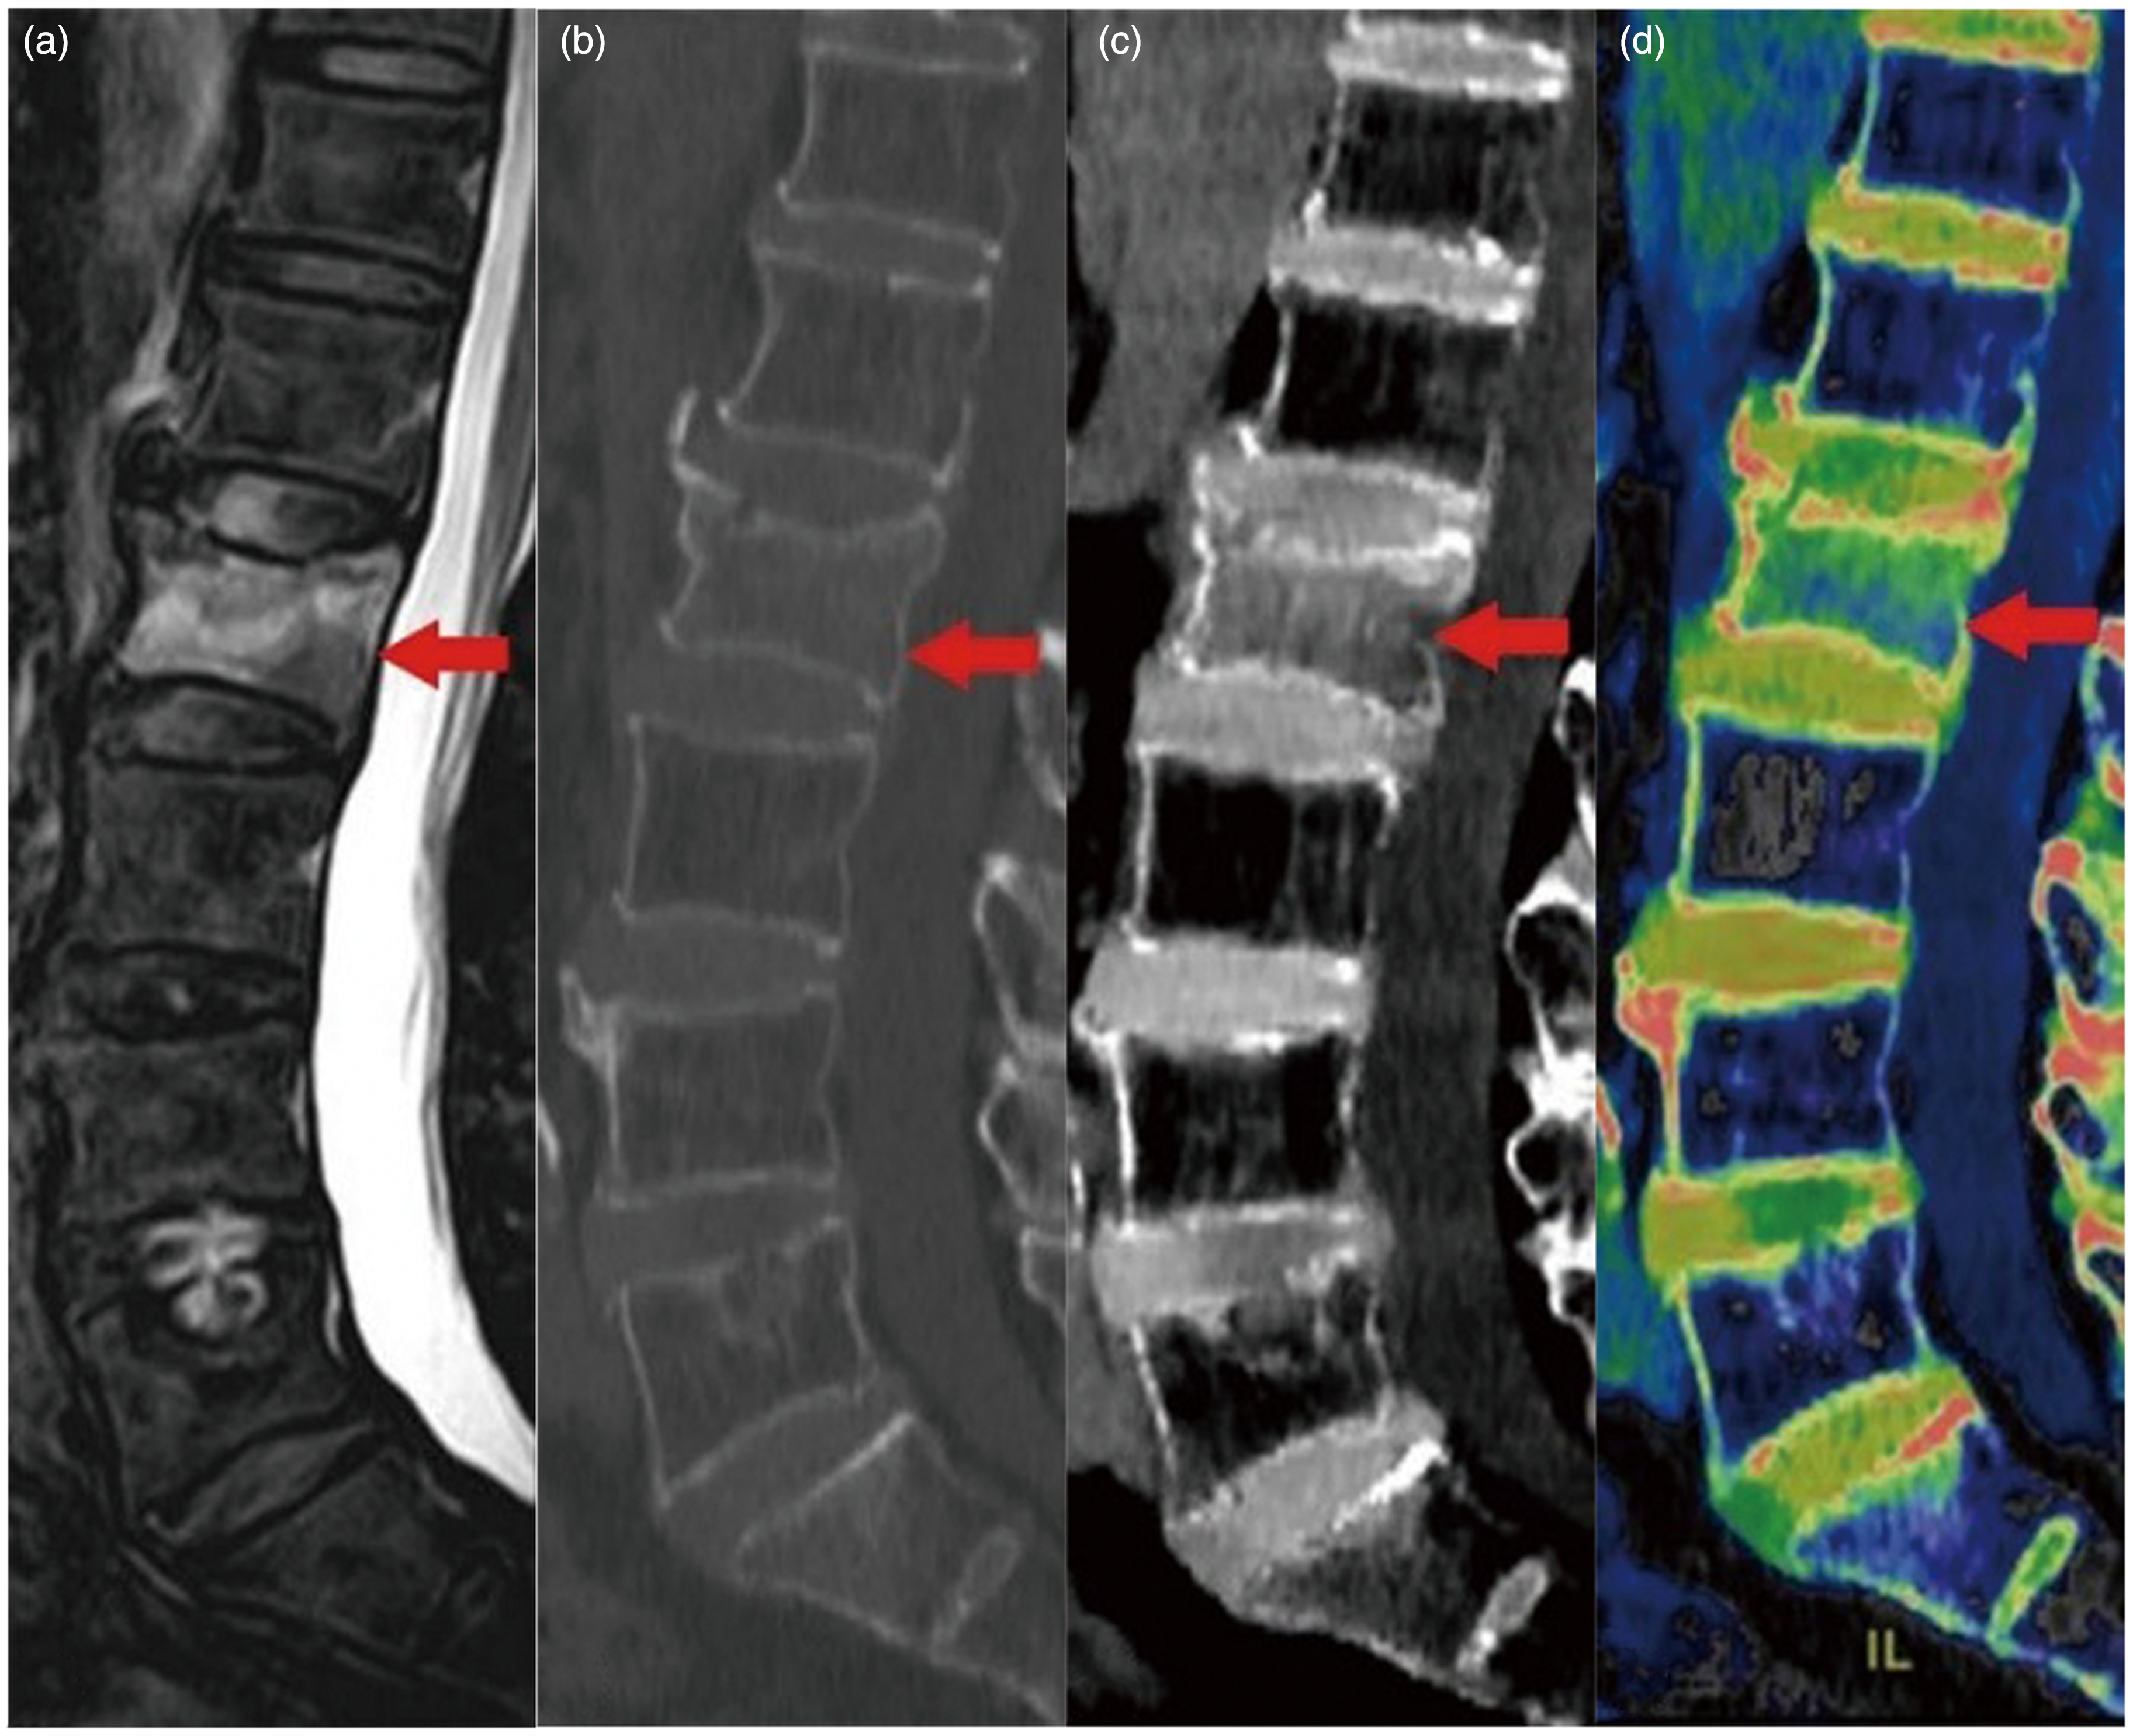
An 83-year-old man with low back pain and limited trunk activity. Imaging examination showed a compression fracture of the L2 vertebral body. (a) Fat-suppressed T2-weighted MRI scan. (b) CT image of 70 keV with bone window settings. (c) Spectral CT water-calcium decomposition image. (d) Spectral CT color-coded image.
Visual assessment of bone marrow edema in vertebral compression fractures on spectral computed tomography color-coded images.
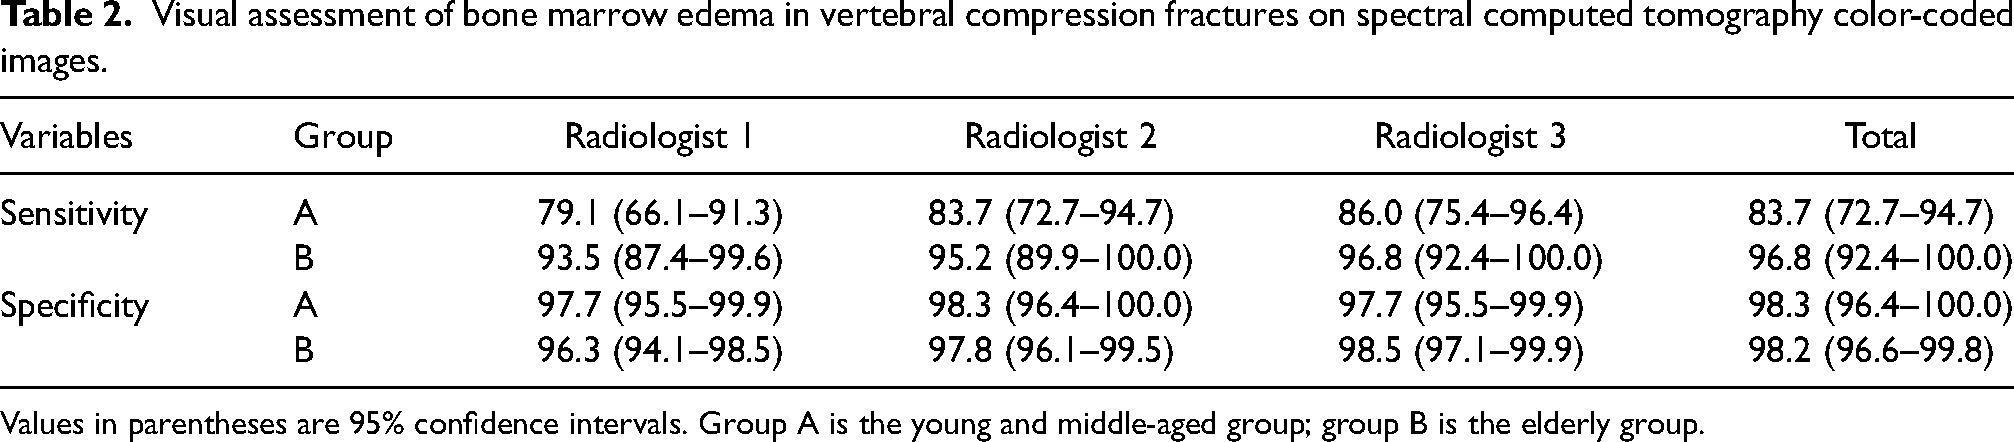
Values in parentheses are 95% confidence intervals. Group A is the young and middle-aged group; group B is the elderly group.
Quantitative analysis
In the young and middle-aged group, the mean water concentration values of the edematous and non-edematous vertebral bodies were 1057.3 ± 13.7 mg/cm3 and 1027.2 ± 21.5 mg/cm3, respectively. The difference was statistically significant (t = −7.8; P < 0.05). In the elderly group, the mean water concentration values of the edematous and non-edematous vertebral bodies were 1045.9 ± 9.4 mg/cm3 and 1003.3 ± 14.0 mg/cm3, respectively (Fig. 3). The difference was statistically significant (t = −19.9; P < 0.05). Between two aged groups, there was a statistically significant difference in the water concentration value of the edematous vertebral bodies (t = 5.1; P < 0.05). In addition, the difference in the non-edematous vertebral bodies’ water concentration value between the two groups was statistically significant (t = 6.9; P < 0.05). The inter-observer reliability measurements were very high (ICC = 0.989) for vertebral water concentration, and inter-observer variations were non-significant (P > 0.05).
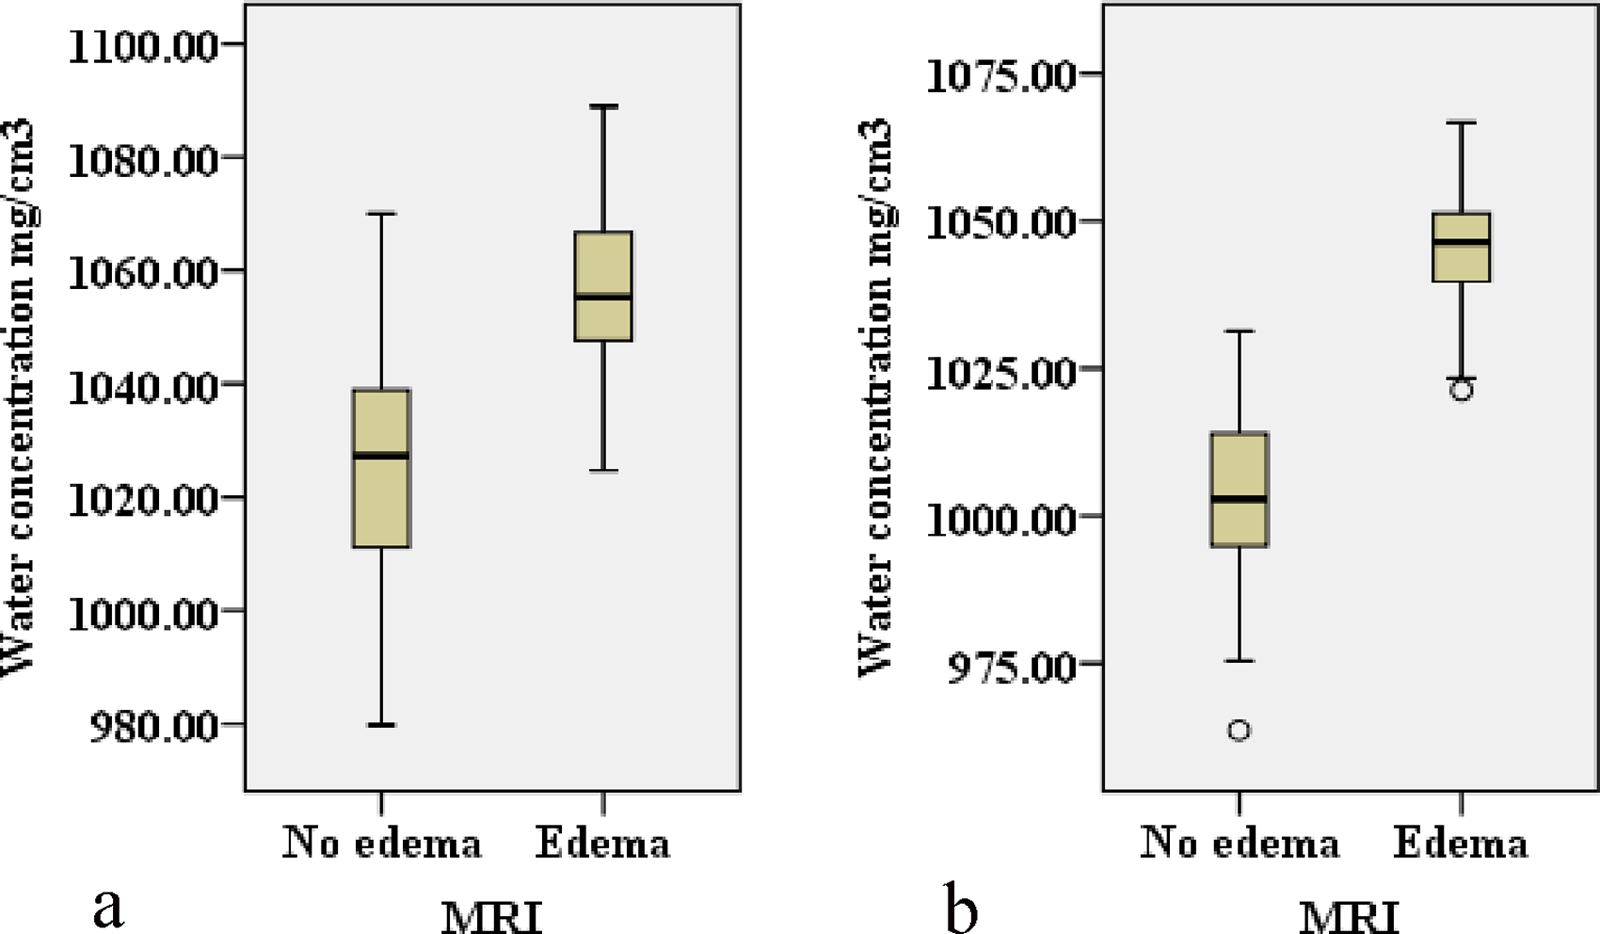
Box plots show the mean water concentration values measured on spectral CT water–calcium decomposition images for differentiating edematous and non-edematous vertebral bodies in (a) the young and middle-aged group and (b) the elderly group.
The ROC curve analysis of the spectral CT vertebral water concentration value revealed an area under the ROC curve (AUC) of 0.870. In the young and middle-aged group, the threshold of 1046.2 mg/cm3 provided a sensitivity of 86.0% (95% CI = 76.0–96.0) and a specificity of 81.4% (95% CI = 69.8–93.0). The threshold of 1031.4 mg/cm3 in the elderly group had an AUC of 0.997, a sensitivity of 95.2% (95% CI = 89.9–100.0), and a specificity of 98.4% (95% CI = 95.3–100.0) (Fig. 4). When compared to the young and middle-aged group, the elderly group's specificity was noticeably higher (P < 0.05). There was no statistically significant difference in sensitivity between the two groups (P > 0.05).
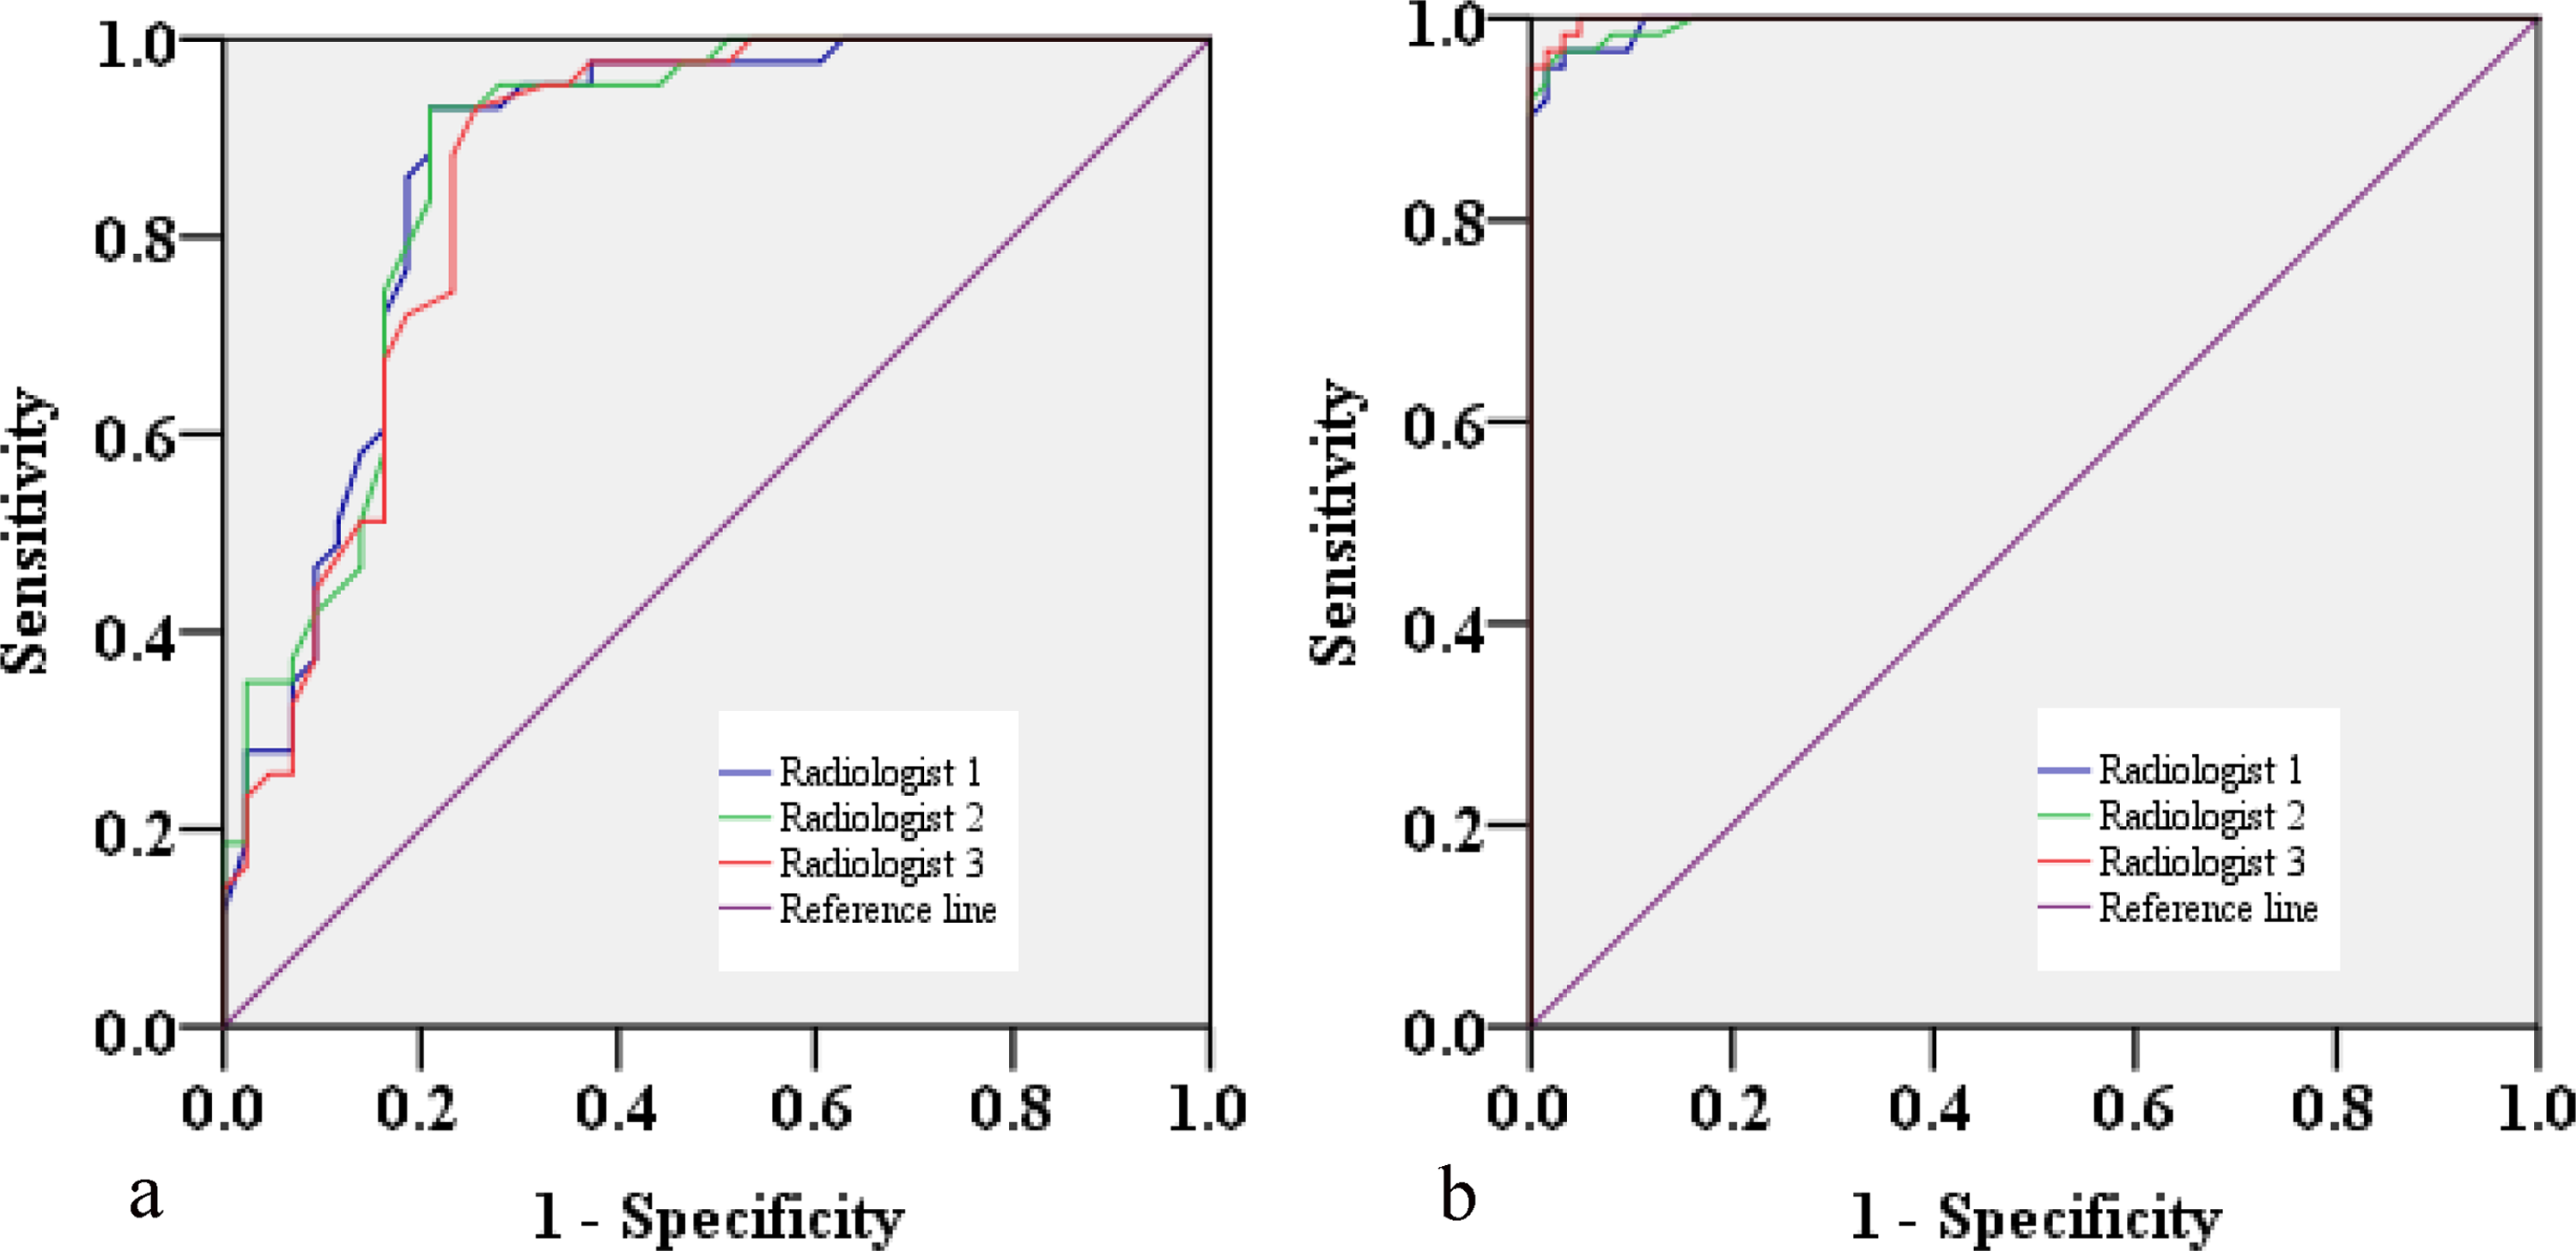
Receiver operating characteristic curves are calculated from vertebral water concentrations on spectral CT water–calcium decomposition images in (a) the young and middle-aged group and (b) the elderly group.
Discussion
In the present study, the human vertebral body's X-ray attenuation was replaced by the mixture of water and calcium, and the BME of the vertebral body through the change in water content was quantitatively and qualitatively analyzed to evaluate its diagnosis in the age groups patients’ performance. We observed that the image noise in Pan's analysis was higher, which may be related to the bone algorithm's use in image reconstruction (16); therefore, in our study, the CT standard algorithm was used in image reconstruction. The water–calcium decomposition image and the 70-keV monoenergetic image were combined in the visual assessment to provide a more intuitive color-coded image (21,22), which distinguished to identify vertebral bodies with BME. In the quantitative analysis, the water concentration values of the vertebral bodies were measured, and the ROC curve was used to determine the threshold for the diagnosis of BME.
Particularly beyond the age of 65 years, the makeup of human bones changes, and the bone mass is rapidly depleted (20). The spectral CT material decomposition images show many forms of the difference in X-ray attenuation brought on by this change. The elderly patients with sparse trabecular bone displayed good contrast in the visual assessment between the non-edematous vertebral bone marrow areas and the X-ray attenuation enhancement areas produced by BME of vertebral bodies after fractures. The distinction between normal bone marrow and edematous bone marrow is not readily obvious in young patients with extensive trabeculae, making the observer's visual assessment challenging. Among the seven cases of false-negative results in the young and middle-aged group, five cases were patients who were aged under 45 years. The sensitivity of the young and middle-aged group was significantly lower than that of the elderly group (83.7% vs. 96.8%). Three subtle fractures were located adjacent to cortical bone, with a mild degree of edema. They were impacted by the cortical bone and the spatial average of the spectral CT material decomposition technology (23,24). The radiologists did not find it. In addition, irregular cancellous bone sclerosis brought on by vertebral healing was seen, producing a false-positive result on spectral CT color-coded images. The elderly group (98.4%) had a significantly higher diagnosis specificity than the young and middle-aged group (81.4%). According to the quantitative analysis, the water concentration of non-edematous vertebral bodies and edematous vertebral bodies in the young and middle-aged group was higher than that in the elderly group (1027.2 ± 21.5 cm3 vs. 1003.3 ± 14.0 cm3) (1057.3 ± 13.7 mg/cm3 vs. 1045.9 ± 9.4 mg/cm3). To effectively avoid the offset effect of varying ages on the research findings, all patients in this study were divided into two groups: the young and middle-aged; and the elderly. This further confirmed the differences in spectral CT performance in the diagnosis of BME in two age groups of patients.
The present study has some limitations. First, these patients, who had an age range of 22–65 years, were part of the young and middle-aged group. Both visual assessment and the diagnostic accuracy of the quantitative analysis were somewhat impacted by the wider age grouping. Second, the patients in our study were only those with benign vertebral compression fractures; further research into the vertebral BME brought on by malignant fractures is still needed. Finally, spectral CT visual assessment is subjective. The influence of proper color-coded image acquisition and familiarity with image data postprocessing operations on observation was more obvious in the young and middle-aged group. The sensitivity of radiologist 3 (86.0%) was higher than that of radiologist 1 (79.1%) (P = 0.394).
In conclusion, the method used in spectral CT material decomposition technology demonstrated a reliable diagnostic effectiveness in diagnosing BME in VCFs. In comparison to young and middle-aged people, elderly people have better visual assessment and quantitative analysis of BME in VCFs. The additional grouping might enhance the diagnostic diagnosis of vertebral BME using spectral CT material decomposition technology. In comparison to traditional CT, spectral CT offers additional diagnostic parameters, more intuitive and clear visual assessment images, and has a good clinical feasibility for the diagnosis of vertebral BME.
Footnotes
Declaration of conflicting interests
The author(s) declared no potential conflicts of interest with respect to the research, authorship, and/or publication of this article.
Funding
The author(s) received no financial support for the research, authorship, and/or publication of this article.