
Abstract
Comparing the degree of urbanity in different countries is not a straightforward task. This research note discusses various statistical agencies’ measures of urbanity and shows how comparisons of Nordic countries depend on the measure used. The multitude of measures and urbanity definitions makes it difficult to draw clear-cut conclusions about urbanity differences between countries, and hence about the effects of, for instance, different regional policies in the Nordic countries.
From the busy city centers of Copenhagen and Stockholm to the most remote parts of Northern Iceland or the deep Finnish forests—people in the Nordics live in a wide range of different geographical contexts, some more urban and densely populated than others. However, there is no universal understanding of how to measure such cross-country differences in urbanity. For decades, the research literature has discussed how to define urban areas, without reaching a broadly shared agreement on this issue (Brenner and Schmid 2014; Taubenböck et al. 2022; Van Migerode et al. 2024).
Still, statistics on populations by urbanity are widely used by policymakers and researchers. Rural-urban differences can be considered one of society’s main dividing lines, and increased rural-urban polarization has caused concern (Brown and Mettler 2024). In regional research and regional policies, the share of the population living in areas of different urbanity is interesting in itself, as are socioeconomic differences between rural and urban populations, which again can be used as arguments for increased political attention (and economic support) targeted at specific areas.
Many countries have active policies in place to reduce differences between urban and rural areas, and/or to maintain settlements in rural areas. Data on different countries’ urban and rural populations can be used to evaluate such policies. Moreover, information about different countries’ share of area used for urban settlements is useful for comparing preservation policies and in ecosystem accounts (Babí Almenar et al. 2025; Moll et al. 2019). Definitions in this field can have direct policy relevance and economic consequences, exemplified by a discussion in the Norwegian parliament in 2025 on whether different definitions of “urban settlements” in Sweden and Norway could lead to different costs of implementing EU’s requirements for wastewater treatment in such settlements (Stortinget 2025).
Several sources, relatively easily available for policymakers, researchers, and media, provide information on countries’ populations by urbanity. They tend to differ, both in how they define urbanity and in how comparable their data are between countries. Hence, the choice of source may affect the validity of any conclusions drawn about cross-country differences in urbanity.
This research note explores how these differences between sources may play out in practice. It examines some of the main sources of statistical data on urbanity, using the Nordic countries (Denmark, Finland, Iceland, Norway, and Sweden) as case. These countries all have high-quality register data which are well documented and publicly available. They also have different geographies, population distributions, and different regional policies, making them ideal for investigating how different urbanity measures can lead to different conclusions about differences in urbanity between the Nordic countries. The data presented in this research note are taken from online databases, either from international agencies or from the Nordic statistical offices (in addition, a typology by Nordregio is also discussed). Along with a presentation of the different agencies’ measures of urbanity, results from each agency are used to show how the Nordic countries can be ranked according to this data source. In the last part of the paper, the main findings are discussed and compared, and recommendations are provided for policymakers, researchers, and statistical agencies.
1. Different Agencies, Different Urbanity Measures
The international research literature has not agreed on how to define “urbanity.” A myriad of metrics exist, and there is no agreement neither on methods nor on thresholds/criteria for defining an area as urban (Angel et al. 2018; Moll et al. 2019; Van Migerode et al. 2024). The general classifications of “the urban” and “the rural” have been criticized for being arbitrary (Taubenböck et al. 2022). Even the claim that we live in an “urban age” has been challenged, partly due to the lack of a standardized definition of the urban unit (Brenner and Schmid 2014).
Urbanity may be measured in several ways. It may rely on formal decisions (such as city status), it may be based on characteristics of the built environment and building types, it may determine urbanity from a place’s economic/administrative functions, and/or from its population size and population density. The measure can define a municipality or another administrative unit, or it can define areas such as 1 km2 grid cells, or a mix of these methods. The data used to define urbanity can also differ markedly, and recent years have seen a surge in new data and methods used in this field, for instance using remote sensing and machine learning (Melchiorri et al. 2018; Van Migerode et al. 2024). Previous research has shown that conclusions about rural-urban differences do depend on the urbanity measure used, for instance regarding population aging (Klimanek and Filas-Przybył 2020), and that some types of regions are more sensitive to changes in urbanity definitions than others (Van Migerode et al. 2024).
The focus in this research note is mostly on measures related to population and population density. It investigates data on urbanization/settlements from three international agencies—the United Nations Population Division, OECD, and Eurostat—as well as from each of the five national statistical offices in the Nordic countries and from the research institute Nordregio. The methodologies used in these data sources differ noticeably. Below, each of these sources and their conclusions about urbanity in the Nordic countries are presented, and the strengths and weaknesses of each source are discussed.
1.1. United Nations
For several decades, the United Nations Population Division has published estimates of the urban and rural populations of all countries in the world. This is the source of the well-established notion that more than half of the world’s population now lives in cities (Brenner and Schmid 2014). The most recent version is the 2018 Revision; the next update is planned for October 2025 (United Nations 2024b). In these estimates, the populations of countries or world regions are divided into “urban” or “rural,” with time series provided back to 1950. Figure 1 presents the UN estimates for the Nordic countries.
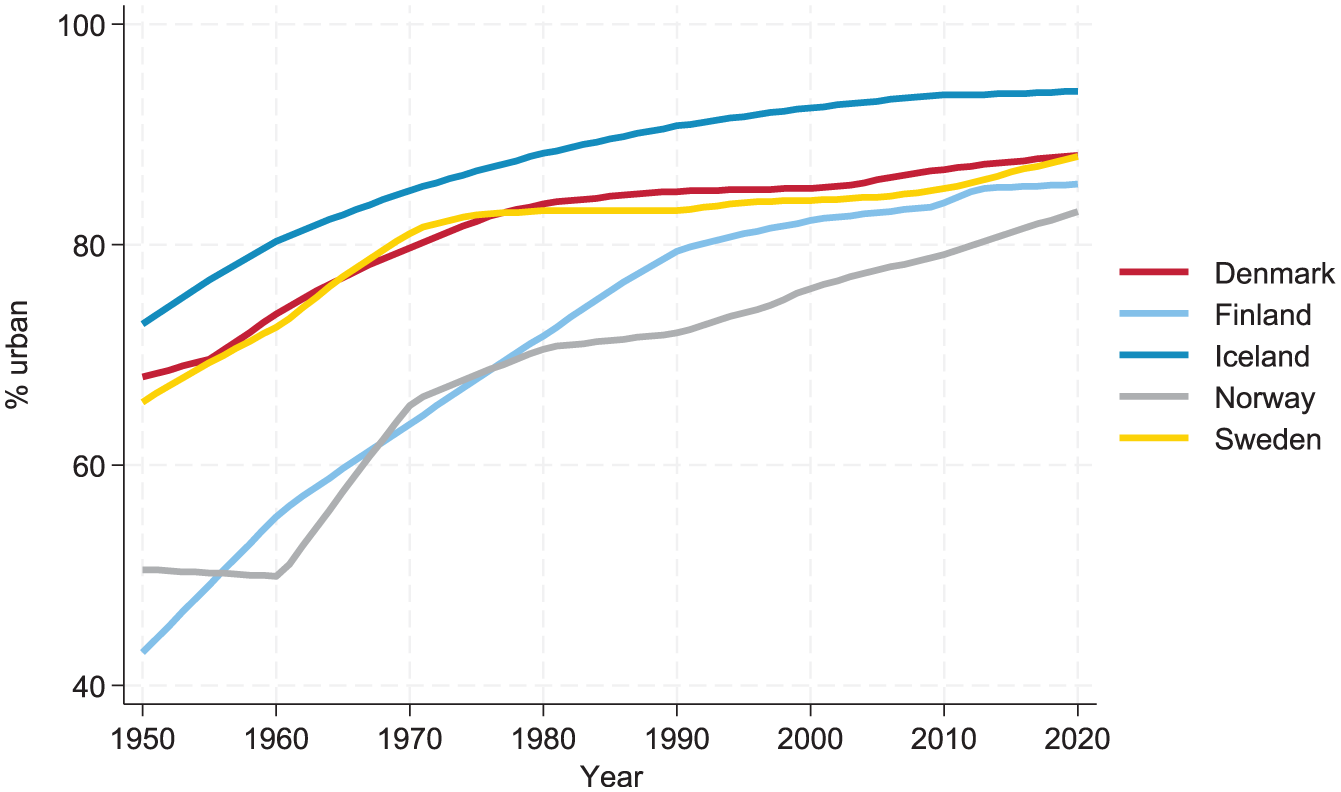
Percentage of the Nordic countries’ mid-year populations residing in urban areas, 1950 to 2020, according to United Nations.
According to these results, Iceland stands out as the most urbanized Nordic country, throughout the period, whereas the Norwegian population is the least urban.
However, “urban” is not necessarily identically defined in all these countries. Instead, UN states that their numbers are based on the definitions which are used in each country (United Nations 2024b). These definitions are generally those used by national statistical offices in the latest available census. For the Nordic countries, the definitions are relatively similar, but not completely (United Nations 2024a). For Iceland, Denmark, and Norway, the UN states that “urban” is defined as “Localities with 200 inhabitants or more.” This is also the case for Sweden, with the additional information that “houses are at most 200 m apart.” For Finland, on the other hand, the estimates show the share of population living in “Communes officially designated as urban.”
1.1.1. Strengths and Weaknesses
The UN’s World Urbanization Prospects is not only the most widely used measure of global urbanity, it is probably also the most widely criticized urbanity measure. One main criticism regards the fact that the UN does not have its own definition of urbanity and rurality but relies on each country’s own definitions and cut-off values, which may differ substantially between countries (Brenner and Schmid 2014; Taubenböck et al. 2022). This is referred to as “state-istics” by critics (Taubenböck et al. 2022). One study using more advanced methods and consistent definitions across countries finds that the global population is substantially more urbanized than the UN figures suggest (Melchiorri et al. 2018), although these results have been contested (Angel et al. 2018).
On the other hand, the UN estimates are easily available online, the methodology is fairly transparent, and relying on national definitions of urbanity may be less costly than preparing new estimates for each country. Moreover, the UN provides data for all countries, and long time series, and despite its shortcomings it is still the main source for urbanization analysis due to the scarcity of alternative sources (Melchiorri et al. 2018).
1.2. OECD
The Organisation for Economic Co-operation and Development (OECD) also publishes data using an urban-rural typology, with three main types of regions: predominantly urban, intermediate, or predominantly rural regions (OECD 2011). Moreover, the OECD also provides data based on a typology on peoples’ access to cities (i.e., functional urban areas, FUAs) of different sizes. The OECD results for the Nordic countries are shown in Figure 2.
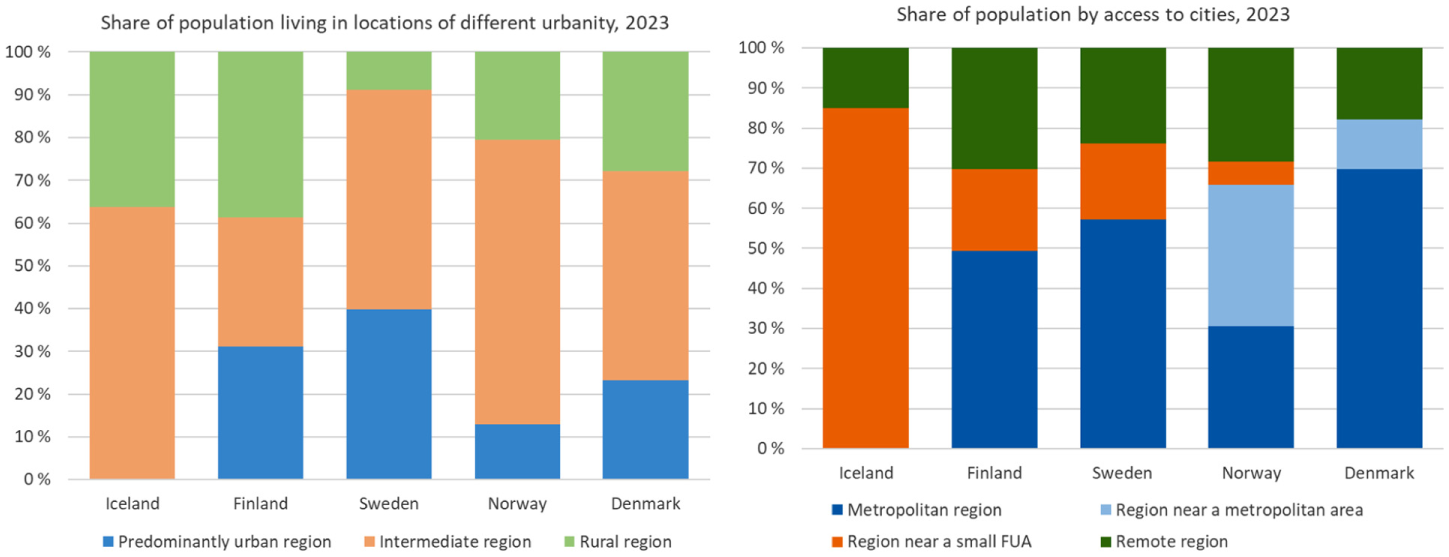
Percentage of the Nordic countries’ populations residing in TL3 regions (counties) with different degrees of urbanity (left) and with different proximity to a city (right), 2023. Data from OECD.
The left panel in Figure 2 shows the percentage living in the OECD’s three types of regions. Unlike in the UN data, Sweden now stands out as the most urban Nordic country, both regarding the population shares in the predominantly urban regions and in the combined shares for the predominantly urban and intermediate regions. On the other side, Finland and—completely opposed to the UN data: Iceland—stand out as the countries with the highest population shares in rural regions. In the metadata of these statistics, the OECD states that “This typology remains of interest for users, although the Access to City typology is now the one used by OECD analysts” (OECD 2024). The right panel of Figure 2 shows data for the Nordic countries for this latter typology, which offers somewhat different conclusions: Iceland still appears as the least rural Nordic country (if “remote region” is used as an indicator of rurality). The OECD’s definition of “metropolitan areas” includes areas with a population of 250,000 or more, which excludes Iceland from this category; the Reykjavik urban settlement has about 135,000 inhabitants (Statistics Iceland 2024). Moreover, according to this typology Denmark is the most urbanized Nordic country, with more than eight in ten living in regions in or near a metropolitan area.
1.2.1. Strengths and Weaknesses
The OECD data is relatively easily available online, however it covers only a handful of countries outside the OECD. Furthermore, even for OECD countries such as the Nordics, the OECD does not provide data for all the urbanity categories—for instance, there are no data on Sweden’s and Finland’s populations in regions near a metropolitan area, or on Denmark’s population in regions near a small functional urban area. This limits the comparability across countries. Moreover, the regions used in both of these OECD statistics are on the TL3 level, which for the Nordic countries means the county level (OECD 2025). These are relatively large regions, and their different sizes and different compositions of rural-urban populations, both between and within the Nordic countries, may very likely bias the results shown in Figure 2.
1.3. Eurostat (DEGURBA)
To make urban-rural statistics more comparable across countries, six international organizations have developed a definition of cities, towns, and rural areas known as the Degree of Urbanization (DEGURBA) classification, which can be applied in all countries, using the same definitions across the globe (EU/FAO/UN-Habitat/OECD/The World Bank 2021).
The first step in the basic form of this methodology is to construct a grid of 1 km2 cells. Based on information about each cell’s population size, as well as information about nearby cells, each 1 km2 cell is assigned to one of three types of population clusters: (i) an urban center (high-density cluster), which has at least 1,500 inhabitants per km2 and where the total cluster has 50,000 inhabitants or more, (ii) an urban cluster (moderate density cluster), which has at least 300 inhabitants per km2 and where the total cluster has at least 5,000 inhabitants, or (iii) rural grid cells (mostly low-density cells), which are cells not identified as urban centers or urban clusters.
In the second step—when all 1 km2 grid cells are classified into these three population clusters—other spatial units (often municipalities) are classified as either cities, towns/suburbs, or rural areas, based on which type of population cluster dominates within this unit. The classification in this second step allows adding more information to an analysis on urban-rural differences, since other relevant data are often only available on—say—the municipality level. Cities (or densely populated areas) are defined as units where at least 50% of the population live in grid cells classified as urban centers. Towns/suburbs (or semi-urban areas/semi-dense areas/intermediate density areas) are units where less than 50% of the population live in grid cells classified as urban centers and less than 50% of the population live in rural grid cells. Rural areas (or thinly populated areas) are units where more than 50% of the population live in rural grid cells. According to this classification, “urban areas” consist of cities plus towns/suburbs/semi-dense areas. However, the authors recommend reporting indicators for all three classes, because towns/suburbs/semi-dense areas may differ significantly from both cities and from rural areas (EU/FAO/UN-Habitat/OECD/The World Bank 2021).
Eurostat, the statistical office of the European Union, now publishes several statistics—including labor market statistics—using this DEGURBA classification (Eurostat 2022, 2024). When the Nordic countries are ranked according to these statistics, using data for 2023 (Figure 3), Iceland is the most urbanized country—as in the UN data—with almost 80% of its population in municipalities classified as cities or towns/suburbs/semi-dense areas. Figure 3 also distinguishes cities (dark blue) from towns/suburbs/semi-dense areas (orange), and Iceland stands out with almost two in three of the adult population living in cities, far more than in any other Nordic country.
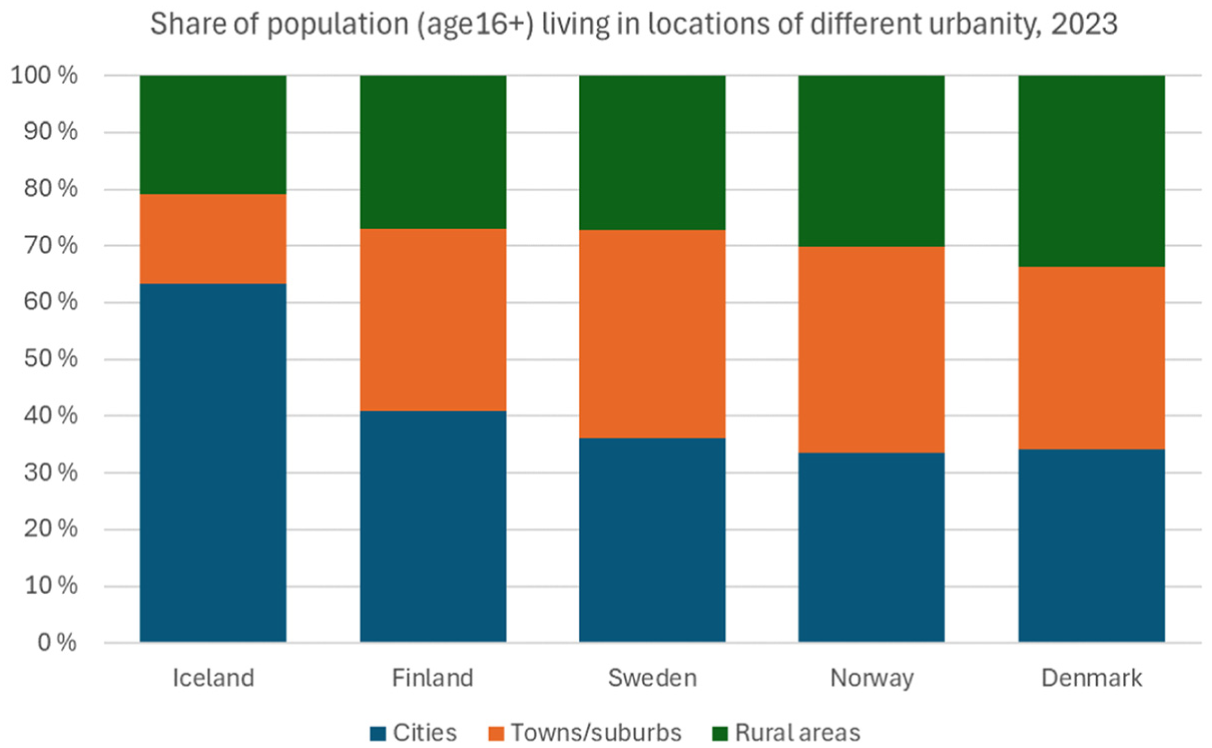
Share of Nordic countries’ population living in locations with different degrees of urbanity, 2023. Data from Eurostat, using the DEGURBA classification.
However, unlike in the UN data, Finland ranks as the second most urbanized Nordic country when using these Eurostat figures. At the other end of the continuum, and again unlike the UN results, Denmark ranks as the least urbanized country in 2023, with only 66% of the population in municipalities classified as cities or towns/suburbs/semi-dense areas.
1.3.1. Strengths and Weaknesses
The DEGURBA classification is developed to ensure international comparability, and the possibility for cross-country comparisons is a definite strength. One advantage of having the 1 km2 grid cells as its foundation, is that this reduces the bias that may arise from using spatial units with different shapes and sizes as starting points (known as the modifiable areal unit problem (Openshaw 1984)). However, when these grid cells are used to classify spatial units such as municipalities, which have different shapes and sizes, this problem is not entirely solved (EU/FAO/UN-Habitat/OECD/The World Bank 2021). For the Nordics, the number of municipalities—as well as the municipalities’ median area and number of inhabitants—varies considerably across the countries. Denmark stands out with municipalities that are considerably smaller in area, but with a larger median population than all the other Nordic countries. The fact that the municipalities’ area and population size differ in this way may affect the results, however the direction of this bias is not obvious. On the one hand, large municipalities classified as cities may include a substantial rural population outside the urban cluster(s). On the other hand, large municipalities classified as rural may contain urban centers and still be classified as rural if more than 50% of the population live in rural grid cells. Hence, the authors behind the DEGURBA methodology recommend using small spatial units to obtain a closer match between the types of grid cells and the classification of a spatial unit (EU/FAO/UN-Habitat/OECD/The World Bank 2021). Another critics of the DEGURBA has been presented in a recent study, where Van Migerode et al. (2024) assert that these urban delineations, which were initially designed for European settlements, may be less appropriate for settlements in other parts of the world.
1.4. The Nordic National Statistical Agencies
All the national statistical agencies in the Nordic countries publish data on urban settlements and the population living in such settlements. This includes information about the population sizes of the settlements, as shown in Figure 4. In the figure, “cities” are defined as urban settlements with more than 50,000 inhabitants, whereas “towns” have 5,000 to 50,000 inhabitants (ESPON 2013). The right panel of the figure has a more detailed grouping than the left panel.
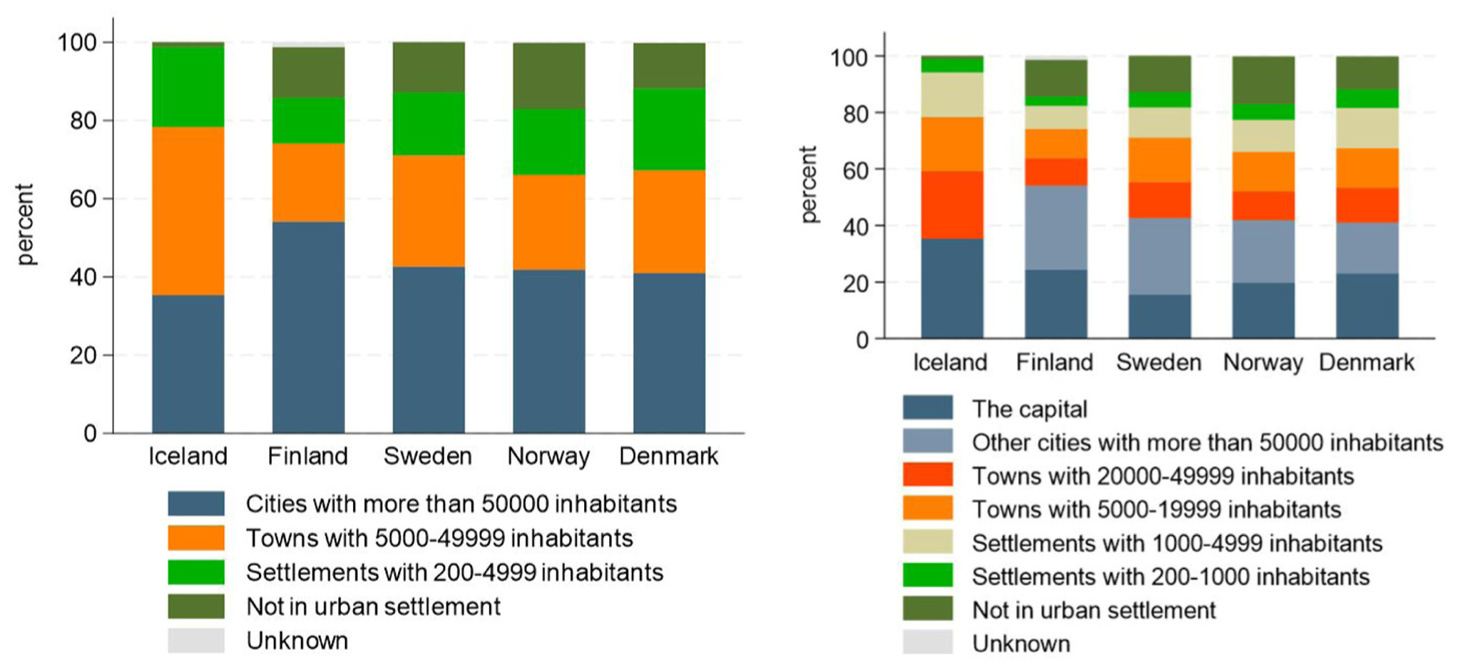
Share of Nordic countries’ populations living in urban settlements of different sizes, 2023/2024. Larger (left) and more detailed (right) grouping of settlements by number of inhabitants.
If the data in Figure 4 were produced in the exact same way in all the Nordic countries, we could conclude from these figures that Iceland is the most urban country in the Nordics, if urbanity is measured as the share of the population living in cities or towns with 5,000 inhabitants or more, whereas Finland has a higher share of the population living in cities with 50,000 inhabitants or more. Again, Norway and Denmark have the lowest population shares in cities and towns.
However, the data shown in Figure 4 are not produced in the exact same way in all the Nordic countries. Due to somewhat different definitions, the results are not completely comparable.
The Nordic countries have a well-established tradition of cooperation on statistical matters, and already in 1960, the countries agreed on a common definition for urban settlements, defined as an area with at least 200 inhabitants and at most 200 m between buildings. Today, Sweden, Norway, Finland, and Denmark still adhere to the rule that an urban area has at least 200 inhabitants. However, distances between buildings and other criteria in the definitions vary between the countries (Statistiska centralbyrån 2021). For example, in a sparsely populated area with only one population cluster, the Norwegian definition would include in this cluster all buildings that are a maximum of 50 m apart from each other (Statistics Norway 2024), whereas the Swedish definition permits a maximum of 150 m between buildings (Statistiska centralbyrån 2021, 2022), which would include a larger area (and a larger population) than the Norwegian definition. The Finnish and Danish definitions include buildings that are up to 200 m apart, possibly including an even larger area and population in their urban settlements (Danmarks Statistik 2024; Statistics Finland 2024). The Icelandic definition also uses the 200 m mutual distance, but additionally draws a 400 m zone around the urban nuclei (Statistics Iceland 2024). Hence, in this example, the Icelandic definition would result in the largest urban settlement (and hence, the lowest rural population share) compared with the other definitions, and the Norwegian definition would result in the lowest urban population share. In an example with several population clusters scattered nearby each other, comparing the definitions is more complicated, since the Norwegian definition allows for expanding the urban settlement to cover smaller clusters of houses (with at least five commercial or residential buildings) up to a distance of 400 m from the urban core, and the Swedish definition allows for merging urban clusters that are connected by road and less than a maximum of 500 m apart (this distance depends on the population size in the clusters). In addition, there are also some nuances in how the different definitions treat non-populated spaces like urban parks, roads, schools, business buildings, and sports arenas, and to what extent they permit urban settlements to cross municipal borders.
1.4.1. Strengths and Weaknesses
The five Nordic statistical offices provide quite detailed data on urban settlements of different sizes, focusing on the actual settlements rather than the municipalities. This allows users to compare the share of the population living in settlements of varying sizes, offering a more fine-grained type of urbanity than the other sources, and making it possible to use different thresholds for “urbanity.” The capital settlement can also be singled out as a separate urban settlement, which allows for analysis of the capital’s role. However, the statistical offices do not apply the exact same definitions when preparing their statistics on urban settlements, making it challenging to draw firm conclusions on how much of the observed differences are due to methodological issues.
1.5. Nordregio’s Territorial Typology
Taking advantage of the rich Nordic data, the research institute Nordregio has recently developed a grid-based typology that classifies all Nordic territories into seven different classes based on different degrees of urbanity and rurality. The main purpose of this typology is to provide a more nuanced and fine-grained understanding of territorial differences across the Nordic countries, and the classification makes it possible to reveal territorial diversities also within municipalities. The starting points in this typology are 1 km2 grid cells, which are classified as either “inner urban area,”“outer urban area,”“peri-urban area,”“rural area close to urban area,”“local center in urban area,”“rural heartland,” or “sparsely populated urban area.” Hence, this typology considers the size and density of each settlement and also classifies grid cells by their proximity to larger urban areas.
The report from this work (Stjernberg et al. 2024) was published in 2024, with a figure showing each country’s population share in each of the seven classes. Figure 5 displays these shares.
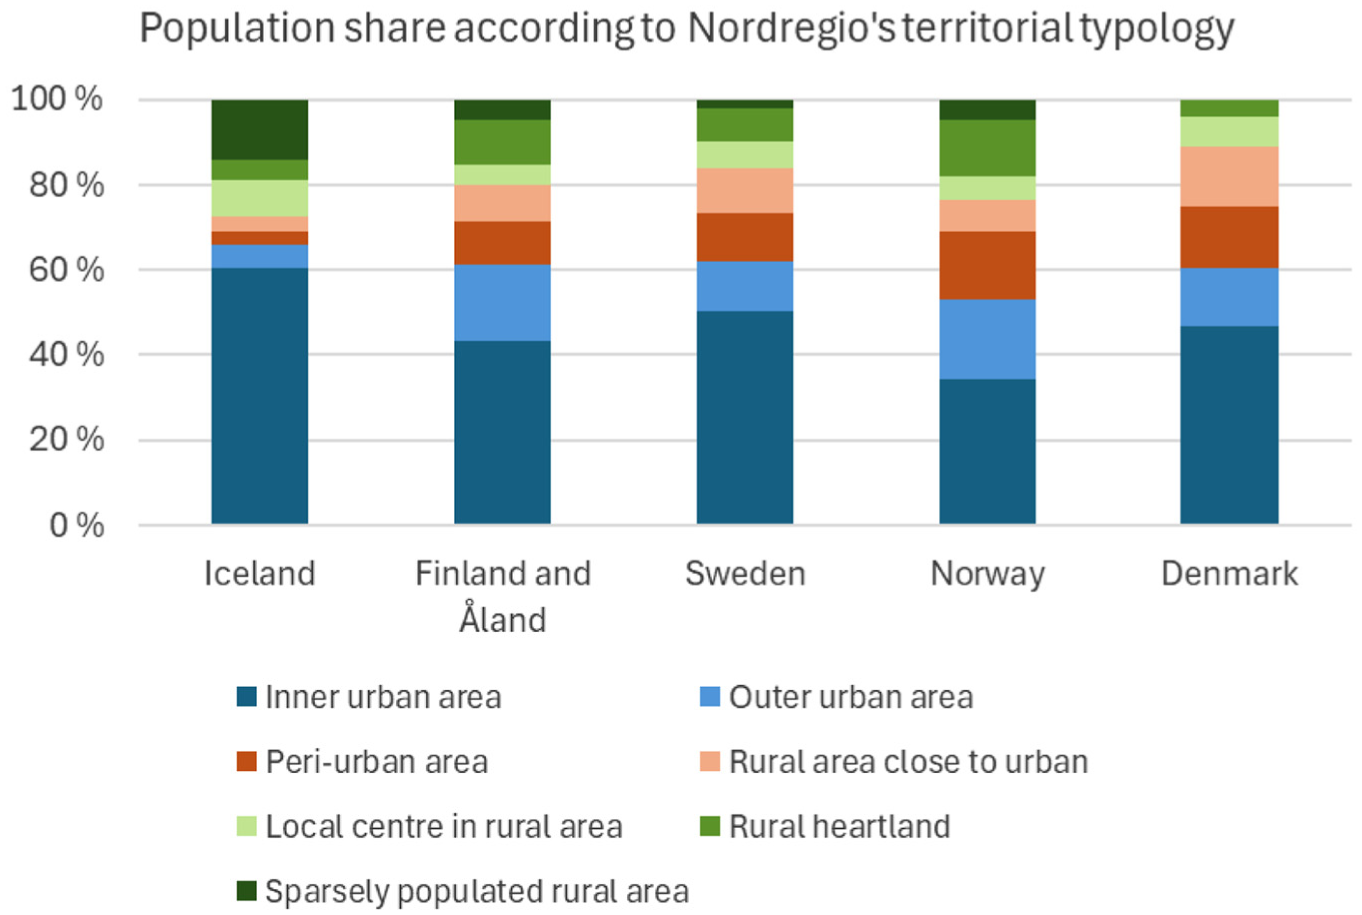
Share of Nordic countries’ populations living in locations with different types of urbanity/rurality, according to Nordregio’s territorial typology, 2022 (2017 for Iceland).
Figure 5 demonstrates some of the diversity in the Nordic countries’ settlement patterns. Moreover, it shows how ranking the Nordic countries by urbanity becomes more difficult when taking both settlement sizes and distances to urban areas into account. Iceland, with more than 60% of the population in grid cells classified as “inner urban areas,” also has a relatively high share living in “sparsely populated rural areas.” Hence, Iceland may be both the most urban and the most rural Nordic country, depending on how “rural” and “urban” are defined. On the other hand, Denmark has a relatively high share of the population living in peri-urban areas or rural areas close to urban (orange parts of the columns), which is not surprising given the country’s relatively small size. If “urbanity” is defined as the two blue and the dark orange part of the columns, Denmark is the most urban Nordic country, while Iceland and Norway come out as the least urban.
1.5.1. Strengths and Weaknesses
Nordregio’s recently published grid-based territorial typology seems promising for making robust Nordic comparisons. These results are, however, not available in online databases like the other data presented in this research note. Furthermore, to use these data to analyze territorial differences in, for instance, socioeconomic conditions, data on such conditions would need to be available at the sub-municipal level (which is usually not the case), or municipalities would need to be assigned one typology (which would camouflage diversities within municipalities).
2. Discussion and Conclusion
For policymakers, researchers, media, or others who want to compare urbanity in different countries, there are many sources to choose from, each with different methodologies, definitions, and cut-off-points. Hence, conclusions may vary substantially depending on the source used. This is summarized in Table 1.
Different Agencies’ Measures of Urbanity and Their Results for Nordic Countries.
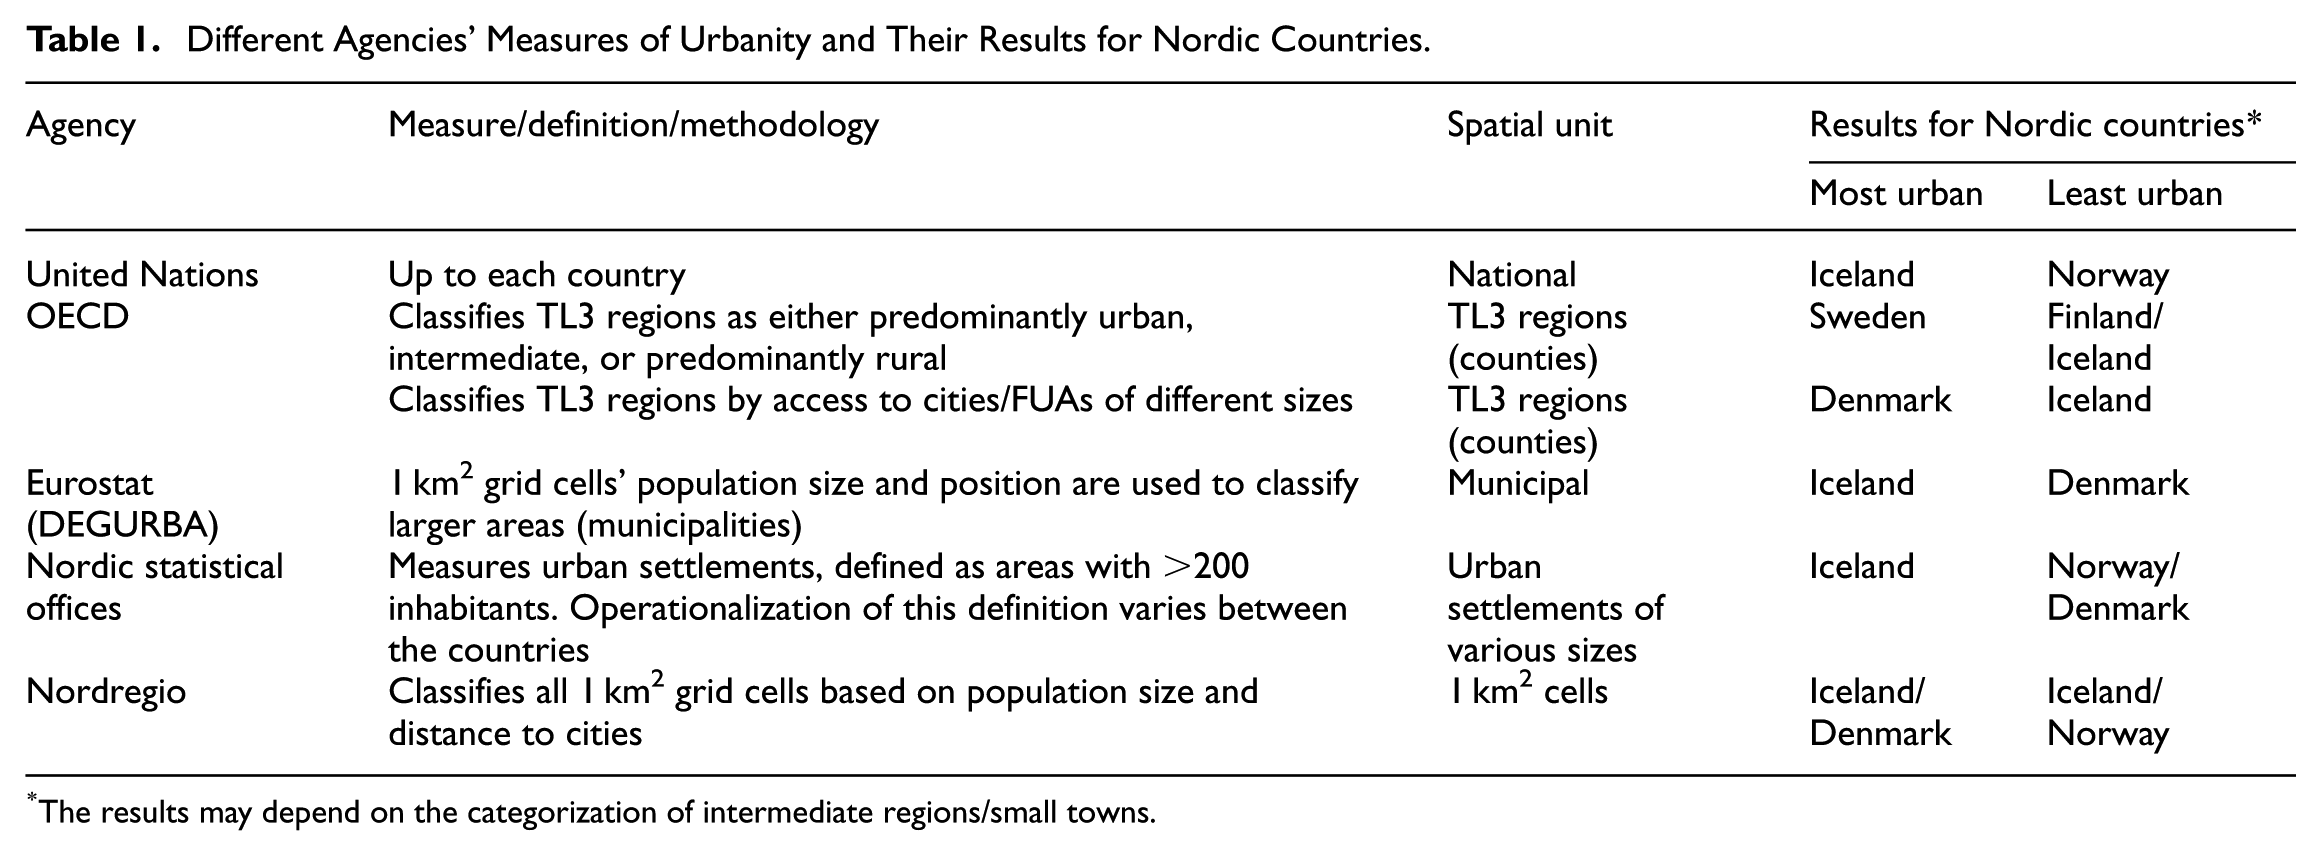
The results may depend on the categorization of intermediate regions/small towns.
While data from the UN, Eurostat, and the national statistical offices may indicate that Iceland has the largest population share in cities/towns/inner urban areas, the OECD figures suggest that Iceland has the least urban population among the Nordic countries. Moreover, while Denmark and Norway tend to rank as the least urban Nordic societies in many of these measures, Denmark’s rank changes when the distance to larger urban centers is taken into account.
All the measures would agree that downtown areas of Stockholm and Copenhagen are urban, and that the northern outskirts of Iceland and the deep Finnish forests tend to be rural. The discrepancies often concern all the types of settlement in between. For instance, people living in a settlement with 1,000 to 4,999 inhabitants in a rural/remote area would be defined as urban by the UN—and arguably also by many of the Nordic statistical agencies—but not by the OECD and DEGURBA. In Nordregio’s typology they would likely belong to the category “local center in rural area.”
Diverging definitions and methodologies can make it hard to draw conclusions about, for instance, how different countries’ urban and rural populations differ on socioeconomic indicators, or about the effects of different policies implemented. The Nordic countries differ substantially in their rural/regional policies, as noted in several reports (Copus 2007; Hedström and Littke 2011; Lindqvist 2010). For instance, political arguments for sustaining rural areas have been most explicit in Norway (Hedström and Littke 2011), and Norway arguably has had more active (and costly) regional/district policies than neighboring Sweden (Berg 2005; Stein 2019). The data presented in this research note, often ranking Norway as one of the least urbanized Nordic countries, could be seen as a sign of successful Norwegian district policies. But it could also be an artefact of different definitions applied.
Part of the challenge for cross-country comparison of urbanity is linked to different methodologies and definitions used in different countries, but the research frontier is moving relatively quickly in this field, exploring new data sources, new methods, and better computational power to apply the same standards across all countries (Melchiorri et al. 2018; Moll et al. 2019; Taubenböck et al. 2022).
However, in addition to such comparability challenges it is not obvious how “urbanity” can best be understood and measured. On the one hand, it may be measured by the population size of a place, with more populous (and more densely populated) places being defined as more urban. The results from the Nordic statistical offices are examples of this, with population size being the main definer. On the other hand, one may argue that a settlement with a certain population size in a remote area has different characteristics than a settlement with the same population size on the outskirts of a metropolitan area, because the latter has broader access to large labor markets and services. Nordregio’s typology classes take this centrality dimension more explicitly into account. These different understandings of “urbanity” may partly explain why the results presented here are diverging, especially for Denmark. The area of Denmark is relatively small, with shorter travel distances than in the other Nordic countries. If distance to an urban center constitutes an important part of “urbanity,” even large parts of the Danish countryside may be considered urban.
Hence, policymakers, researchers, media, and others should be careful when making claims about urbanity differences between countries. Moreover, they should ensure they pick the measure that best fits the topic they want to illuminate. The measures presented in this research note have different strengths and weaknesses, and they may be useful for different purposes. Perhaps an even better option is to combine these measures, to illuminate the issue of urbanity from different angles. Although not all countries’ statistical agencies provide the type of data that the Nordic countries and Nordregio do, data on urbanity for most European and OECD countries are available from several sources. If different data sources—using different methodologies and/or different definitions—show similar results, it strengthens the interpretation of the results. In this research note, the data from Eurostat and from the five Nordic statistical offices show similarities that also align relatively well with the recent work by Nordregio, suggesting that Iceland can be seen as the most urban Nordic country (even though Iceland’s only big city—Reykjavik—has fewer inhabitants than any other Nordic capital), and that Denmark and Norway tend to have a less urbanized population than the other Nordic countries (although in Denmark distances to urban centers are relatively short).
Further work could also be warranted on the data side. The Nordic statistical offices—known for their good data and close cooperation—may have good reasons for applying specifically tailored definitions when preparing statistics about their own country, based on their knowledge about country-specific conditions and policy needs. However, it would be a valuable supplement to the Nordregio work if the statistical agencies—whose definitions focus more on settlement size and less on centrality—could try to apply the exact same definitions for all the Nordic countries in order to remove any doubt that the results presented in this research note’s Figure 4 are merely an artefact of different statistical methods. If they do, I encourage them to submit their results in this journal, and I will be more than happy to change my conclusions.
Footnotes
Acknowledgements
Knut Onsager and Hans Henrik Bull have provided valuable feedback to previous versions of the manuscript.
Funding
The author disclosed receipt of the following financial support for the research, authorship, and/or publication of this article: This work is financed by the Norwegian Research Council, through the Smacreg project (grant 336248).
Received: September 2, 2024
Accepted: August 2, 2025