
Abstract
The emergence of smart devices, in particular mobile devices, has widened the potential types of data that can be collected in the social sciences. Given the fact that traditional surveys require more and more effort, new data sources collected via smart devices can potentially improve measurement of variables of interest and representation of the target population. New data sources also bring new challenges. New data sources, such as smartphone sensor data offer less control and coherence than traditional data such as administrative and survey data do, and are therefore often integrated either during, or after data collection. Respondents remain in control and help to resolve inconsistencies, missing data, or provide context. We discuss the consequences of hybrid data collection and methodology needed to reduce errors in smart surveys. Since quantification of the various types of errors is costly and time-consuming, we present a number of practical criteria. These criteria help evaluate whether hybrid data collection may have a positive business case and justify further investments in systems for data collection, data processing, and integration. We apply the criteria to three case studies: the measurement of mobility, consumption, and physical activities. Large-scale field experiments have been conducted for each of the case studies that allow us to evaluate the criteria.
1. Introduction
In this paper, we advocate for the introduction and evaluation of new types of surveys where traditional data collection methods, such as questionnaire and administrative data, are integrated with new data sources, such as sensor and digital behavioral data.
Smart devices, in particular smartphones, offer an attractive gateway to collect more traditional types of data (e.g., survey questions) along with new forms of data (Struminskaya, Lugtig, Keusch, and Höhne 2020). A smart device offers a range of sensors, real-time linkage to online (private) databases, and near real-time processing of new forms of data with the assistance of respondents. We term surveys that combine one or more new forms of data with real-time processing smart surveys. The data collections that emerge from smart surveys mix different types of measurement tools and mix new and existing data. Since the advent of smartphones, many studies have explored smart surveys as a way to produce better social science data for example, Groves (2011), Link et al. (2014), Japec et al. (2015), and Ricciato et al. (2019, 2020).
We bring these seemingly diverse and distinct options of smart devices under one umbrella because they have two prominent commonalities: First, they represent “big data meet surveys” (Hill et al. 2020), but with respondents still at the heart of data collection. Consequently, smart surveys all include a similar, but complex, trade-off in the decision how to balance active and passive data collection where user experience, burden, drop-out, measurement data quality and legal-ethical constraints are weighed against each other. Second, they all push parts of data processing to respondent-owned devices. The implications for the various survey design components (methodology, IT, logistics, and legal) are, therefore, very similar.
Smart surveys are not merely extensions of traditional surveys: there is a need for new logistics, new expertise, and new IT infrastructure that are robust and satisfy privacy requirements (Struminskaya, Lugtig, Keusch, and Höhne 2020). Furthermore, the resulting smart data need to be integrated in and supplemented by survey data. By the non-traditional nature of the data, the resulting multi-source statistics demand for new processing tools and skills and may result in time series shifts. Given that new tools and skills can be time consuming and costly to develop and deploy, there must be a strong business case. Furthermore, smart surveys bring new sources of error, both in representation and in measurement. As a consequence, a new methodology is needed to reduce such errors. By merging different types of data, smart surveys may combine the best of multiple worlds, for example, Callegaro and Yang (2018). In official statistics, administrative data and survey data have been combined already for some time. As we know that both registers and surveys suffer from problems with measurement and representation, one goal of such data fusion methods is to combine estimates from both sources in such a way that total errors are reduced or eliminated (Braaksma and Zeelenberg 2015; Reid et al. 2017; Zhang 2012). A similar approach is needed for smart surveys, taking into account operational conditions of the data collection process.
The main question we like to answer in this paper is: Under what conditions may smart surveys have a positive business case?
In order to answer the main question, pragmatic criteria are needed. Isolating and quantifying individual error components is complex, and studies can be very costly, operationally complex, and time consuming. We propose criteria from three perspectives: the survey questionnaire, the smart measurements (often through sensors), and the respondent. The criteria allow for a preliminary assessment of the utility and potential that forms the starting point for further in-depth evaluations and investments. In this first stage of business case evaluation the focus is on smart data accuracy and respondent perceptions.
We discuss the main question at the hand of three topical case studies: travel, household expenditure, and physical activity. All are modules in common general population surveys. When starting smart survey explorations ourselves in 2018 we believed that for these topics, the business case may be positive. In recent years, studies emerged evaluating the potential of these applications. See McCool et al. (2021) and Lugtig et al. (2022) for evaluations of smart travel surveys, Jäckle et al. (2019) and Rodenburg et al. (2025) for evaluations of smart expenditure surveys, and Kapteyn et al. (2018) and De Wolf et al. (2024) for evaluations of smart health surveys, respectively.
We structure our discussion as follows: In Section 2, we discuss smart features, smart data, and smart surveys. In Section 3, we then address the main question on business case criteria. Next, in Section 4, we retrospectively evaluate the criteria using field test data. We conclude with a look into the near future in Section 5.
2. Smart Surveys
Although, under any definition “smart surveys” will likely have a fuzzy boundary with “non-smart surveys,” we do need structure and terminology. We distinguish smart features, smart data, smart tasks, smart services, and smart surveys. We elaborate on smart tasks as they facilitate integration of smart data into surveys.
2.1. Smart Survey Terminology
A smart survey is a survey that employs one or more smart features and some form of interaction with respondents to put the data derived from smart features into context. Smart features are options offered by smart devices for collecting, linking or processing data:
Internal sensors: It can employ the sensors that are available in the device, for example, the location sensors, camera or motion sensors;
External sensors: It can communicate through the device with sensor systems close by, for example, a smart watch or an indoor climate system;
Public online data: It can go online and extract publicly available data, for example, open streetmaps data;
Data donation through the respondent: It can go online and request access to existing external personal data, for example, bank transaction data or shop loyalty card data;
Data donation through the surveyor: It can ask consent to link external personal data already in possession of the survey institute, for example, shop scanner data or public transport data.
Device intelligence: It can use the intelligence (computing, storage) of the device for (near) real-time processing, for example, it can apply pre-trained machine learning models for image recognition;
Data that result from the application of one or more smart features are termed smart data. They are handled during the survey with the help of respondents and/or post-survey. Such processing actions are called Smart tasks. Smart tasks are combined into so-called smart services or smart solutions that may become accessible to respondents through the user interface of the survey application.
Let us first elaborate on the types of smart features that can be included in smart surveys. The most distinct smart features are in-device sensors, external sensor systems, and data donation (Carrière et al. 2024).
Internal sensors, as available in most contemporary mobile devices, are commonly used as a source of smart data. Table 1 shows sensors that are commonly available. It is important to note that sensor data by themselves are often not usable yet, and an additional data processing step is necessary. As an example, motion and gyroscope sensors only produce vectors in space, but these data can be used to detect motion in a three-dimensional space. For some sensors, Apple/Google have already prepared such functionality, so that derived sensor data can more directly be used. An example is transport mode which can be requested. Some sensors can also produce stimuli of which the responses can then be employed. For example, a mobile device can produce a sound and “listen” to the echo/reflection.
Classification of Sensors in Mobile Devices and Their Derived Features, Potential Outward Stimuli, and Examples of Their Processing Potential.
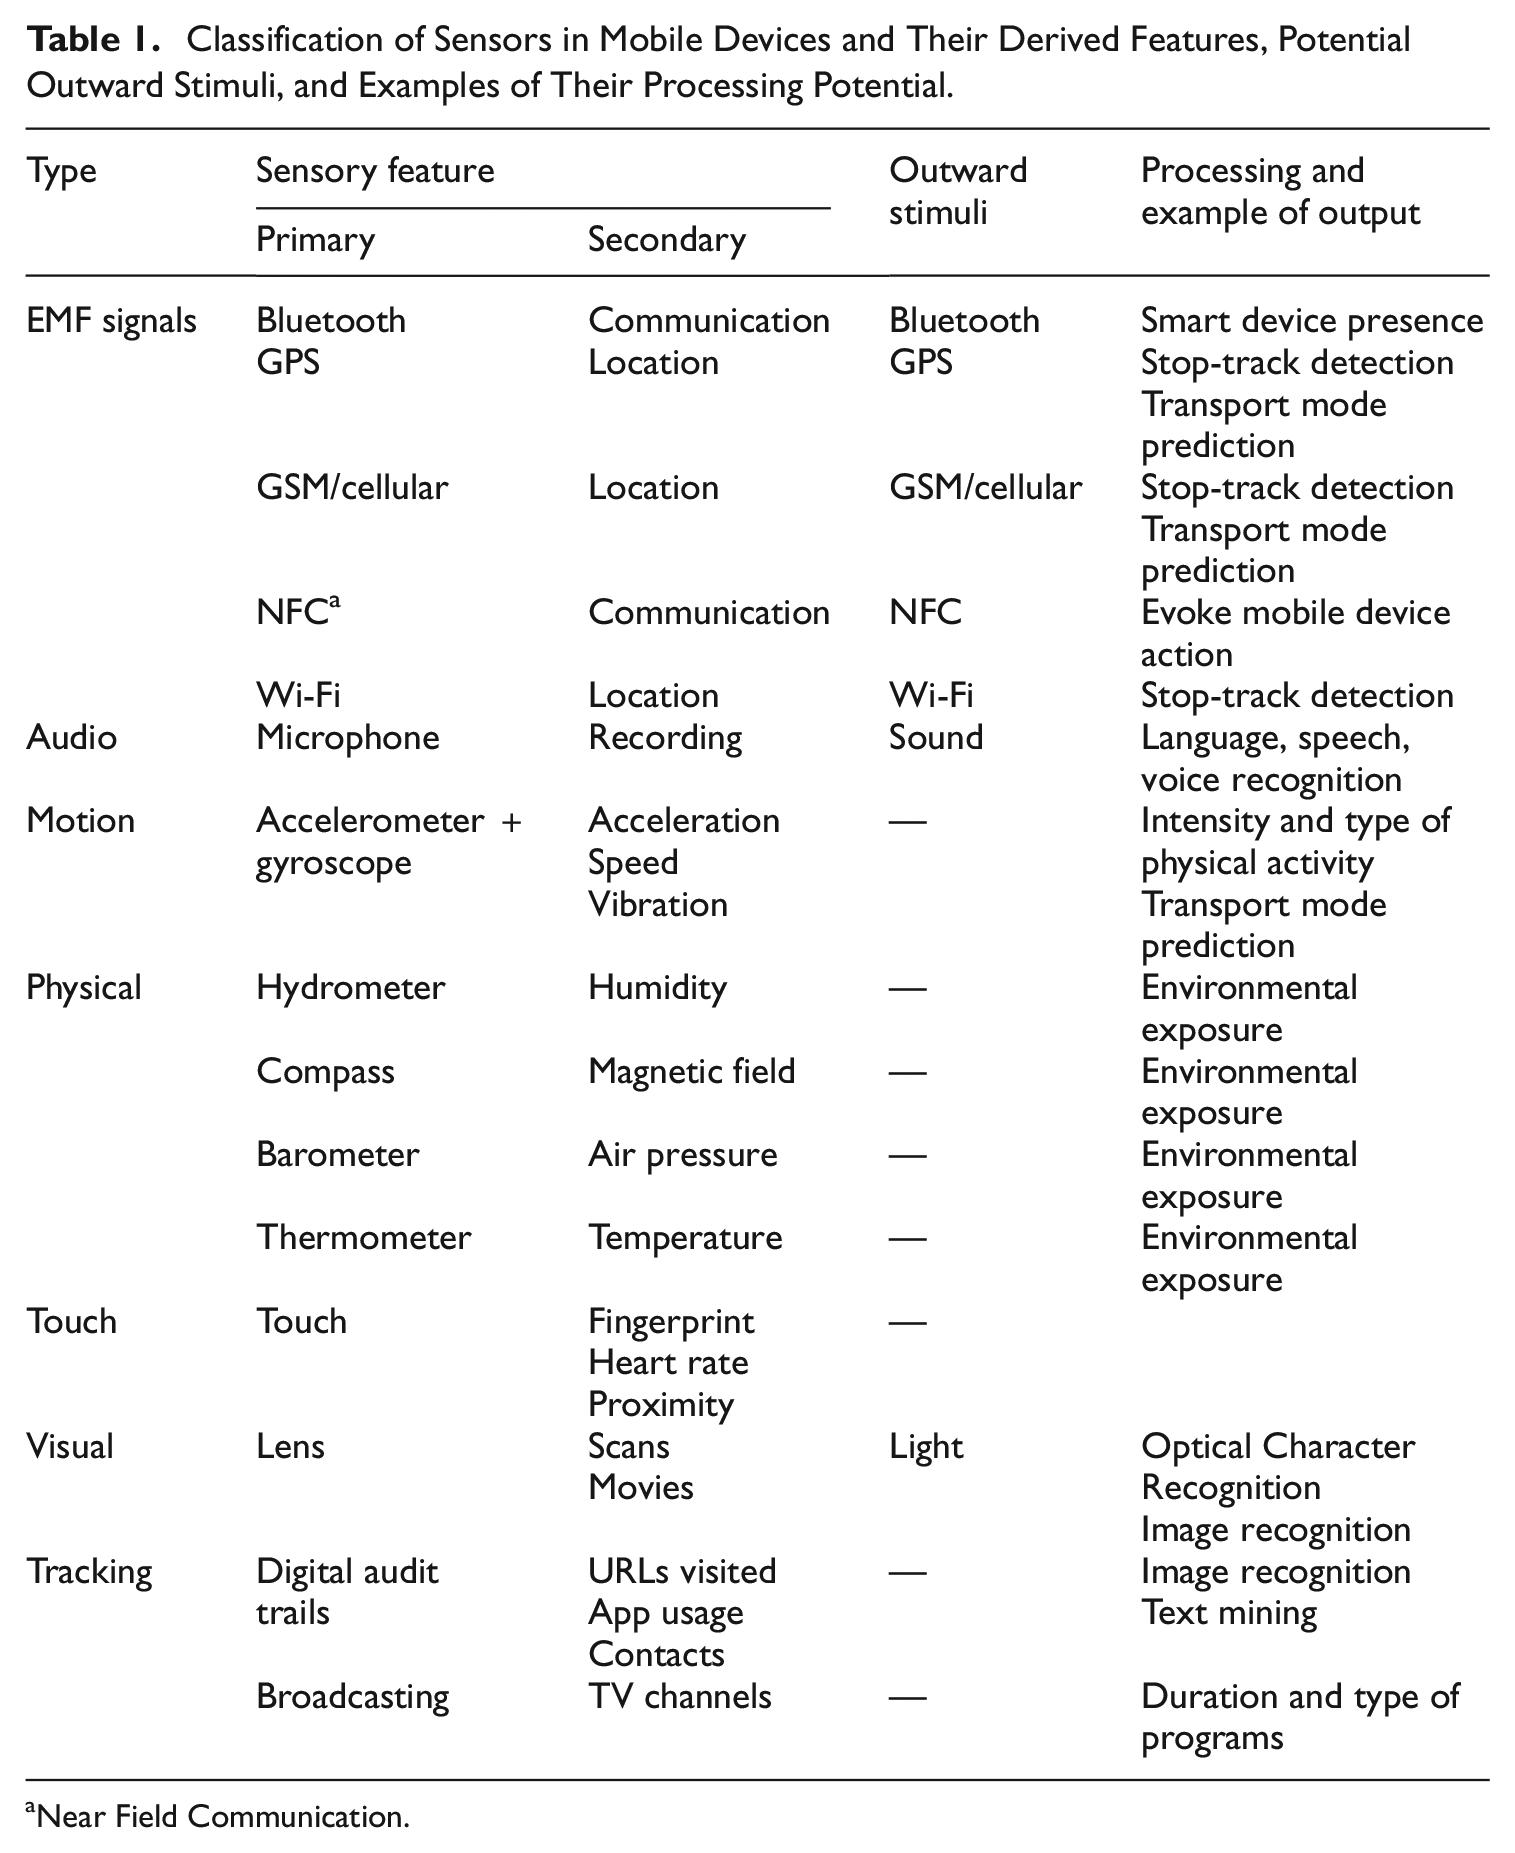
Near Field Communication.
External sensor systems are sensor systems that are often standalone systems, not embedded in smartphones or tablets. They come in many forms, but can be roughly divided into wearables, mobile sensor systems, and fixed sensor systems. Wearables are directly worn to measure physical parameters. Mobile sensor systems are portable devices that measure environmental parameters close to persons. Fixed sensor systems measure environmental parameters, in particular for specific indoor or outdoor areas. All systems typically have five attributes: (1) one or more sensors, (2) chargeable batteries, (3) a CPU (Central Processing Unit) that allows for processing of data, (4) local data storage, and (5) communication options with other devices. Being dedicated devices with advanced technology, external sensor systems typically are commercial and, consequently, lead to involvement of third-parties. However, some vendors are oriented at the academic market and provide raw data as well as processed, stylized data (e.g., after outlier detection, edit/plausibility checks, missing data imputation, machine learning predictions). These research-grade devices tend to be more expensive, but are also designed to be used multiple times and tend to be more robust. Being oriented at research, the vendors often allow for tailored contracts, for example about if and how data are secured and transmitted.
The last main smart feature, data donation, has two main forms: through the respondent and through the surveyor. The respondent-scenario in essence (in the European Union) leans on the GDPR (General Data Protection Regulation) that allows persons to request data that are held about them (Carrière et al. 2024). Data holders are obliged to provide an open API (Application Programming Interface) to which applications can send requests under some form of authentication. Respondents can be invited to make such requests and resulting data may be (pre-)processed and aggregated to meaningful statistics either in-device or in-house. Examples are bank transactions data, social media data, and energy provider data (Boeschoten et al. 2022). In some cases, the organization carrying out the study, such as a National Statistical Institute can, under respondent consent and with linking keys provided by respondents, retrieve and link data directly. Examples are road sensor data or energy use data. This we call the surveyor-scenario. The motivation for including data donation as smart feature comes from contexts where the donated data are just a first tentative step. The respondent is needed to check, validate, and supplement in real-time during the reporting period. An example is smart energy meter data where the respondent is needed to check the predicted types of electronic appliances, the presence and use of solar panels with or without local batteries, and the at-home pattern of the household.
2.2. Smart Tasks and Data Integration
Although quite distinct in nature, different smart features have very similar smart tasks. It is through these that smart data get integrated into a survey. And it is there where important decisions need to be made about the role of respondents. In one extreme case, no integration is done during data collection: data from for example, an external sensor system measuring air quality is only after data collection combined with survey data (Hattori et al. 2022). At the other extreme is the case where all sensor data recorded are annotated or processed by the respondent. Link (2013) for example reports on a study where respondents were asked to take a picture with their smartphone, and annotate every picture. Depending on the topic under study, and the sensors used, a balance has to be found between passive data collection, active help of the respondent in processing and integrating sensor data. Of particular importance here is to what degree sensor data can be processed and aggregated using statistical models. The task of the respondent is to interact and improve the quality and interpretability of the sensor data.
Smart tasks are one of the following:
Cleaning: Smart data noise and outliers are removed, for example, system noise in activity trackers
Enriching: External data are added, for example, geographical points-of-interest data
Editing: Smart data are confronted with edit/plausibility rules and edited if needed, for example, speed is checked against a threshold in location tracking
Imputation: Missing smart data are imputed, for example, gaps in extracted texts are interpreted
Classification: Smart data are classified into a specified categorization, for example, the purpose of a visit to a location is classified/predicted using a pre-trained model
Transformation: Smart data are aggregated, combined, and/or fused, for example, raw indoor climate quality data are summarized to a few overall indicators
Smart tasks thus, in part, shift data processing to the data collection phase. Motives for doing so are respondent engagement and data control, error adjustment, and privacy-by-design as laid down in legislation such as the GDPR (General Data Protection Regulation) of the European Union. The listed smart tasks can be seen as addressing the potential errors in new data sources (Zhang 2012). Under a fully passive regime, all listed smart tasks are part of the post-survey processing and integration phases. Under a fully active regime, all tasks are done during the study and shown to respondents for evaluation and, if needed, action. To fix thoughts, consider location tracking. Respondents may identify outliers locations, they may check Open Street Maps points-of-interest on completeness and correctness, they may edit spurious stops or travels, they may fill gaps in location data, they may check classifications of transport modes, and they may consult overall distances traveled for their own interest. Whether they can and are willing to is, however, a crucial research question. It must be expected that part of the tasks must be re-iterated post-survey.
3. Business Case Criteria
In this section, we propose a strategy to answer our main question: Under what conditions can smart surveys have a positive business case. The business case evaluation must be viewed as a first step in which investments are made to learn about the accuracy of smart data and about respondent willingness and ability to perform smart tasks. If positive, an evaluation should follow of investments in front-office and back-office systems, in data processing tools and skills, and in evaluating consequences for time series of statistics.
3.1. Business Case Criteria for Smart Surveys
Smart surveys may intuitively look like an attractive method to modernize surveys. Respondents and data producers may expect that official statistics use modern methods to collect data, and smart surveys are one of the ways to do so.
When we look more formally at the long-term reasons for converting a traditional survey to a smart survey, we identify push- and pull factors. These factors are not the same over time, countries, and topics. In fact, we believe that the factors outlined in this section can help understand for what topics and in what countries smart surveys have potential. In order to bridge to other country settings, we select use cases that are mandatory in the European Statistical System (ESS) and/or conducted in many countries with a comparable output need. Two of the studies are evaluated in larger Eurostat-projects. The criteria can also be used to evaluate potential other use-cases for smart surveys.
3.1.1. Push Away from Traditional Surveys
There are several reasons why researchers are looking for alternatives to traditional surveys. Smart surveys are only one alternative to using a traditional survey, and many initiatives to use administrative and “Big data” as alternative sources of information can be understood from the same three push factors:
surveys are costly and time-consuming
topic of the survey: low centrality
topic of the survey: high burden
In general, surveys suffer from problems with costs. Fieldwork for surveys is becoming more costly, especially because it is becoming harder to convince respondents to participate in surveys (Beullens et al. 2018; Luiten et al. 2020). Reason 1 for a push away from traditional surveys is that surveys are increasingly costly and time-consuming to conduct well.
The issue of low response and high cost is especially so for surveys that are difficult or burdensome for respondents to start and/or complete. The topic of interest may require expert knowledge, for example, of air quality, or recall from memory of very specific facts, for example, travel or media use. Such topics are termed non-central or to have low centrality in questionnaire design literature (e.g., Bais et al. 2018). A survey may also be very burdensome due to the amount of questions or the long duration of data collection. Together, low centrality and high burden form reason 2 and 3 to move away from a traditional survey and move toward smart surveys as an alternative.
The three push-factors to move from traditional to smart surveys to some degree apply to all traditional surveys, although the push may be stronger for some surveys; those who are especially costly, time consuming, burdensome, or difficult for respondents. A transition to a smart survey is however only attractive if specific push-factors are at work as well, that make the “smart” element in smart surveys an attractive alternative. We discern three pull factors toward smart surveys as well.
3.1.2. Pull Toward Smart Surveys
Smart surveys can only become successful if there are low barriers in the use of the smart elements in general population surveys.
high coverage of smart data relative to the target population
low costs of collecting and real-time processing the smart data
high accuracy of the smart data
First, the smart feature to be used has to be used by a broad group of the general population. Smartphone sensors are an example of this, while other sensors (e.g., VR glasses, or biometric wearables) are less so. Second, smart data need to be able to be collected at low cost. The smart survey data collection and real-time processing costs per respondent should be comparable to non-smart counterparts. Linking or integrating smart sensors into wearable devices that contain an Internet connection is one way to achieve this. Third, the quality of the data collected needs to be high for the purpose of the study. This pull-factor is statistic specific; movement data collected with location sensors is very suitable for studying travel behavior, but less so for studying time use.
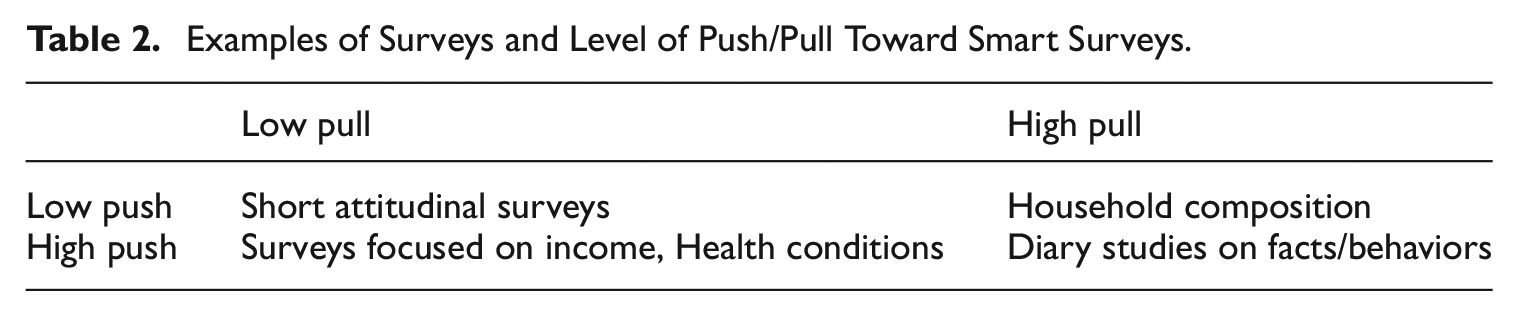
The push- and pull factors can sometimes work in the same direction (e.g., both high push- and pull), see Table 2, but sometimes also in different directions. An example of a situation where both push- and pull factors are strong are topics that are currently studied using traditional diary surveys, such as time use, household spending, or travel behavior. Surveys that ask about various health conditions provide a case where there are strong push factors: health surveys are long, while respondents often don’t know exactly what health conditions they have. At the same time, the pull factor, of using smart data to measure a variety of health conditions within respondents is still low, due to low availability and high costs of smart sensors that can inform about health. A use case that combines a low push factor with a high pull factor is household composition. Smart sensors in digital devices, such as the Bluetooth, camera, and proximity sensors on mobile phones would allow the measurement of household composition in detail, but we can also simply ask for this information in a survey using a short item-battery, and get information that is probably of similar quality at much lower effort and cost. Finally, for some topics, there is neither a push- or pull: doing a short attitudinal survey on a topic of interest to most people (e.g., consumer confidence) still yields relatively high response rates, and the quality of survey data would likely not be increased with smart data.
Examples of Surveys and Level of Push/Pull Toward Smart Surveys.
3.1.3. Criteria for a Positive Prospective Business Case
The push and pull factors need to be substantiated to criteria. Even if it is technically possible, are people in the general population actually willing to participate in such smart surveys? Are the smart data that are produced of similar or better quality? And are smart surveys legally and ethically possible? These questions pertain to the presence of criteria that need to be met in order for smart surveys to be possible at all. We see the following criteria:
Respondent willingness and ability: Respondents are able to perform the smart task, and willing to consent to provide the smart data. What is relevant here is not so much the absolute response rate, but the relative participation in a smart survey compared to a traditional survey.
Measurement quality:
• Data handling: Respondents can retrieve, revise, annotate, and handle smart data on demand.
• Data accuracy: The accuracy of the smart data after editing by the respondent is at least as good as for non-smart counterparts.
Legal and ethical concerns: The smart study has to embedded within existing legal frameworks (e.g., GDPR), and be judged as ethically sound (e.g., handling privacy in a good way).
Costs and time. Doing a smart survey should not increase costs too much relatively to traditional surveys, and also be about as timely.
Before advancing to larger scale explorations and field studies and to investments in infrastructure and logistics, that is, to have a positive prospective assessment of the business case, the four criteria need to be evaluated as feasible: Strategies and solutions can be developed to get sufficient willingness, adequate performance of smart tasks, legal and ethical support, and feasible integration with survey data. All of this should be at comparable operational costs per respondent.
In specific organizations, and for specific studies there, obviously, may be more specific conditions that have to be met.
3.2. Smart Survey Use Cases
In 2018, we identified three general topics, where initially we identified a potentially positive use case: both high push- and pull factors were present, and the conditions for doing smart surveys appeared possible to meet. In this section, we shortly discuss these use cases.
3.2.1. Travel
For distances and durations in domestic travel, we identified internal sensors, namely location tracking and motion sensors. Location tracking provides location data using a mix of sensors (GPS, Wi-Fi, GSM). Motion sensors allow only for derivations of relative movements. Relative movements could be combined with a starting position to derive locations. However, despite being very precise sensors, frequent recalibration would be needed. More importantly, motion sensors can be used also for deriving features that are informative about the type of transport mode. Location tracking gives information on speed and bearing but not as precise as motion sensors.
Location sensors are available in all mobile devices, data can be accessed easily, location and motion are relatively precise and the sensors are cost-free. When it comes to the conditions for smart surveys, we did identify several points of concern: location-time points can contain sensitive information beyond mere distances that respondents may not wish to reveal. Furthermore, location and motion data cannot easily be accessed and interpreted by respondents themselves without extensive data handling at the researcher and respondent side. In 2018, we did not consider data donation of travel data such as Google timelines.
3.2.2. Household Expenditure
For household expenditures, we identified one internal sensor option and two data donation options. The sensor option is the camera that allows for scanning/photographing paper receipts of purchases. The scans may subsequently go through OCR (Optical Character Recognition) and language processing to categorize what is being bought at what price into COICOP (Classification of Individual Consumption by Purpose) categories (Gausden and Hasan 2024). Two potential data donation options are bank transactions data and loyalty card data. Respondents can download bank transactions data through bank services and relevant transactions could be added to household purchases. They need to be linked separately for each bank. Loyalty card data contain all purchases made by registered customers and can be downloaded by respondents. Again linkage needs to be done per shopping chain.
While data access and costs as conditions score positively throughout all options, the options varied in the pull-factors and conditions of willingness, ability, and data handling. Bank transactions data require online banking options and loyalty card require subscriptions, meaning that not all respondents are likely able to provide these data. Furthermore, there are likely multiple banks and shops involved. Also the data quality was deemed diverse. Bank transactions data only contain totals and relatively basic descriptions of the characteristics of transactions. As a consequence, for purchases stretching across multiple expenditure categories, such as groceries, data are insufficiently rich. Willingness for bank transactions data donation were anticipated to be prohibitive. The task of scanning of receipts was viewed as burdensome, potentially also affecting willingness. Summarizing, there are weaknesses to all smart features. Data donation was not pursued into a testing phase.
3.2.3. Physical Activity
For physical activity, a standard questionnaire module in health surveys such as the European Health Interview Survey (EHIS), we considered three smart options: provision of physical activity trackers/accelerometers, provision of heart rate/respiratory trackers, and data donation of respondent-owned wearables. Physical activity trackers come in many forms. We considered research-grade activity trackers that are focused on the academic market and allow for retrieving raw data. Because activity trackers measure motion but not necessarily effort/energy use, we considered additional wearables to measure heart rate and/or respiration. Data donation of respondent-owned wearables is diverse as there is no control over brands and models.
The three smart options show challenges. The provision of trackers to respondents would imply that all respondents are able to do the task. Coverage of self-owned trackers was deemed well below 50% of the population and only summaries of data can be retrieved. Despite potentially providing very insightful feedback, willingness for activity trackers and data donation was believed to be lower than for non-smart surveys. In all cases extensive data handling is needed by respondents. Data handling of research-grade trackers by respondents can only be done through the researcher in most cases.
Summarizing, the smart options show promise on some conditions but also challenges to measure health-related statistics. This made the assessment of business case more subjective. Ultimately, it was deemed potentially positive for activity trackers and data donation of respondent-owned wearables but not for heart-rate/respiratory trackers. We do not discuss the data donation use case. For more information on data donation of self-owned wearable data, we refer to Kompier et al. (2024).
4. Evaluating the Case Studies Retrospectively
Between 2018 and 2022 several qualitative tests and larger field tests have been conducted by Statistics Netherlands to develop proof-of-concepts for the three case studies in the general population. For the travel case study two large field tests were conducted, one in Autumn 2018 (see McCool et al. 2021) and one in Winter 2022 (Schouten et al. 2024). For the household expenditure case study field tests were conducted in multiple countries in 2021. The corresponding app was developed through Eurostat-funded projects (see Schouten 2022). Prior to the field test, several smaller test rounds were conducted (see Järvensivu et al. 2020 and Ménesi et al. 2022). We restrict ourselves to the results for the field test and smaller tests in the Netherlands. For the physical activity case study multiple tests were included, ranging from lab tests to larger field tests. In 2022, a field test including data donation was performed in the probability-based Internet panel LISS (short for Longitudinal Internet Studies in the Social Sciences) of CentERdata (see Kompier et al. 2024).
To review the utility of the business case criteria, we look at the following questions:
Willingness and ability: How is actual willingness and ability to participate in smart surveys?
Measurement quality: What is the measurement quality of the smart data?
Legal-ethical: What legal-ethical concerns do respondents have?
Costs: Are costs per respondent comparable to non-smart counterparts?
In all case studies, a submission to an ethical committee and a data protection impact assessment were mandatory. All case studies passed both examinations. In the cases of travel and household expenditure legal officers did demand for further privacy enhancing techniques once surveys will move from development to production. Risk assessments are available upon request by the authors.
The questions focus on the data collection viewpoint of the smart surveys business case and ignore development and implementation of logistics and IT of smart surveys. Luiten, Lusyne, and Schouten (2022) give a description of all design components to be considered in a final decision to implement a smart survey. In the coming sections, we discuss results per case study.
4.1. Travel
How is actual willingness and ability of respondents to do smart surveys? A large field test, conducted by INSTITUTE in October and November 2018, showed app registration rates around 27% among a newly recruited sample from the general population. This response rate was about the same as the regular online diary travel survey (without location tracking data). It must be noted, however, that the app-assisted travel survey asked for a week of participation, while the regular survey asks for a single day. In the field test as well as in regular data collection, no interviewers were involved. Respondents were recruited through invitation letters and two reminder letters sent to random samples from population registers, so the recruitment strategy was quite similar in the smart survey, and regular survey. One difference is that in the smart survey field test, three incentive strategies were randomly assigned varying the amount and timing of conditional incentives, while the regular survey did not offer an incentive (McCool et al. 2021). While registration rates were similar to the regular online survey, there was dropout in the app-assisted travel survey. Dropout occurred either directly after registering the app or very gradually during the week of reporting. The direct dropout was close to 20%. Ultimately around 18% participated for at least seven days. The cross-platform app supported mobile devices up to at least five years old. Only a small proportion of sample units dropped out because their mobile device was too old. See Lugtig et al. (2022) for details.
How about measurement quality? Location data showed deficiencies. McCool et al. (2021, 2024) discuss these issues in-depth. The measurement quality suffers from outliers and random noise, there is missing data because of the device’s battery management and from suspending location when going into hibernation mode. In the 2018 field test (see McCool et al. 2021), smart tasks consisted of turning on location tracking, labeling stops and tracks, and providing daily remarks on any deviations from regular travel behavior. A main recommendation was that transport mode labeling must be replaced by semi-automated machine learning predictions. McCool et al. (2021) make a comparison to travel statistics from the regular travel survey and note differences in durations and distances of travels and numbers of stops.
Legal and ethical concerns: Usability testing revealed that test persons showed relatively little interest in their own travel statistics, unless for example derived statistics such as carbon footprint would be made. Nonetheless, it was recommended to ultimately include overviews of travels during the reporting period. In none of the field tests, 2018 nor 2022, did any respondent request access to their own data during or after the survey. A dedicated webpage was prepared that allowed them to make such request, but this was not used in practice. In 2022, we experimentally tested a version where respondents would be tracked for one day versus seven days. Participation rates were slightly higher in the seven-day condition.
Costs and time: The fieldwork of the survey was more expensive per respondent than the traditional web-diary survey, mainly due to the use of incentives. However, because more data was collected in the smart survey per respondent, the required sample size was estimated to be about three times smaller, leading to similar overall costs for fieldwork.
Based on the test results, it was concluded that the proof-of-concept was sufficiently promising and it was decided that further explorations and development of logistics and IT was acceptable. From a methodology point, the strongest concerns are with participation rates and gaps in location data. The conclusions and concerns were in line with expectations based on the business case criteria.
4.2. Household Expenditure
How is actual willingness and ability to provide household expenditure data via an app? The field test in 2021 used two recruitment strategies, one using invitation and reminder letters only and one where interviewers assisted recruitment. The whole household was invited to participate but one member of the household core was explicitly approached and invited as the main contact. In both cases the incentive strategy consisted of a 5 Euro unconditional and a 20 Euro conditional incentive. The recruitment rates where, respectively, around 15% and around 28%. So, interviewer-assistance raised registration rates considerably. It must be noted that fieldwork took place during COVID-19 regulations so that interviewers needed to take extra care. The impact of interviewers persisted on activity and completion rates. Dropout patterns were comparable to that of the travel survey. Households dropped out relatively quickly after filling in the starting questionnaire or only very gradually. Around 11% and 23% of, respectively, the non-interviewer and the interviewer samples completed. See Rodenburg et al. (2025) for details. In 2020, the regular Household Budget Survey reached a completion rate of around 13%. The data donation of bank data was halted following a general tendency to negative respondent reactions. See Järvensivu et al. (2020) and Elevelt and Schouten (2022). Only a very small proportion of respondents reported issues with the camera when cropping images.
What is measurement quality? Here measurement consists of two steps: (1) scanning and OCR-NLP (Optical Character Recognition-Natural Language Processing) to produce a good product label, and (2) classification of the product label to product categories (Van Hoek et al. 2022). Respondents were randomized across different editing options. In the most basic option, respondents were only pointed at lower scan quality and encouraged to retake pictures. They did not have to edit products and prices extracted from the receipts. In the most extensive editing condition, respondents were invited to crop images and to edit the results from OCR and language processing. The classification accuracy was around 85% when using a year of historic train data. All submitted receipts were manually coded after data collection and also evaluated in terms of receipt quality and scan quality. It was concluded that editing improves data quality (Elevelt et al. 2022). For example, correlations between receipt length and errors in submitted amounts and numbers of products almost vanished when allowing for editing. However, differences to annotated data never completely vanished. A comparison of statistics between the regular survey and the smart survey showed that expenditure amounts and categories are comparable between the smart survey, and a regular diary study (Rodenburg et al. 2025; Schouten 2022).
Legal and ethical concerns: Respondents always had the option to choose between manual and smart data entry. None of the respondents did contact INSTITUTE with ethical concerns. The effect of personalized feedback was tested experimentally. Respondents in the condition that did receive feedback, were slightly more active in the app.
Costs and time: The fieldwork costs for the smart household expenditure survey were the same per respondent as for the traditional diary study. It employed exactly the same incentive strategy. Data were however collected in a more timely manner, and there were clear indications that respondents perceived a lower burden and for that reason were prepared to use the app for a longer period of time.
Combining all test results, it was concluded that a smart household budget survey is very promising and further development and implementation was started. An app-assisted approach will go into production in 2026. While scanning of receipts imposes a burden on respondents, it does reduce burden relative to manual data entry. Households spent roughly three minutes per day in the smart survey to report. As most challenging are seen the OCR-NLP of receipts and the high dynamics in products for classification.
4.3. Physical Activity
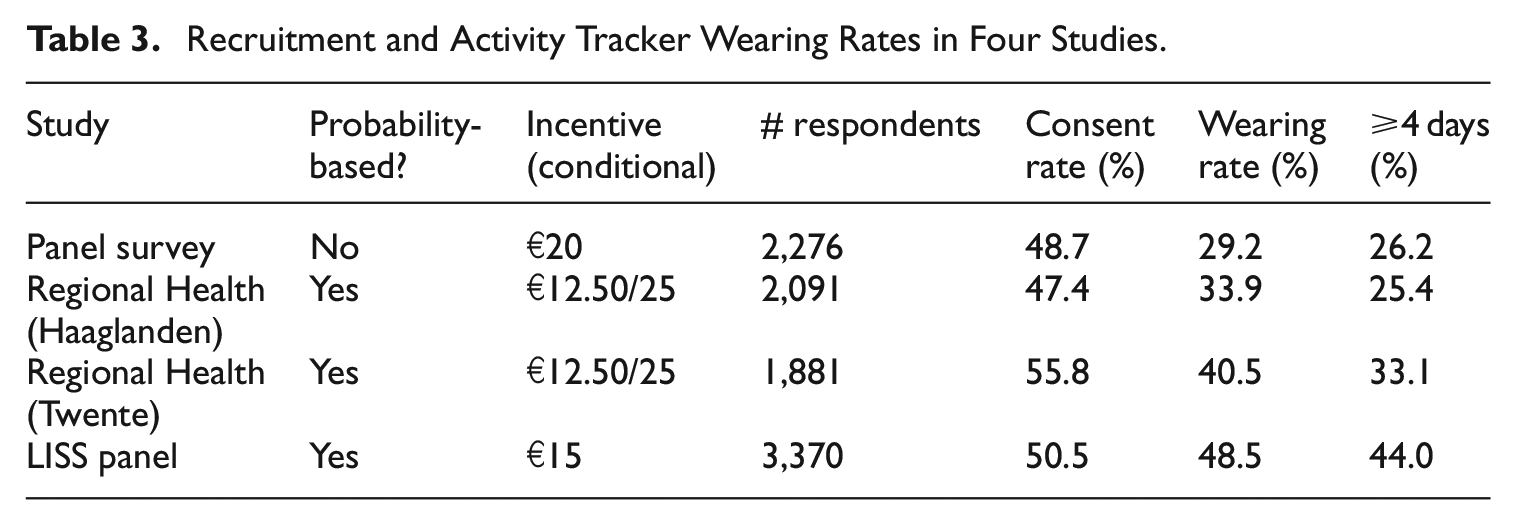
How is actual willingness and ability to provide physical activity data? INSTITUTE was involved in four small and larger scale pilots, which varied in recruitment and incentive strategies. The common denominator in these pilots is that persons were invited to a web questionnaire. A standard module on physical activity was included. At the end of the questionnaire, respondents were asked to participate in a study on physical activity with the activPAL. The activPAL was sent in the mail, with a written instruction how to mount the device on the leg. Participants had to return the device afterward in a prepaid envelop. Table 3 shows original consent rates, the rates of actually wearing a tracker and the rates of wearing a tracker for at least four days. About 50% of the respondents consented to wearing the activPAL, independent of the setting, and independent of the response to the original survey. Respondents were given a detailed and mostly visual manual on how to wear the trackers. None of the respondents reported issues in attaching or using the trackers.
Recruitment and Activity Tracker Wearing Rates in Four Studies.
What is measurement quality? Luiten, Toepoel, Schouten, et al. (2022) performed tests to see how activity trackers should be worn, and concluded that for measurement quality, they are best worn on the upper leg. They also concluded that trackers are much better at detecting activity intensity and duration than respondents do via self-reports. Respondents are better at specifying the type of activity than trackers.
Legal and ethical: respondents followed instructions correctly, and apart from some logistical problems, respondents reported no ethical or legal concerns.
Costs and time: In 2023, a pilot was conducted by INSTITUTE to identify the most demanding in-house operations and test logistic operations and IT requirements. While participation rates were relatively high, the cost of in-house data collection logistics and the acquisition and maintenance of trackers has led to hesitation about further implementation. Research-grade trackers are designed to be re-used multiple times. Nonetheless, devices cost up to 300 Euro. Costs for heart rate/respiration trackers are much lower, but re-use may be prohibitive to respondents.
To sum up, the criterion of cost was underestimated in the pre-assessment of the business case and turned out prohibitive. In line with the criteria, data donation as smart feature was abandoned, because recruitment rates are very low and the diversity of trackers is too great.
4.4. What Criteria Are Most Important in Prospective Assessment of the Business Case?
We started out with four conditions in prospective assessments: respondent willingness and ability, measurement quality, legal-ethical acceptance, and costs per respondent. Considering the three case studies, the pre-assessments were mostly correct. The travel and household expenditure case studies proceeded to further development and the household expenditure case study now is being prepared for production. The physical activity case study business case turned out to be less clear, primarily because of cost effectiveness.
The condition of cost effectiveness is perhaps the most influential in official statistics setting. In household expenditure and travel, participation rates were relatively comparable. For physical activity, however, going smart requires an existing survey that functions as stepping stone. Consequently, participation rates by nature are lower and costs reductions per respondent are not realistic. The business case in physical activity, therefore, must come from much better measurement data quality in the smart survey compared to a traditional survey.
5. Discussion
This paper presents a series of considerations about new forms of data collection involving smart devices. Since a full assessment of errors in survey error frameworks is both time-consuming and costly, we propose a prospective evaluation using a set of conditions or criteria. The criteria can be used to predict the strength of the business case of smart surveys before moving to more in-depth assessments and field studies. In this paper, we used the criteria to determine how tractable a smart survey may be for three topical case studies. The pre-assessments turned out to be useful and predictive of empirical results that followed from expensive, in-depth field studies. However, we also conclude that the criteria are too naïve in two dimensions. The first is the investment in IT and infrastructure. Although we pre-supposed a baseline IT and infrastructure to be available, smart features are diverse and will always demand for investment. In the case of measuring physical activity, the infrastructure for and maintenance of activity trackers implies investment. Operational/infrastructural investment must be added to pre-assessments. The second is that cost effectiveness may outweigh a gain in measurement data quality, as was again the case for physical activity. In pre-assessments, the weights given to criteria must be set in coordination with stakeholders.
In the introduction, we claimed that it is convenient and effective to evaluate the diverse smart features within one framework. The key motive is that all features have the same trade-offs in the anticipated roles of respondents. Given the three case studies, we are convinced that indeed it pays off to combine such features. In fact, at INSTITUTE, the same teams of data collection staff, mobile app developers, methodologist, UI (User Interface) experts, and data scientists work on all smart survey projects.
Respondent engagement and involvement also are the key to data integration. Smart tasks are embedded in surveys in parallel to survey questions. Smart data are checked and, if needed, adjusted or supplemented by respondents. The respondent, thus, is at the heart of data collection and the confrontation of different data sources. From a legal-ethical perspective this is a favorable vantage point. In this paper, we paid little attention to error frameworks. Building and using an overarching framework for survey data, administrative data, smart data, and AI-ML (Artificial Intelligence- Machine Learning) is an enormous challenge but ultimately needed. We strongly believe, however, that practical and pragmatic assessments like those proposed in this paper are inevitable. Nonetheless, advanced frameworks may help target pre-assessments.
Our considerations and explorations also have a few caveats. One caveat is that we restricted ourselves to field studies in the Netherlands. We do believe that the case studies considered are representative for the wider European Statistical System (ESS). All three are either mandatory within the ESS or conducted in ESS countries in relatively the same way. However, willingness to participate and, thus, cost effectiveness may vary from country to country. It is, therefore, imperative to make pre-assessment on a country-specific basis. In the on-going Eurostat-funded project Smart Survey Implementation, an assessment is made of the maturity of smart surveys. See Houben et al. (2023) for a description of the framework and criteria. Clearly, going beyond the ESS or moving from official statistics to academic or market research surveys require a revisit, or at least a re-weighting, of the criteria we propose. Another caveat is legal and ethical acceptance of smart surveys. In the case studies considered we were given more leeway by ethical committees and data protection officers for the sake of research and optimization of statistical processes. In production setting, leeway is more restricted. We still have to learn what are the implications. Also legal-ethical evaluations may be hard to extrapolate beyond the ESS.
We end with a brief discussion on next steps in smart survey methodology. The case studies pointed at various areas were experiences are thin, and, consequently, a pre-assessment of the business case is more complicated: (1) effective recruitment and motivation strategies, (2) respondent data access and control trade-offs, and (3) smart method effects.
In order to get a strong representation and measurement, recruitment and motivation strategies need to be tailored to smart surveys. Struminskaya, Lugtig, Toepoel, et al. (2020) found greatly varying hypothetical consent rates for different sensor measurements. Surprisingly, these hypothetical rates are quite similar to real consent rates, see Struminskaya, Lugtig, Schouten, et al. (2020). So what causes these varying willingness rates across smart features? Struminskaya, Lugtig, Toepoel, et al. (2020) and Struminskaya, Lugtig, Schouten, et al. (2020) found that respondents who are unfamiliar with sensor measurements may feel uncomfortable about the perceived richness of information contained in the sensor data, and/or they may find the measurements too burdensome. Experience is needed to make clear instructions and explanation of the response task and to make very salient that the respondent is in control over the data. We conjecture that this leads to an important new skill for interviewers.
Apart from increasing willingness to participate, respondent data access and control are important from a measurement perspective. The choice between active or passive sensor data collection requires new methodology. We give one example. In the expenditure survey, respondents may submit scans of receipts. These receipts may be pre-processed, subjected to OCR (Optical Character Recognition) and classified using machine-learning after the survey is completed. The resulting classifications may or may not be returned to respondents. Showing results gives respondents insights in their expenditure. However, classification accuracy may only be around 80% to 85%, meaning that 15% to 20% of classified scans are incorrect. Respondents can be involved in checking and correcting those classifications in order to improve the accuracy of the data and future classifications, but this comes at the cost of extra burden.
Smart method effects may be caused when respondents do not have access to or are unfamiliar with smart features and smart tasks. Population undercoverage of sensors is especially an issue for external sensor systems, that is, sensors not included in mobile devices. When employing such sensors, survey designers are confronted with two decisions: One decision is whether they favor one model and type of sensor or accept the, potentially wide, range of user-owned sensors. A follow-up decision is whether they will provide respondents with a selected sensor. Different sensors may lead to a “sensor effect” that may give spurious differences between population subgroups or in time. Ideally, every respondent is provided with the same sensors, but this has an impact on recruitment strategies, survey logistics, and costs. Quality metrics are needed to support a trade-off between sensor accuracy, logistics, and costs.
Also, there is room to make smart surveys more efficient and thereby cost-effective when sensor systems are involved. In the use-case of physical activity, we noted that any smart surveys needs to start with a fairly traditional survey as a stepping stone to the smart element. Planned missing designs and adaptive survey sensor designs have not been explored, but can be used as methods to target only respondents that are “interesting” based on their survey responses. The subsampling may be stratified based on auxiliary variables available at the start, for example, the age of the sample person, and answers provided in the survey, for example, yes/no smoking and self-reported activity profile in a health survey. Given the costs of sensor measurements, an optimization problem follows that requires extension of existing sampling theory. Adaptive survey designs make explicit trade-offs between effort/costs and allocation of design features to different sample units. Four ingredients are needed: explicit quality and cost objectives, auxiliary data to distinguish different sample units, interventions/design adaptations, and optimization strategies. In smart surveys, the number of design features and possible interventions increase. Adaptive survey sensor designs may consider certain sensor measurements or sensor data for certain types of respondents only. In pre-assessments of the business case, it is imperative to also consider the full potential of statistical methods.