
Abstract
1. To Start
The questions raised in the title are (of course) more teasers than real research questions. I am not a sociologist. But even if I would be, then such questions are just too bold and too general to answer. However, remarkably, response rates have dropped at a similar pace for all age groups. Today’s response rates for the elderly, when invited to interviewer-assisted surveys at Statistics Netherlands, resemble those of twenty years ago. For instance, the response rates for persons sixty-five to sixty-nine years old were typically around 65% at the time before covid-19, which are similar to the response rates in the Netherlands in the nineties. Luiten et al. (2020) show that since the mid eighties the average drop in international response rates was 0.5% to 1% per year. This at least raises the speculation that we did not lose respondents, but we failed to encourage new respondents.
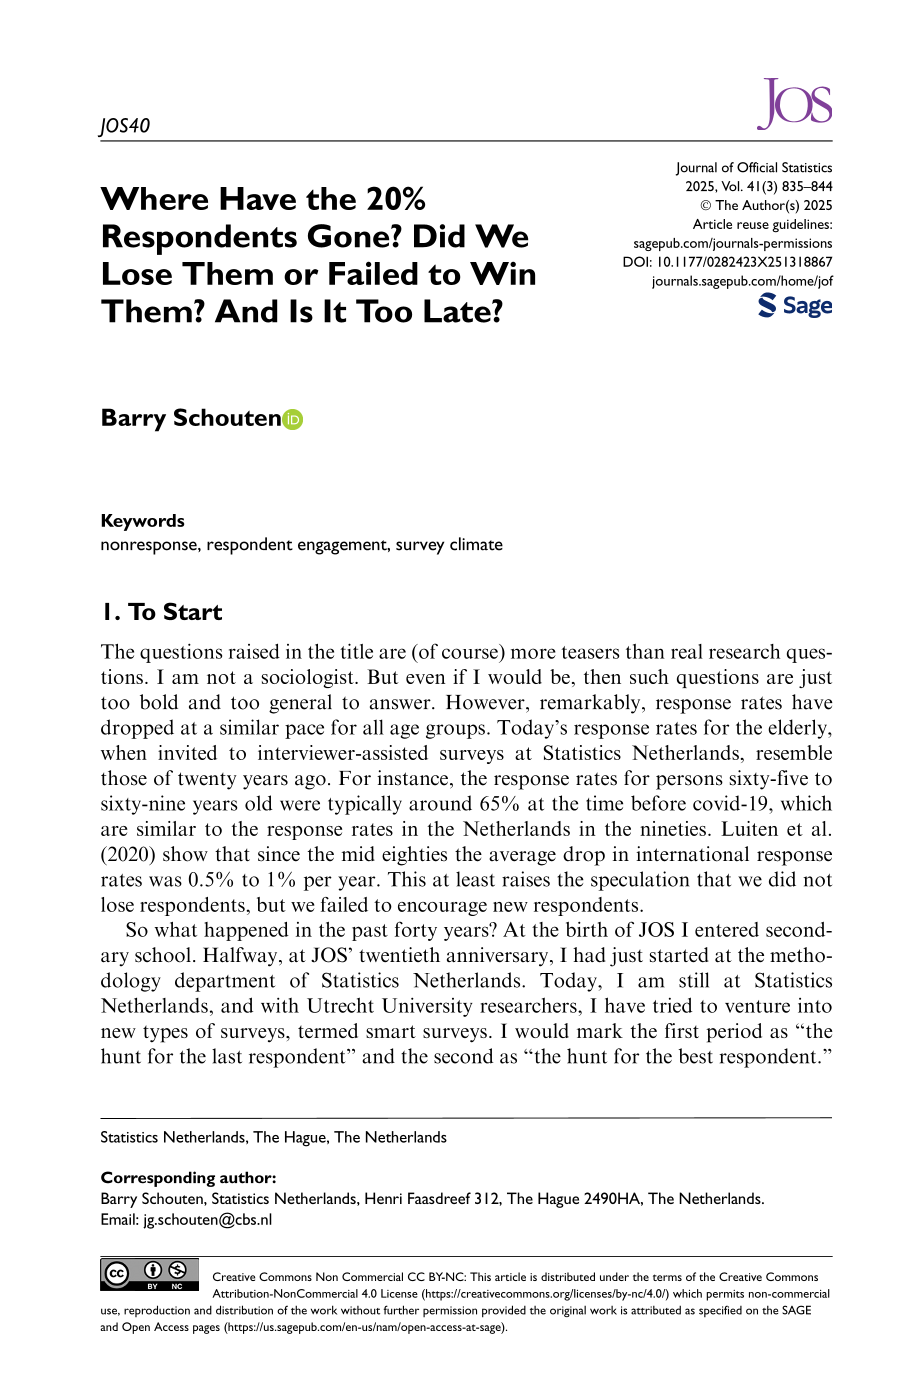
So what happened in the past forty years? At the birth of JOS I entered secondary school. Halfway, at JOS’ twentieth anniversary, I had just started at the methodology department of Statistics Netherlands. Today, I am still at Statistics Netherlands, and with Utrecht University researchers, I have tried to venture into new types of surveys, termed smart surveys. I would mark the first period as “the hunt for the last respondent” and the second as “the hunt for the best respondent.” I advocate to label the new period as “the hunt for the engaged respondent.”Table 1 gives a summary of what the world looked like for me at the three time points. It is subjective, but there are some keywords to take away from it. These are digital, online, anywhere-anytime, multi-channel communication, individual, computational power, population diversity. With some caution and with some time lag survey institutes have been trying to follow these changes.
Some Typical Features of the 80s, 00s, and 20s.
But has all context changed? Hardly. What has not changed are societal issues, public debate, and complex political decisions. In fact, some of these issues have become stronger such as environmental concerns, society segregation, and large-scale migration. So reasons to jointly think about where to go are, perhaps, even more needed than ever. Hence, one may question whether people no longer care. A look at the rise of more nationalistic and protective tendencies in many countries is an indirect evidence that general populations are opinionated. There may be a believe though that survey stakeholders and survey designers are not the ones that will bring change to these issues.
In the following sections, I will look at each of the three time periods.
2. The Hunt for the Last Respondent
For quite some years, nonresponse was more of a nuisance than a big problem. It was the time of the adjusters. The established sampling theory was modified to include unit-nonresponse. A regression estimator became a modified regression estimator and a Horvitz-Thompson estimator became an inverse propensity weighting estimator. The focus was more on the technique itself than on the auxiliary information contained in the adjustments. It led to seminal works such as Bethlehem and Kersten (1985) and Lundström and Särndal (1999).
For some reason, that I have never managed to fully understand, already in the nineties the response rates in the Netherlands were at levels of 60% to 65% that other countries only had much later. When I started, the Netherlands were by some called “world champion” in nonresponse. An illustrious honor that meant an upsurge of research activities and explicit programs.
However, response rates were on the decline in many countries. Only some five years after the birth of JOS, the International Workshop on Household Survey Nonresponse was established. It brought together the big names in survey research such as Bob Barnes, Bob Groves, and Lars Lyberg. The workshop had the sense of the “hunt for the last respondent,” a title that Ineke Stoop gave to her PhD dissertation in 2005. It brought together adjusters and reducers and led to a gradual shift from the adjusters to the reducers (who called the adjusters the “Greek people” because of the many formulas). In a number of field experiments “extreme” tactics were made available to interviewers. The objectives were to find the limit in what response rates could be achieved and whether that made any difference to statistics. Accounts of this are given in Voogt and Saris (2005) and Billiet et al. (2007). Interviewer tactics followed the ideas of tailoring and maintaining interaction, for example, Groves and Couper (1996).
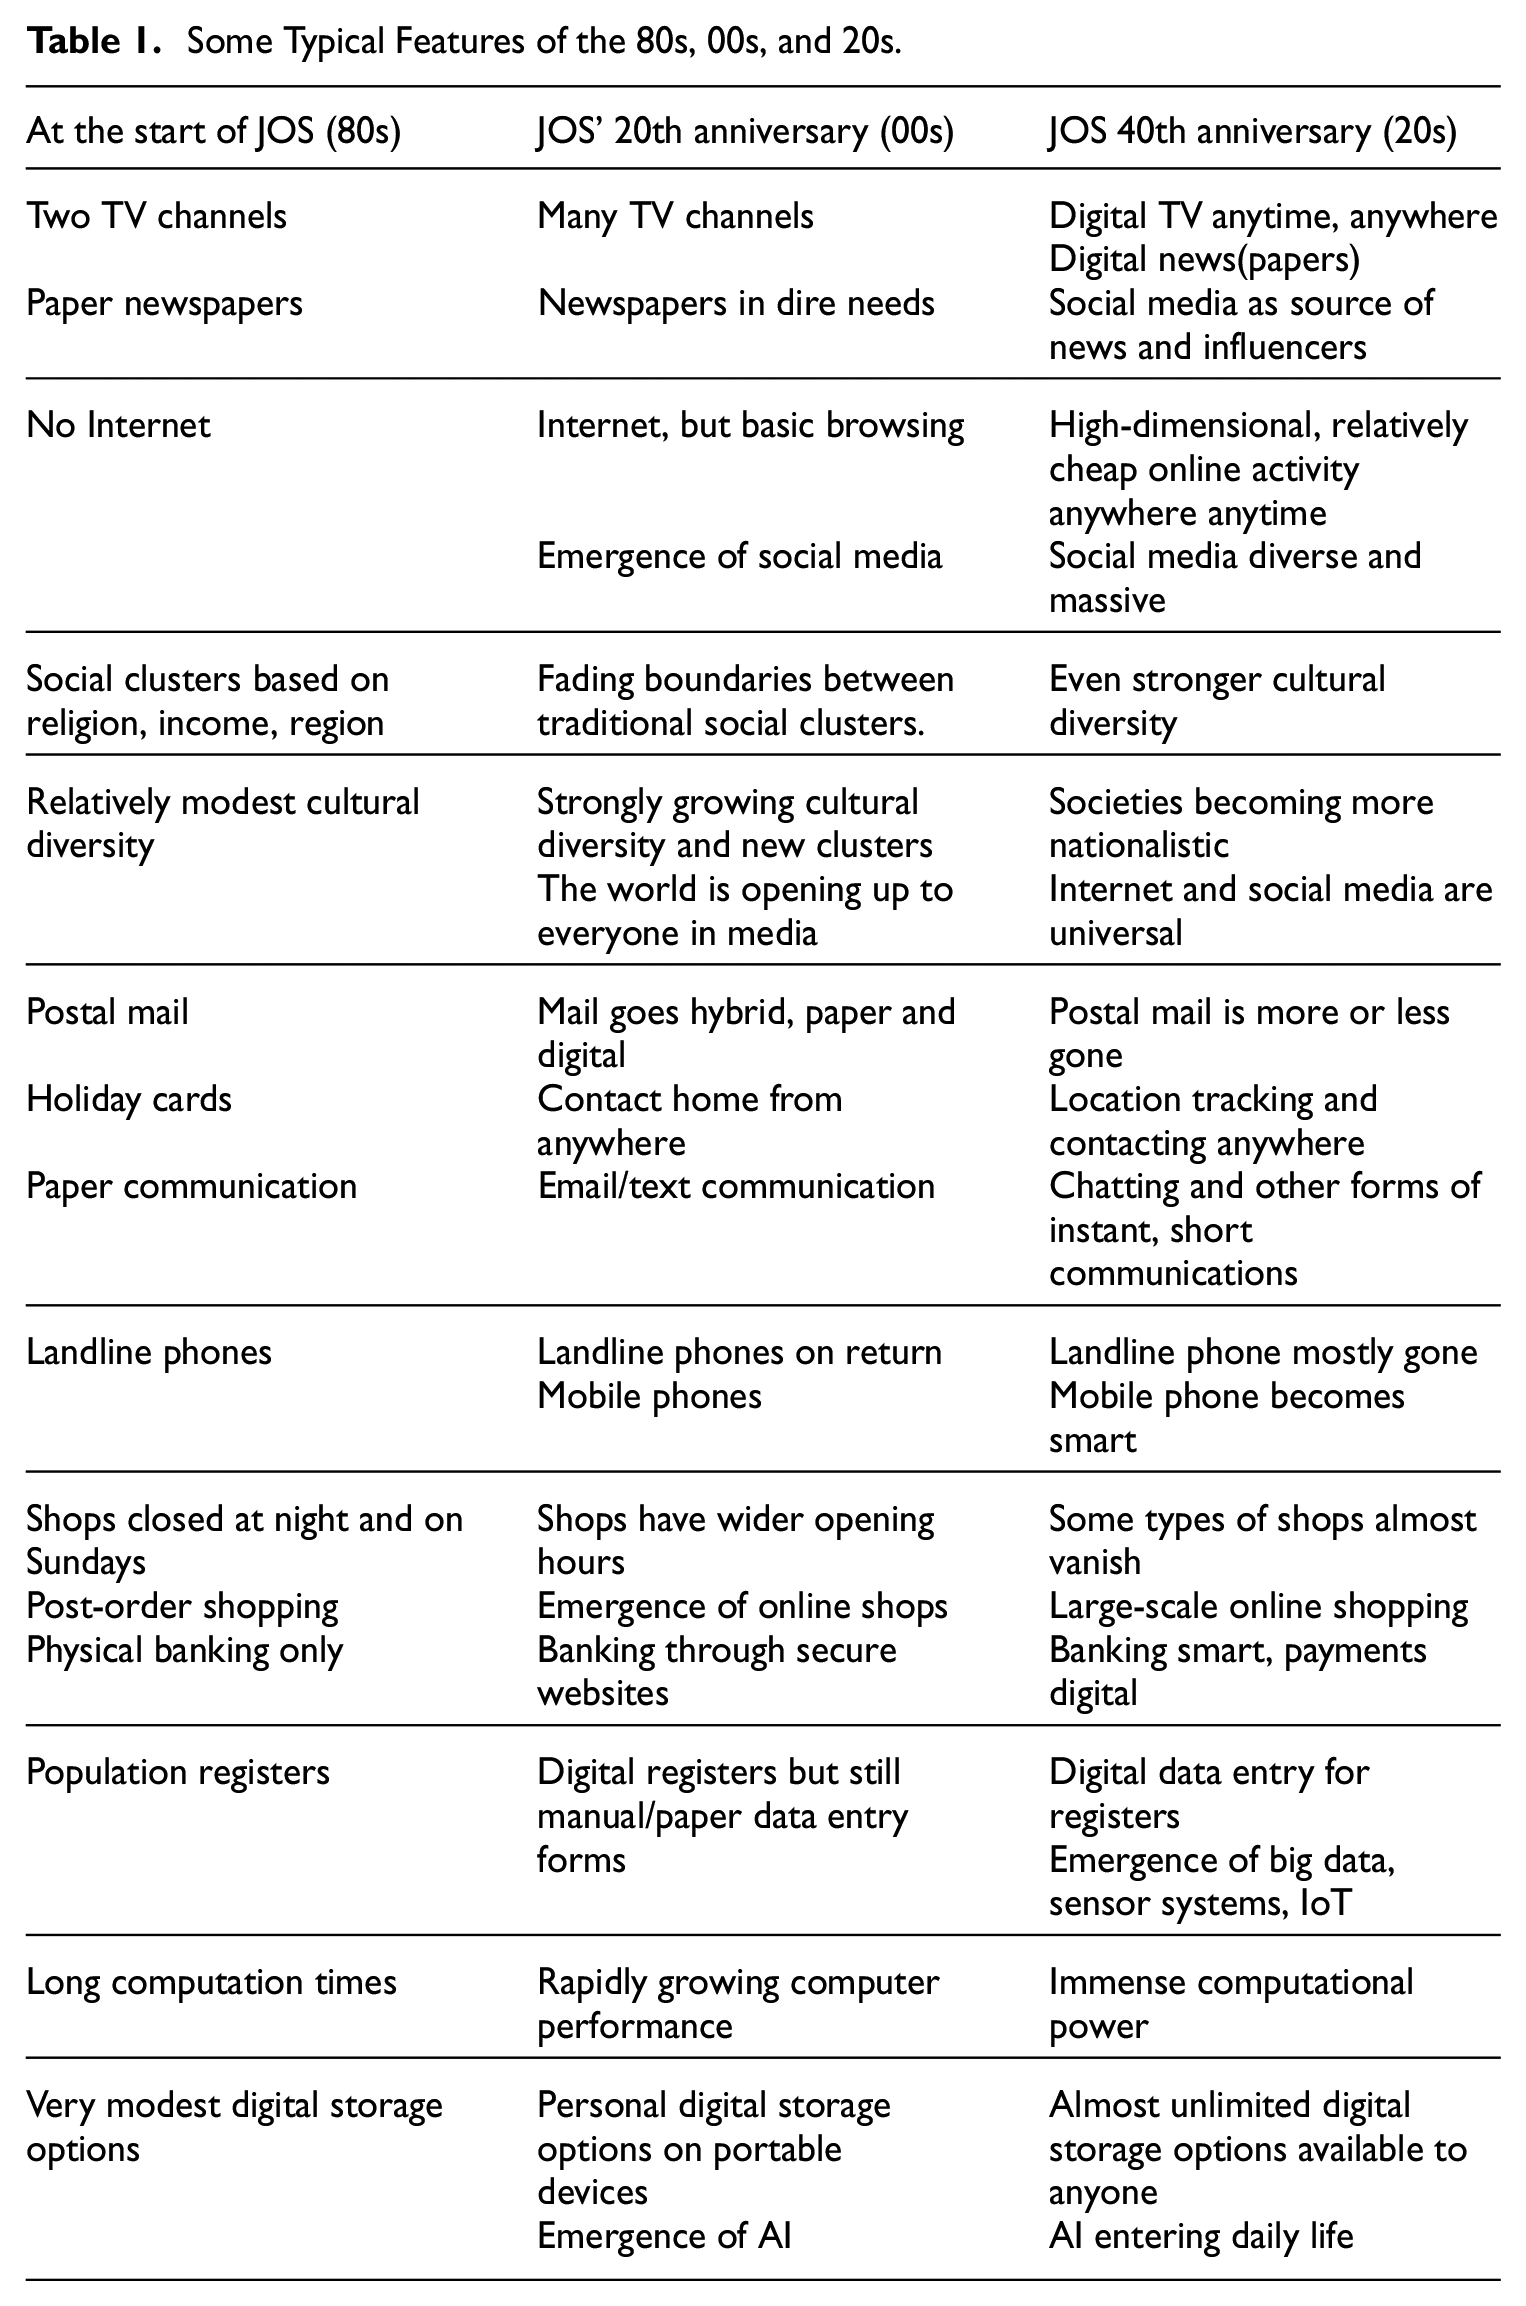
Statistics Netherlands had its own version of the hunt for the last respondent. In 2005, it fielded an experiment in the Labour Force Survey (LFS) with two experimental arms. In the one arm, the basic-question-approach was applied. Nonrespondents were offered a very short questionnaire. In the other arm, there was a call-back-approach. The best performing face-to-face interviewers were selected and they could offer large incentives and had a temporary low workload to optimally schedule visits. Table 2 shows the results in comparison to the regular LFS. The R-indicator estimates variations in response propensities across subgroups identified by linked administrative data. The coefficient-of-variation does the same, but penalizes low response rates. Statistics Netherlands had one source of comfort in their championship: the relatively large amount of linkable administrative data. In Table 2, the indicators are estimated for a basic and an extended set. The basic set consisted of age, migration background, urbanization, and the type of household. The extended set also had registered-(un)employment, region, average value of houses at ZIP-code level, various binary indicators for receiving forms of social allowance, and a binary indicator for having a registered landline phone. The call-back approach led to a strong improvement in representation, while the basic-question approach had little impact. In fact, the extended set of auxiliary variables showed that the basic-question-approach further increased contrasts. The experimentally achieved R-indicator of 0.85 and coefficient-of-variation of 0.09 for the extended set led us to the recommendation at the time that these should be benchmark targets in data collection. This recommendation was not taken. It was too early still for “hunting for the best respondent.”
Response Rate (RR), R-Indicator (R), and Coefficients-of-Variation (CV) for the Dutch Labour Force Survey (LFS) 2005 Regular, with a Call-Back-Approach and with a Basic-Question-Approach. R and CV Are Estimated for a Basic Set and an Extended Set.
The slow but gradual shift from adjustment to reduction was paralleled by sophisticated programs aiming at total survey design. Surveys were becoming more costly, especially due to efforts to convert nonrespondents. Budgets needed to be weighed against other design choices. A broader scope, such as explained for example in Dillman (1996) and Biemer (2001), was needed. It was advocated in the International Total Survey Error Workshop (ITSEW for short). It took a while, however, to move from the last respondent to the best respondent.
3. The Hunt for the Best Respondent
It became clear that a blind focus on more response was not going to work, if only because of survey budgets. It was the stepping stone to what I would call the era of the hunt for the best respondent. The ideas of tailoring were further advanced and the notion that a one-size would fit all was legitimately and explicitly abandoned. This shift was made possible by three developments. One development was the strong rise of Internet which was adopted as survey mode. It (allegedly) gave more “levers” to apply. The second development was the digitalization of administrative data. They allowed for the necessary differentiation in treatment, although not accessible in all country contexts. The third development was the advance of survey case management systems that allowed for faster and more manageable design changes. But it also allowed for the structured collection of paradata, an alternative source for differentiation.
The interest in differentiation also implied the rise of more specific workshops. Workshops on adaptive and responsive survey designs and internet studies/online research came up. The number of conference sessions on mixed-mode survey design and the use of paradata grew substantially.
A first step, and one that is still on-going, is forensics into the entire “(non)respondent journey.” Paradata were studied much more extensively and became important ingredients in survey monitoring dashboards. Good examples are Sakshaug and Kreuter (2011) and Lynn et al. (2014). While giving very useful insights, paradata tend to be weakly informative for self-administered survey modes. There is simply no sign of life for nonrespondents, making it hard to break down nonresponse into the main causes: non-contact, not able, language barriers, and refusal. It led to various comparative mode studies, for example, Vannieuwenhuyze et al. (2014).
A second step is formalization of “the best” respondent. Tailoring fieldwork, apart from levers and differential respondent behaviors, need indicators of yield and cost and a reproducible tactic to glue all those together. Response rates were supplemented with other indicators. The new indicators formed the basis for adaptation strategies, ranging from case prioritization to full mathematical optimization protocols. Schouten et al. (2011) and Lundquist and Särndal (2013) give accounts. Work in this area is still pending with growing sophistication, for example, Wagner et al. (2024). But, and this is an important achievement, it meant that reducers and adjusters became (re-)united. Both disciplines are needed.
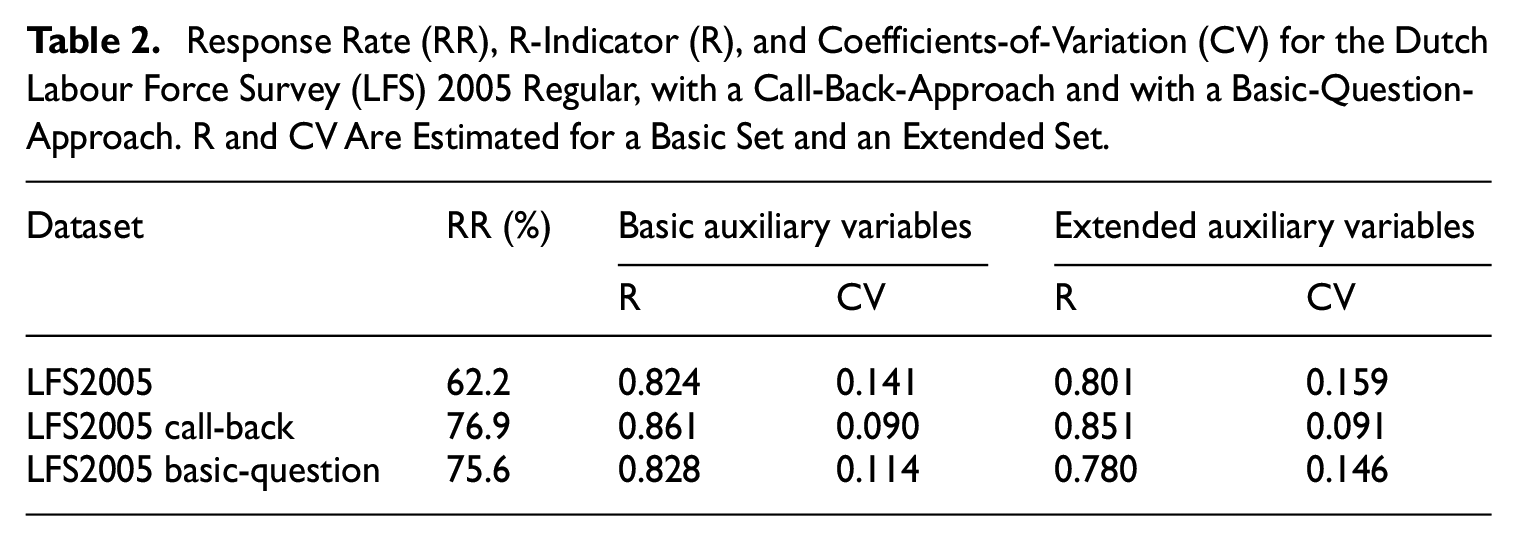
Statistics Netherlands adopted R-indicators and coefficients-of-variation. The coefficient-of-variation became the default objective function in adaptive survey design mathematical optimization problems. From 2018 on, household surveys were gradually converted to adaptive designs with the survey mode as main design feature. Table 3 shows the indicators for the Dutch Health Survey. The survey migrated from a face-to-face survey in 2010 to a web-face-to-face mixed-mode survey in 2011 to an adaptive mixed-mode survey in 2018. Table 3 confirms that response rates gradually drop. In the Health Survey this is in the interviewer-part. This is to a large extent due to the adaptive survey design that reduces effort for population subgroups that respond well to the web mode. The decreasing indicators, however, also hint at a web response that is becoming less representative. The interviewer modes make up for this in part. Representation deteriorates slower than response rates, because of the adaptive design, but the coefficients-of-variation point at more and more risk of bias.
Response Rates, R-Indicators, and Coefficients-of-Variation for the Dutch Health Survey in 2010, 2019, and 2023 for Web Only and for Web Plus Face-to-Face. The 2019 and 2023 Health Surveys Are Adaptive. In 2010 Also the Former Full Face-to-Face Design was Fielded in Parallel.
Despite the increased sophistication in survey data collection design, the “best respondent” design paradigm is cost efficiency. Most design changes, being mixed-mode and/or adaptive-responsive, reduce costs per sample unit. They do not aim at different or more effective strategies. Many implemented adaptive survey designs minimize the impact on representation when doing less, rather than doing more. Figure 1 reflects the vulnerability of such design efficiency. The adaptive survey design lost its power to better representation during the corona-pandemic.
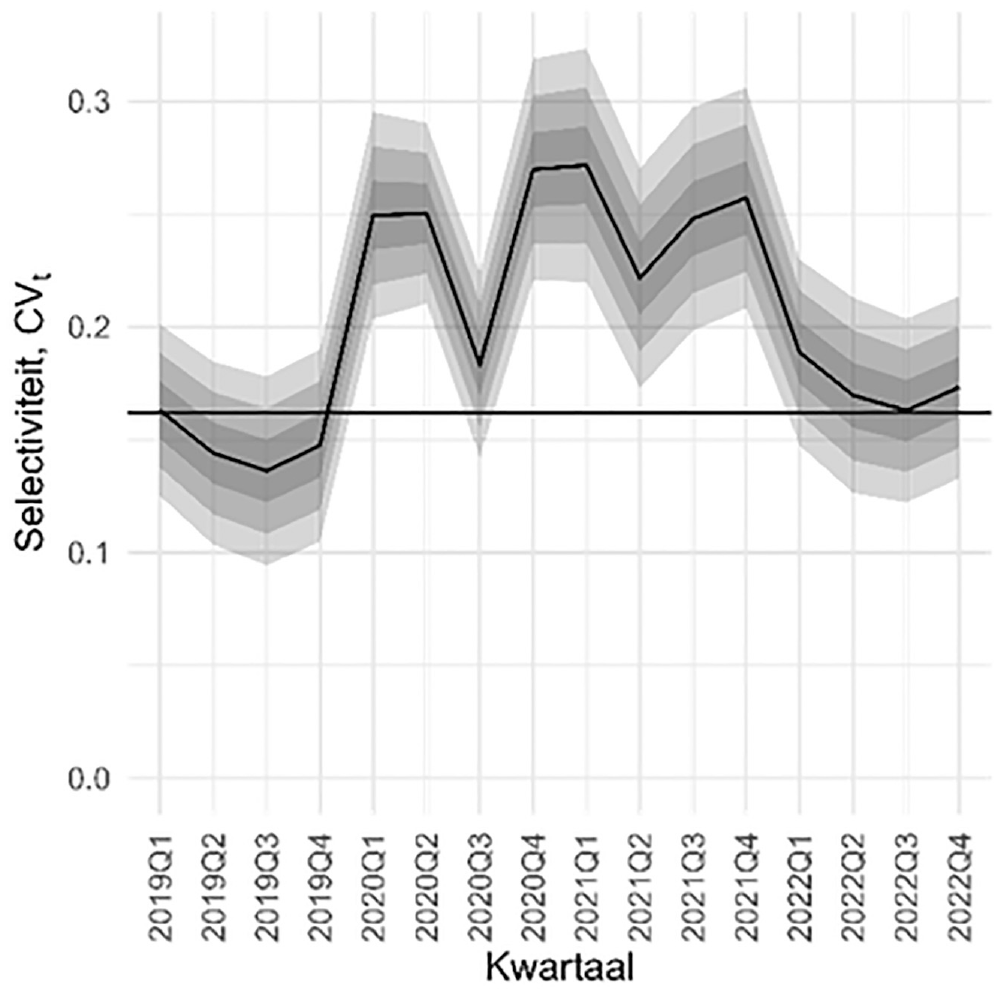
The coefficient-of-variation of the Dutch Health Survey between quarter 1 of 2019 and quarter 4 of 2022. 90% (dark gray), 95% (gray), and 99% (light gray) confidence intervals are given. The horizontal line is the historic benchmark value.
4. The Hunt for the Engaged Respondent
I would like to advocate that we move to a new era, the hunt for the engaged respondent. The key design recommendations, in my opinion, should be:
Be more relevant in the choice and format of statistics;
Become more explicitly and visibly disconnected from politics;
Use modern data collection tools but without being predictable and standard;
Adapt to the general population and not let the population adapt to us;
Collaborate internationally;
The last fifteen years have seen major developments in communication, computational power and technology. Smart devices, sensor systems, big data, Internet-of-Things, social media all are a result of this. Survey institutions and researchers have not been ignorant of this. They have started to incorporate them into the production of statistics. See, for example, Daas et al. (2015), McCool et al. (2021), Minnen et al. (2023), and Schouten, Lugtig, and Luiten (2025).
With the new developments, again the focus of workshops changed. There are still workshops on online research, but they now also include new ways of collecting data. The workshop on adaptive-responsive survey design lost its relevance. Instead there are workshops such as the Mobile App and Sensor Surveys (MASS) that gained interest.
But successes are still modest. Response rates of these new types of surveys are similar to their traditional counterparts. Schouten, Lunardelli, et al. (2025) performed a cross-country study to find out how general populations like to integrate smart features into surveys. Results are mixed. One conclusion is that tailoring and maintaining interaction cannot be done through invitation materials. The type of hesitations that respondents have and the guarantees that respondents look for vary greatly and depend strongly on the context. They cannot all be addressed without making materials scaringly long. There is, however, also good news. Table 4 presents two Statistics Netherlands’ studies that included “smart” forms of data collection: a two-weeks smart household budget survey and a one-week smart travel survey. In mailed invitation conditions, registration rates resembled that of traditional non-smart counterparts. There was the usual impact of the incentive amount, which flattened off after ten Euro’s. However, the personal invitation had a strong and lasting impact. The impact would likely have been higher if the corona distancing measures had not been in play. The good news is that a personal element, although being relatively modest, already had a quite strong impact.
Registration, Activity, and Completion Rates for Two Smart Survey Pilots, a 2018 Smart Travel Survey (TS) and a 2021 Smart Household Budget Survey (HBS). The TS Employed Randomized Incentive Conditions. The HBS Had a Randomized Mailed and F2F Invitation.
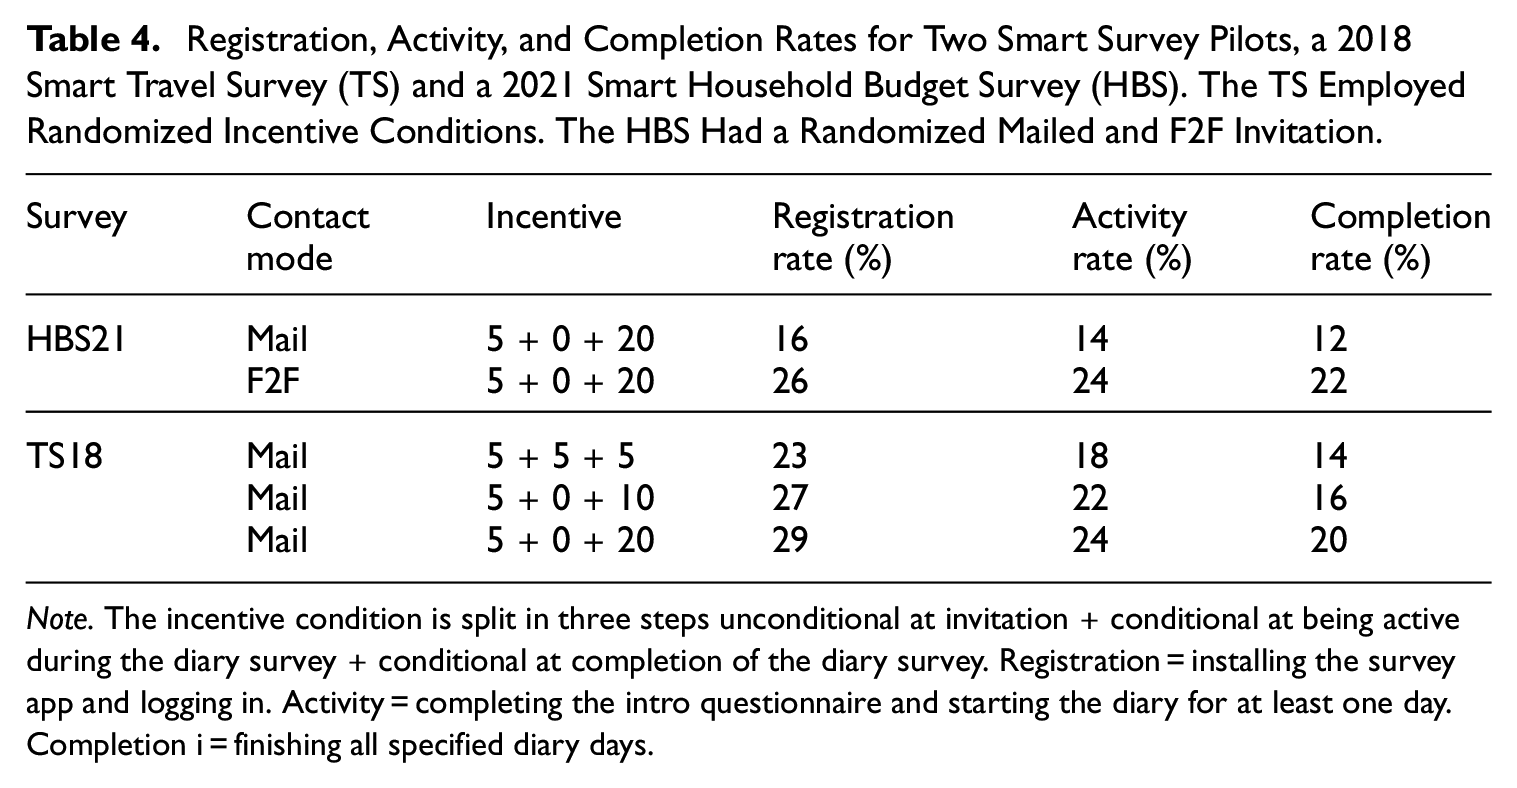
Note. The incentive condition is split in three steps unconditional at invitation + conditional at being active during the diary survey + conditional at completion of the diary survey. Registration = installing the survey app and logging in. Activity = completing the intro questionnaire and starting the diary for at least one day. Completion i = finishing all specified diary days.
In our hunt for the best respondent, we have been applying traditional tactics, but in a much more clever way. This is not sufficient in a world that is full of communication all the time, anywhere, and in many diverse forms. A world in which the relevance and influence of survey institutions may be unclear and potentially linked to authorities that may not be considered authorities. The survey message gets overwhelmed. Getting back to the recommendations: We should be demonstrably more relevant and more explicitly separated from politics. An option is to let the general population co-decide about earmarked survey budgets and be involved in the evaluation of survey results. Furthermore, the respondent should be at the heart of data collection in a modern but also authentically interested way. We need modern tools but with a human touch. In my opinion, the personal touch is imperative in order to show that we care. In all this, with geographical and cultural boundaries becoming stronger, more international collaboration is needed in developing tools and in advocating the survey message. JOS should, and probably will, remain relevant in doing so.
To end, I cannot give empirical answers to the questions raised in the title. However, given the changing world and the encouraging results of Table 4, I believe that we did not lose respondents, but we did not manage to win them. While somewhat grim as a conclusion, I do believe that we can win respondents if we dare to break with trends of cost efficiency and standardization. I would very much welcome an international workshop on engaging respondents.