
Abstract
In order to monitor the poverty scenario and its dynamics in lockstep with longevity trends around the world, we estimated and analyzed poverty-free life expectancy (PFLE) on EU-SILC data. Poverty-free life expectancy is the number of years an individual is expected to live free of poverty. Monitoring changes in PFLE is fundamental for understanding whether additional years of life are spent with good economic status and whether life expectancy is increasing faster than the increase in poverty. Indeed, the striking heterogeneity of mortality and poverty across the globe makes cross-country comparative analysis urgent.
1. Introduction
In recent decades, middle-upper income nations (Khokhar and Serajuddin 2015) have observed a notable decline in mortality rates across all age groups. This trend is driven by various factors, including advances in medical technology, preventive measures, healthier lifestyles, and improved living standards (Crimmins et al. 2010). Mortality rates have continued to decrease, particularly among older age groups (Vaupel 1997), leading to substantial increases in life expectancy at birth in middle-upper income countries. This sustained trend shows no signs of slowing and supports optimistic predictions about the upper limits of human life expectancy. The empirical evidence on mortality improvements presented by Tuljapurkar et al. (2000) and Zuo et al. (2018) challenges the pessimistic theories proposed by Olshansky et al. (1990, 2001, 2002, 2005) which suggest that human life expectancy may eventually reach a ceiling.
The improvement in health, economic prosperity, and overall well-being in middle-upper income countries is a major achievement of the modern era (Riley 2001). These accomplishments spring from multifaceted enhancements in various domains of society, continuous advances in medicine, nutrition, and technology being prominent examples. It is therefore imperative to investigate the links promoting enhancement of population well-being between different domains, an area of research that has been somewhat neglected (Edwards and Tuljapurkar 2005).
A rapid increase in the proportion of the population over sixty years of age may result in a concomitant rise in the prevalence of chronic diseases, particularly among the elderly. Conversely, fluctuations in longevity or health status may exert a significant influence on a country’s economic stability, particularly in relation to the sustainability of pension schemes (Oeppen and Vaupel 2002). Over the past century, there has been a notable increase in life expectancy across the globe. In high-income countries, past gains were largely attributed to a decline in infant and child mortality, whereas more recent improvements in mortality rates are observed at older ages (Kannisto et al. 1994).
An aging society is defined by alterations in the age structure of the population. It is imperative to understand the disparate ways in which these longevity enhancements evolve in order to formulate sustainable public policies tailored to specific nations and societies (Nigri et al. 2021). Larger gaps in life expectancy among subpopulations may imply wider disparities in social conditions, opportunities, services, and long-term sustainability goals. For example, longer life expectancies entail a need for longer periods of employment, with an increased proportion of individuals remaining in the labor force after age 65. This aspect requires a reframing to consider gender differences. The prospect of longer working lives will necessitate significant accompanying changes, including some related to education and health. In most countries, retirement age is not a significant differentiating factor between males and females in light of their different longevity. One likely consequence of longevity is an extension of employment at older ages, resulting in longer tenure. To mitigate the risk of widening inequities, governments must implement policies that address the interrelated issues of health, education, and employment. This will be crucial to ensure the future social sustainability of nations (Scott 2021).
While life expectancy is a crucial measure of longevity, it is not a comprehensive indicator of the diversity of lifespans or lifespan inequality, which can be significant (Van Raalte et al. 2018). The significance of lifespan inequality lies in its indication of individual uncertainty regarding the timing of death, which in turn influences life-course decisions. It also serves to gauge uneven advancements in mortality across the population (Bonetti et al. 2024; Nepomuceno et al. 2022).
In the field of health, comprehensive aggregate metrics have been developed to integrate diverse aspects of population health and facilitate overarching comparative evaluations of overall levels and trends. One such metric is healthy life expectancy, or health-adjusted life expectancy, which integrates data on age-specific mortality and the prevalence of disabilities associated with various sequelae of diseases and injuries (Sanders 1964). This metric aggregates the aforementioned data into a single index that reflects the number of years an individual is expected to live in good health based on prevailing patterns of mortality and morbidity.
Such estimates have been used by policymakers to identify and delineate health disparities between and within regions. These estimates also serve as a consolidated outcome measure in research investigating the correlation between policies and population health. In contrast to the comprehensive metrics in population health, there is a dearth of measures that provide high-level comparative assessments encompassing economic well-being, health, and other developmental dimensions useful for policymaking guidance (Alaimo et al. 2024; Levantesi et al. 2023).
In this paper, we refine the concept of poverty-free life expectancy (PFLE) to mirror the disability-free counterpart in the field of public health studies. With respect to a preliminary description by Riumallo-Herl et al. (2018), our proposal provides a wider, extensive, and exhaustive perspective on the theme, and in-depth discussion on the poverty and longevity domains of the measure.
Poverty-free life expectancy is the expected number of years of remaining poverty-free life a member of the life-table cohort would experience if cohort age-specific rates of mortality and poverty prevailed throughout his/her lifetime. The idea is to merge the period life table with the age-specific poverty prevalence obtained from official cross-sectional survey data. In particular, Sullivan’s method simply partitions the total number of person-years lived into poverty and poverty-free life expectancy. In order to compute our measure, we exploit the Head Count Ratio (HCR) as a proxy of poverty prevalence. For this purpose, we use the EU-SILC (Statistics on Income and Living Conditions) survey conducted in EU member states and other European countries. Samples consist of about 450 variables containing information on demographics, income, and living conditions, see for example, Eurostat (2023a). Most notably, EU-SILC serves as a basis for measuring risk-of-poverty and social cohesion in Europe. We use two different “versions” of the
Our data on longevity was from the Human Mortality Database (HMD 2024; Barbieri et al. 2015), which contains original calculations of death rates and life tables for national populations. The input data was death counts from vital statistics, census counts, birth counts, and population estimates from various sources. A detailed description of the methodology is available on the HMD website, methods protocol section.
Poverty-free life expectancy (PFLE) is a recent metric that measures the average number of years a person can expect to live free of poverty. It provides a composite measure of population health and economic well-being, emphasizing the significance of ensuring that years of added life are lived with at least a minimum standard of economic well-being. PFLE can be employed to identify disparities in economic well-being and health between and within countries. It can also be employed to monitor the advancement of poverty alleviation and health enhancement, and to provide insights and benchmarks for policies aiming to advance health and economic well-being. The PFLE metric is a valuable tool for elucidating the intricate links between poverty, health, and economic development. It can be used as a pertinent instrument for the compilation of official statistics, for tracking progress toward the SDGs, and for the formulation of policies that seek to eradicate poverty and to foster well-being.
The remainder of this paper is structured as follows: Section 2 presents the method used to derive the PFLE measure and the results for each country. Section 3 contains a preliminary analysis of the poverty prevalence and the estimated PFLE for European countries. A discussion of the results is left to Section 4 while Section 5 provides a concluding summary and suggests avenues for further research.
2. Methods
Let us consider a person aged
In order to easily depict the overall longevity process, we exploit summary demographic measures as the period life expectancy (hereafter life expectancy), usually calculated at birth. Life expectancy at birth refers to the expected average age at death for a synthetic cohort of newborns, who experience the mortality risks of a given period throughout their lifespan. The life expectancy at birth is defined formally as

and it is the most widely used indicator of longevity and one of the Laeken indicators of social inclusion (Graf and Tillé 2014; Graf et al. 2011).
Let

However, the formulation in Equation (2) assumes that mortality is a continuous process but the data is typically recorded in a discrete form. To approximate the continuous-time mortality process we therefore need to exploit the period life table model (Preston et al. 2000) and use Sullivan’s method (Sullivan 1971) to compute the PFLE.
Such discrete approximations and estimating procedures are widely used in demography in order to obtain the survival function for all real ages
The crucial part in estimating the PFLE is, therefore, to estimate the probability of an individual aged
When the data comes from a sample survey like EU-SILC, the HCR is estimated from data. The HCR is estimated as the sum of the sample weights

where

If the survey involves households instead of individuals, a person’s equivalized disposable income is defined as his/her total household disposable income divided by equivalized household size. Equivalized household size is defined by the so-called equivalence scales.
Therefore, for a given country, if

where

In practice, the first step to take in order to obtain Equation (5) is to join the HMD with the data from the EU-SILC survey waves, maintaining consistency between the distribution of age-classes and the periods of the analysis. In what follows, the set of age-specific prevalence of poverty have been estimated using the data from the EU-SILC survey from year 2007 to 2019. To define the age-classes we used the classes
3. Results
We now present the results of the estimates obtained from the available data. The datasets, concerning mortality and poverty prevalence, provide age classes starting from birth, thus allowing integration of the survival function from age 0. This enables estimation of PFLE at age 0, that is, we calculate
Also, we use the notation
Figure 1 reports
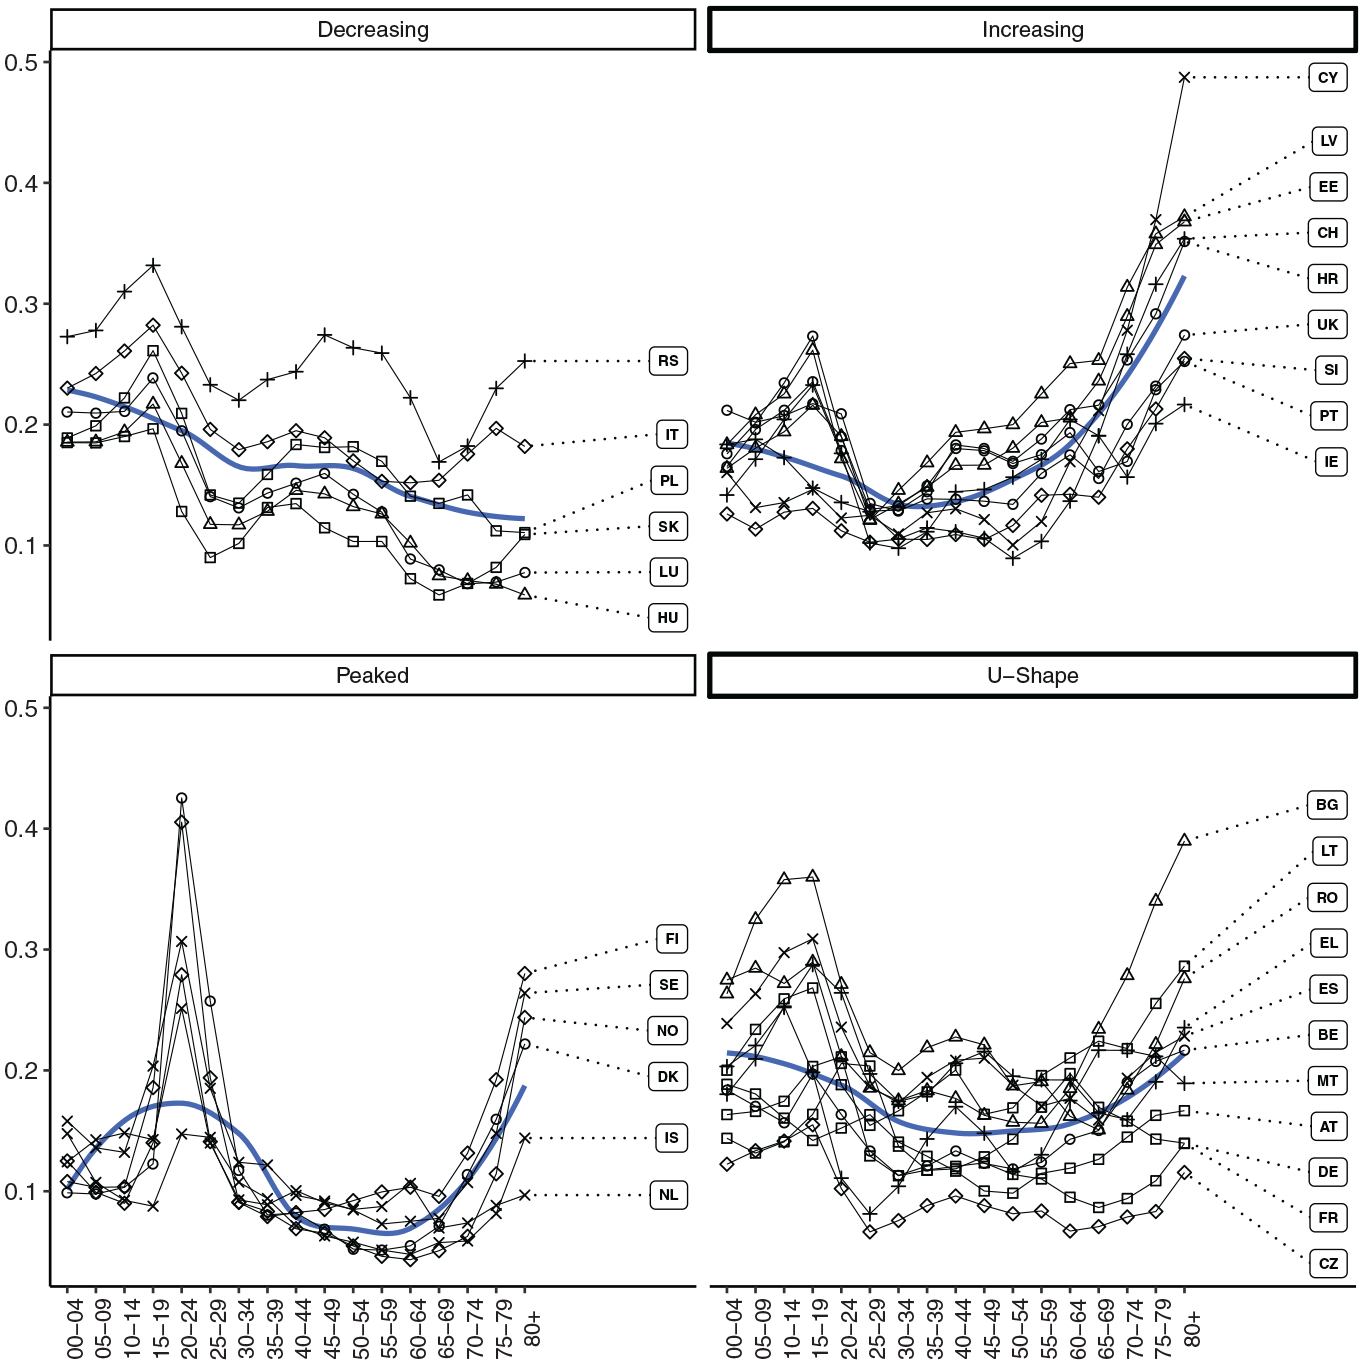
Age-class specific estimated Head Count Ratios using 60% of the median (average 2004–2019).
Figure 2 shows the prevalence of poverty based on
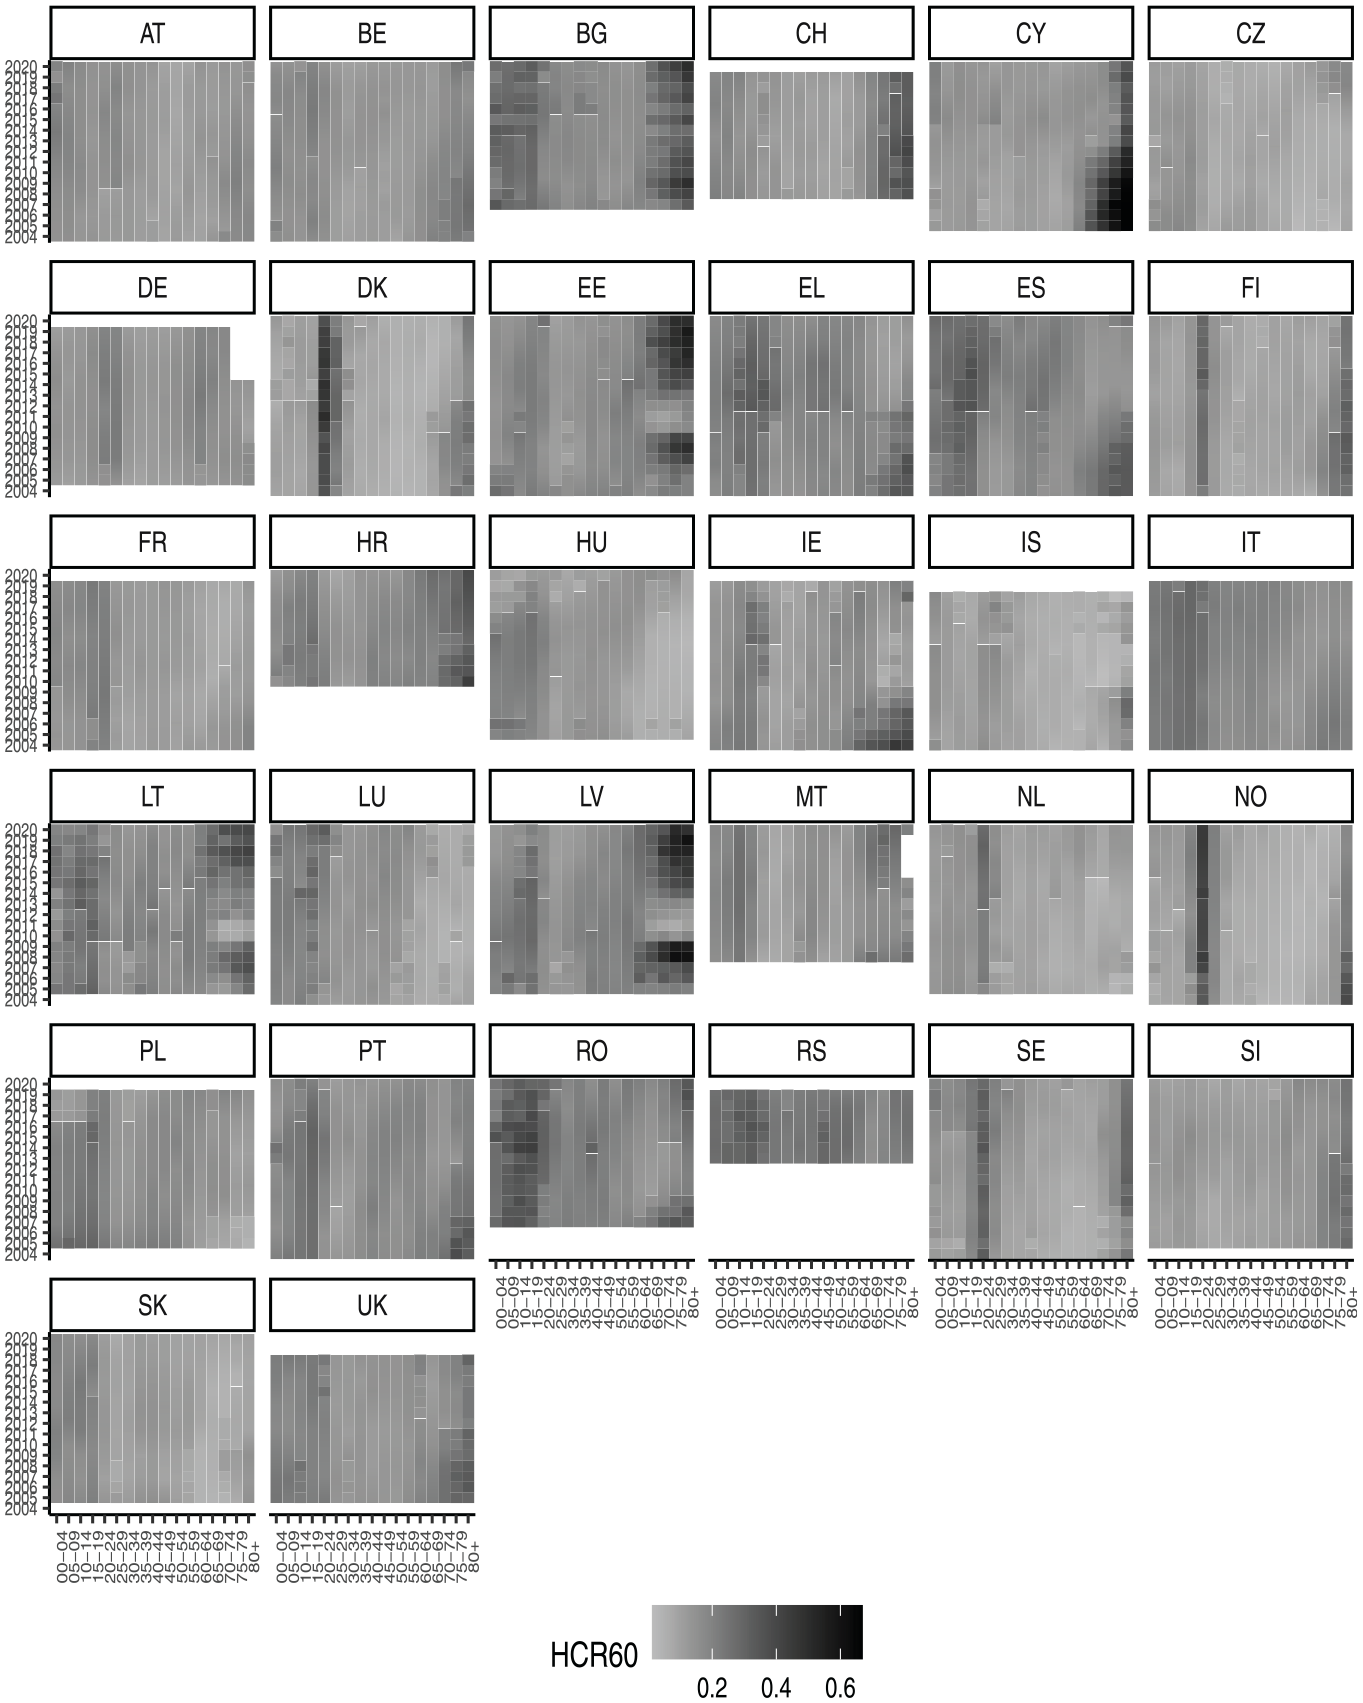
Estimated Head Count Ratio heatmap.
This preliminary analysis of poverty prevalence is important for understanding the poverty-free life expectancy results shown below. Indeed, the higher the prevalence of poverty in a given age group, the less that group is expected to live free from poverty.
Figure 3 shows PFLE estimates for all countries from 2007 to 2019. The different definitions of poverty are reflected by the different trajectories of poverty-free life expectancy. When we use 40% of the median of incomes as poverty threshold, that is, poverty prevalence
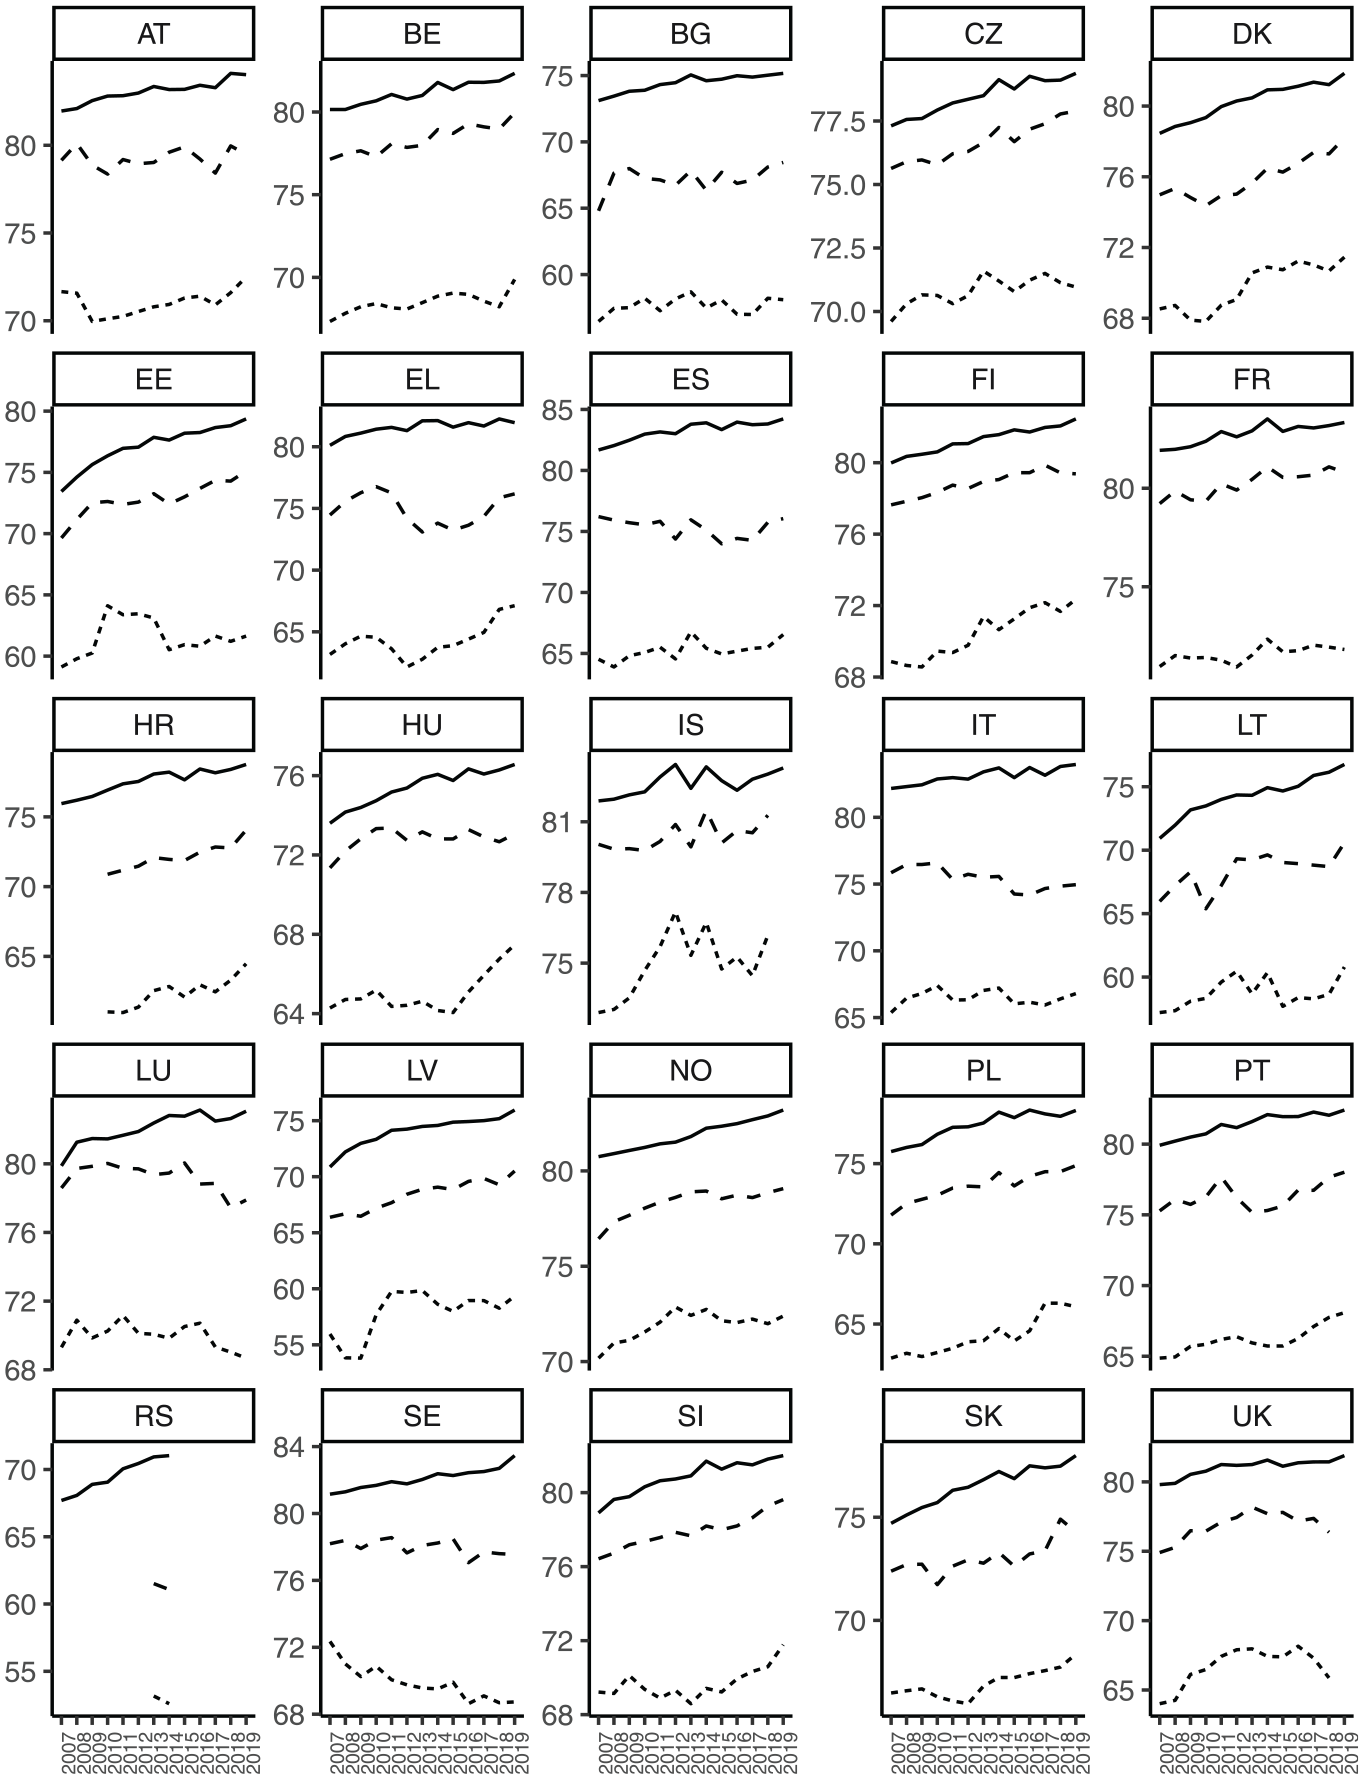
Life expectancy (solid line) and poverty free life expectancy: 40% of the median (long-dashed line), 60% of the median (dashed line).
As the figure shows, we were not able to estimate PFLE for all countries/years because for some years we did not have—or could not compute—the head count ratios. The reader may also notice that some countries are missing. For example, although we had estimates of the prevalence of poverty for Germany, we needed this data for all age-classes in order to compute the PFLE. For countries like Russia and Hungary we could not obtain a complete series. This was more evident for Russia, where we could only calculate PFLE for 2013 and 2014.
An interesting feature of Figure 3 is that PFLE does not necessarily vary with/mirror life expectancy. Nor was the gap between
The sensitivity of the proposed indicator to different poverty thresholds, and thus to varying definitions of poverty, may initially seem counterintuitive since the indicator is newly introduced and not yet widely used. However, for experts in the fields of demography and official statistics, the result is not surprising. In fact, it aligns with what we see in the case of disability-free life expectancy (DFLE). With the DFLE indicator, we observe a similar sensitivity to different definitions of disability (Jagger and Robine 2011). If a definition of severe disability (people with a severe limitation) is used, it impacts the prevalence measure (HCR in the case of poverty), resulting in a smaller difference with respect to the life expectancy estimate. Conversely, when our definition is non-severe disability (people with a limitation), that potentially affects a bigger share of the population, the impact on DFLE is different. Indeed, considering Equation (2), where we have
Figure 4 reports the averaged difference between life expectancy and PFLE over the years considered in ascending order. We notice that different definitions of poverty, or equivalently, use of the two different Laeken indicators to build PFLE yielded two different rankings of countries. Again, the gap between life expectancy and PFLE was sensitive to the definition of poverty that we adopted. However, caution is warranted in interpreting this Figure as a comparison of countries. For example, to say that people spend fewer years in poverty in the Czech Republic (CZ) than in Portugal may be misleading because poverty lines are relative. Such comparisons would be more consistent using a single poverty line instead of a relative country-specific line. Qualitatively speaking, this effect may be less, although it may be not negligible, as we are looking at differences averaged between age-groups and years.
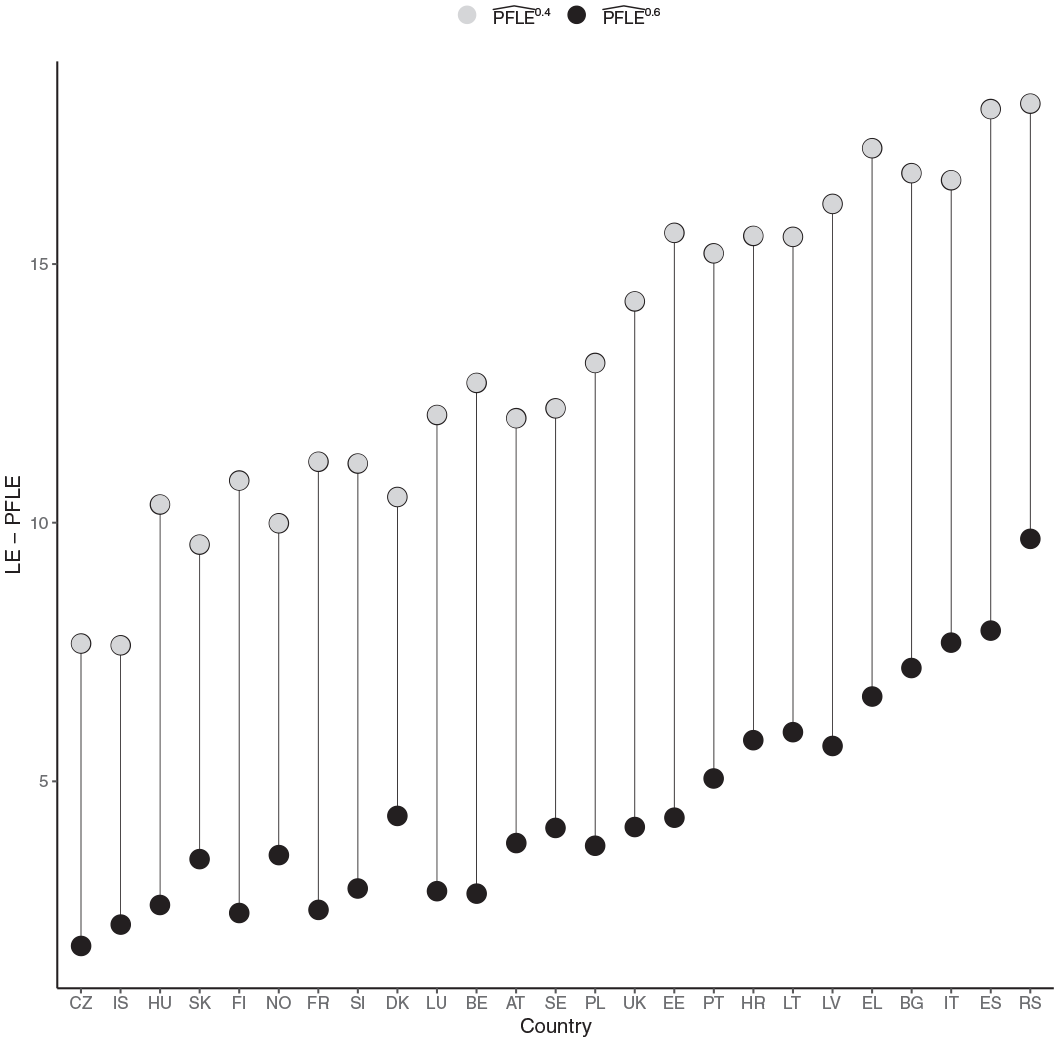
Average poverty free life expectancy for available European countries.
4. Discussion
When a longevity or more generally a demographic indicator is proposed, a common way to improve and complete the analysis is by a decomposition study. The decomposition method allows us to attribute the ages and causes responsible for changes in an indicator (such as life expectancy, lifespan inequality, disability-free life expectancy, etc.) between two periods. It relies on the assumption that the dependent variable (e.g., life expectancy) is a differentiable function of the covariates (age-cause-specific death rates) and that their effects are additive. It also leverages the assumption that covariates change gradually along a dimension (e.g., time), and is therefore appropriate for decomposing time trends. In this section, we provide a wider discussion of the potential benefit of decomposition applied to PFLE and the reason for excluding this analysis in the new indicator. The decision was driven by recognition of the significant challenges and limitations associated with such an approach. Decomposition methods are indeed beneficial for providing a granular understanding of how various factors contribute to changes in overall measures like PFLE. These methods can differentiate the impacts of different variables and guide targeted policy interventions (Horiuchi et al. 2008; Nusselder and Looman 2004; Shkolnikov and Andreev 2017; Shkolnikov et al. 2022).
However, it is important to consider the existence of endogeneity between poverty and mortality. This crucial issue complicates the validity of such decompositions. As a result, mortality rates and poverty levels are not independent but intricately linked, each potentially influencing the other. This interdependence introduces complexities that undermine the straightforward application of decomposition techniques. Specifically, it is a challenge to accurately isolate the effects of poverty from those of mortality when the two are mutually reinforcing. Additionally, variability in the relationship between poverty and mortality across contexts—for example, by country or gender—further complicates the decomposition process, making it difficult to draw reliable conclusions. Given these considerations, we determined that decomposition analysis could lead to misleading or less meaningful results unless the endogeneity of poverty and mortality is properly addressed.
As suggested by an anonymous reviewer, we therefore focused on estimating PFLE without a decomposition exercise. Regarding the robustness of PFLE, we believe that using the two Laeken indicators yields robust estimates of poverty prevalence, as both are calculated using the median of the distribution of income. In fact, sometimes poverty prevalence may be estimated using the mean of the distribution, resulting in poverty lines that are sensitive to outliers. This approach is coherent with keeping the present analysis accurate and interpretable. By concentrating on PFLE, we provide a clearer picture of life expectancy in relation to poverty, without the added complexity and potential inaccuracies introduced by decomposition. This adjustment maintains the integrity of our findings while acknowledging the inherent difficulties of decomposing the factors contributing to PFLE.
4.1. PFLE in Official Statistics
As mentioned here, poverty-free life expectancy (PFLE) is a new indicator that quantifies the average number of years a person can expect to live free from poverty, given existing mortality and poverty prevalence rates. In line with the principles of official statistics, PFLE provides crucial elements for a society in constant evolution, offering the Government, the economy, and the public information about the economic and demographic situation. Given its nature, which is rooted in data from official statistical sources such as Eurostat, PFLE could become a key indicator in the data warehouses of national statistics offices. Indeed, the PFLE metric can gain a key role in official statistics as a tool for monitoring progress toward the Sustainable Development Goals (SDGs), particularly Goal 1 (No Poverty) and Goal 3 (Good Health and Well-being). It offers a comprehensive perspective on population well-being by integrating health and economic dimensions; this makes it more informative than traditional measures that focus solely on mortality or poverty. Below we highlight some points where the proposed indicator can be useful for official statistics: (i) PFLE provides a powerful metric for tracking progress in reducing poverty and improving health. It allows policymakers to assess the impact of their policies on health and economic outcomes, highlighting the interconnectedness of these two dimensions. (ii) PFLE can reveal disparities in economic well-being and health between and within countries. This information can be used to target interventions for vulnerable groups and to design policies that address the root causes of poverty and poor health. (iii) PFLE can provide insights into the relative importance of different policy interventions, such as investments in healthcare, education, and social safety nets. It can also help policymakers prioritize policies that will have the greatest impact on improving PFLE. Overall, PFLE offers a more holistic and nuanced approach than traditional measures to measuring population well-being. Its incorporation into official statistics is essential for effective monitoring and evaluation of progress toward the SDGs and other global development goals.
5. Conclusions
Here we estimated poverty-free life expectancy for European countries using EU-SILC data. Although we are not the first to introduce this index, the novelty of our approach lies in being the first to estimate it for more than one year, obtaining a time series of poverty-free life expectancy from 2007 to 2019. Apart from that, our approach is different from that of Riumallo-Herl et al. (2018) as we do not use an international poverty line, but estimate a poverty line for each country. Using an international poverty line may be useful for benchmarking, for example in measuring progress toward SDGs, however, Canudas-Romo (2018) have pointed out methodological limits. On the contrary, national poverty lines make our analysis less sensitive to biases for measuring progress within countries. Also we differentiate by Riumallo-Herl et al. (2018) in that the mortality data used are of fairly uniform high quality, and poverty prevalence comes from a unified survey instrument.
A drawback of using intra-country analysis may lie in the choice of the poverty line. In order to calculate the PFLE, a measure of poverty prevalence is needed. The poverty prevalence, being the proportion of people living under conditions of poverty, therefore depends on the definition of poverty. We addressed this sensitivity with two different definitions of poverty prevalence, corresponding to two Laeken indicators, namely head count ratios using 60% and 40% of the median of the distribution of disposable income as the poverty line. We noticed that the expected number of years of living poverty-free is very sensitive to the way poverty is defined. It is not our goal to delve into this topic here. The measures of prevalence are two Laeken indicators, and therefore official statistical measures. The PFLE can be adapted from the “crisp” formulation of poverty (see Lemmi and Betti (2006)) presented here to include other measures such as the poverty gap or severity, which would lead to more nuanced values of poverty-free life expectancy. It may also be tempting to work with a fuzzy approach to poverty that goes beyond such simplistic definitions.
Another issue raised by Riumallo-Herl et al. (2018) is that if poverty is distributed at birth and persists for the entire lifespan of all those affected, it is incorrect to conceptualize PFLE as the average number of years a person can expect to live free from poverty, because a fraction of the population lives their entire lives free from poverty and the remainder lives their entire lives in poverty. The authors stress that this interpretation is less apt in settings where the risk of poverty is highly concentrated and persistent, as opposed to broadly dispersed and dynamic. Having at hand many years of data, we can offer some insights on this aspect. For example, we noticed that poverty prevalence is distributed in subgroups of individuals, not randomly over age groups (Figure 1).
A remaining open question that may influence the interpretation of the index is the extent to which individuals can move into and out of poverty over time. A possible line of research is therefore to work on simulations using models of transitions of population beyond the poverty line and income distributions. In this regard, Markov models to quantify status transitions between living in and out of poverty, and from each to death, would be an interesting field to study. However, despite the potential interest of this analysis, its implementation is tedious and not straightforward. Although EU-SILC provides individual-level data with simultaneous information on mortality and poverty, the first varying with the second, it has a panel structure that involves sample rotation. To observe a within-individual transition, we can match data from two adjacent years to estimate multistate parameters with this data. It is more tedious than some other sources, but still can be quantified.
Footnotes
Acknowledgements
The authors wish to thank the two anonymous reviewers and the associated editor. Their suggestions made this paper to improve far away from its previous version.
Funding
The author(s) received no financial support for the research, authorship, and/or publication of this article.
Received: June 5, 2024
Accepted: January 10, 2025