
Abstract
Shifts in household consumption feed into euro area inflation via the annual updating of product weights. The partial effect of weight changes on inflation is not quantified by statistical offices. We therefore propose a decomposition of the inflation rate, measured by the annual percentage change of the Harmonised Index of Consumer Prices (HICP), into the overall price change assuming weights at the previous year’s level and a weighting effect. We discuss this decomposition against a decomposition into pure price change and quantity effects. Our empirical results show that euro area inflation has been noticeably impacted by weighting effects since 2021. Before 2022, we observe a close relationship between weighting and quantity effects. As weighting effects can be calculated without delay from publicly available HICP data, we argue that this decomposition is relevant in terms of providing timely information for analysts and monetary policymakers.
1. Introduction
The coronavirus (COVID-19) pandemic has renewed interest in the weights underlying consumer price indices (CPIs). Designed to describe overall price developments, CPIs are based on a basket of goods and services which is deemed to be representative of households’ consumption patterns. The pandemic has had a considerable impact on consumption patterns and, thus, the weights underlying CPI compilation. The impact of these weight shifts on inflation is usually not measured by statistical offices (see Stahl, 2024, for an exception).
In the present paper, we propose a way to quantify the effect of changing weights on the inflation rate, measured by the year-on-year percentage change of the Harmonised Index of Consumer Prices (HICP). We decompose the officially published inflation rate into a price change component, assuming HICP weights are kept constant at the previous year’s level, and a weighting component. This decomposition is worth looking at from a practitioner’s point of view, though it deviates conceptually from a decomposition of the inflation rate which disentangles the pure price changes from the effect of changing quantities in the consumer basket (henceforth called quantity component). To be precise, the pure price change component measures the contribution of changing prices to HICP inflation assuming that the previous year’s basket of goods remains unchanged. While this second decomposition appears to be the natural choice based on the idea that price indices are constructed to separate out the “price part” from a value index (e.g., ILO et al. 2004, 264–5), the first decomposition facilitates comparisons across euro area countries and over the full history of the HICP.
We apply both decompositions to publicly available HICP data. Our main conclusions are the following. First, before 2021, HICP inflation is generally very close to the overall price change using constant weights. This is evidenced especially for the euro area, where weighting effects are found to be almost always marginal. In individual euro area countries, inflation rates are affected by weight shifts to a recognizable extent from time to time. Second, the COVID-19 crisis induced weight adjustments, which resulted in substantial weighting effects in euro area inflation during 2021. Third, except for the years 2022 and 2023, weighting effects which build on shifts in official HICP weights from one year to another tend to closely approximate quantity effects.
The remainder of the paper is set out as follows. In Section 2, we sketch how weight compilation rules and practices have evolved since the start of the HICP and what this implies for inflation measurement and interpretation. In this section, we also illustrate the HICP weight changes of euro area countries and provide an overview of related literature. In Section 3, we lay down the methodological framework and derive the decompositions of HICP inflation into price change and weighting components as well as pure price change and quantity components. In Section 4, we present the empirical results for the HICP of the euro area, France, Germany, and Italy. Section 5 draws conclusions.
2. Weight Changes and Their Relevance for HICP Measurement and Interpretation
In the cost-of-goods-index (COGI) concept underlying the HICP, inflation is intended to measure the change in the total amount of money which has to be paid for a fixed bundle of goods and services at two points in time (i.e., “pure” price change). Quantity effects are therefore conceptually excluded. The purpose is to measure the total and exclusive contribution of individual price movements to a change in a value index. However, the inflation rate measured by the annual percentage change of COGI-type CPIs is affected by changing quantities when the underlying basket of goods and services is updated in order to keep it representative. These basket-related effects mean that inflation does not always and exclusively reflect pure price changes.
According to the HICP Framework Regulation (European Union 2016), the HICP is a chained Laspeyres-type index where weights reflect the expenditure shares of goods in a period prior to the price reference period but which are “adjusted to reflect the prices of the price reference period” (European Union 2016, Art. 2 (14)). The definition lacks rigor with regard to weight compilation. Given the various traditions of CPI compilations then prevailed in European countries (see Knetsch et al. 2022 and Balk 2008, Sect. 3.9 for details), this was intended from the outset because Eurostat and the National Statistical Institutes (NSIs) were forced to “find a compromise between ‘fixed’ and ‘chained’ indices” (Astin and Sellwood 1997, 7) in order to create a harmonized index that guides monetary policy in the euro area.
In the beginnings of the HICP, the European Commission Regulation (European Commission 1997) prescribed only minimum standards regarding weight compilation (see e.g., Astin 2021, Sect. 10.2 for details). Eiglsperger and Schackis (2009, 4) concluded that these minimum standards “allow[ed] compiling national HICPs either as annually chained indices or as direct price indices whose quantities are fixed for some years.” In some euro area countries (Belgium, Germany, Ireland, Greece, Cyprus, Malta, Austria, and Finland), the HICP mimicked a direct (or fixed-basket) index in a three to five-year interval because of the weight updating procedure applied at that time.
Since 2012, HICP weights must be updated annually in order to make them representative for the weight reference period (e.g., European Central Bank 2012, Box 3). The latest national accounts data is regarded as the most relevant source for this purpose. These tighter quality standards were welcomed because they might “significantly improve the comparability of the HICP across countries as well as the relevance and reliability of the HICP” (Eiglsperger and Schackis 2009, 5). In addition, annual updating was considered advantageous as it was expected to further reduce the substitution (or representativity) bias. Indeed, Herzberg et al. (2023) find for the euro area and Germany that the HICP has been subject to a smaller positive substitution bias since 2012 than before. The HICP has since been a fixed-basket price index only in comparisons within one calendar year, whereas the year-on-year percentage changes of all months but December have been systematically affected by quantity effects.
In recent years, monetary policymakers have become more and more aware that weight updates may impact the year-on-year HICP change rate to a recognisable extent under specific circumstances (e.g., Gonçalves et al. 2021). An example prior to the COVID-19 pandemic is the 2019 methodological change in the sampling of package holiday prices. The weight adjustment of this price component in that year had a large impact on German HICP rates (Deutsche Bundesbank 2019). Later, the pandemic led to considerable shifts in expenditure patterns. Eurostat (2020) provided guidance for weight updating practices in the HICP in these extraordinary times. These guidelines have been confirmed in every year since then (Eurostat 2021, 2022, 2023). As shown in Figure 1, the (absolute) weight changes of seventy-six product categories varied in the euro area HICP from 2020 to 2021 as well as from 2022 to 2023 by a standard deviation of 3.1 per mille points. These were the largest variabilities since 2000, when weights had shifted strongly as a result of a considerable extension and harmonization of HICP coverage (European Central Bank 2000, Box 3).
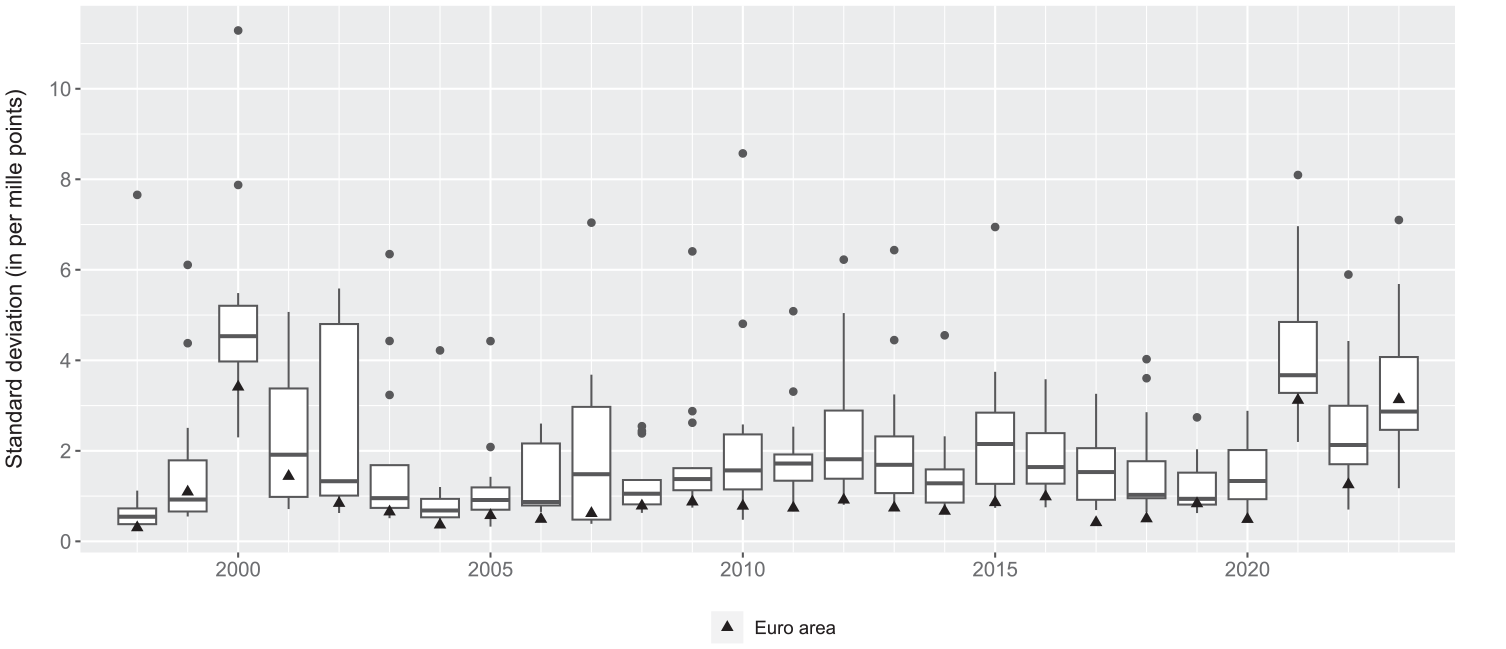
Standard deviation of annual weight changes in HICPs of euro area countries.
With the outbreak of the COVID-19 pandemic, there was a broad spectrum of expectations about what inflation should measure. In the course of 2020, when measurement rules and established practices prevented statistical offices from immediately reflecting these shifts in the compilation of official indices, several attempts were made to construct experimental indices building on real-time consumption structures (e.g., Cavallo 2020, and Reinsdorf 2020, for the United States; Kouvavas et al. 2020, for the euro area; Grigoli and Pugacheva 2024, for the United Kingdom and Germany; Seiler 2020, for Switzerland). Some statistical offices also provided experimental calculations (e.g., Insee 2020, for France; ONS 2020, for the United Kingdom). Advocates of swift weight adjustments interpret the difference between the experimental and official indices as mismeasurement due to an outdated consumption basket. The large number of studies highlights users’ need to measure the impact of changing weights on inflation.
Several studies on the contributions of the price changes of individual products to overall inflation can be found in the existing literature (e.g., Balk 2018; De Haan and Akem 2017; Walschots 2016). In the context of HICP measurement, one prominent approach is that known as the Ribe decomposition (Eurostat 2024, 279). Although the initial idea of these approaches is similar to ours, they do not aim at disentangling the overall impact of changing weights on annual inflation. One recent exception can be found in European Central Bank (2021, Box 6), where the inflation rate is decomposed into a fixed-weight Laspeyres change rate from the reporting month to December of the previous year, a price change, and a combined price weight change from December of the previous year to the reporting month. A similar approach to our decomposition into pure price change and quantity effects is followed by Statistics Sweden that publishes so called reweighting effects (or basket effects) on a regular basis (see Stahl, 2024). A further decomposition can be found in Diewert (2021, 29–33) who theoretically derives an aggregate measure of the impact of quantity weight changes on HICP inflation. His approach is similar to our decomposition into pure price change and quantity effects, but is based on the use of actual quantities or at least quantity indices, which can be estimated only roughly from publicly available data. By contrast, our decomposition relies on officially published price indices and weights. We also enrich our decomposition with empirical evidence for the euro area as a whole and three individual euro area countries. The methodological framework is provided in the next section.
3. Methodology
The HICP is an “annually chain-linked Laspeyres-type index” (Eurostat 2024, 256). The chain-linked index,
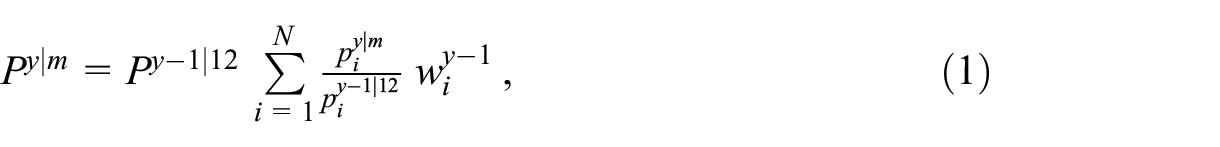
where
The inflation rate,
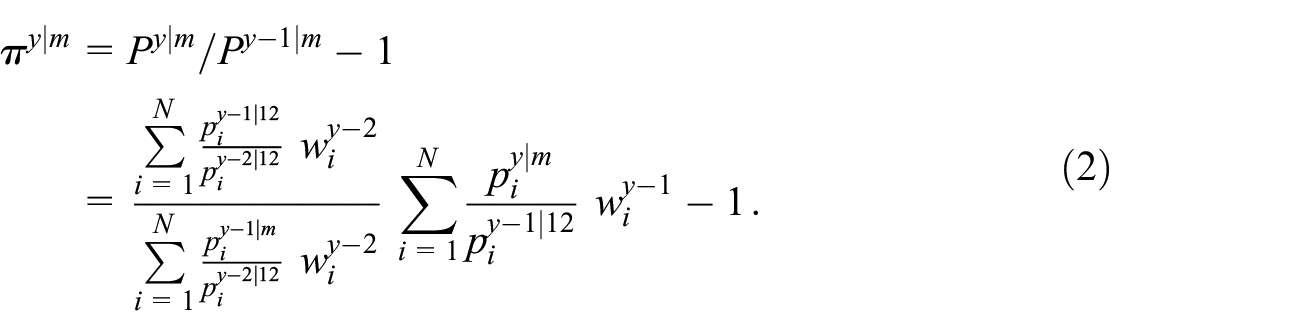
It can be seen that the price index in month
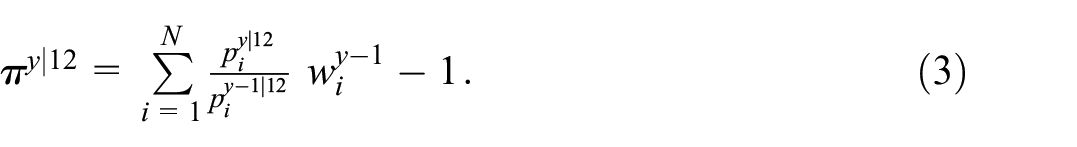
Consequently, any weighting or quantity effects are absent in this month for conceptual reasons.
In Section 3.1, we propose a decomposition of HICP inflation in equation (2) into a price change component and a weighting component. This decomposition can be calculated using officially published price indices and weights. It can be interpreted in a uniform manner for the HICP of the euro area and all individual euro area countries, because conceptual and methodological differences in weight compilation practices across countries and over time can be disregarded. By contrast, in Section 3.2 we remove the effect of changing quantities from the inflation rate, which allows the remaining component to be interpreted as pure price changes in a COGI sense. This decomposition requires the introduction of an additional weighting scheme. Its compilation is less of a problem than the fact that case distinctions are needed in order to give the resulting quantity components a meaningful interpretation, in particular as regards comparability across countries and over time.
3.1. Price Change and Weighting Components
Using HICP weights of the current and previous years,
for months
Price change component: The price change component
The key element of the price change component is thus a ratio between the current-year and the previous-year “Young-type” indices for month
Weighting component: The weighting component
Let us make three remarks on equation (4). First, weighting effects in months
3.2. Pure Price Change and Quantity Components
Removing the weighting effect from the inflation rate yields the overall price change under the assumption that HICP weights are kept constant at the previous year’s levels. This is different from a pure price change in a COGI sense. A fixed-basket price index is characterized by annually price-updated expenditure shares when written as a chain index formula (ILO et al. 2004, 4). As these weight shifts reflect price-induced movements rather than changes in the underlying quantities, it is clear that—with the assumption of constant expenditure shares—the price change component in equation (4) does not encompass the effects stemming from the entirety of individual price changes.
Including the price changes between HICP weights of the previous and current year in the price change component leads to a pure price change in a COGI sense. Subtracting the pure price change from the inflation rate results in a quantity component. Consequently, the expenditure changes which originate in price fluctuations but not in adjustments of consumed goods constitute the difference between the quantity and the weighting component.
In formal terms, the quantity component differs from the weighting component in that it uses one-year-ahead price-updated weights from two years prior instead of the published HICP weights of the previous year. Therefore, the calculation of a quantity effect requires the introduction of an additional weighting scheme where
is the analytical weight of product
Using a price-times-quantity notation for expenditure, the official HICP weights
where
Substituting equation (7) in equation (6), we obtain
implying that the analytical weight
Replacing the published HICP weights,
for months
Pure price change component: The pure price change component,
As a result, the pure price change component measures the overall price change between the current and previous year in month
Quantity component: The difference between the published weights
4. Empirical Results
We decompose the inflation rate of the euro area as well as Germany, France, and Italy (accounting for 63.9% of the euro area HICP in 2023) according to equation (4) using publicly available HICP data from 1997 to 2023. For each product of the HICP basket (see Knetsch et al. 2022, Annex B, for a detailed list of the products used), up to 324 monthly price indices and (annual) weights are available. To ensure consistency across countries and over time, we sacrifice some granularity and use nearly the same seventy-six products at the four-digit level according to the Classification of Individual Consumption by Purpose (COICOP).
Using the same selection of products, we also look at the difference between weighting and quantity effects for the euro area HICP and the HICPs of Germany, France, and Italy since 2013, where the quantity effects are derived according to equation (9). Recall from Section 2 that a number of countries compiled the HICP as a fixed-basket index before 2012. This implies
The overall weighting and quantity effects depend on the product level. Calculations of the weighting effect at the more detailed five-digit COICOP level indicated only marginal differences to the results presented in the following.
Key Findings on the Weighting Effect
Figure 2 depicts the weighting effects over time. On average, euro area inflation was affected only marginally by changing weights between 1998 and 2020. Consequently, the price change component closely followed the published inflation rate of the euro area in this period. Since 2021, however, weighting effects have been substantial. In 2021, this can be explained by strong weight shifts due to changing consumption patterns on account of the COVID-19 crisis. In 2022, weighting effects result from a mixture of weight shifts, which were still large but less pronounced than in 2021, and extraordinarily high price ratios of some products (especially energy). For 2023, there is no uniform explanation as sign and size of the weighting effects vary from country to country. In Germany, for example, the negative weighting effects might be considerably affected by the methodological change in the derivation of the CPI weights at the beginning of 2023, which has been a bearing on the corresponding HICP weights too.
Weighting component (in pp) in euro area HICPs.
The clustering typically spreads over complete calendar years. Recalling equation (4), this is due to the fact that HICP weights shift only with the turn of the calendar year and, if they are substantial, they have the potential to increase the weighting effects from January to November in absolute value. The contribution of individual products to the weighting effect varies only in terms of its size within a year, but not with respect to the sign. By contrast, the sign of the (overall) weighting effect depends on the monthly fluctuations of individual products’ price ratios in connection with the distribution of weight shifts across products. As a consequence, weighting effects may oscillate between positive and negative territory within a calendar year.
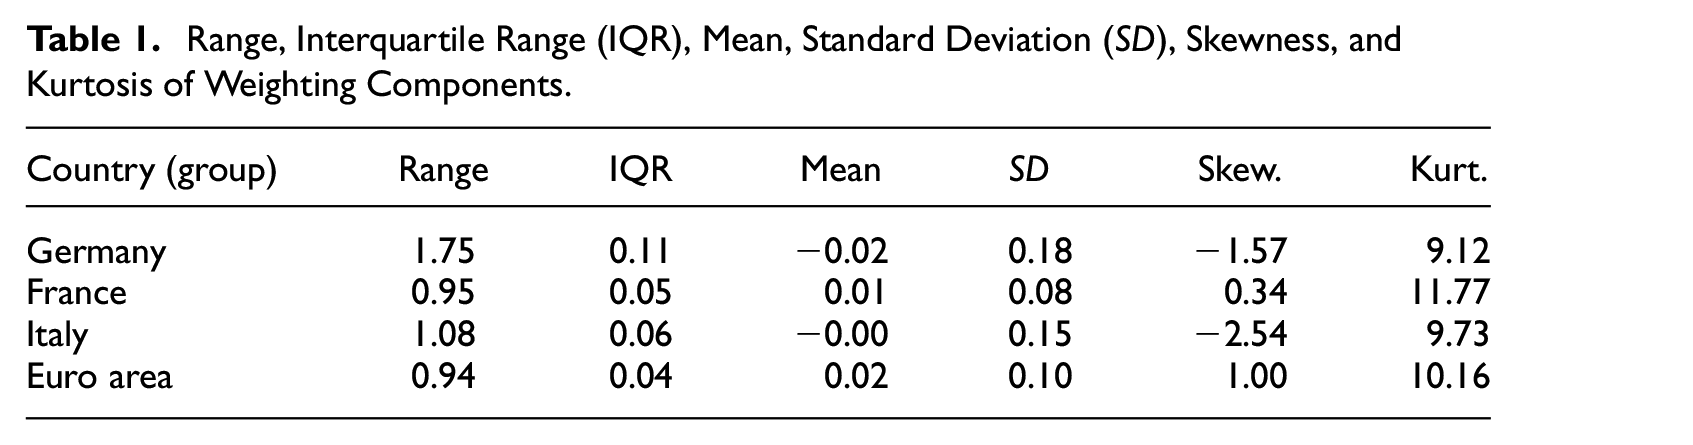
Weighting effects tend to average out over the long run. The full-sample means are virtually zero in the euro area HICP and the HICPs of Germany, France, and Italy, for which results are available from 1998 (see Table 1). There are notable differences regarding volatility, however. The weighting effects in the euro area HICP have fluctuated between
Range, Interquartile Range (IQR), Mean, Standard Deviation (SD), Skewness, and Kurtosis of Weighting Components.
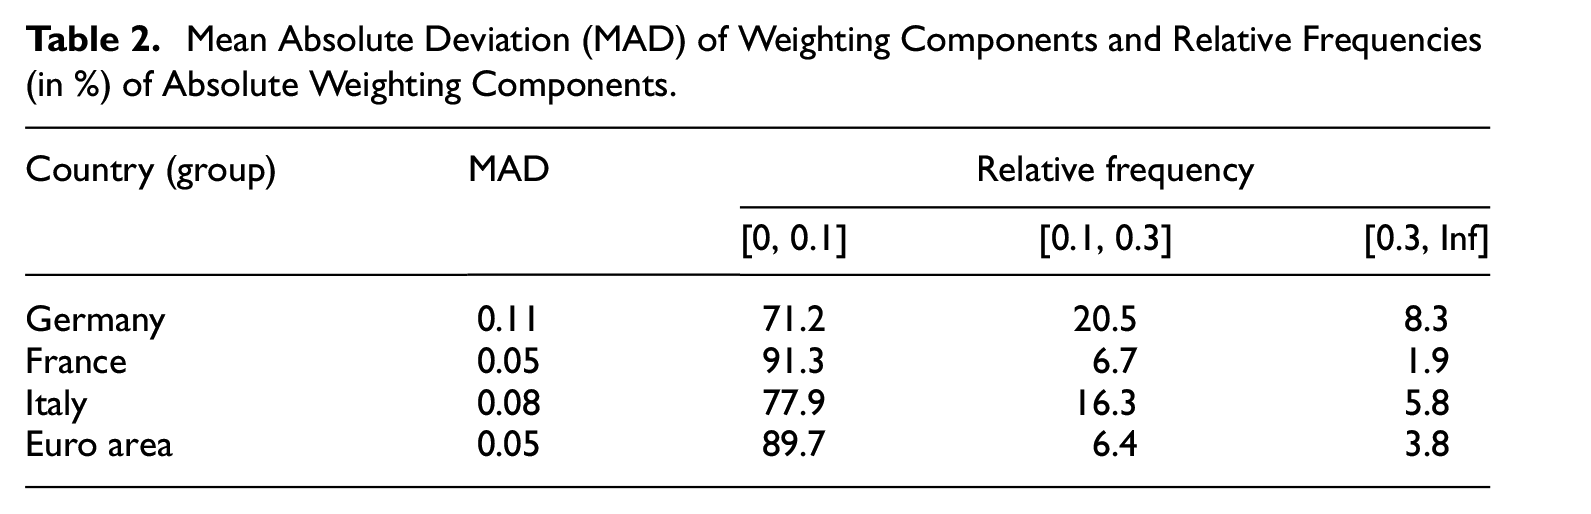
To further investigate the likelihood of increased policy attention, we classify the monthly (absolute) weighting effects into three categories. Within the interval of
Mean Absolute Deviation (MAD) of Weighting Components and Relative Frequencies (in %) of Absolute Weighting Components.
Let us finally take a view on the products that make the largest contributions (in absolute terms) to weighting effects since 2021. In 2021 and 2022, weighting effects can be explained by the COVID-19 crisis, during which households spent less on products in COICOP divisions “Recreation, entertainment and culture” and “Restaurant and accommodation services” leading to a considerable decline in the 2021 HICP weights of these products. By contrast, as the total budget of many households decreased markedly in the COVID-19 crisis while their rental expenses remained unchanged, the weight of rent expenses increased greatly. As a consequence, package holidays (COICOP group: 096) in Germany and restaurants (1111) in France and Italy showed the largest negative contributions to the overall weighting effect, while the contribution of rents (041) has been positive. In 2022, the opposite effects can be observed due to normalizing consumption by households. However, the largest positive contributions to the weighting effect in this year can be observed for fuels and lubricants (0722). Except for Italy, rents also had the largest (in absolute terms) negative contributions in 2023. For Germany, especially the impact of rents and gas (0452) on the weighting effect increased by relatively high changes in the corresponding weights. In the case of Italy, fuels and lubricants as well as health (06) had a noticeable negative impact on the weighting effect. For the euro area and the three countries under review, restaurants had the largest positive contributions to the weighting effect in 2023.
Differences between Quantity and Weighting Effects
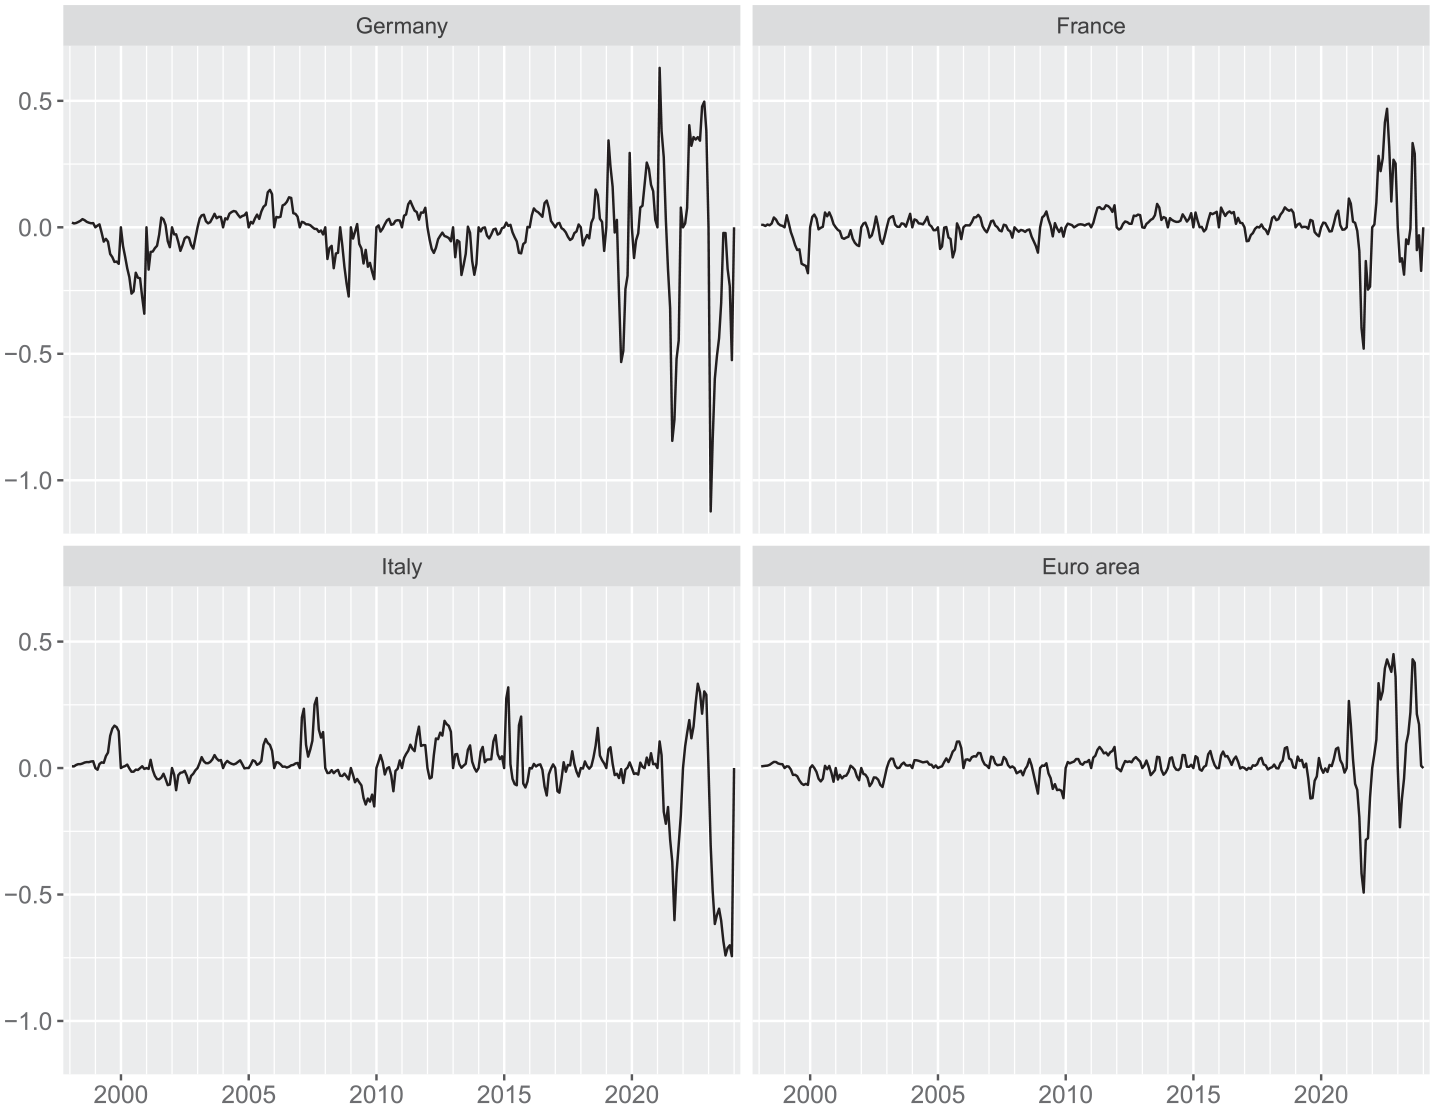
Using equation (9), we decompose euro area inflation as well as the inflation rate of Germany, France, and Italy into pure price change and quantity effects from 2013 onwards. Figure 3 shows that quantity effects are similar to weighting effects until 2021. In Germany and France, the similarity gets temporarily lost in 2022 but reappears in 2023. In Italy, however, the strongly positive correlation existing until 2021 seems to have turned into a negative correlation since 2022. Not least because of the variation across the largest countries, the evidence for the euro area HICP appears to lie somewhere in between. In particular, the (contemporaneous) correlation between weighting and quantity effects before 2022 is highest in Germany (0.96), followed by Italy (0.91), the euro area (0.89), and France (0.84). The relatively strong empirical association in the case of Germany is underlined by the fact that until 2021 quantity and weighting effects have the same sign in 93% of the monthly observations. The relative frequency is markedly smaller in the HICPs for the euro area (84%), Italy (81%), and France (77%).
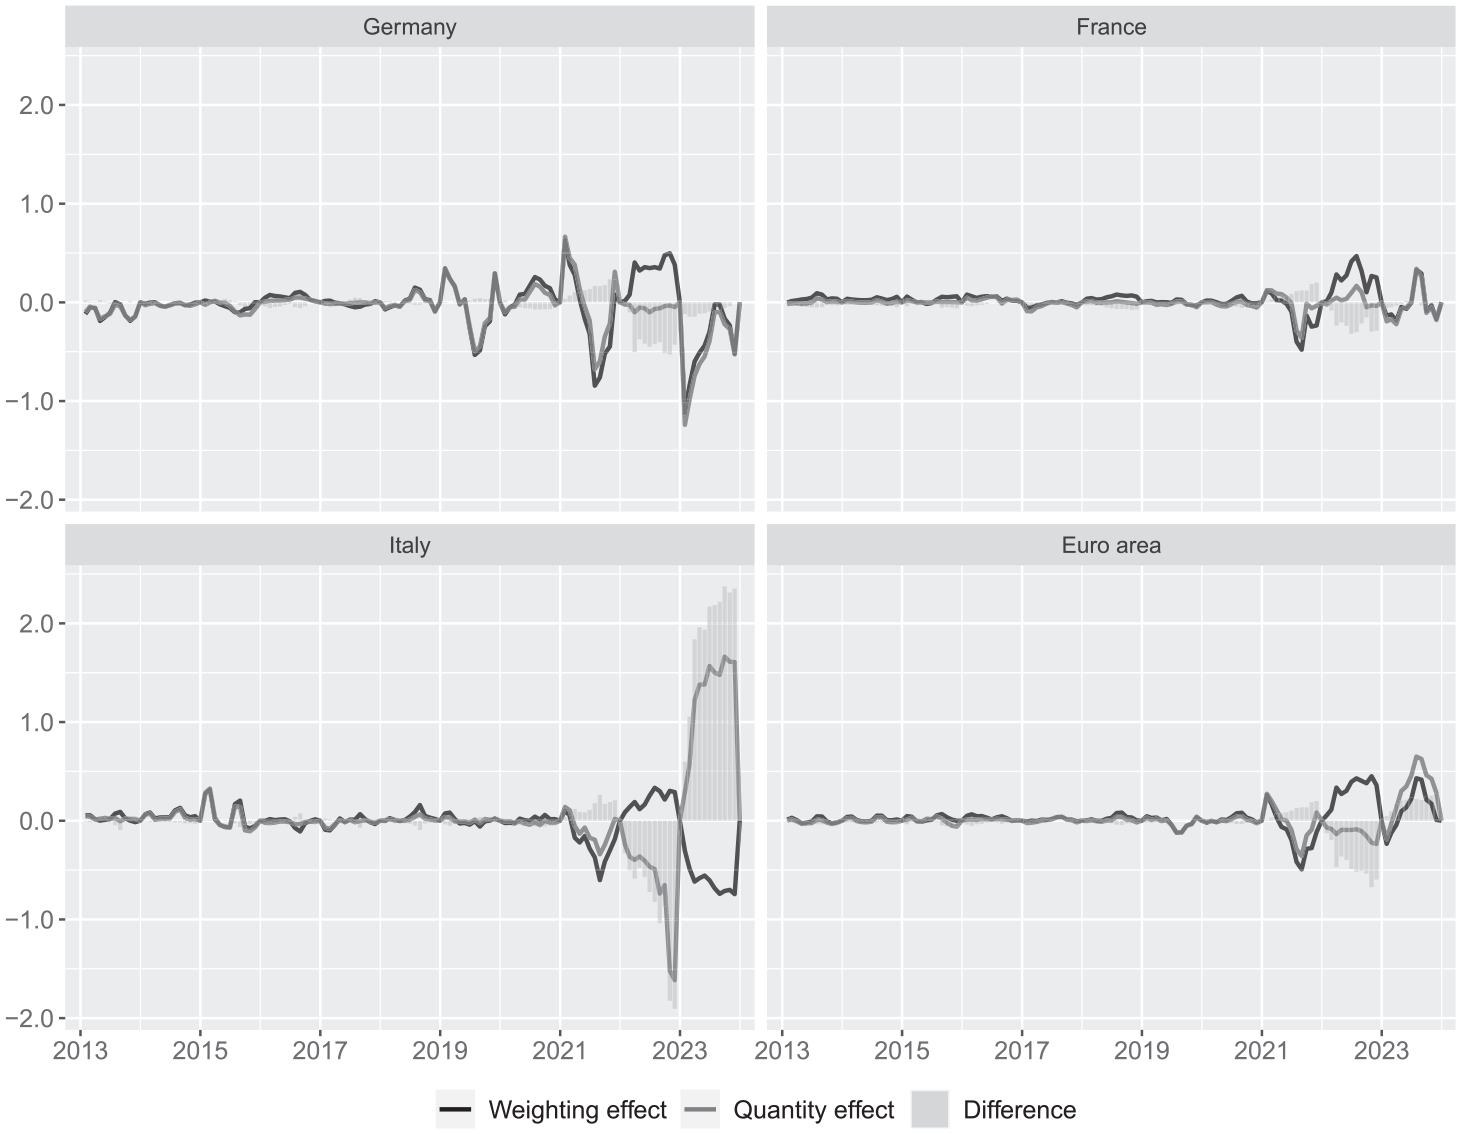
Quantity and weighting components (in pp) in euro area HICPs.
Quantity effects tend to be smaller in size than weighting effects. Before 2022, the mean absolute quantity effect in the euro area HICP is nearly 72% the size of the mean absolute weighting effect (for Germany, this number is 87%, for Italy 68%, and for France 60%). By contrast, in 2022, the relative differences markedly increased. This is particularly the case for Italy, where the mean absolute quantity effect is triple the mean absolute weighting effect. The huge negative quantity effects observed for Italy in this year are caused by an extraordinary increase in prices for electricity and gas in combination with a decrease in real consumption.
The similarity of weighting and quantity effects over the course of 2021 suggests that changes in real consumption overwhelmingly drove the shifts in nominal expenditures during 2020, the first year of the COVID-19 crisis, whereas the impact of relative price changes on the variation of expenditures across product categories was small. In 2022, however, Figure 3 shows huge differences as well as different signs of the two effects for the euro area, Germany, and Italy for the first time. This might be explained by noticeable increases in nominal expenditures for some energy products, which appear although the real consumption of these products is decreasing. Only in the case of Italy, quantity effects continued to deviate strongly from the weighting effects in 2023.
5. Concluding Remarks
As the HICP is constructed as a Laspeyres-type index with weights changing at the beginning of every calendar year, inflation measured as the annual percentage change of this index does not reflect pure price developments. The experience of the COVID-19 crisis debunked the view that inflation measurement tends to be insensitive to changes in weights. Reaching an absolute size of 0.5 pp in August 2021 and October 2022, weighting effects had a marked effect on euro area inflation.
The removal of the weighting effect from HICP inflation rates does not yield year-on-year percentage changes which reflect pure price changes. This can be achieved by removing quantity effects from HICP inflation. While the quantity effect may be lauded as having a sound footing in index number theory, the weighting effect is advantageous because it can be measured simply by relying on officially published price indices and weights. In addition, it avoids case distinctions over time and across countries, as is required for quantity effects to be properly interpretable. Our empirical analysis shows that the (absolute) differences between the two effects are small until 2021. In the year 2021, for instance, weighting and quantity effects are very similar, suggesting that changes in real consumption overwhelmingly drove the shifts in nominal expenditure at the beginning of the COVID-19 crisis. In 2022, however, the two effects diverged for the first time. The huge relative price changes especially for energy goods may have played a role in that, as they overcompensated the decrease in real consumption. HICP data for the time beyond 2023 prove necessary to fully explain this observation.
With its tremendous effects on private consumption, the COVID-19 crisis constituted a stress test for the compilation and interpretation of the HICP as well as any (COGI-type) CPI. It may not be generally advisable to call well established measurement rules and practices into question solely as a result of a “once-in-a-lifetime” event. Nonetheless, the appearance of considerable weighting effects all over the euro area should prompt European statisticians to consider making inflation measurement more robust and/or increasing transparency with regard to the representativeness of expenditure patterns.
While annual updating of weights and chaining over December remain HICP measurement principles, price statisticians may envisage a further harmonization in weight updating procedures. Specifically, the guidance developed to deal with the challenges of the COVID-19 crisis and applied to derive HICP weights since 2021 might become established as a general standard (Eurostat 2020, 2021, 2022, 2023). This would stipulate best-guess estimates for the weight reference period, implying that both weighting and quantity effects would—at least in conceptual terms—be precisely measurable for the euro area HICP and the HICPs of all euro area countries. It might also be worth considering whether the impact of weight shifts on inflation should be communicated regularly or occasionally. Users could find this information helpful, as it is commonly measurable and interpretable in that it reflects overall price developments at previous year’s weights.
Footnotes
Acknowledgements
The authors wish to thank Annette Fröhling for intense discussions on this issue, Robert Kirchner for pointing us to the importance of elaborating on the differences between weighting and quantity effects, and Martin Eiglsperger for a thorough review of an earlier draft. Comments and suggestions by Johannes Hoffmann, Claude Lamboray, Mick Silver, and participants of the 17th meeting of the Ottawa Group as well as the conference “Messung der Preise,” where the paper was presented, are gratefully acknowledged. The recommendations of four anonymous referees and the editors improved the paper considerably. All remaining shortcomings are ours. The views expressed in this paper are solely those of the authors and should not be interpreted as reflecting the views of the Deutsche Bundesbank or the Eurosystem.
Funding
The author(s) declared that they received no financial support for the research, authorship, and/or publication of this article.
Received: March 2023
Accepted: December 2023