
Abstract
Many large scale omnibus surveys have adopted shorter versions of the original lengthy psychological scales for efficiency. Evidence is lacking on the impact of different forms on respondent behaviors and data analysis. This study focuses on the widely used Center for Epidemiologic Studies Depression Scale (CES-D) as a case in point, by utilizing data from the nationally representative China Family Panel Studies. It compares CES-D20 with CES-D8 as they have been applied to two separate and equivalent groups. Our findings suggest that reducing the test length from CES-D20 to CES-D8 does not lead to a notable reduction to their psychometric qualities. Respondent behaviors as measured by survey perceptions in its concurrent wave, and attrition rates two years later are not affected by the forms. Analysis by combining data from the two forms is possible after proper conversion of the scores to be on the same metric without worrying about the form effect. In conclusion, the findings provide supporting evidence for a possible smooth transition between long and short forms of scales under proper survey designs.
1. Introduction
The choice of measurement scales in general purpose household surveys often involves a tradeoff between precision and efficiency (Hoogendoorn and Sikke 1998). Lengthier forms may produce more accurate data but take longer time for respondents to complete. Longer interview time is not merely a logistic issue but also a cause of concern for survey data quality (Peytchev and Peytcheva 2017). Consideration of response burden is even more critical in longitudinal studies, because aside from a possible impact on data quality of the current wave, it may affect attrition rates in later waves (Yan and Williams 2022).
For the above reasons, shorter versions of many classical measurement scales are in favor by designers of large scale general purpose surveys (Hahn et al. 2012). However, although studies are abundant regarding the performance of long and short forms of the same scales, they mostly focus on their psychometric properties (Merz et al. 2013). Evidence is lacking with regard to the critical features of large scale surveys. For example, how do the different forms affect respondent behaviors such as their perceptions of the survey processes and their participation rates in later waves? The current study intends to address the overall impact of different forms of a measurement scale in a large scale omnibus survey, using a widely used depression scale as a case in point.
1.1. Need for Short Forms of Psychological Scales
Many popular psychological scales have multiple forms with varying lengths. Usually the original form is lengthy with excellent psychometric properties, while shorter forms achieve greater efficiency at the cost of maybe somewhat compromised quality. Examples of this include the 240-item NEO Personality Inventory (NEO-PI) and the later revised shorter version of NEO-PI-R which includes 60 items (Costa and McCrae 1992), as well as the 36-item short-form health survey (SF-36) and its shorter version of SF-12 (Ware et al. 1996).
Shorter forms are created to meet different needs. The first major need is related to the logistic burden (Kleka and Soroko 2018). Shorter forms are associated with less test administration time. This feature makes them particularly appealing for general purpose surveys including a multitude of questions measuring different content domains. Allocation of items for each domain is then stringent and takes into consideration of the larger context of the whole questionnaire. As an example, the mostly utilized personality assessment in large scale omnibus surveys is a brief 15-item personality test instead of their longer counterparts (Hahn et al. 2012). In addition to logistic cost, consideration of response burden is another motivation of choosing shorter forms. Perceived burden associated with stated questionnaire length have been found to be associated with higher item-nonresponse rates and less variability in data (Galesic and Bosnjak 2009). Furthermore, repetition of items with similar wording may cause disinterest in survey respondents (Rolstad et al. 2011). If the lengthy form involves items that are difficult or sensitive, it will exacerbate the burden among survey respondents, either due to unmatched cognitive abilities (Wenemark et al. 2010), or the presence of stress from uncomfortable topics (Yan and Williams 2022). There is also evidence suggesting that longer forms lead to more survey satisficing behaviors and break-offs (Gibson and Bowling 2020; Peytchev 2009).
Questionnaire length and the corresponding response burden are of particular concerns in longitudinal surveys (Tortora 2009). Survey methodologists are worried that longer surveys result in greater response burden, which eventually lead to increased attrition rates over time. Although there are some debates on the effects of questionnaire length on attrition rates (Galvin et al. 2000), there is little doubt that respondents’ existing experiences with the survey and their perceptions of the interview process affect their future survey participation (Wenemark et al. 2010).
1.2. The CES-D Measures
Depression is a frequently measured construct in many surveys. Among a number of depression scales, CES-D is probably the most popular one for general purpose surveys (Radloff 1977). Many studies have provided support for its psychometric properties (Van Dijk et al. 2018; Vilagut et al. 2016). Cronbach’s alpha is mostly above .80 across different populations (Carleton et al. 2013). Test-retest reliability is in the moderate range between .40 and .70 as the scores measure the current level of depressive symptoms and are expected to change over time (Smarr and Keefer 2011). The original CES-D scale contains 20 items (CES-D20) measuring four underlying factors. The four factors include depressed mood, somaticism, interpersonal difficulties, and positive affect (Shafer 2006). Data from different populations support this theoretical model although alternative models are also viable. A two-factor model which only separates the positive and negative worded items has also been supported with empirical evidence (Edwards et al. 2010). Scoring of the CES-D seems to be relatively independent of discussions of the factor structure. A majority of the empirical research utilizes a single summary score by adding item level responses for all the items, while accounting for reverse wording (Wood et al. 2010). Such summary scores demonstrate good evidence in concurrent validity based on correlations with other measures of depression, social functioning, levels of disability etc. (Radloff 1977).
Despite the strong psychometric evidence of the original scale, several shorter alternative forms are proposed, in response to complaints from respondents and the interviewers (Carpenter et al. 1998). Popular forms include the 12-, 10-, and 8-item versions. Items in shorter forms were mainly selected from CES-D20 based on factor analytical results (Kohout et al. 1993). A two-factor model often was adequate to explain covariances among the items in CES-D shorter forms. The two-factor model includes a positive effect factor accounting for the positively worded items. Shorter forms have acceptable Cronbach’s alpha above .70 (Van de Velde et al. 2010); they also demonstrate good evidence in concurrent validity based on correlations with concurrent variables such as life satisfaction, functional limitation, and subjective health (Lee and Chokkanathan 2008).
1.3. Use of CES-D in Large Scale Omnibus Surveys
CES-D has been widely used in large scale omnibus surveys. Some of them use the CES-D20, such as National Health and Nutrition Examination Survey (NHANES). Others use the shorter forms, such as CES-D8 in European Social Survey (ESS). Similar to the recommendations of scoring procedures elsewhere, users’ manuals of those surveys mostly suggest the use of a single summarized score of all items. One survey (i.e., Survey of Midlife in Japan: MIDJA) additionally provides the subscale scores for the four dimensions.
Interestingly, some surveys underwent a transition between different versions of the CES-D. Health and Retirement Study (HRS) initially used the CES-D8 with a four-point frequency option and then changed the response categories to only yes/no. The HRS team evaluated the possibility of converting the four-point response to a yes/no response by combining two of the four response options (i.e., “most of the time” and “all of the time” as “Yes”). However, a comparison between the two designs revealed that they produced very different rates of “yes” on each item; therefore, the HRS team recommended against the combined use of both versions in the same analysis (Steffick 2000).
1.4. Research Purpose
Although ample evidence has been reported for the use of short forms of CES-D, most relies on convenience samples with small sample sizes under 1,000 (Vilagut et al. 2016). CES-D related psychometric studies based on national samples is often done with one form and rarely involves the comparison of different forms under survey experimental designs (Missinne et al. 2014). In particular, existing research offers little evidence for the effects on respondent behaviors such as their survey coorporation and participation in the future. There is also a lack of research evaluating the linking of scores between different CES-D forms. Last but not least, some studies did not conduct a survey experiment but based their analysis on extracting a subset of items from the longer form (Jenkinson et al. 2015), which is very likely to differ from a real short form.
With a nationally representative survey and an experimental design of random assignment of two forms to separate groups, we aim to answer the following questions. First, does the shorter form of CES-D show adequate levels of psychometric evidence, as compared to the longer form of CES-D20? Second, are respondent behaviors in the concurrent wave and a future wave differentially affected by the two forms? Third, can we combine data from different waves without worrying about the form effects?
2. Method
Data are from the nationally representative China Family Panel Studies (CFPS). The CFPS is a comprehensive household survey, initiated in 2010 by the Institute of Social Science Survey at Peking University and approved by the IRB committee of the university. Baseline samples were drawn through a multi-stage stratified sampling framework (Xie and Lu 2015). The primary and secondary sampling units are countries and communities, sampled from administrative lists through stratified method. The third and final sampling unit is the families, for which the sampling frame was constructed by the CFPS team. The CFPS team sorted all dwelling units based on the routes traveled by the CFPS team while constructing the maps, or in clockwise order, starting from the northwest. With the sorted list of all dwelling units within a community, the CFPS sampled the households with systematic sampling by choosing every nth units, and the n was determined by the expected response rate and the number of eligible households of that community. Within the sampled households, all members with marriage or blood ties are eligible individuals for CFPS. At baseline, a total of 14,959 households participated in the survey, producing a list of 57,353 family members who are financially connected but may live in different residences. Among them, 42,590 completed individual questionnaires. According to the data user’s manual (Xie et al. 2017), baseline response rate is 81.25% at the household level and 84.14% at the individual level, based on AAPOR response rate 3 (AAPOR 2023). After the baseline, families and individuals from the baseline survey are followed every other year. The data is publicly available from the project website of CFPS.
2.1. CES-D in the CFPS
CES-D20 was first administered in the 2012 survey. During that wave, one of the most salient issues from the field work was related to the CES-D items. Respondents expressed complaints over repetitions of similarly worded questions asked in negative connotations. In response to such complaints, the CFPS team decided to change it to a shorter version of 8 items (CES-D8). Contents for both the CES-D20 and CES-D8 are listed in Table S1. The CES-D8 had been used in other large scale surveys such as the ESS and the Irish Longitudinal Study on Ageing (TILDA).
In order to build links between the long and short forms of CES-D, both CES-D20 and CES-D8 were administered in 2016, but to two separate groups by random assignment among participants of computer assisted personal interviews (CAPI). All participants of the telephone surveys, who accounted for about 19% of all respondents, took the shorter forms due to perceived difficulty of using the long form in phone interviews. Among the CAPI participants, a random fifth sample took the CES-D20 (n = 5,311), while the remaining four fifths took the CES-D8 (n = 21,663). This study analyzes data from the CAPI participants. The demographic characteristics of the total CAPI sample and by CES-D forms are shown in Table 1. Over 80% of the respondents were married, 48.2% of them were males and 46.9% lived in urban areas. Consistent with the random assignment of the CES-D forms, the two experimental groups are comparable in age, gender composition, marital status, years of education, and urban status. In subsequent analysis, we treat the two groups as equivalent groups in terms of their underlying distributions of depressive symptoms, so that we can set a common metric for their CES-D scores.
Sample Characteristics in CFPS2016 by CES-D Forms.
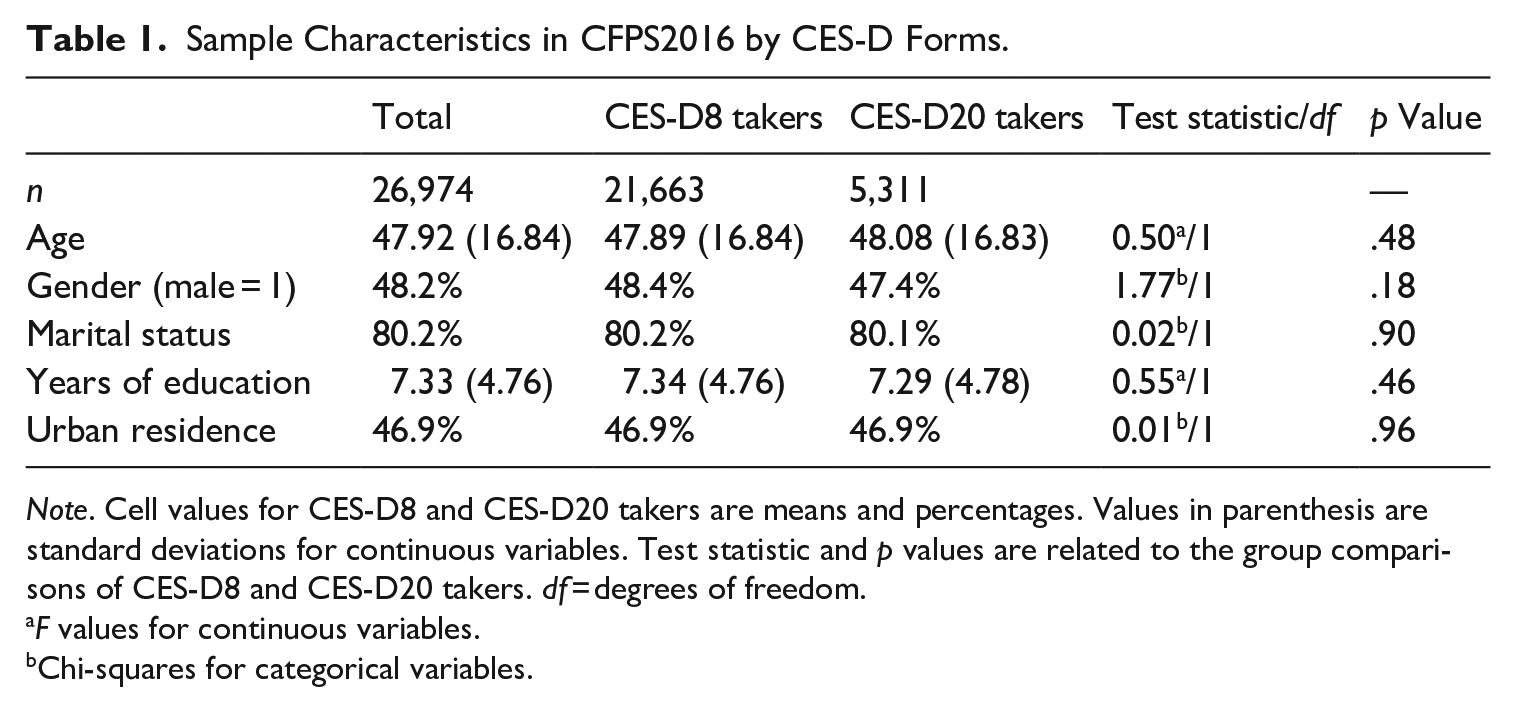
Note. Cell values for CES-D8 and CES-D20 takers are means and percentages. Values in parenthesis are standard deviations for continuous variables. Test statistic and p values are related to the group comparisons of CES-D8 and CES-D20 takers. df = degrees of freedom.
F values for continuous variables.
Chi-squares for categorical variables.
2.2. Analytical Procedures
To address the first research question on psychometric properties of the two forms, we compute estimates of their Cronbach’s alpha, stability over a four-year span, factor structures and criterion validity as measured by correlations with concurrent variables. More specifically, stability over time is measured by correlations between scores from the 2016 wave with CES-D20 from 2012. As only the CES-D20 was administered from 2012, when computing correlation for the CES-D8 scores in 2016, we use an extracted version of CES-D8 scores from the CES-D20 in 2012. Factor structure is tested with confirmatory factor models with a single-factor model, a two-factor model separating positive and negative emotions, and a four-factor model consistent with the original theoretical model. Note that the four-factor model naturally becomes a three-factor model for CES-D8 as items for the dimension of interpersonal difficulties are all deleted in CES-D8. We use the Mplus 8.0 with the WLSMV estimator for the above analyses. For evidence of criterion validity, we use three variables that are frequently cited as being correlated with depression: life satisfaction, self-rated health, and functional limitation. Life satisfaction was measured with a single item asking the respondents to rate the levels to which they were satisfied with their life overall, using a five-point response scale labeled at the two ends as “very dissatisfied” and “very satisfied.” Self-rated health was measured with a single variable of “what do you think of your health?” Respondents can choose among “excellent,” “very good,” “good,” “fair,” and “poor.” Functional limitation was measured with a Chinese version of the instrumental activities of daily living (Tang et al. 1999). Respondents reported whether they had any difficulty conducting seven daily activities, including regular outdoor activities, eating, preparing meals, using public transportation, shopping, housekeeping, and laundry. We calculate the total number of difficulties reported by the respondent over all seven activities.
The second research question focuses on respondent behaviors. On the one hand, we study their concurrent behaviors, such as non-response to the CES-D items, their interest in the survey, and level of cooperation as perceived by interviewers at the end of the interviews. Non-response is computed both at the item level and at the scale level. At the item level, we compute for each respondent the number of missing CES-D items among all eligible CES-D items. At the scale level, we compute whether the respondent had non-response in any eligible CES-D item. Interviewer observations of the respondent behaviors are reported with a seven-point scale at the end of the interviews. On the other hand, we study respondents’ future behaviors, as measured by whether they would drop out of the survey (i.e., attrition) two years later. We measure their attrition status to different extent. Attrition at household level means that nobody in the family participated in the interview and no information was collected. Attrition at individual level based on either self report or proxy report means that neither a self report nor a proxy report was available for the individual respondent. Attrition at individual level based on self report is the most stringent definition, meaning that the respondent did not complete the interview by themselves. In calculating attrition, our denominator is the total number of completed observations from 2016, and the numerator is number of completed observations in 2018 among those with completed observations in 2016.
The third research question is related to possible form effect by analyzing combined data from both forms. We need to first place scores from the two forms on the same scale so that they can be analyzed together. We use equivalent group equipercentile equating method to place scores from CES-D20 and CES-D8 on the same metric (Choi et al. 2014). The equipercentile equating was done in R with loglinear pre-smoothing (Albano 2016). Since the two groups are randomly assigned and we can assume that their distributions of the depression construct are similar, as borne out by evidence from Table 1 on their demographic characteristics. We choose to put CES-D20 and CES-D8 to be both on the CES-D8 metric because subsequent waves of CFPS all use CES-D8. It would be more convenient to convert the earlier two waves rather than dealing with scores from every subsequent wave. Form effect is evaluated with a regression model based on data from both forms, adding the form indicator as well as the interaction of the form indicator and the CES-D scores. Non-significant interaction terms would suggest absence of such a form effect.
3. Result
3.1. Psychometric Properties
Table 2 presents two types of reliability estimates for CES-D20 and CES-D8. Both forms show acceptable levels of Cronbach’s alpha with CES-D20 at 0.86 and CES-D8 at 0.79. Since Cronbach’s alpha is closely related to number of items in a scale, it is not surprising that alpha for CES-D20 is higher than that for CES-D8. We also test over time stability with scores from CES-D in 2012. Note that in CFPS2012, all participants took CES-D20, so over time stability of the CES-D8 was actually based on an extracted version of CES-D8 from the CES-D20 instead of the actual CES-D8. Correlation for CES-D20 over the four-year span is 0.45 (p < .001) and that for CES-D8 is 0.42 (p < .001).
Reliability and Validity Estimates and 95% Confidence Intervals for CES-D20 and CES-D8 in CFPS.
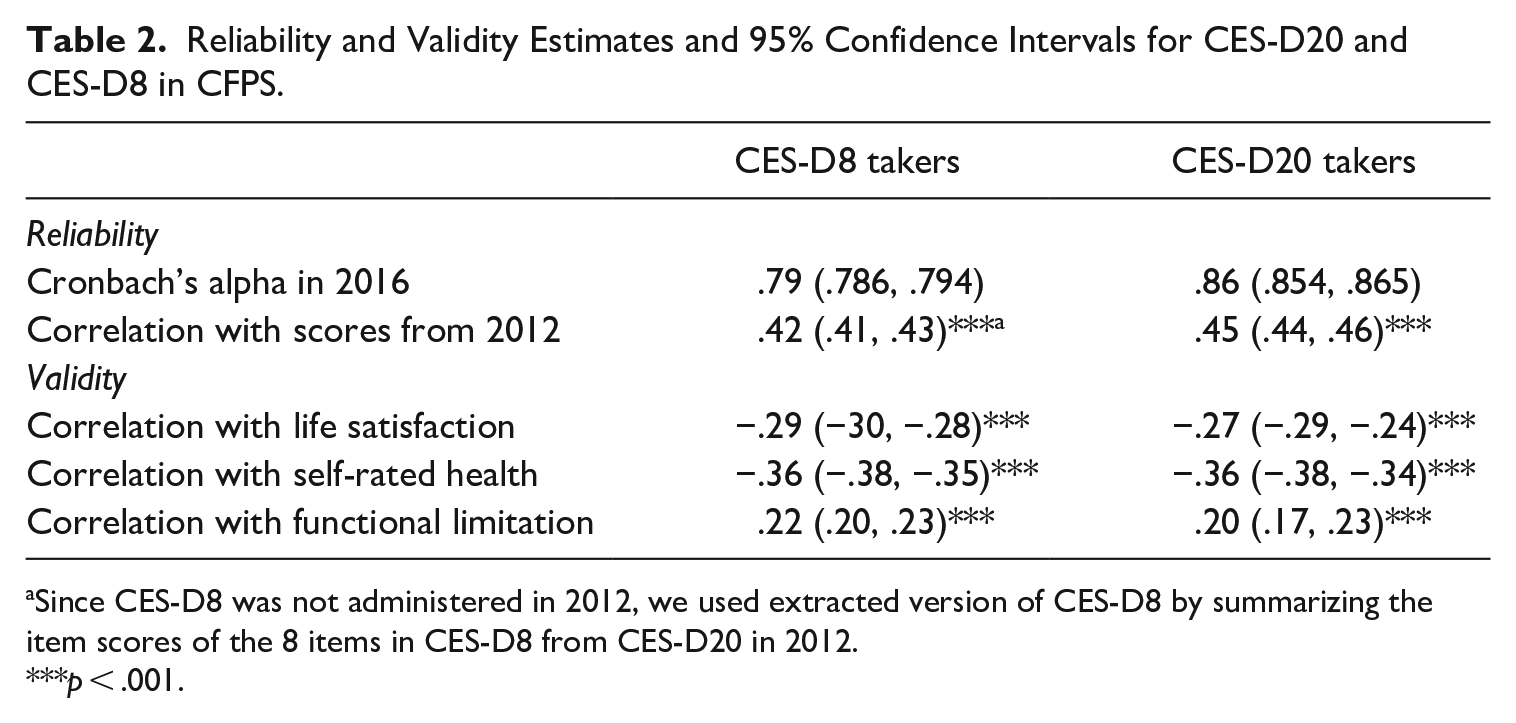
Since CES-D8 was not administered in 2012, we used extracted version of CES-D8 by summarizing the item scores of the 8 items in CES-D8 from CES-D20 in 2012.
p < .001.
The lower panel of Table 2 shows the Pearson correlation coefficients with three related variables from the same wave. As expected, CES-D scores are negatively correlated with life satisfaction and self-rated health, and positively correlated with number of functional limitations. It is impressive to note that reducing the number of items from 20 to only 8 does not lead to reduction in their correlation coefficients with the three concurrent variables.
Next, we fit three different factor models to the data, and the goodness of fit statistics are reported in Table 3. As expected, the single-factor model has poor fit for both CES-D20 and CES-D8. When an additional factor is included to account for the positively worded items, the goodness-of-fit notably improves to an acceptable level. The added complexity of the original four-factor model does not contribute much to better goodness-of-fit. It makes some difference to the CES-D20, but not at all to CES-D8.
Fit Statistics Under Different Factor Structure Models.
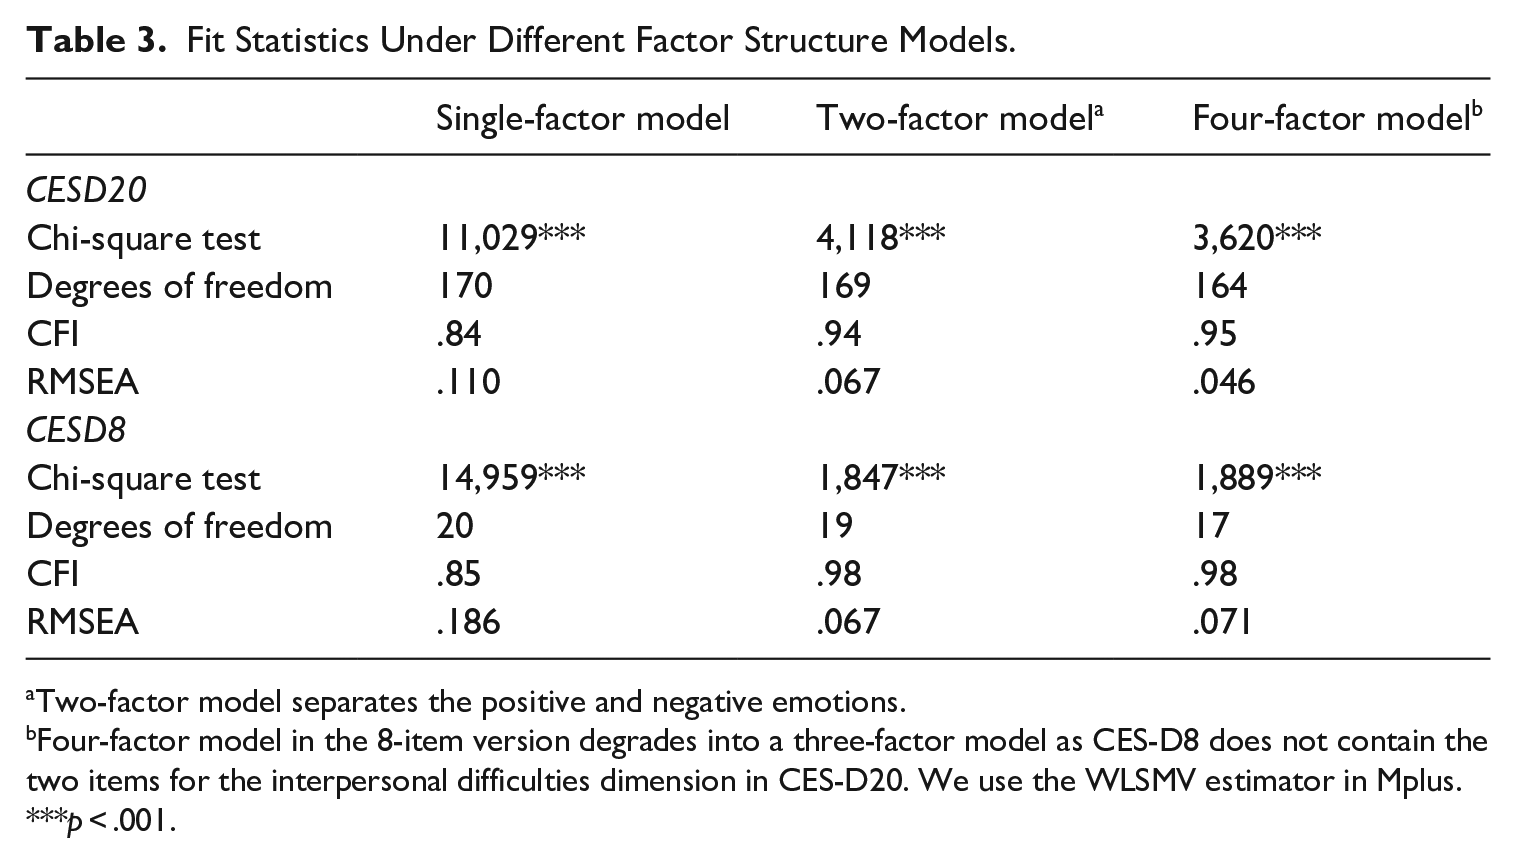
Two-factor model separates the positive and negative emotions.
Four-factor model in the 8-item version degrades into a three-factor model as CES-D8 does not contain the two items for the interpersonal difficulties dimension in CES-D20. We use the WLSMV estimator in Mplus. ***p < .001.
3.2. Respondent Behaviors
We first compare non-response measures for the CES-D forms. Based on the percentage of item non-response among all eligible CES-D items, both CES-D8 and CES-D20 have extremely low item non-response without statistical significance (see Table 4). There are seventy-eight missing responses across all respondents for the 8-item measure (CES-D8) and seventy-one missing responses across all respondents for the 20-item measure (CES-D20). At the scale level, CES-D8 shows lower rate of non-complete cases (0.25%) than CES-D20 (0.75%) with p < .001, but both are at very low levels. We display non-response rates for each item in Table S2. Overall, all items have very low non-response rates, but we note that the five items with the highest non-response rates (ranging from .09% to .24%) in CES-D20 are not available in CES-D8.
Respondent Behaviors by Different CES-D Forms.
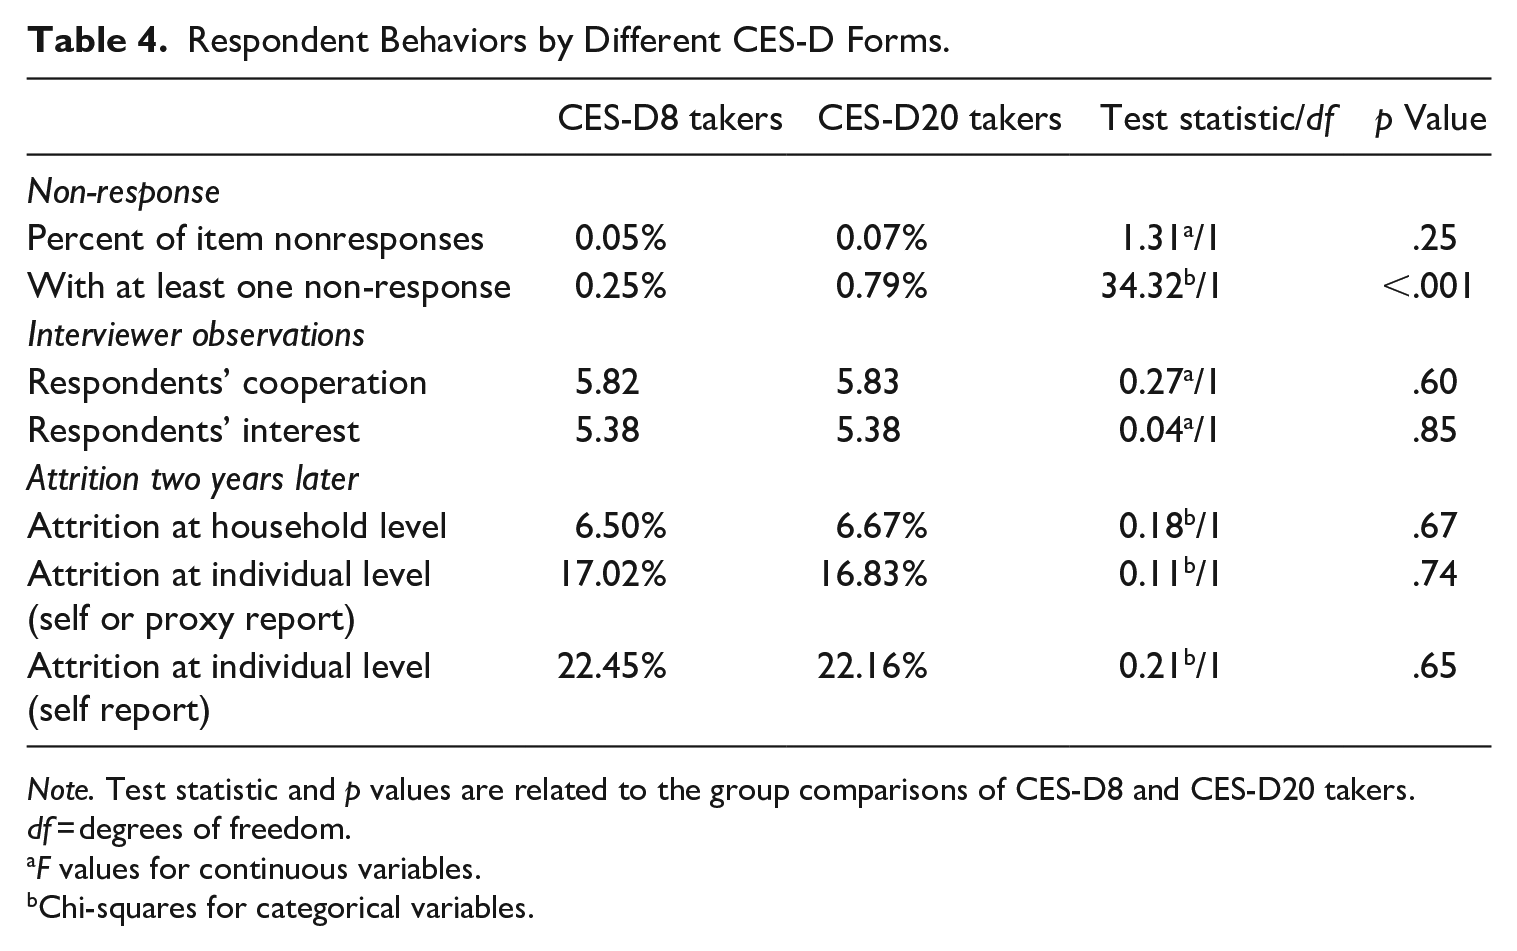
Note. Test statistic and p values are related to the group comparisons of CES-D8 and CES-D20 takers. df = degrees of freedom.
F values for continuous variables.
Chi-squares for categorical variables.
Then we compare respondents’ perceptions of the survey, based on interviewers’ observations of respondents’ level of cooperation and their interest in the survey. Again, no statistically significant difference is observed between the two groups.
Additionally, we evaluate the effects of respondent behaviors in the longer term by examining their survey participation two years later. Based on the last three rows of Table 4, all three indices reflecting increasingly stringent definitions of attrition rates, we find no statistically significant differences between the two groups.
3.3. Form Effect for Data Analysis
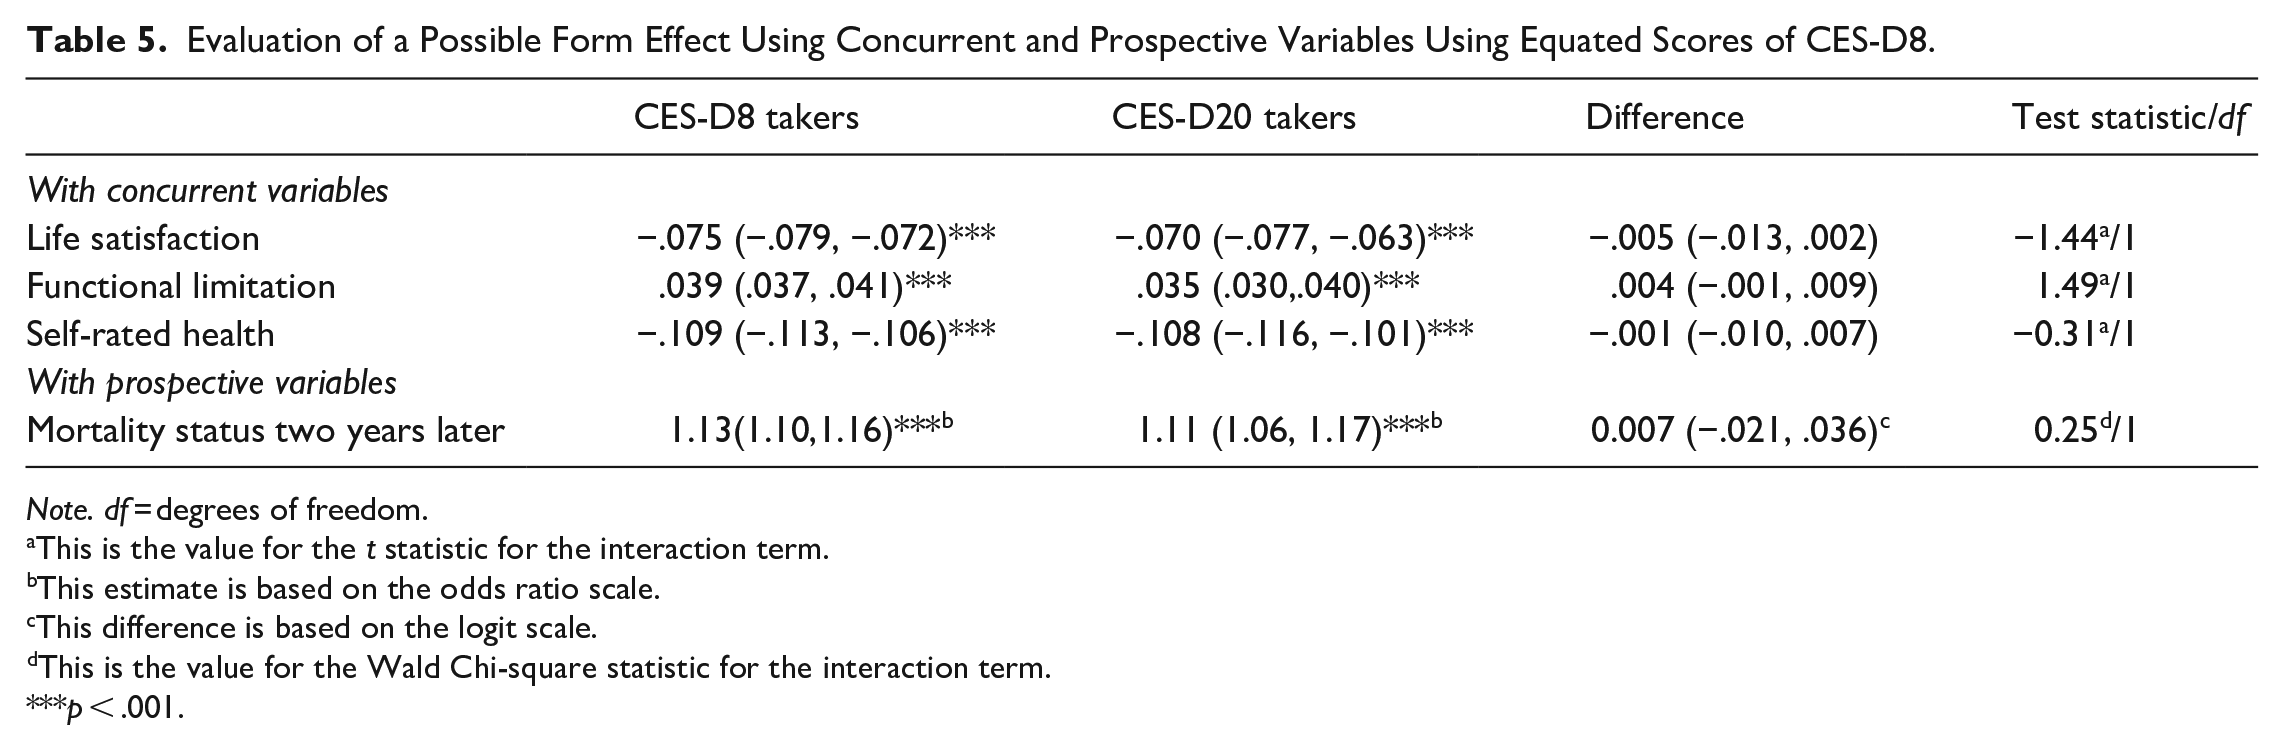
In order to analyze scores from both CES-D20 and CES-D8 in a single analysis, we need to place the two scores on the same metric. Table S3 shows how CES-D20 scores are mapped to the CES-D8 score metric, based on the equipercentile equating with loglinear pre-smoothing. The last research question assesses whether the form length needs to be taken into consideration when analyzing data combining the two forms. The second and third columns in Table 5 contain regression coefficients in stratified analyses within each experimental group, and the fourth column is the difference between the regression coefficients for the two experimental groups. We note that all differences are not different from zero, indicating that there was no form effect.
Evaluation of a Possible Form Effect Using Concurrent and Prospective Variables Using Equated Scores of CES-D8.
Note. df = degrees of freedom.
This is the value for the t statistic for the interaction term.
This estimate is based on the odds ratio scale.
This difference is based on the logit scale.
This is the value for the Wald Chi-square statistic for the interaction term.
***p < .001.
Additionally, we use mortality status two years later and perform logistic regression. The estimates of odds ratios are shown in the last row of Table 5. Again, we do not find a statistically significant interaction term, meaning that the estimates of CES-D on mortality status within two years are the same regardless of the CES-D forms.
4. Discussion
This study evaluates different forms of CES-D in a longitudinal survey, based on data from a nationally representative omnibus survey. Taking advantage of a random assignment of two forms of CES-D to respondents, we are able to examine how the two forms compare with each other in their psychometric properties, their effects on respondent behaviors, and possible form effect in analysis involving data from different forms. As for psychometric properties, both CES-D20 and CES-D8 perform well. Respondents’ perceptions of the interview based on interviewer observations are similar; their survey participation behaviors two years later also do not differ. The only difference in a set of respondent behaviors is related to non-response rates as measured by percentage of respondents with incomplete item responses for the CES-D scale. Due to its larger number of items, CES-D20 has lower percentages of complete CES-D data (i.e., without non-response in any CES-D item) than CES-D8, although the two forms do not differ in percentage of item non-responses. Lastly, the effect of form on analysis using data from the two forms are negligible.
Our research adds to the existing research showing desirable psychometric evidence of the shortened CES-D8 with a large and nationally representative sample of the general population. Despite a notable reduction of the test length, CES-D8 presents adequate psychometric properties. This is consistent with previous research, but most has relied on small and convenience samples (Vilagut et al. 2016). In terms of reliability estimates, CES-D8 shows somewhat lower levels of Cronbach’s alpha than that of CES-D20, but still well above the criterion for use in general household surveys. A similar extent of difference is observed for over time stability between the two forms. CES-D20 shows somewhat higher point estimates of over time correlations than that of CES-D8, but their difference is not critical from a practical point of view. When we focus on their correlation coefficients with several concurrent criterion variables, CES-D20 does not show any merit as compared with CES-D8. In fact, the point estimates of the correlations are even higher for CES-D8 than CES-D20, although such difference may not reach statistical significance. This is consistent with existing research reporting an improvement in evidence of validity after reducing number of items in CES-D (Santor and Coyne 1997). As for factor structures, the two forms have a lot in common. While the single factor model does not fit well with either form, an additional factor that accounts for all positively worded items seems acceptable. Besides its comparable performance in data quality with the longer form, the shorter CES-D8 presents several advantages for survey operation. Its shorter length means less administration time for the measure of depressive symptoms. This results in either shorter survey time and lower survey cost, or more space for other measures to be adopted. In addition, respondents bear less response burden from answering items of similar contents with negative connotations.
The current study addresses the lack of research on respondents’ survey behaviors in large scale omnibus surveys. Non-response behaviors have been studied more often than other behaviors and existing research has found an impact on item non-response rates (Galesic and Bosnjak 2009). If we examine percentage of observations with complete data on CES-D, CES-D8 has an advantage. But given that CES-D8 has far fewer items than CES-D20, this finding is not surprising. When we focus on percentage of non-responses among all eligible items, the two forms do not differ. We also evaluate a number of other survey behaviors. They include respondents’ perceptions of the survey and their participation of future interviews. None of those behaviors are differently affected by taking the long versus short forms of CES-D.
Our finding sends a reassuring message to users of survey data containing different forms of the CES-D in their survey. While some research cautions against the combined use of scores from different forms (Steffick 2000), our study presents a viable way to build a bridge between different forms with a proper design. With random assignment of the forms to respondents within the same wave, we can then construct a common metric of scores between the two forms with equating. Under such data management, we can analyze the data combining the two forms without worrying too much about the different forms taken by respondents.
This study has several advantages. The first is related to its samples. While most existing research has relied on relatively small and convenient samples, the current study presents the case of a very large and nationally representative sample. Second, our study presents a careful design as an effort to build abridgment between the long versus short forms. Our comparison of the two forms is based on a well implemented survey experiment which includes a random assignment of the two forms and administrations of the two forms to two separate but equivalent groups. The latter is especially precious as many studies of this kind is based on an extracted version of the short form from the long form (Jenkinson et al. 2015). Finally, we compare the two forms in multiple angles including psychometric properties, survey behaviors, and effects on data analysis.
There are some limitations of the study. First and foremost, our analysis only involved CAPI participants because the random assignment was done for CAPI participants only. Therefore, the findings cannot be readily generalized to other survey modes such as telephone or web surveys. Future research may examine the possible effects of using forms with varying lengths in other survey modes. Second, the CES-D scale accounts for about 5% of the complete questionnaire. This may be why we have not found significant impacts on respondents’ behaviors. Such finding is relevant for large-scale surveys with many questions for which the target measurement tool is only a small part, but may not be applicable to shorter questionnaires.
5. Conclusion
Replacing the longer CES-D20 with a shorter form of CES-D8 in CFPS does not lead to notable detrimental effect on the data quality. Respondents taking different CES-D forms do not differ much in their respondent behaviors at the current wave or a future wave. With a proper design to enable equating of scores between different forms, we can analyze the data with respondents of both forms, without worrying much about possible form effect.
Supplemental Material
sj-docx-1-jof-10.1177_0282423X241249104 – Supplemental material for Comparing Long- Versus Short-Forms of Depression Scales in an Omnibus Longitudinal Survey
Supplemental material, sj-docx-1-jof-10.1177_0282423X241249104 for Comparing Long- Versus Short-Forms of Depression Scales in an Omnibus Longitudinal Survey by Qiong Wu and Haozhi Qian in Journal of Official Statistics
Footnotes
Funding
The author(s) disclosed receipt of the following financial support for the research, authorship, and/or publication of this article: The research was supported by the Philosophy and Social Science Foundation of Ministry of Education of China (Grant No. 20JZD032).
Supplemental Material
Supplemental material for this article is available online.
Received: February 2023
Accepted: March 2024
References
Supplementary Material
Please find the following supplemental material available below.
For Open Access articles published under a Creative Commons License, all supplemental material carries the same license as the article it is associated with.
For non-Open Access articles published, all supplemental material carries a non-exclusive license, and permission requests for re-use of supplemental material or any part of supplemental material shall be sent directly to the copyright owner as specified in the copyright notice associated with the article.