
Abstract
When analyzing spatially referenced event data, the criteria for declaring rates as “reliable” is still a matter of dispute. What these varying criteria have in common, however, is that they are rarely satisfied for crude estimates in small area analysis settings, prompting the use of spatial models to improve reliability. While reasonable, recent work has quantified the extent to which popular models from the spatial statistics literature can overwhelm the information contained in the data, leading to oversmoothing. Here, we begin by providing a definition for a “reliable” estimate for event rates that can be used for crude and model-based estimates and allows for discrete and continuous statements of reliability. We then construct a spatial Bayesian framework that allows users to infuse prior information into their models to improve reliability while also guarding against oversmoothing. We apply our approach to county-level birth data from Pennsylvania, highlighting the effect of oversmoothing in spatial models and how our approach can allow users to better focus their attention to areas where sufficient data exists to drive inferential decisions. We then conclude with a brief discussion of how this definition of reliability can be used in the design of small area studies.
1. Introduction
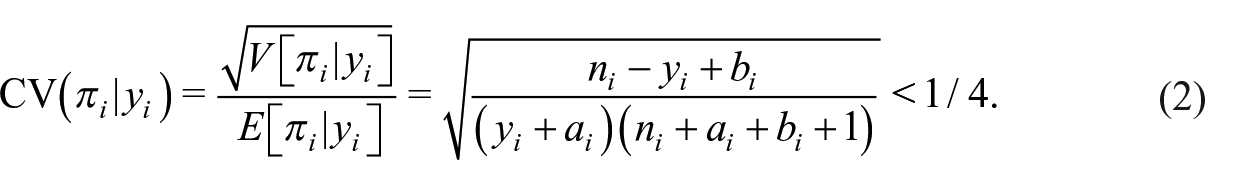
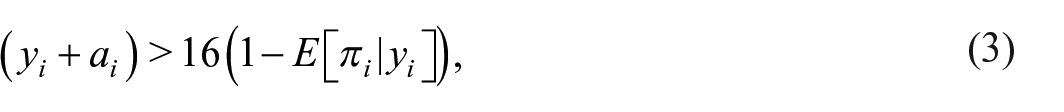
When producing estimates of the incidence of adverse health events (e.g., heart disease related deaths) or the prevalence of a risk factor (e.g., obesity) in small areas, there is a lack of consensus on what constitutes a “reliable” estimate. For instance, the United States Cancer Statistics (USCS) Working Group (2022) recommends declaring an estimate reliable if it is based on sixteen or more cases, while groups such as the New York Department of Health (1999) require twenty or more cases. As an illustration of the complexity of this issue, the Rhode Island Department of Health (2016) and the Utah Department of Health (2009) each provide detailed flowcharts describing when to report an estimate, when to report with a warning about reliability, and when to suppress estimates or aggregate data in their published reports. More recently, the National Center for Health Statistics (NCHS; Parker et al. 2017) produced a report detailing their new standards for reporting proportions, which consist of a mix of guidance based on the sample size (greater than thirty) and the width of the estimate’s confidence interval. Many of these approaches are based on the coefficient of variation (CV; also referred to as the relative standard error)—that is, the standard error of the rate estimate divided by the estimate itself—though the rationale underlying these rules is still quite vague. An exception to this is the criteria of the USCS, which requires that the ratio of an estimate to the width of its 95% confidence interval (assuming normality) be greater than 1 or, equivalently, that
One approach to relieve concerns about reporting estimates with high uncertainty is to aggregate the data across neighboring spatial regions and/or adjacent time periods. For instance, the County Health Rankings and Roadmaps program (CHR&R; Remington et al. 2015) aggregates data over periods of up to seven years in order to provide reliable estimates for as many counties as possible when constructing the measures used to determine their rankings. While aggregation should boost case counts—and thus lead to more reliable estimates—it may also preclude inference on fine-level geographic disparities and/or temporal changes. Perhaps worse, spatially aggregating neighboring regions with vastly different underlying rates can produce estimates that misrepresent each of the individual regions (e.g., Bradley et al. 2017; Spielman and Folch 2015). These concerns serve as a motivation for this work.
When analyzing spatially referenced data, an attractive alternative to data aggregation is to report model-based estimates generated in a Bayesian framework. For instance, methods such as the conditional autoregressive (CAR) model of Besag et al. (1991) and its multivariate extensions (e.g., Gelfand and Vounatsou 2003; Quick et al. 2018) have been used to produce over forty years of county-level estimates of heart disease mortality by age, race, and sex (Vaughan et al. 2019), county-level estimates of suicide rates from 2005 to 2015 (Khana et al. 2018), and census tract-level estimates of obesity rates (Quick et al. 2020). Here, the benefit of using Bayesian methods is two-fold: not only do we obtain more precise (and thus more reliable) estimates via the infusion of prior information, but we may also obtain more accurate estimates by virtue of Bayesian shrinkage (Stein 1956). The key drawback of this, however, is that tasks such as quantifying and specifying the amount of information contributed by our models (relative to the data) is not always straightforward (e.g., Morita et al. 2008). For instance, recent work by Quick et al. (2021) and Song et al. (2024) illustrated that the informativeness of CAR model framework of Besag et al. (1991)—when left to its own devices—could far exceed the contribution of the data in most regions, leading to oversmoothing and potentially untrustworthy inference. While the authors provided guidance with regard to how to restrict the model’s informativeness, here we will provide a rationale for determining an appropriate cap on how much information the model should be allowed to contribute.
With this background in mind, the objectives of this paper are two-fold. First and foremost, we provide a definition for a “reliable” estimate of an incidence or prevalence rate that is based on statistical point and interval estimates. Not only does this definition accommodate crude and model-based estimates, but it also allows for discrete and continuous statements of reliability—for example, distinctions of reliable versus unreliable and the ability to indicate when one estimate is more reliable than another. Secondly, by anchoring this definition in a Bayesian framework, we allow users to infuse prior information (e.g., spatial structure) into their models to improve the reliability of their estimates. In doing so, however, we must also be cognizant of the influence these models may have on our estimates. As such, the foundation for the proposed work is the need to “embrace uncertainty”—that is, rather than designing models to ensure that all estimates are reliable, we will provide guidance for restricting the informativeness of the Besag et al. (1991) CAR model with an eye toward requiring a sufficient number of cases be observed for estimates to be deemed “reliable.”
2. Methods
2.1. Definition of Reliability
We begin by assuming

and yields interpretations of
To identify conditions for
when
We thus generalize the USCS reliability criteria as a function of quantiles of the posterior distribution as follows:
Definition 1. Estimates of the rate parameter pi obtained from the posterior distribution
We also define the relative precision of an estimate at the
2.2. Impact of Informative Priors
Using this definition of reliability, the requirement from (3), and a relatively noninformative prior for pi —that is,
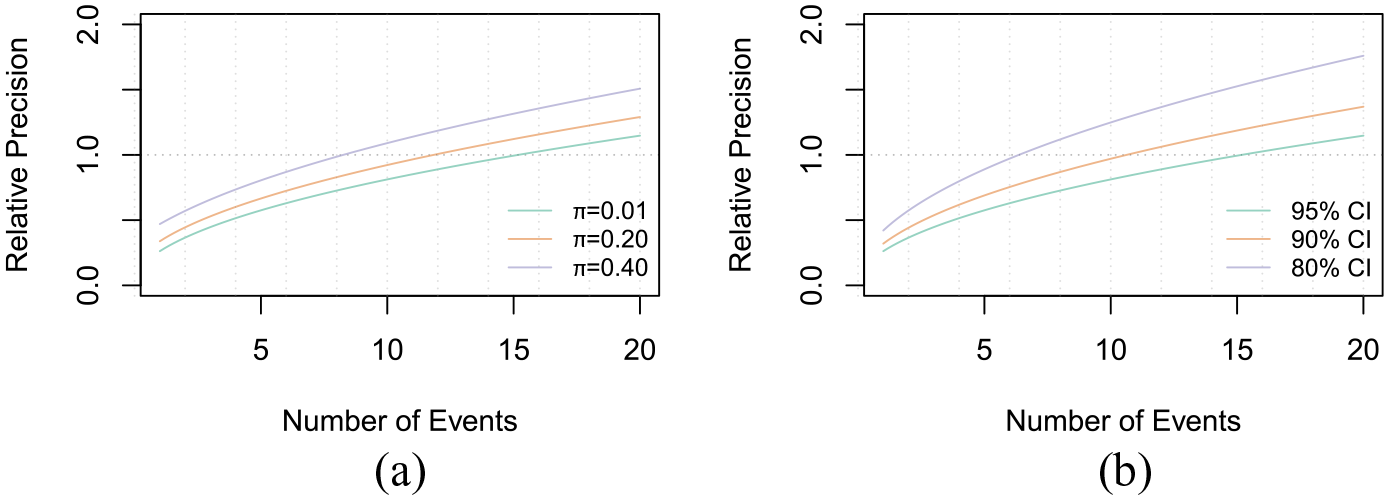
Comparison of the relative precision as a function of the number of events. Panel (a) displays the relative precision at the 0.95 level for various underlying event rates, and Panel (b) displays the relative precision for various levels of reliability for an event rate of pi = 0.01. (a)Relative Precision × Event Rates and (b) Relative Precision × Levels of Reliability.
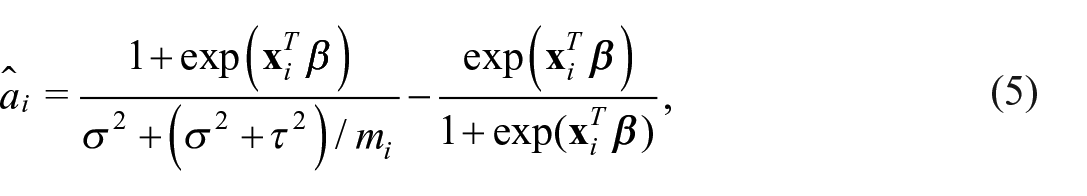
While the results above are convenient, the true benefit of this definition of reliability is revealed when we consider informative prior specifications for pi. For instance, suppose we are analyzing a dataset comprised of the number of infants born preterm (i.e., before thirty-seven weeks of pregnancy) out of the total number of births in one or more small areas and that prior information indicates that 10% of infants are born preterm. Based on equation (3), our posterior number of preterm births,
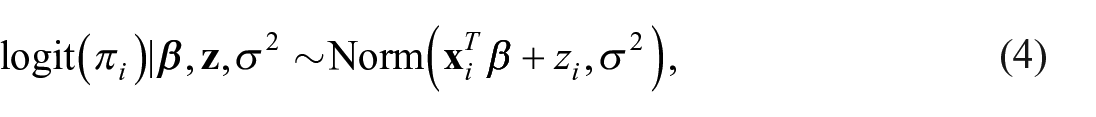
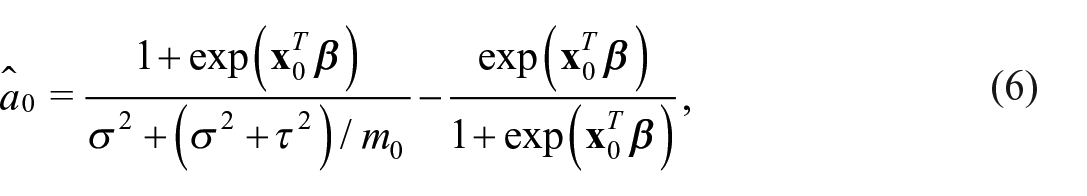
That said, explicitly incorporating prior information as described above is not a common practice. Furthermore, in the context of disease mapping, it is common to consider a model specification in which
where
where
wherein
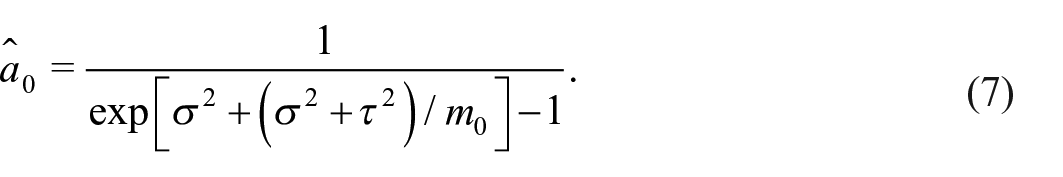
Finally, it should be emphasized that in the beta-binomial framework in equation (1), it was implicitly assumed that the hyperparameters
3. Case Study: Rates of Preterm Birth in PA Counties
To illustrate how this approach can be used in practice, we conduct a case study pertaining to preterm birth in Pennsylvania counties from 2010 to 2019. The data are stratified by both year and race/ethnicity of the mother (white, black, Hispanic, and Asian) and were obtained from the Pennsylvania Department of Health’s (2020) web-based Enterprise Data Dissemination Informatics Exchange (EDDIE) system. In the EDDIE system, race/ethnicity is coded as white, black, Hispanic, or Asian with the caveat that these groups may not be mutually exclusive (e.g., mothers coded as “white” may be Hispanic or non-Hispanic white). For the purposes of our analysis, however, we will analyze each of these combinations of racial/ethnic groups and time-periods as separate, distinct datasets; doing so will allow us to make comparisons between datasets that are both similar (i.e., comparisons across time within each racial/ethnic group) and quite different (i.e., comparisons between racial/ethnic groups with different geographic distributions and/or underlying event rates) to assess the degree to which our results are anomalous or in fact phenomena that can commonly occur in analyses of real data.
A summary of the data is provided in Table 1. Here, we see evidence of several important features. First and foremost, we see evidence of Pennsylvania’s racial demographics, where not only were approximately 70% of the state’s births to white mothers, but also that racial/ethnic minority mothers—particularly black and Asian mothers—are more geographically concentrated in the state’s urban centers, Philadelphia and Pittsburgh. As a result, data from racial/ethnic minority mothers are sparse, with more than 30% of Pennsylvania’s counties experiencing zero preterm births from black, Asian, and Hispanic mothers and two-thirds of counties experiencing fewer than ten. That being said, Table 1 also displays evidence of high racial/ethnic disparities in the incidence of preterm birth, with black mothers in Pennsylvania experiencing rates nearly 50% higher than their non-black counterparts. Thus, demographic challenges notwithstanding, exploring county-level trends in preterm birth by race is of epidemiologic interest, thus motivating the use spatial models to produce more stable estimates than the data alone can provide.
Summary of the Pennsylvania Preterm Birth Data, Presented as Averages Over the Ten-Year Period, 2010 to 2019.
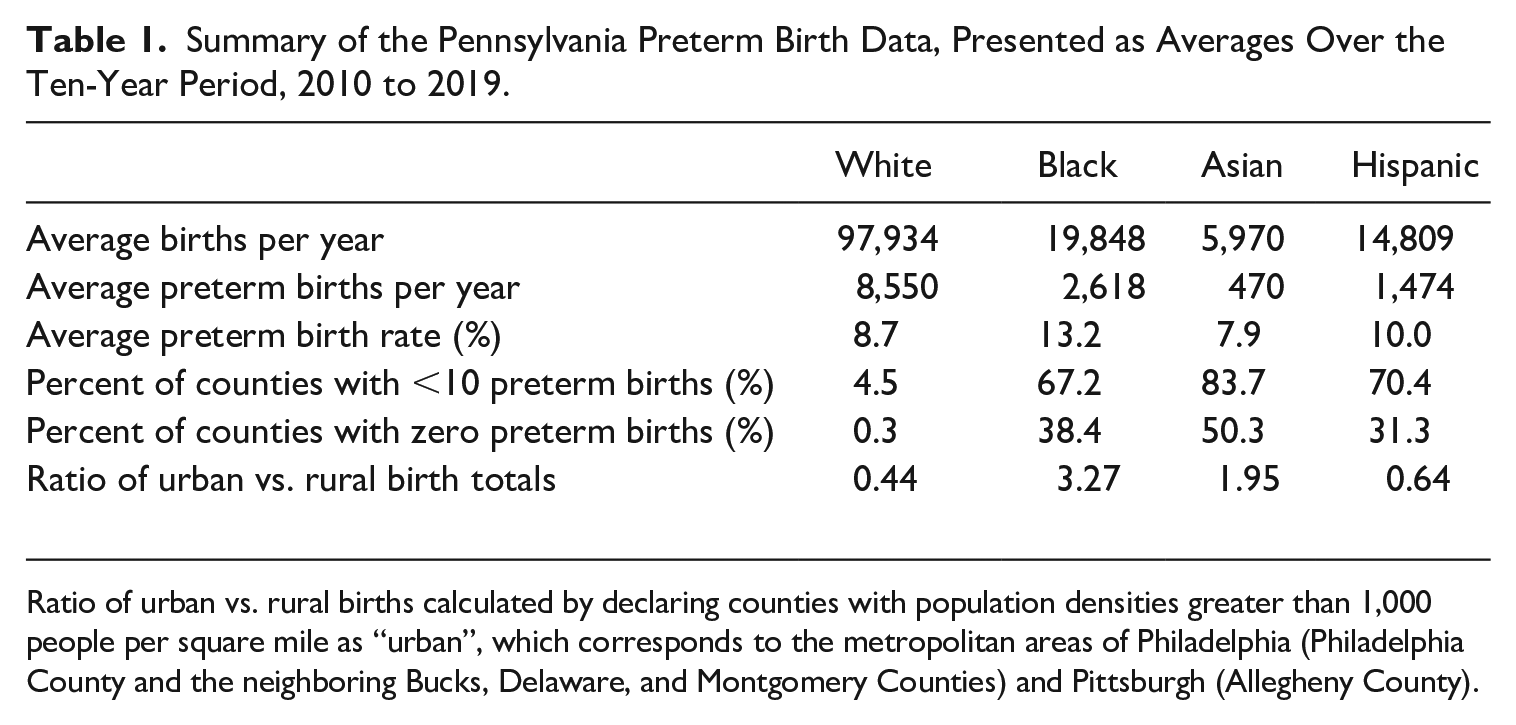
Ratio of urban vs. rural births calculated by declaring counties with population densities greater than 1,000 people per square mile as “urban”, which corresponds to the metropolitan areas of Philadelphia (Philadelphia County and the neighboring Bucks, Delaware, and Montgomery Counties) and Pittsburgh (Allegheny County).
With this background in mind, we let
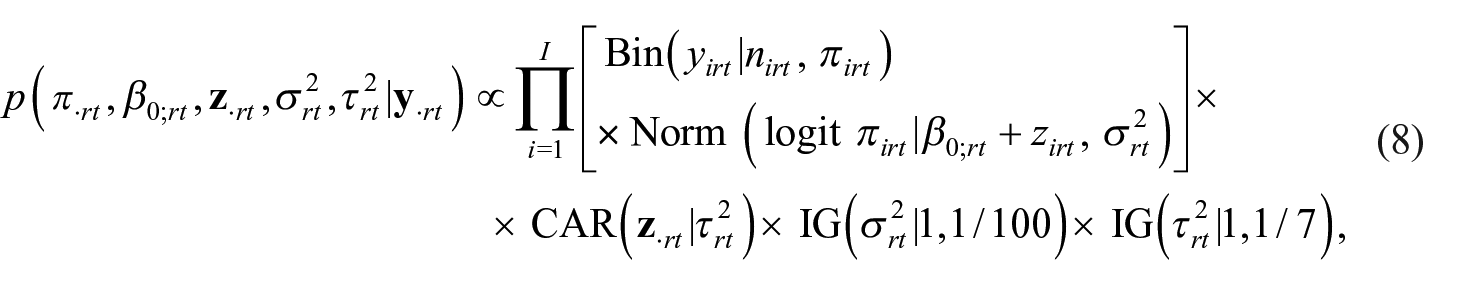
denote a standard CAR modeling approach, where the priors above for
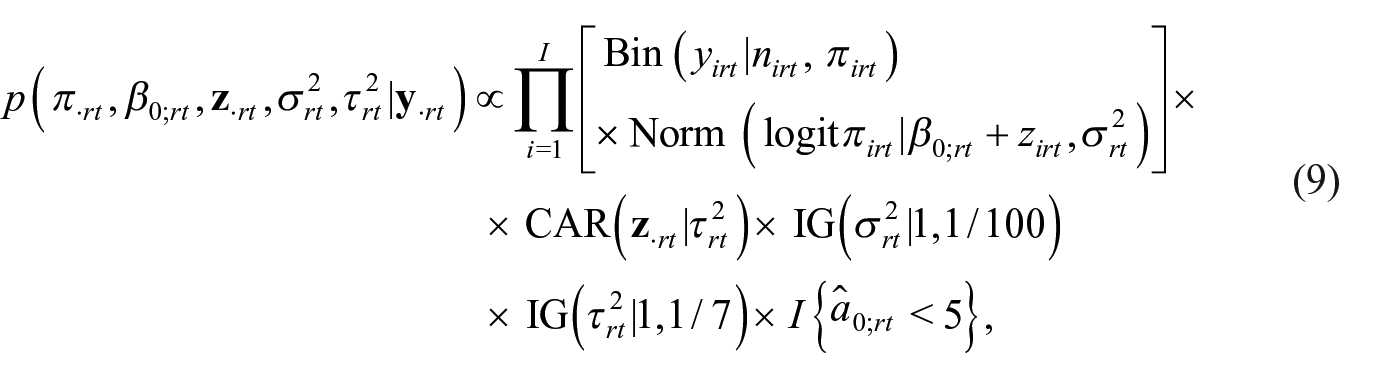
denote our restricted CAR modeling approach. Both the standard and restricted models were fit in R (R Core Team 2020) using Markov chain Monte Carlo (MCMC) algorithms run for a total of one hundred thousand iterations, with separate runs for each combination of race/ethnicity and year. For the sake of uniformity and to ease the computational burden of the post hoc analyses, the first fifty thousand iterations of each chain were discarded as burn-in and the last fifty thousand iterations were thinned by a factor of 10, resulting in five thousand iterations’ worth of samples for each combination of race/ethnicity and year for both the standard and restricted models.
Before we discuss the rate estimates themselves (and their degree of reliability), we consider the estimates for the informativeness of the standard CAR models (based on
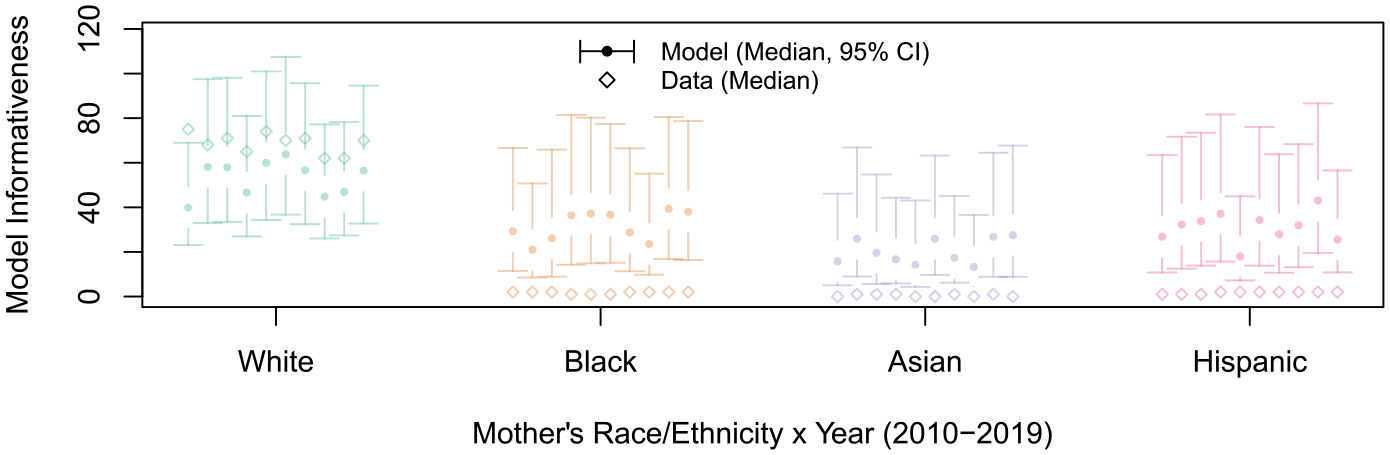
Comparison of the estimated model informativeness parameters,
To illustrate the potential impacts of oversmoothing, we consider the estimates for white mothers in McKean County in 2010 and the estimates for black mothers in Adams County in 2019 shown in Figure 3. In Figure 3a, we see that while the restricted CAR model yields an estimate for white mothers in McKean County that is fairly consistent with the observed data (17.2%)—reflecting the relatively large number of preterm births observed in the data (74)—the heightened informativeness of the standard CAR model has pulled the estimate away from its observed rate toward the rate in the neighboring counties (11.4%). As we illustrate at greater length in Supplemental Appendix C (and specifically in Figure C.1), such extreme oversmoothing could inhibit our ability to detect outlying regions and thus could stymie state and local health departments’ intervention efforts. Meanwhile, Figure 3b illustrates a second drawback of the standard CAR model’s tendency to oversmooth estimates: an (unwarranted) increase in precision. Specifically, Adams County is a predominantly white, rural county in which only two preterm births were observed for black mothers (out of nine total births) in 2019. While the observed rate for this county is consistent with both its neighbors and the overall state-level average for black mothers, the standard CAR model produces an estimate whose relative precision is twice that of the estimate produced by the restricted CAR model and consistent with that of a county with over thirty preterm births.
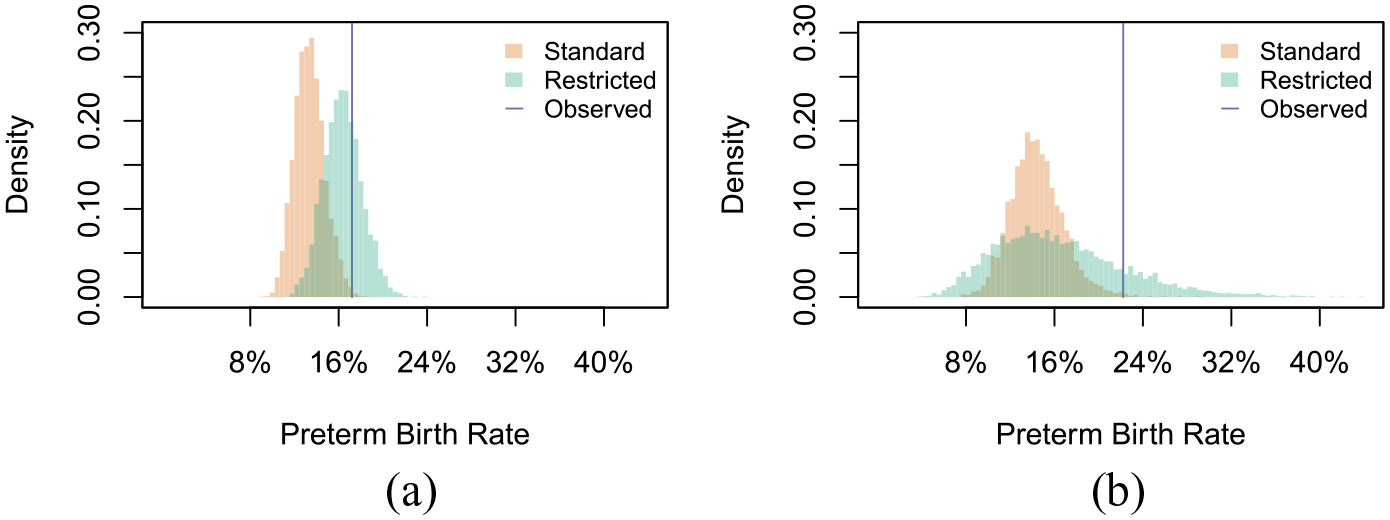
Comparison of the posterior distributions of rate parameters, pirt, under the standard and restricted CAR models for white and black mothers in selected counties: (a) White Mothers; McKean County and (b) Black Mothers; Adams County.
Having discussed the effect oversmoothing can have on an individual county’s estimates, we now shift our attention to the primary focuses of this paper: maps of estimates and reliability. To do so, we consider the maps shown in Figure 4 and the relative precision plots shown in Figure 5. We begin by comparing the estimates for white mothers in 2019 based on the standard CAR model in Figure 4a to those based on the restricted CAR model in Figure 4b. While the overall geographic patterns are similar, the estimates from the restricted model have more extreme values, a manifestation of the phenomenon observed in Figure 3a. In addition, estimates for several counties are deemed unreliable in the restricted model; in contrast, all of the estimates produced by the standard CAR model are deemed reliable. As shown in the relative precision plot in Figure 5a, the unreliable estimates under the restricted model (i.e., those with a relative precision less than 1) all correspond to instances where
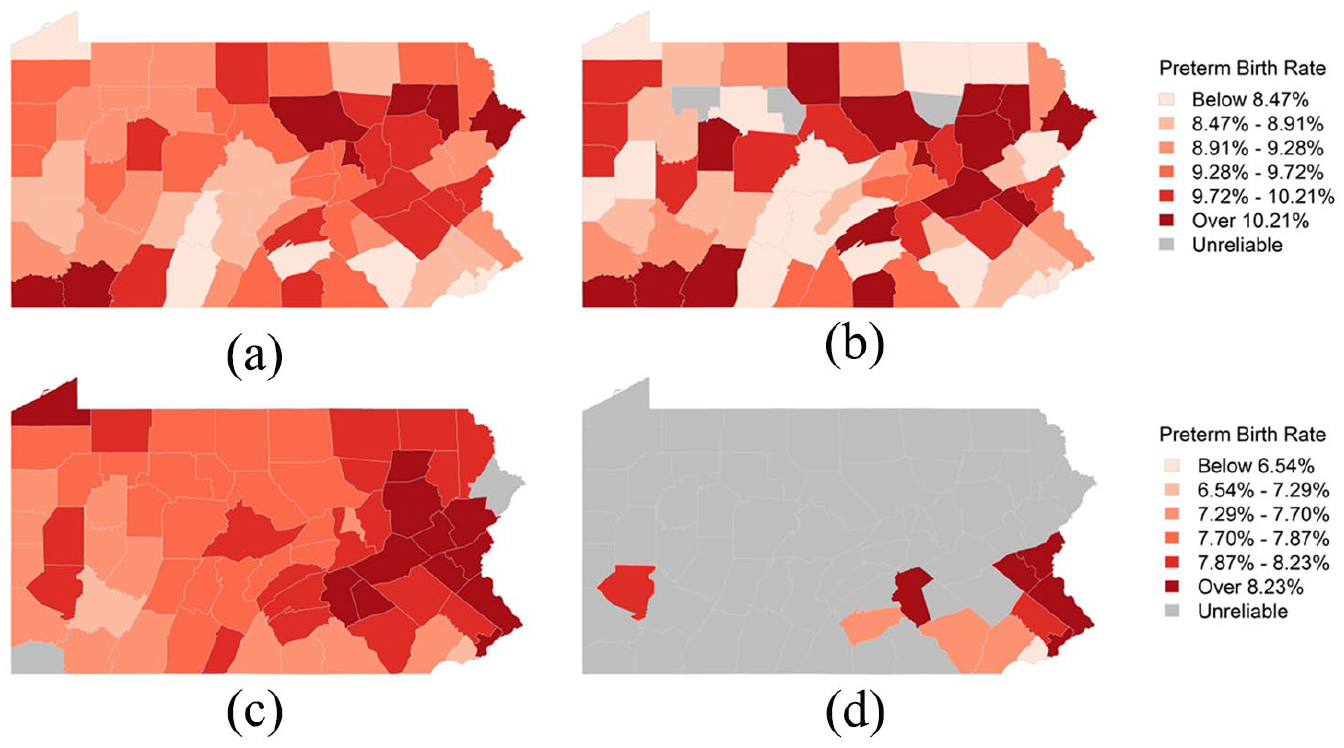
Comparison of the preterm birth rates for white and Asian mothers in 2019 from the standard and restricted CAR models: (a) White Mothers: 2019 (Standard), (b) White Mothers: 2019 (Restricted), (c) Asian Mothers: 2019 (Standard), and (d) Asian Mothers: 2019 (Restricted).
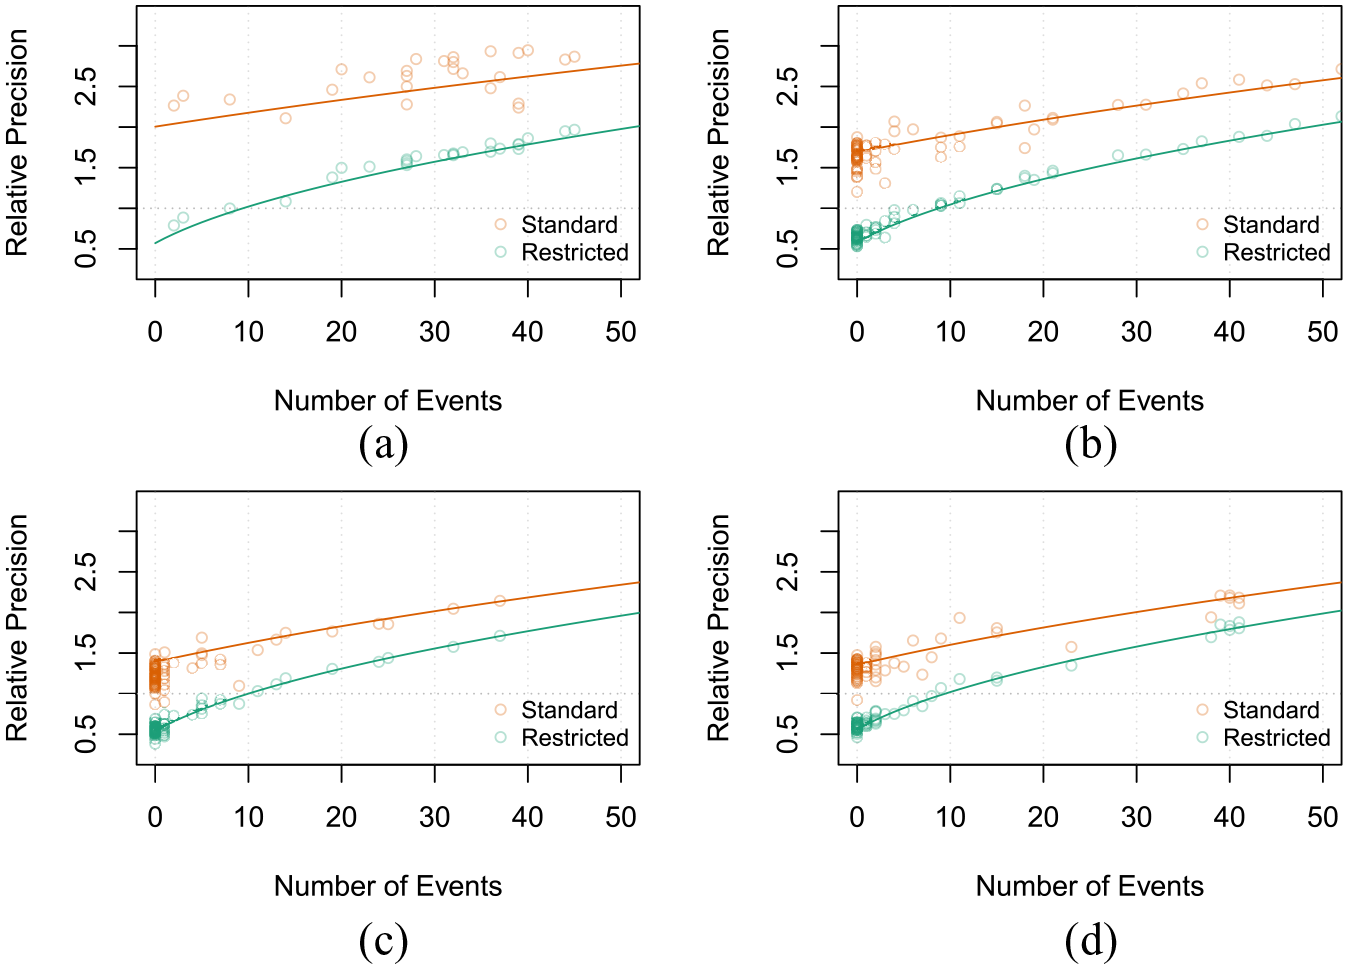
Comparison of the relative precision of the race/ethnicity-specific estimates from 2019 under the standard and restricted CAR models: (a) White Mothers: 2019, (b) Black Mothers: 2019, (c) Asian Mothers: 2019, and (d) Hispanic Mothers: 2019.
While the results for white mothers in Figures 4a and 4b provided a subtle illustration of the difference between the standard and restricted CAR models, the results for Asian mothers in Figures 4c and 4d illustrate a much more stark difference. Specifically, unlike Pennsylvania’s white population, racial minorities in Pennsylvania are much more geographically concentrated in the state’s major metropolitan areas. As such, the heightened informativeness of the standard CAR model not only yields reliable estimates in all but two counties, but it also produces a very spatially smooth map as very few counties experienced enough preterm births to overrule the model’s spatial structure. In contrast, the restricted CAR model again results in a de facto requirement that
Finally, the discussion up until this point has treated “reliability” as a binary “reliable versus unreliable” property of an estimate, but a key feature of our definition of a reliable estimate is that we can determine an estimate’s level of reliability by identifying the value of
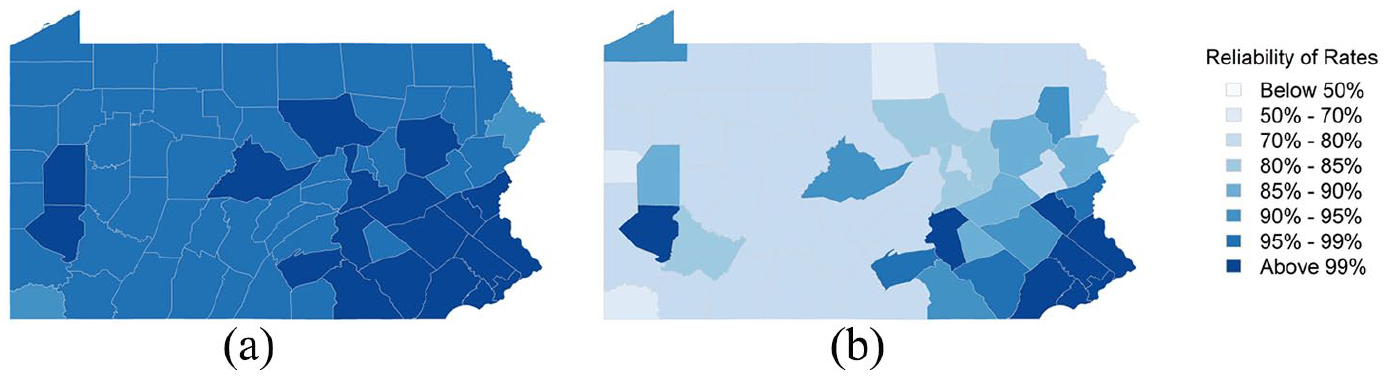
Comparison of the level of reliability of the estimates of the preterm birth rate for Asian mothers in 2019 under the standard and restricted CAR models: (a) Asian Mothers: 2019 (Standard) and (b) Asian Mothers: 2019 (Restricted).
4. Discussion
This paper was motivated by the lack of consensus in the statistical and epidemiologic literature regarding the requirements for an estimate of an event rate to be deemed “reliable.” The proposed definition in Section 2 accommodates both crude and model-based estimates, as well as discrete (reliable vs. unreliable, based on some predetermined level) and continuous statements of reliability. Equally important, our definition of reliability can be directly related to the posterior number of events—that is, the sum of the observed number of events and the prior number of events—thereby allowing users to restrict the informativeness of their model specification such that a minimum number of events must be observed in order to expect to obtain a reliable estimate. Moreover, while properties of our definition of reliability are most clearly conveyed via the conjugate beta-binomial and Poisson-gamma modeling frameworks, the approximations proposed in Quick et al. (2021) and Song et al. (2024) allow us to extend these properties to the Besag et al. (1991)-framework commonly used in the disease mapping literature where the question of reliability often arises. Finally, while the notion of restricting the informativeness of the Besag et al. (1991)-framework was first proposed by Quick et al. (2021) and Song et al. (2024), the reliability criteria used here provides a rationale for imposing restrictions on the model that was lacking in their work. Future work aims to extend these restrictions to other, more recently developed approaches for disease mapping (e.g., Datta et al. 2019; Leroux et al. 2000), methods for multivariate spatial and spatiotemporal settings (e.g., Gelfand and Vounatsou 2003; Quick et al. 2017)—particularly for the purpose of estimating age-standardized rates from age-stratified event data—and other challenges encountered in disease mapping that may complicate determinations of reliable vs. unreliable estimates (e.g., zero-inflated data (Agarwal et al. 2002), left-censored data (Quick 2019), and undercounting (Schmertmann and Gonzaga 2018)). In the interim, however, we recommend researchers assess the relative precision of their estimates to gain insight into the model’s informativeness prior to declaring estimates as reliable or unreliable.
A principal underpinning of this work is that declaring an estimate as “reliable” conveys an element of trustworthiness, not simply that an estimate is precise. As such, we believe the motivation of using model-based estimates should not be to produce “reliable” estimates but rather to improve the estimates’ precision in a deliberate and measured manner. Thus, the objective of this paper is to describe how researchers can exercise restraint and use criteria for reliability to inform the design of their statistical models to obtain estimates that have a desired level of precision. In addition, a key feature of the reliability definition provided here is that the continuous quantification of reliability provides researchers some flexibility with regard to presenting their results. For instance, Figure C.4 of the Supplemental Appendix illustrates how dynamic and/or interactive data visualization tools can be used to display estimates with varying levels of reliability as an alternative to producing maps with few “reliable” estimates or to artificially inflating the precision of estimates (e.g., by using an overly informative model) for the purpose of having more estimates being deemed “reliable.”
Finally, we recognize that there are situations where only the most highly populated regions will experience enough events in a standard amount of time (e.g., one year) to be deemed reliable, with or without the contribution of prior information, particularly when producing estimates for and making inference on rare outcomes. In these situations, rather than increasing the model’s informativeness, the requirements for reliability can instead be used as a basis for combining data across multiple time periods. For instance, based on the expected preterm birth rates for each of the race/ethnicities considered in Section 3, combining four years of data with a model specification that contributed
Supplemental Material
sj-zip-1-jof-10.1177_0282423X241244917 – Supplemental material for Reliable Event Rates for Disease Mapping
Supplemental material, sj-zip-1-jof-10.1177_0282423X241244917 for Reliable Event Rates for Disease Mapping by Harrison Quick and Guangzi Song in Journal of Official Statistics
Footnotes
Funding
The author(s) disclosed receipt of the following financial support for the research, authorship, and/or publication of this article: Support for this work came from the County Health Rankings & Roadmaps program and the National Heart, Lung, And Blood Institute of the National Institutes of Health, United States under Award Number R01HL158802. The content is solely the responsibility of the authors and does not necessarily represent the official views of the National Institutes of Health.
Supplemental Material
Supplemental material for this article is available online.
Received: February 2023
Accepted: December 2023
References
Supplementary Material
Please find the following supplemental material available below.
For Open Access articles published under a Creative Commons License, all supplemental material carries the same license as the article it is associated with.
For non-Open Access articles published, all supplemental material carries a non-exclusive license, and permission requests for re-use of supplemental material or any part of supplemental material shall be sent directly to the copyright owner as specified in the copyright notice associated with the article.