
Abstract
Reliable estimates of age-specific vital rates are crucial in demographic studies, while ages are, in most cases, commonly grouped in bins of five years. Indeed, public health and national systems require single age-specific data to achieve accurate social planning. This paper introduces a deep learning approach for splitting the abridged death rates, providing a more comprehensive perspective on the indirect age-specific vital rates estimation from grouped data. Additionally, we contribute to the existing literature by introducing a multi-population (countries and genders) approach, providing reliable estimates considering the heterogeneity of longevity dynamics over age, years, and across populations. We also contribute to the state of the art in indirect estimation by introducing, for the first time, a multi-population indirect estimation leveraging subnational data. Our model accurately captures mortality dynamics by age over time and among different populations. We prove the model’s ability to estimate reliable predictions of age-specific mortality rates by also studying how the hyperparameters’ choice affects the model reliability and analyzing the age-specific relative differences between the real and the estimated mortality rates.
1. Introduction
Monitoring changes and inequality among populations is a prime aim in assessing population dynamics and social and public policies. Thus reliable predictions of age-specific vital rates are crucial in demographic studies. Data deficiency usually refers to incomplete or misreported information, such as age exaggeration and age heaping in both death and population data.
Despite single age-specific data being desirable, ages are commonly grouped in bins of five years in most cases. It is the case of demographic data, which is followed by a broad or open-ended age class for older ages. Several methods have been proposed for the disaggregation problem of historical data and data from developing countries that lack functional systems of vital registration (Liu et al. 2011; McNeil et al. 1977; Schmertmann 2012; Smith et al. 2004). Using countries from the Human Fertility Database (HFD), Liu et al. (2011) derived age-specific fertility rates from abridged data comparing ten different methods. The authors concluded that the modified Beers method (Beers 1945) provided the best fit. Similarly, Schmertmann (2012) using schedules observed in the HFD and the US Census International Database (IDB) proposed a calibrated spline (CS) as a more accurate and flexible alternative to the Beers interpolation method that requires more computation.
Among mortality modeling, the main approaches aimed at ungrouping histograms or abridged life tables were based on parametric assumptions for the underlying distribution (Hsieh 1991; Kostaki 1991; Kostaki and Panousis 2001), also for fitting a non-parametric density to binned data are generally used histosplines (Boneva et al. 1971), kernel density estimators (Blower and Kelsall 2002) and local likelihood. One of the most prominent frameworks has been proposed by Rizzi et al. (2015) who developed a versatile method for ungrouping histograms based on the composite link model with a penalty added to ensure the smoothness of the target distribution. Estimates are obtained by maximizing a penalized likelihood. Further, Rizzi et al. (2016) identify and compare the performance of five non-parametric methods for ungrouping count data, two spline interpolation methods, two kernel density estimators, and the penalized composite link model introduced by Rizzi et al. (2015). They found that the latter model outperforms the other four when data are grouped in wide age classes, or classes are open-ended.
Nevertheless, Rizzi’s model relies on a parametric framework, specifically the Poisson distribution, which assumes a certain regularity in demographic distributions. However, as observed in real-world scenarios, demographic patterns often deviate from parametric assumptions, exhibiting complexities such as asymmetries or bimodal trends. Additionally, working with subpopulations with a limited number of deaths, as often encountered in demographic studies, can further jeopardize the precision of estimates due to probabilistic assumptions.
It is worth pointing out that, Rizzi’s method, akin to other ungrouping approaches, is centered around estimating individual populations. Notably, no prior study has proposed a multi-population approach encompassing both gender and country variations. Attempting such estimations independently for each population might not ensure accurate results. Indeed, estimations often require harmonization, comparability, and coherence among countries and gender. Working on a single-gender population, the models above do not guarantee the latter properties, jeopardizing the comparability across time and among countries. Thus relying on coarsely grouped data may hamper precise data analysis. In contrast to the present literature, our proposed methodology not only addresses these limitations but also introduces improvements. Therefore, in this paper, we introduce a multi-population (countries and genders) approach for splitting the abridged demographic rates, providing a more comprehensive perspective on the age-specific vital rates estimation from grouped data. The model leverages deep learning algorithms based on deep neural networks (DNN) to uncover age-specific vital rates. It is worth pointing out that the ungrouping methods discussed above (for example, Beers 1945; Rizzi et al. 2015; Schmertmann 2012), besides working on a single population, obtain the ungrouped estimates as a latent realization of an underlying process, in most cases also using smoothing interpolations. Therefore, it does not require supervised learning, and thus, the Train versus Test splitting, as in a deep learning approach, is unnecessary. In light of that, due to the different methodological frameworks, the comparison with existing literature would be inadequate since any comparison against the proposed model would be unreliable.
Deep learning has shown promising results in many applications enhancing a general interest in this methodology to solve complex problems, make predictions, extract information from data, and provide reliable estimates.
The choice of employing deep learning, over traditional machine learning methods such as regression trees, random forest, or XGBoost algorithms is supported by various factors stemming from the abilities of deep learning architectures to capture intricate relationships and patterns in complex datasets, to handle non-linear relationships within the data. Furthermore, we can mention end-to-end learning, eliminating the need for manual feature engineering and preprocessing steps, capacity for representation learning (as the model can automatically discern relevant features), and finally, handling high-dimensional data. For a comprehensive treatment of these concepts, the reader can refer to Bengio et al. (2000).
While the advantages of deep learning are significant, it’s essential to note that the choice between deep learning and traditional methods depends on factors such as the nature of the data, the complexity of the problem, and the availability of computational resources. Where intricate patterns in large and complex datasets need to be uncovered, deep learning often proves superior. Indeed, throughout the literature on non-traditional methods in mortality modeling, the literature on machine learning (ML) and deep learning (DL) is well-distinct.
Contributions of deep learning in longevity have been proposed in order to forecast demographic time series using recurrent neural networks (Levantesi et al. 2022; Nigri et al. 2021), and also in the field of actuarial science to predict death rates (see, e.g., Nigri et al. 2019; Perla et al. 2021; Richman and Wüthrich 2021; Scognamiglio 2022). The literature devoted to the longevity model for indirect estimation is based on the deep learning model. Indeed, more recently, Nigri et al. (2022d) formalized a deep neural networks approach to indirectly derive age-specific mortality from observed or predicted life expectancy by leveraging deep learning algorithms akin to demography’s indirect estimation techniques.
We contribute to the discussion on the ability of deep learning to provide reliable predictions by using it to ungroup mortality data for multiple populations. More specifically, we build up a DNN model to estimate the multi-population age-specific death rates from grouped death rates in five-year age classes, except for the oldest age class (100–110), which is wider. We assess the model prediction performance on the out-of-sample data through traditional error measures, Root Mean Square Error and Mean Absolute Error. These measures allow for detecting the aggregate prediction ability of the model.
We take a significant stride in advancing the indirect estimation literature by extending the proposed method to the sub-national level. In a context where all indirect methods have traditionally been designed for national-level applications, a multi-population (at the regional level) indirect model signifies noteworthy progress. This is particularly significant because subnational data may be subject to stochastic variation in vital event numbers owing to the smaller population size, thus putting the indirect model to the hard test. The proposed model shows remarkable results in terms of accuracy and ability to capture longevity dynamics even at the subnational level.
The proposed model represents an advance in mortality modeling, offering the advantage of an indirect and complementary way to approximate age-specific death rates. It can be valuable in contexts where population-level mortality studies are hindered by financial or time constraints for national registries that do not support the open data system.
The remainder of the paper is structured as follows. Section 2 introduces the fundamentals of neural networks. Section 3 describes the specific framework of the neural network model for ungrouping mortality data. Section 4 presents the implementation of the neural network model and its structural reliability. Section 5 provides the results of the numerical experiment. Finally, Section 6 concludes the paper.
2. Neural Networks
Neural networks (NN) are high-dimensional and non-linear regression models that have achieved notable results in several fields such as computer vision and natural language processing. They consist of interconnected computational units, called neurons in the NN jargon, arranged on different layers that learn from data using training algorithms. The weights connect the units on the layers, and the connection configuration defines different kinds of NN. This section formally introduces the Fully-Connected Network (FCN) and the Embedding Network (EN) layers which have been used in this research.
Let

The output of each unit is a new feature
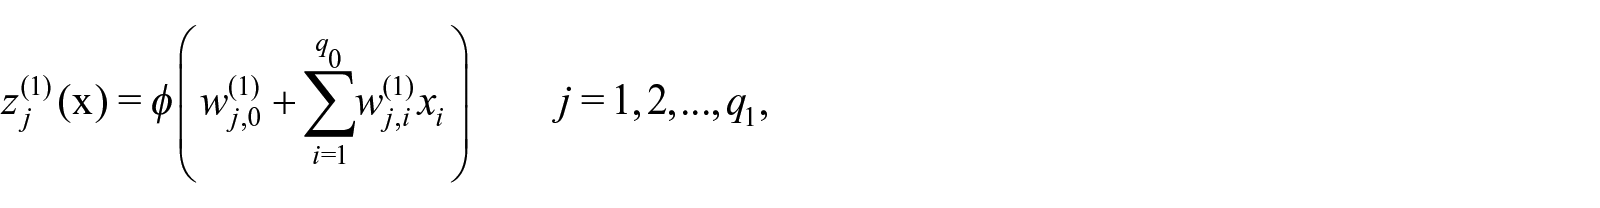
where

Shallow neural networks present a single hidden layer and directly use the features for computing the quantity of interest

where

where the vectorial functions
where * denotes the element-wise product and
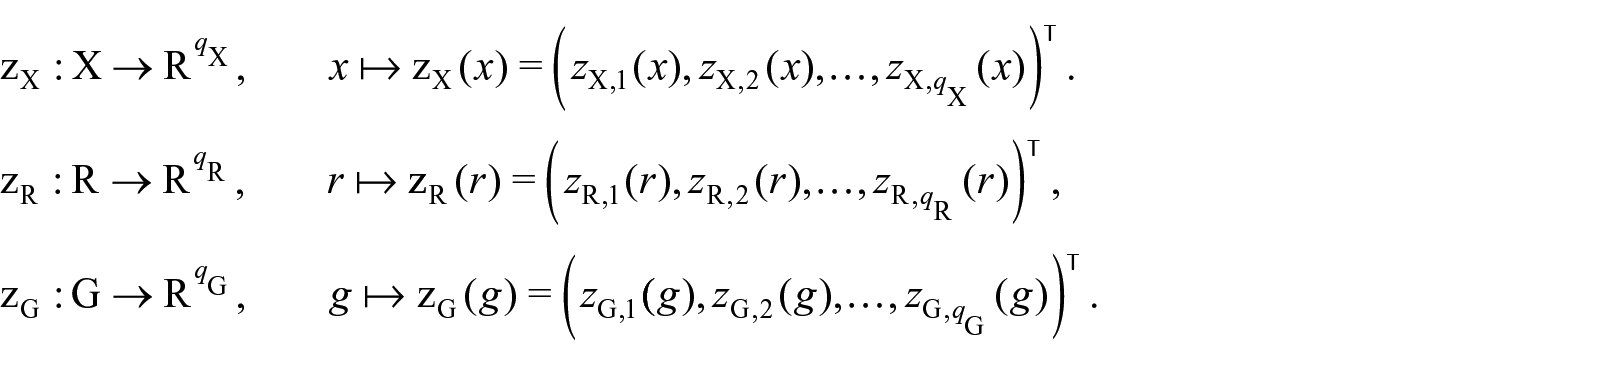
An Embedding Network (EN) Layer maps the levels of a categorical variable into a low-dimensional real-valued space. The dimensionality of the new space

The number of embedding parameters to learn during the network calibration is
The elements of the matrices

where
3. The NN Model for Ungrouping Mortality Data
Let

where
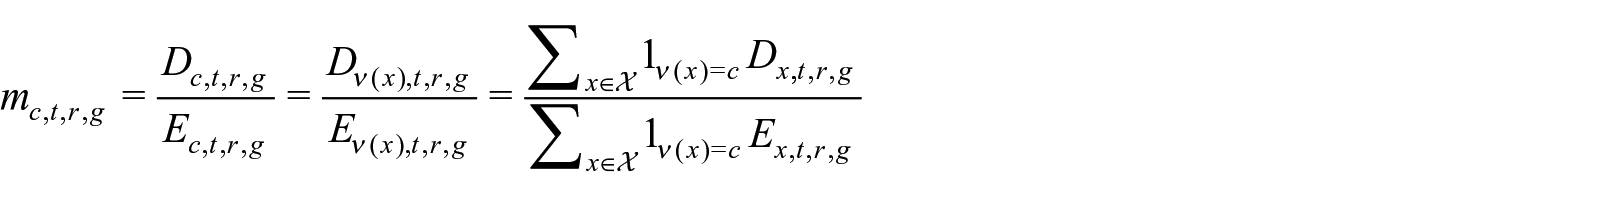
We argue that the single-age death rate


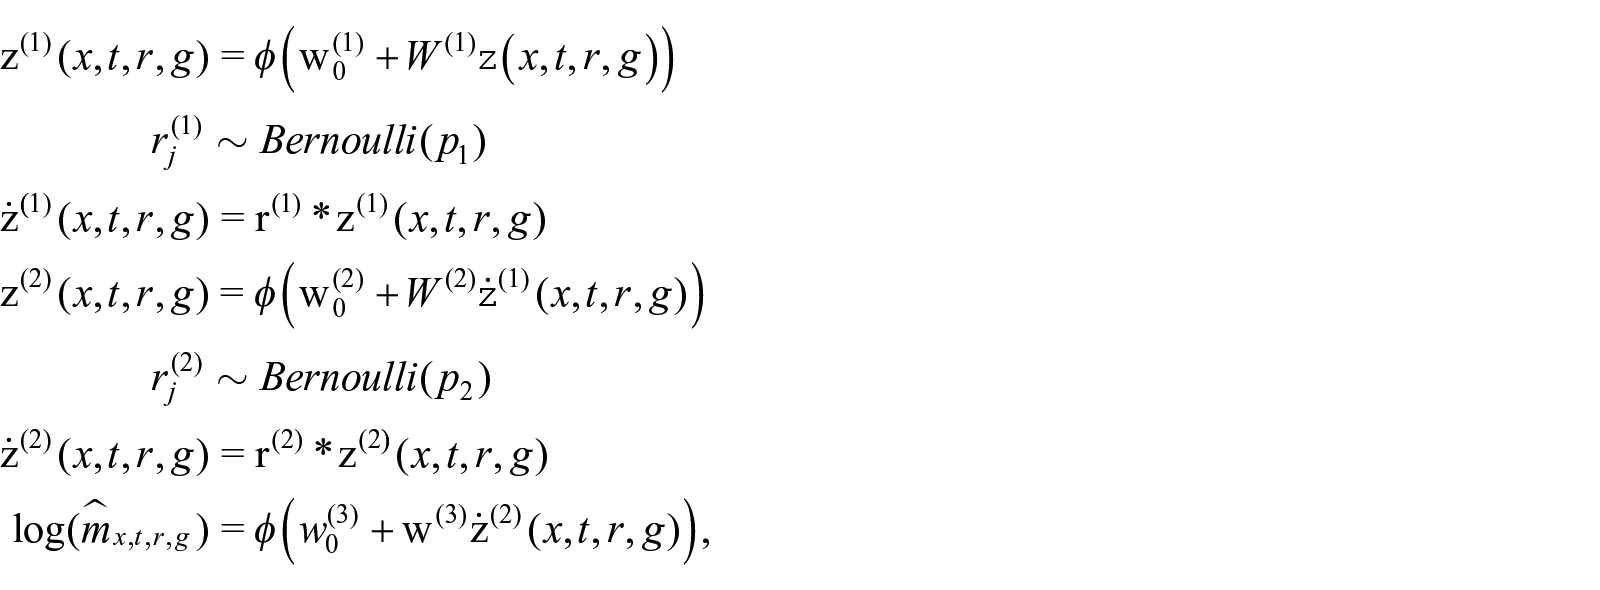
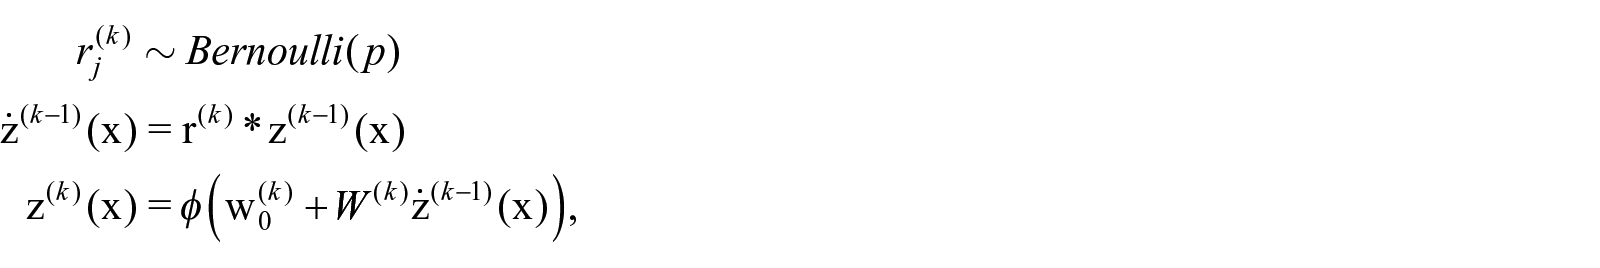
where
The weight matrices and bias vectors of the FCN layers and the parameters of the embedding layers need to be appropriately calibrated. These parameters are iteratively adjusted via the BP algorithm to minimize a specific loss function. Following the practice adopted in the mortality literature (Hainaut 2018; Perla et al. 2021; Richman and Wüthrich 2021), we fit our model using the Mean Squared Error (MSE) (Hainaut 2018; Perla et al. 2021; Richman and Wüthrich 2021). In such a case, the training of the network requires the minimization of the loss:
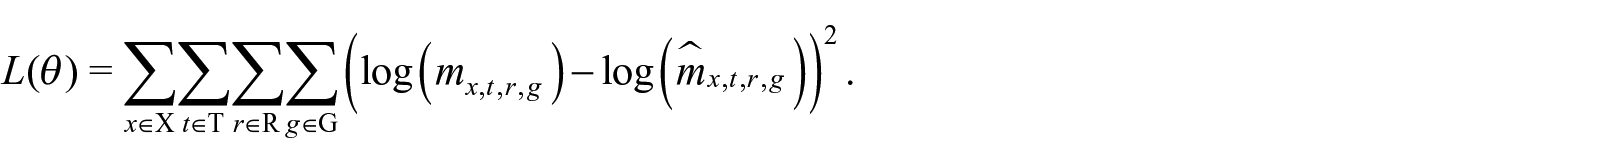
where
4. Implementation
Let
The best DNN setting during the training phase is used to obtain predictions in the test phase.
Hence, let
The values of grouped death rates over a subsequent period,
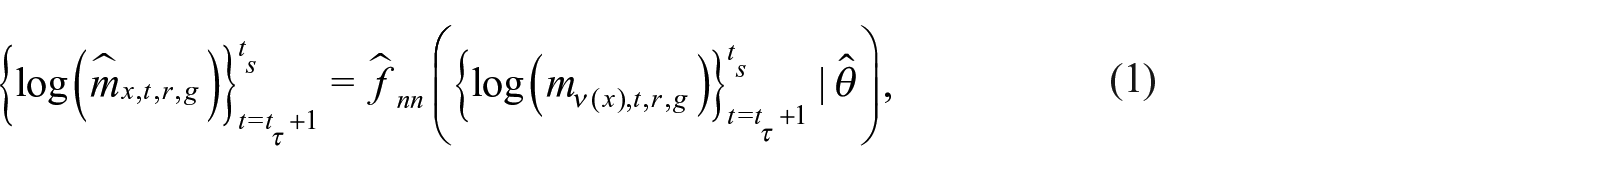
where
4.1. Parameters and Structural Reliability Analysis of DNN
Deep learning modeling often outperforms statistical methods, especially for prediction tasks, approximating even the most complex functional structure. To achieve this result, it is necessary to identify the optimal NN setting (i.e., the number of hidden layers, neurons, and parameters); generally, it is obtained by performing a fine-tuning phase. Nevertheless, NN is a model subject to different uncertainty sources that might affect the learning phase (Richman 2021), and the effect of hyperparameters’ choice on model reliability is still an open question, often underrated.
The fine-tuning aims to choose a reliable DNN architecture, considering, for example, the number of hidden layers, and activation functions. The most suitable structure depends on the data type and is generally selected according to the validation error minimization. The outcome prediction sensitivity for different training setups is a common issue in deep learning. Despite the variability in the input data being considered in all inferential methods, when it comes to deep learning, one should also view the source of variability that originates from the optimization procedure.
We seek to justify our structural choice by examining the reliability of the Deep Neural Network (DNN) in response to changes in training conditions. Our focus is on understanding how predictions may vary each time the network is trained using different configurations and network architectures.
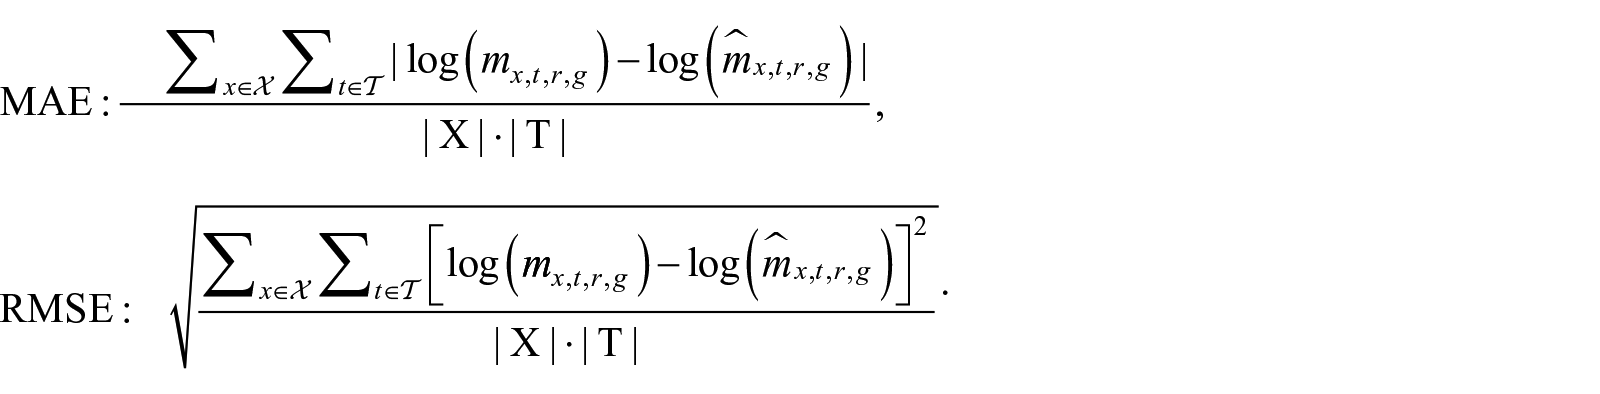
In the following sub-sections, we analyze a large space of combinations, moving to a proper subspace, using the changes highlighted in the table. We test and explore different options as we motivate the final setting choice, whose outcomes will be discussed in the results section. To summarize the performance of the methods and to evaluate their accuracy, we report the MAE and RMSE on the test sets given by:
We carry out these experiments, comparing all possible combinations through the MAE and RMSE of the predictions averaged over the study countries. The main network architecture applies the dropout set to 10%. Here, we test whether the dropout tool within the intermediate network might provide better results. Tables 1 and 2 show that the adoption of dropout gains better performances in the architecture composed of one layer and Relu function, but when we use two and three layers, the dropout technique seems to drop the number of neurons drastically, increasing the error. The tables show that the best DNN framework is one with two layers using the Sigmoid activation function, which outperforms the other tested with better learning performance.
Reliability Analysis of the DNN on Male Populations.
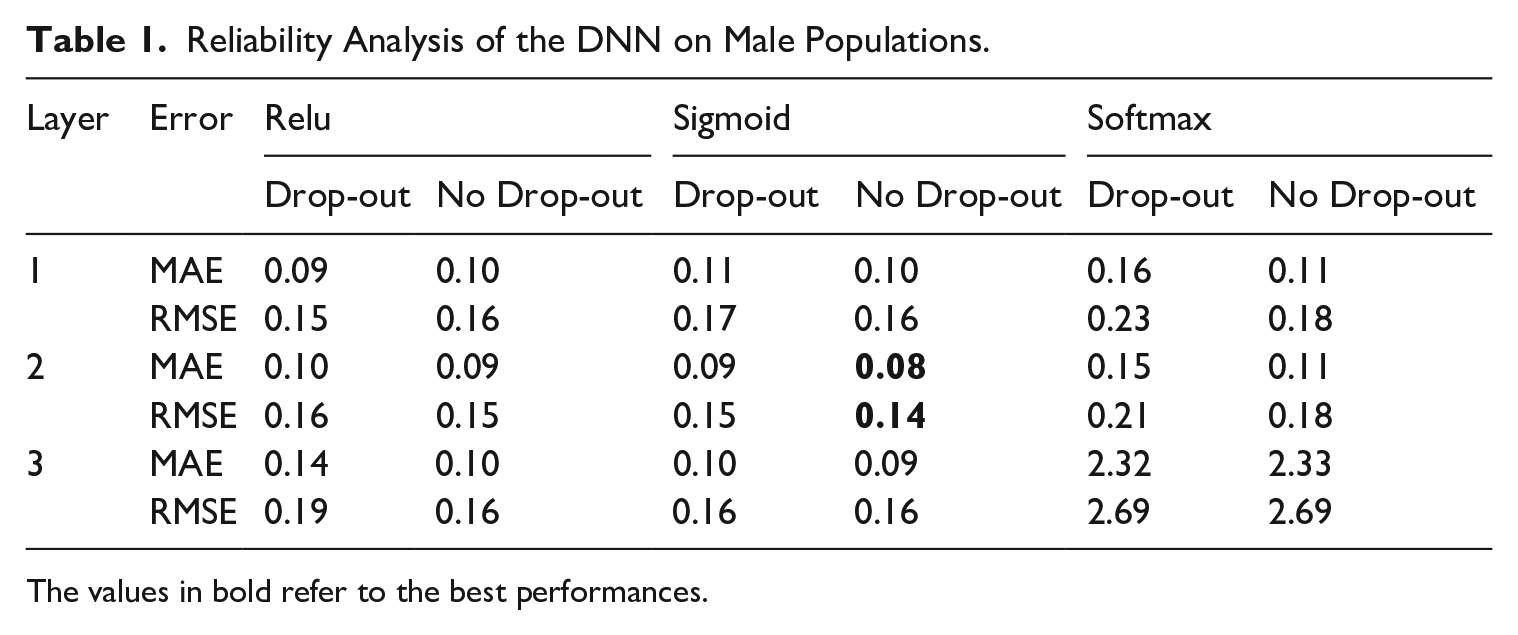
The values in bold refer to the best performances.
Reliability Analysis of the DNN on Female Populations.
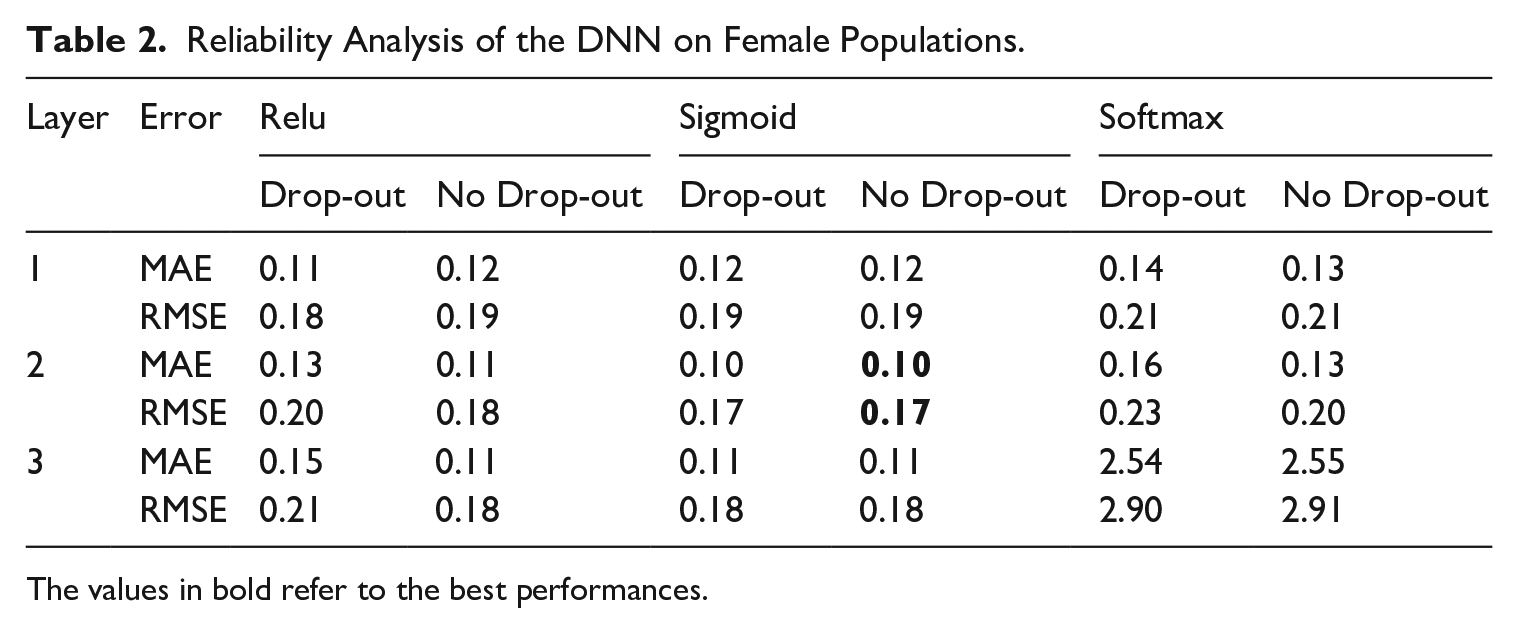
The values in bold refer to the best performances.
5. Numerical Experiments
We consider historical mortality data collected by the Human Mortality Database (HMD 2018) for all available countries and both genders. Aiming to assess the multi-population model robustness and consistency toward the historical data, we carry out an out-of-sample test. The splitting choice is influenced not merely by a rigid 70 to 30% split but rather by the temporal progression of mortality trends, consequently, opting for a training-validation phase spanning thirty years (1970–2000), allocating the remaining years (2001–2015) for the model test. Specifically, the time frame 1970 to 2000 is used as a train-validation set, and the years 2001 to 2015 are used for model test. The train-validation set is, in turn, split into training and validation sets according to the 80 to 20% splitting rule, that is, 1970 to 1994 and 1995 to 2000.
We validate the DNN model performance using illustrative applications. These examples are dedicated to investigating whether the approaches can capture (a) regular and irregular trends over time and (b) dynamics of age-specific mortality improvements. The analysis includes numerical and graphical representations of the goodness of fit.
To assess the models’ accuracy, we calculate the Root Mean Square Error (RMSE) and Mean Absolute Error (MAE) on the out-of-sample period, which in the present analysis corresponds to a 2001 to 2015 time window.
Figure 1 depicts the MAE and RMSE for countries over the time window we studied for females and males, respectively, considering the best DNN architecture. For the sake of completeness, we have included several plots (Figures 5, 6, 7) in the Supplemental Material (SM), depicting the RMSE related to the different populations for the tested architectures.
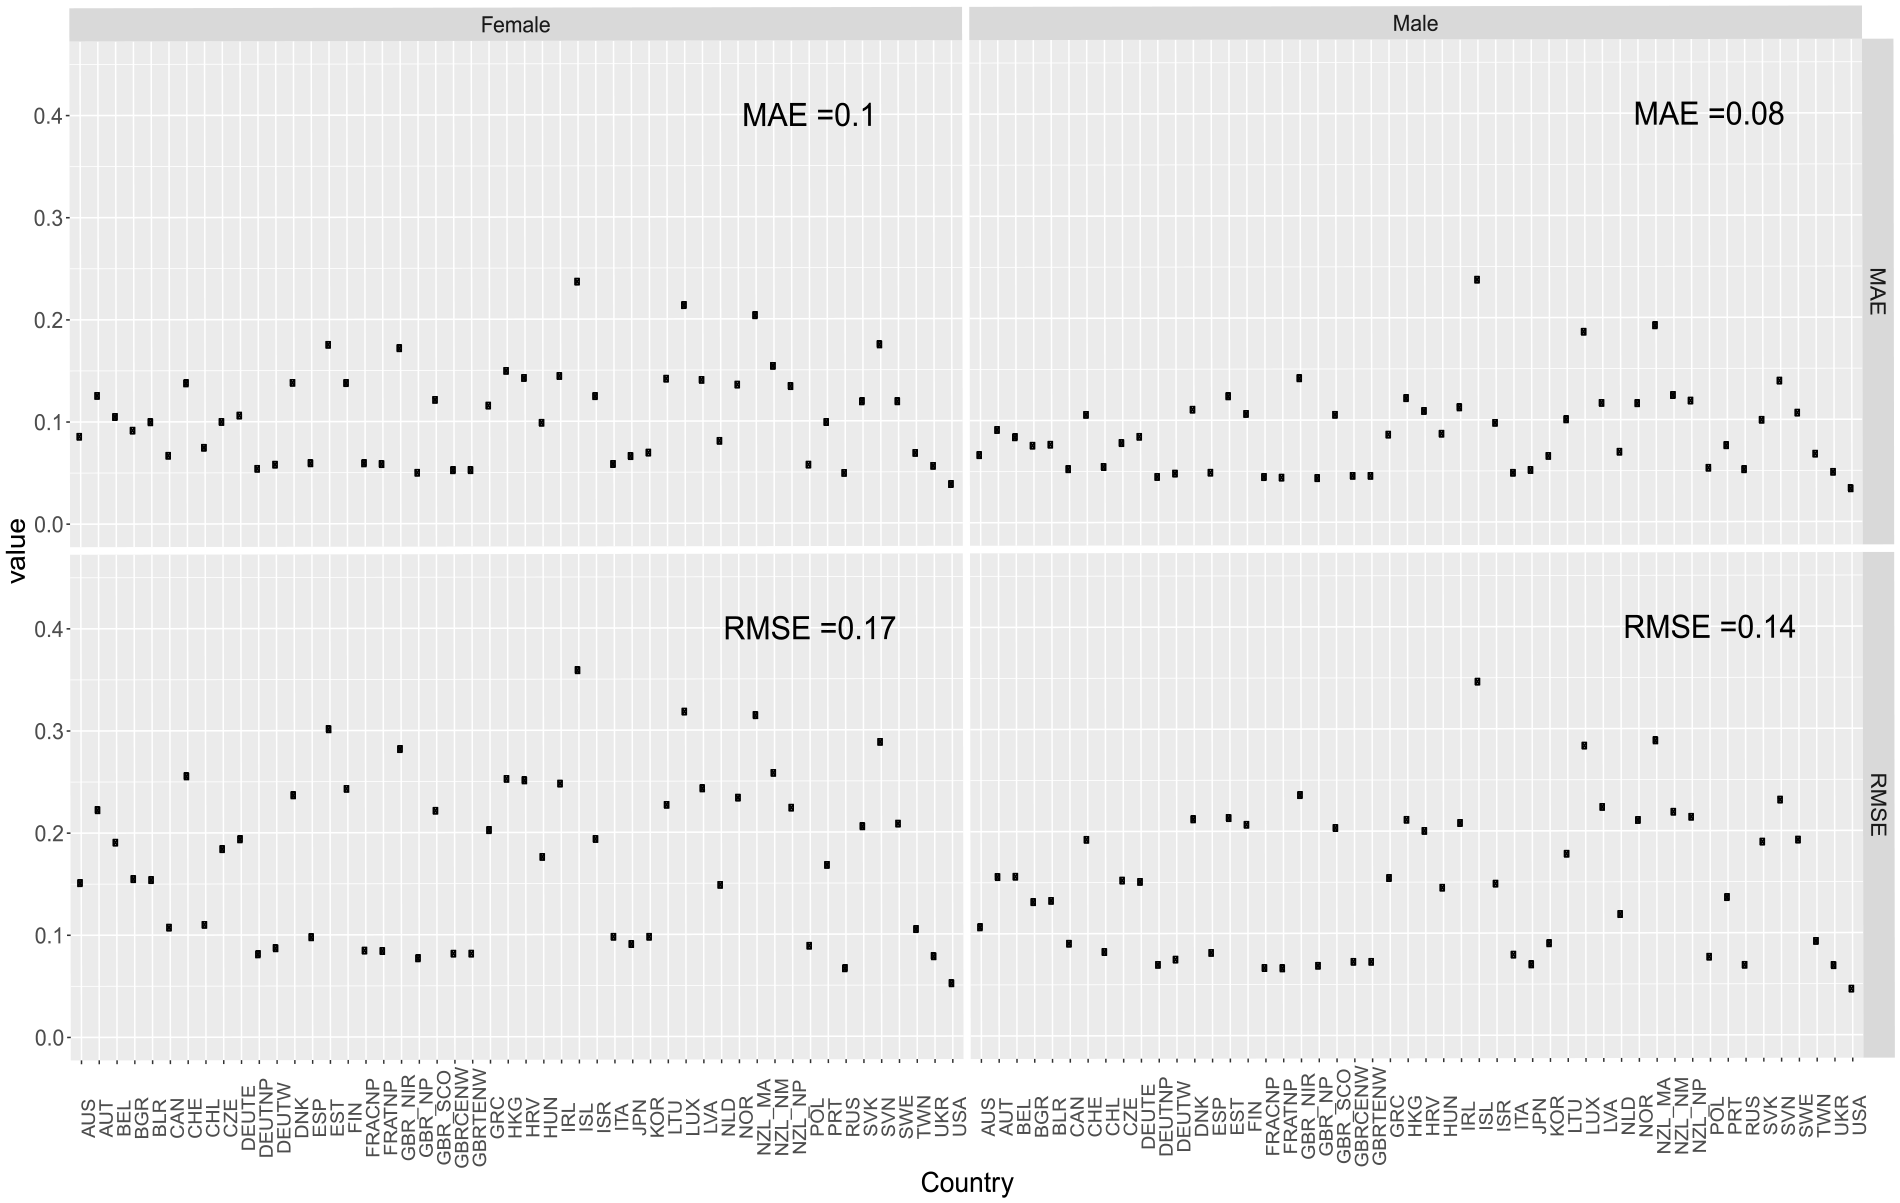
Out-of-sample MAE and RMSE obtained in the different countries with the two-layered DNN model with sigmoid activation and no dropout.
Overall, our DNN model provides remarkable accuracy. The USA is the country that presents the lowest MAE and RMSE values for both genders. Considering males, Germany’s total population (DEUTNP), France’s (both total [FRATNP] and civilian population [FRACNP]), and the UK’s total population (GBR_NP) follow. For females, Russia follows. Finally, Iceland shows the highest MAE and RMSE for both genders. On average, both the error measures are higher for female populations (MAE = 0.10 and RMSE = 0.17) compared to male populations (MAE = 0.08 and RMSE = 0.14).
Figures 2 and 3, show age-specific death rates (in log scale) for females and males in the HMD in the years 2001 and 2014. The observed mortality profile is shown with dots and estimated ungrouped values from the models using the training period from 1970 to 2000, corresponding to the red line. Some countries, such as “UKR,” do not display data for the year 2014 due to its unavailability in the temporal series provided by HMD.
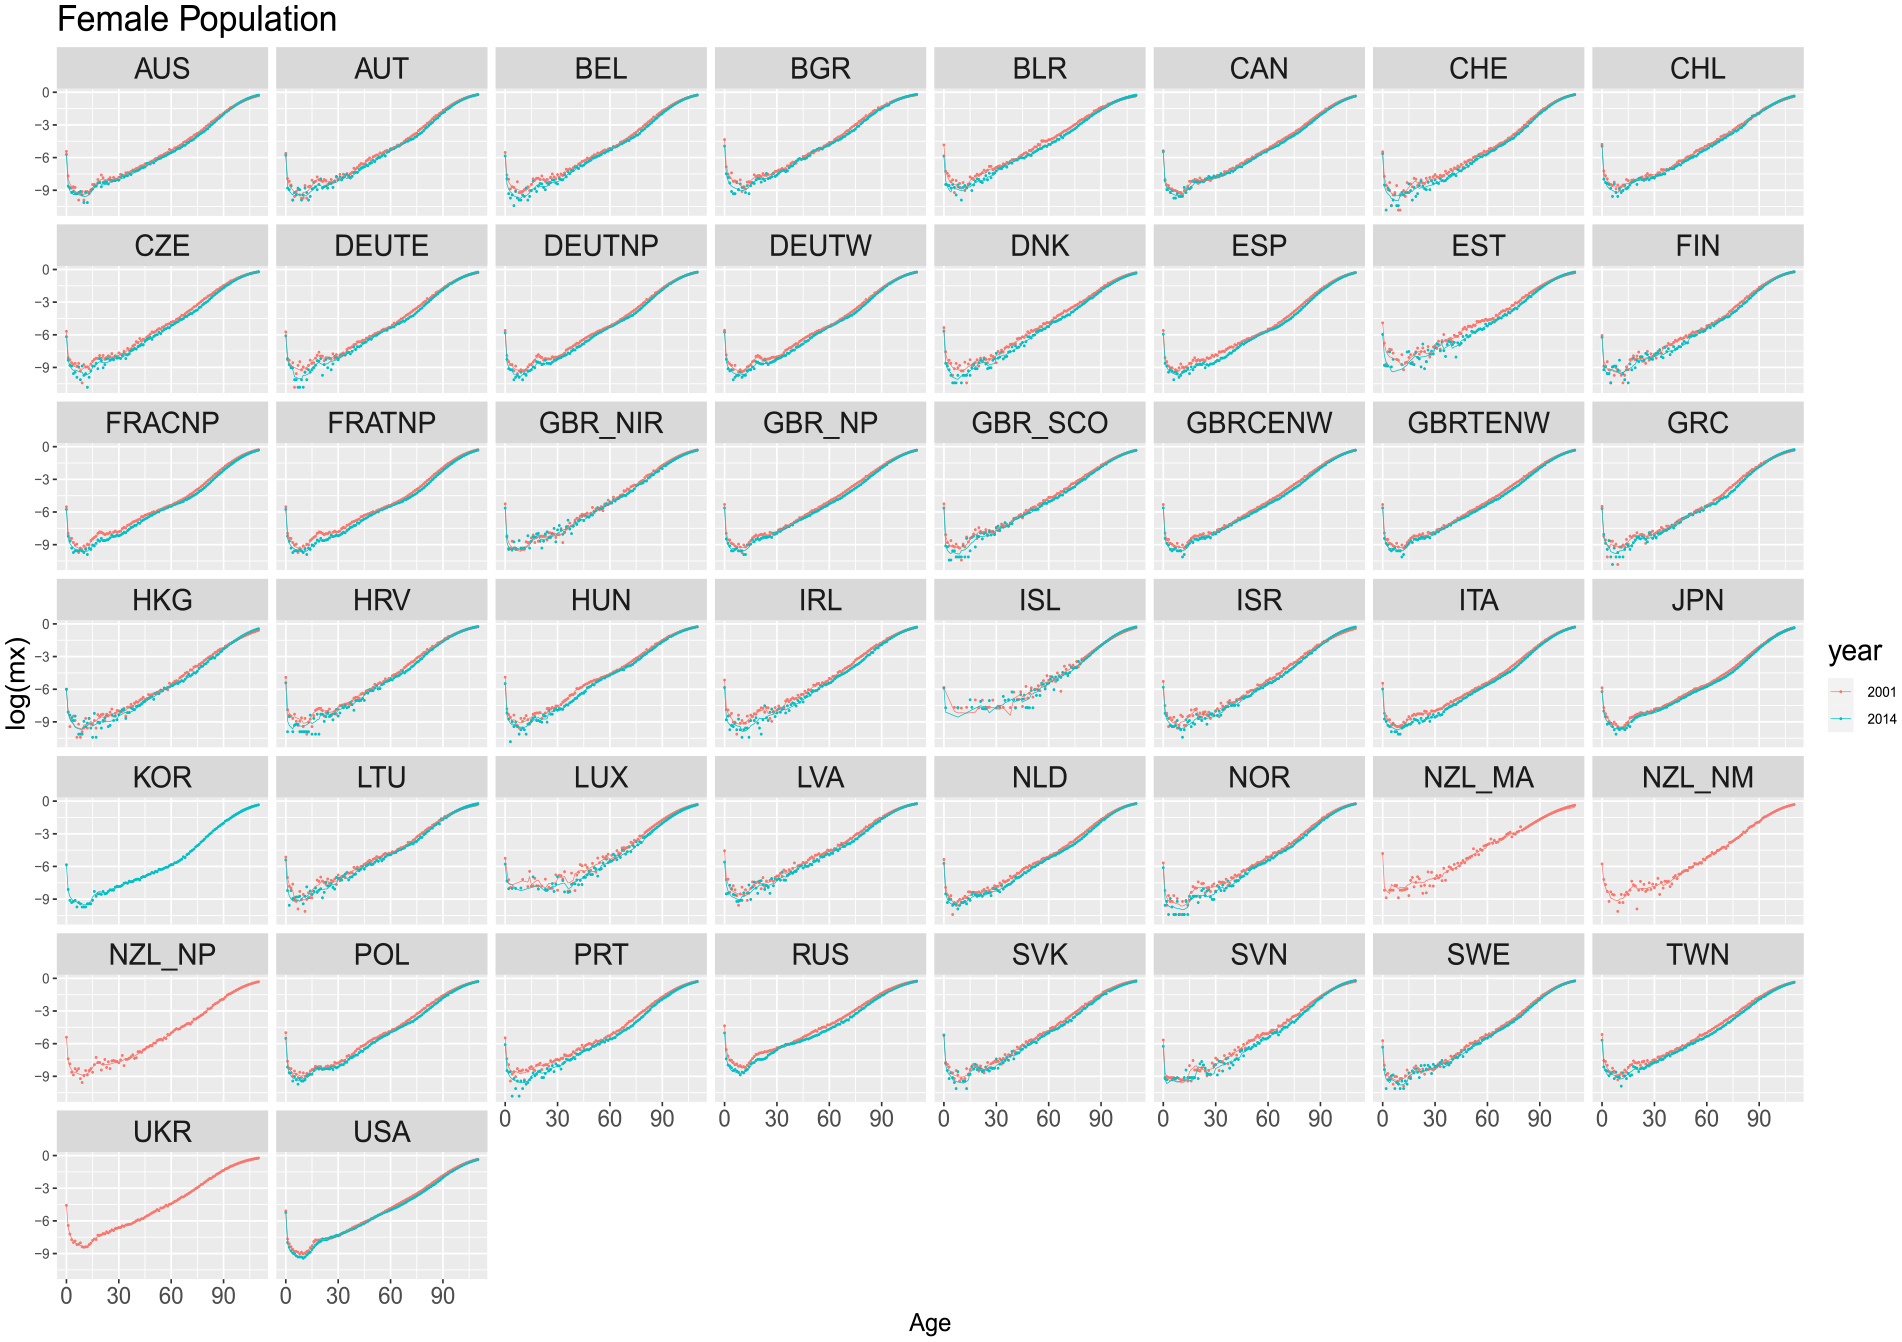
Estimated ungrouped death rates by countries for years 2001 and 2014 based on the period 1970 to 2000 (training and validation). Dots refer to the observed rates. Solid lines are the DNN reconstructed ungrouped death rates. Females.
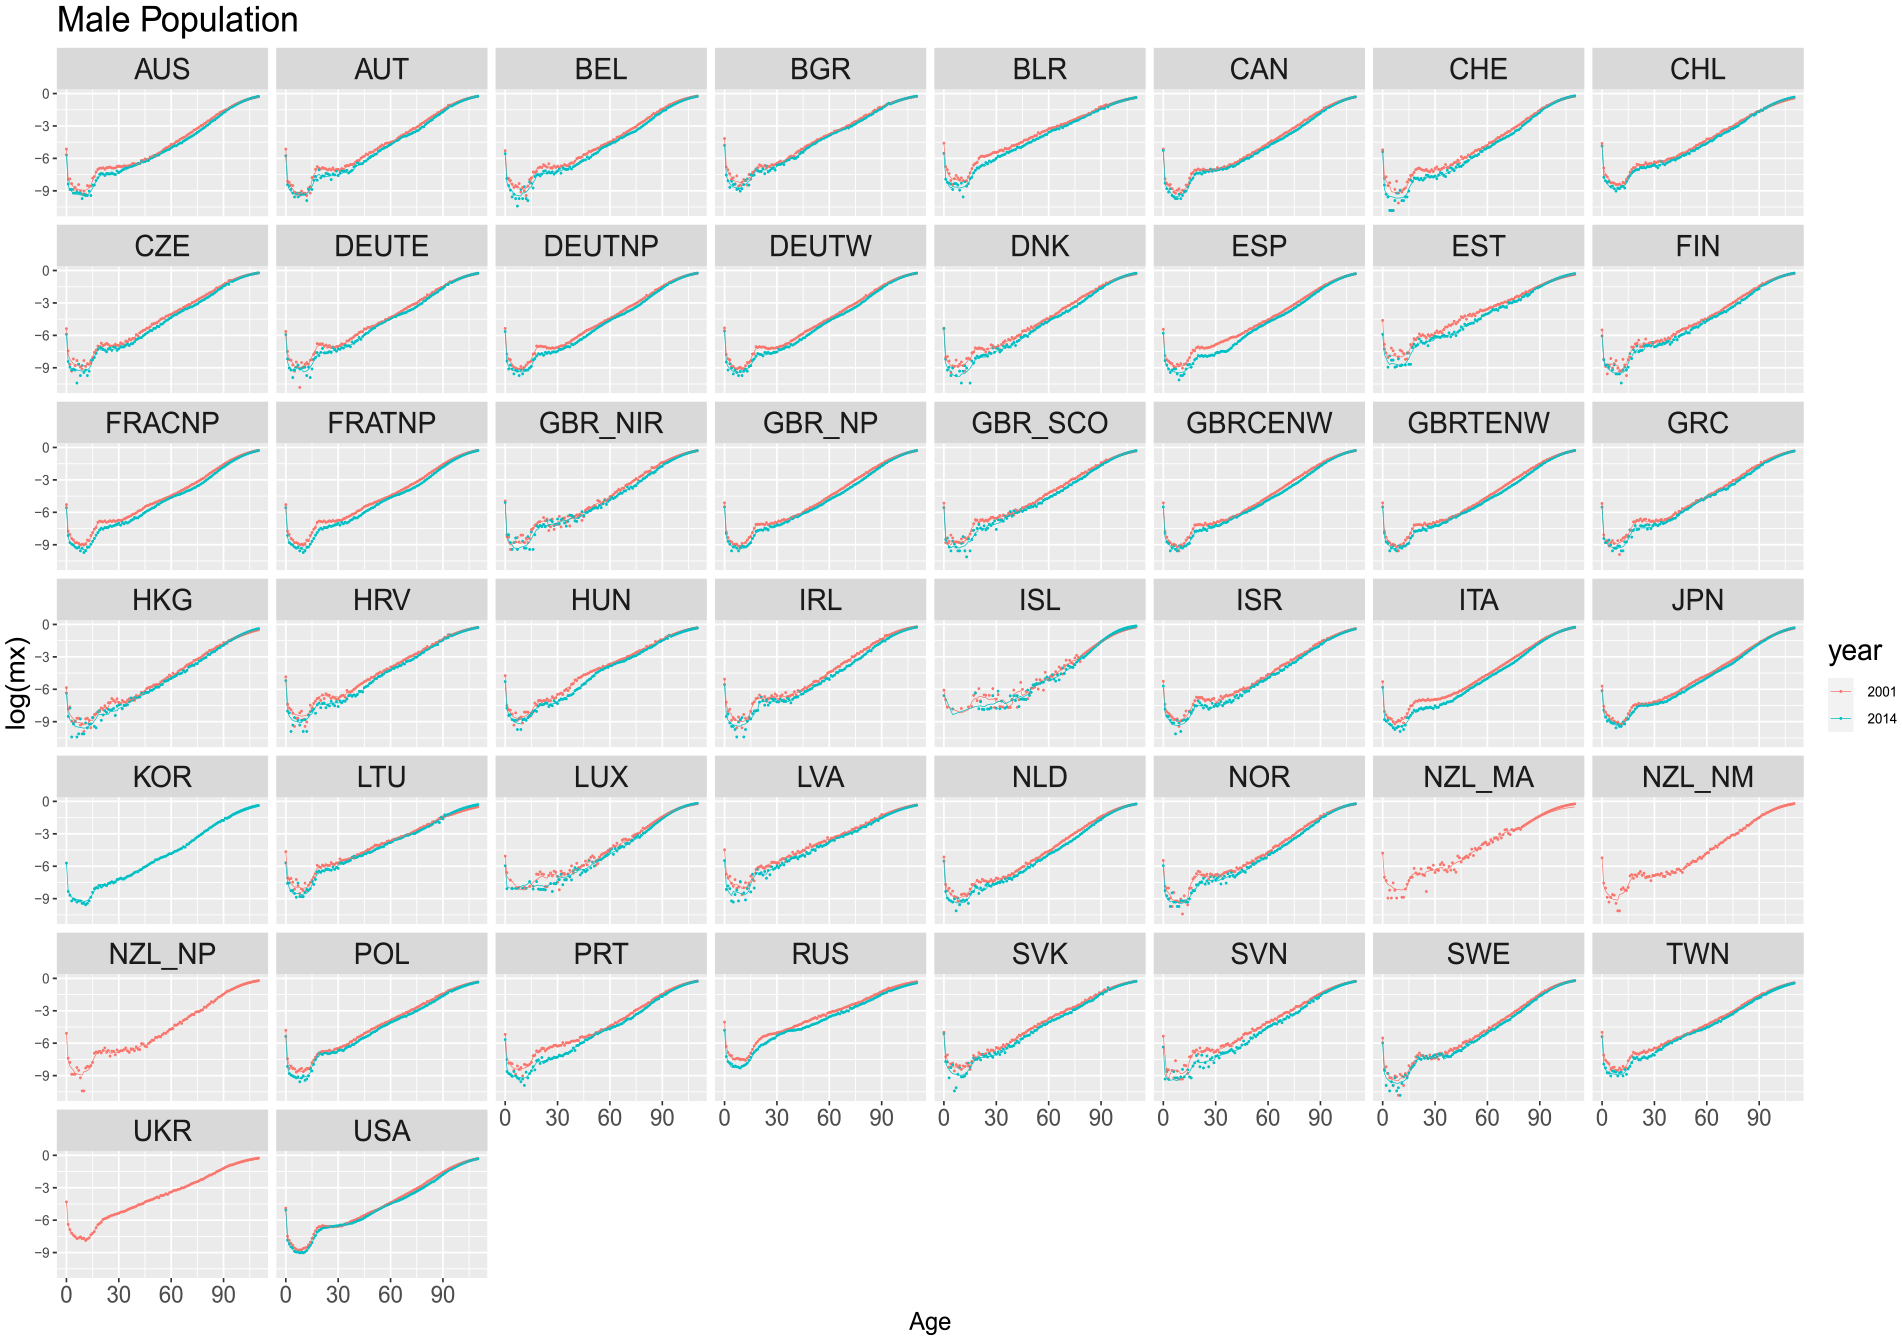
Estimated ungrouped death rates by countries for years 2001 and 2014 based on the period 1970 to 2000 (training and validation). Dots refer to the observed rates. Solid lines are the DNN reconstructed ungrouped death rates. Males.
Overall, the proposed model captures the general pattern of mortality, with a decreasing trend from birth to around age fifteen and increasing linearly from around age thirty. Indeed, the DNN model adequately captures the mortality patterns, even if a few countries fail to accurately capture the sharp decrease from infancy.
Estimating death rates is not an easy task, even more using indirect methods. Indeed capturing longevity dynamics can be challenging due to irregularity and peculiar behaviors that populations may play.
In the last decades, developed countries have seen an important mortality decline at all ages, involving a remarkable improvement in life expectancy, without evidence of deceleration. Therefore, it is important to investigate the age-specific differences between the real and the estimated mortality data according to specific phases of longevity evolution namely regularities, improvements, and stagnation, that can be represented by Japan, Italy, and the USA respectively. Specifically, Italian life expectancy exhibits a long-run transition with considerably upward shifts, converging to longevity records (Nigri et al. 2021a, 2022b, 2022c). This result has been achieved by a mix of a relatively healthy lifestyle and an efficient health system. In recent years, among longevous populations, Japan exhibits the most relevant regularities in leading the maximum human life expectancy at birth after a long period of low longevity. These peculiar dynamics make estimating Japan’s mortality not straightforward. Even estimating the US mortality is a challenging task. After the first decade of the new millennium, the rise in US life expectancy stalled. Scholars bring evidence of a stagnating decline in cardiovascular disease mortality (Mehta et al. 2020).
In doing so, as a further tool for model assessment, we provide plots (Figures 1 and 2 in the SM), that show estimated versus observed values
5.1. Subnational Modeling
The development of indirect methods has been implemented to work at the national level. However, there is a considerable need and demand for subnational estimation, for example, the official statistics at the subnational level are essential for planning by local governments and the private sector and for health and social science research on subnational variation and inequality.
In this section, we extend the proposed method to the sub-national level. This task represents a crucial step to test and validate our model further since the subnational context is different from the national one. Indeed, some subnational areas can have populations so small that stochastic variation in numbers of vital events, usually ignored in population modeling, can have a significant impact on that area’s population estimation, thus potentially affecting data quality.
The data for evaluating our proposed method comes from ISTAT, the Italian National Institute of Statistics, which serves as the authoritative source for official statistical information in Italy, encompassing diverse subjects, including mortality. The data, accessible through http://dati.istat.it/, comprises mortality statistics categorized by year, age, and region. Leveraging this dataset, we obtain a dataset spanning eighteen regions from 1974 to 2016, thereby facilitating comprehensive analyses. The model training procedure adhered to the methodology elucidated in Section 4, systematically exploring various network configurations and discerning optimal performance. The dataset’s temporal and age-related granularity enabled the creation of a training-validation time frame (1974–2003), with the subsequent years (2004–2016) for model testing. The train-validation set is, in turn, split into training and validation sets according to the 80 to 20% splitting rule Tables 3 and 4 reveal that the best DNN configuration refers to the one with three layers, devoid of dropout, and employs a Rectified Linear Unit (ReLu) activation function. It is conceivable that, when operating at the subnational level, an additional layer may enhance precision in estimation, particularly when dealing with datasets characterized by heightened stochasticity.
Reliability Analysis of the DNN on Male Subnational Populations.
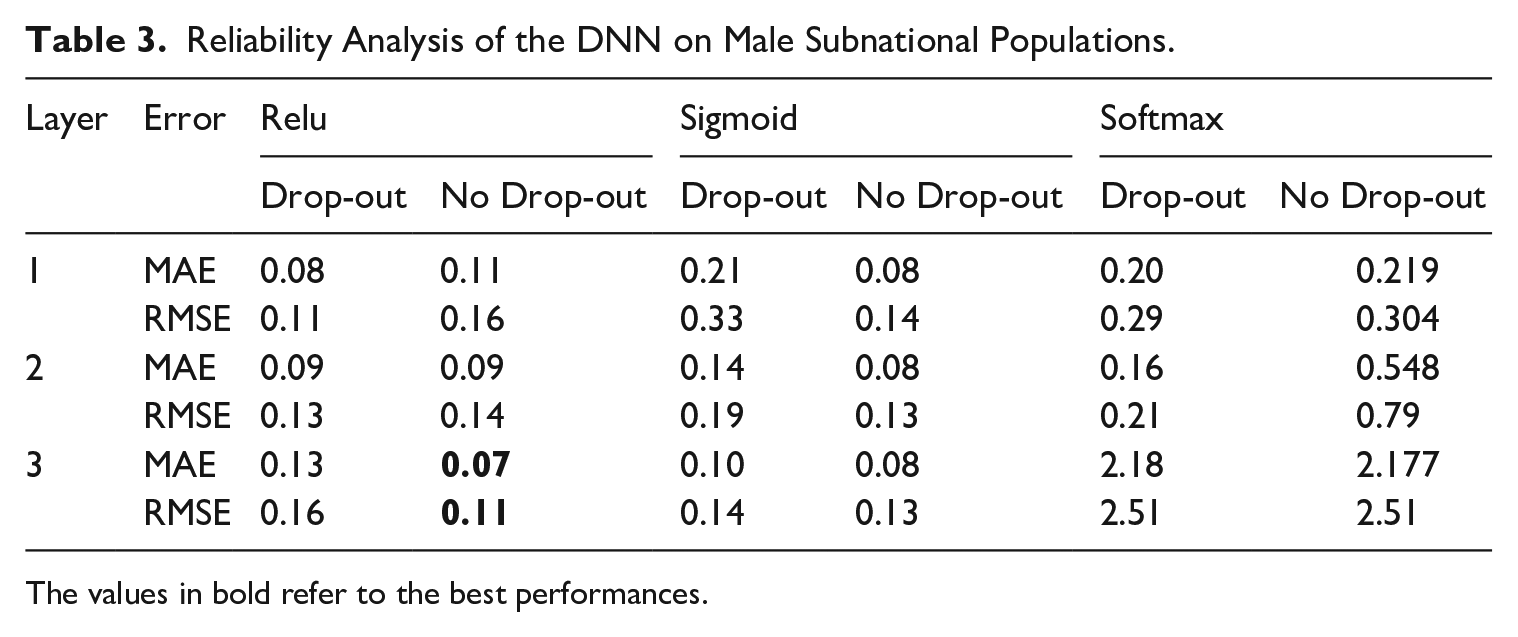
The values in bold refer to the best performances.
Reliability Analysis of the DNN on Female Subnational Populations.
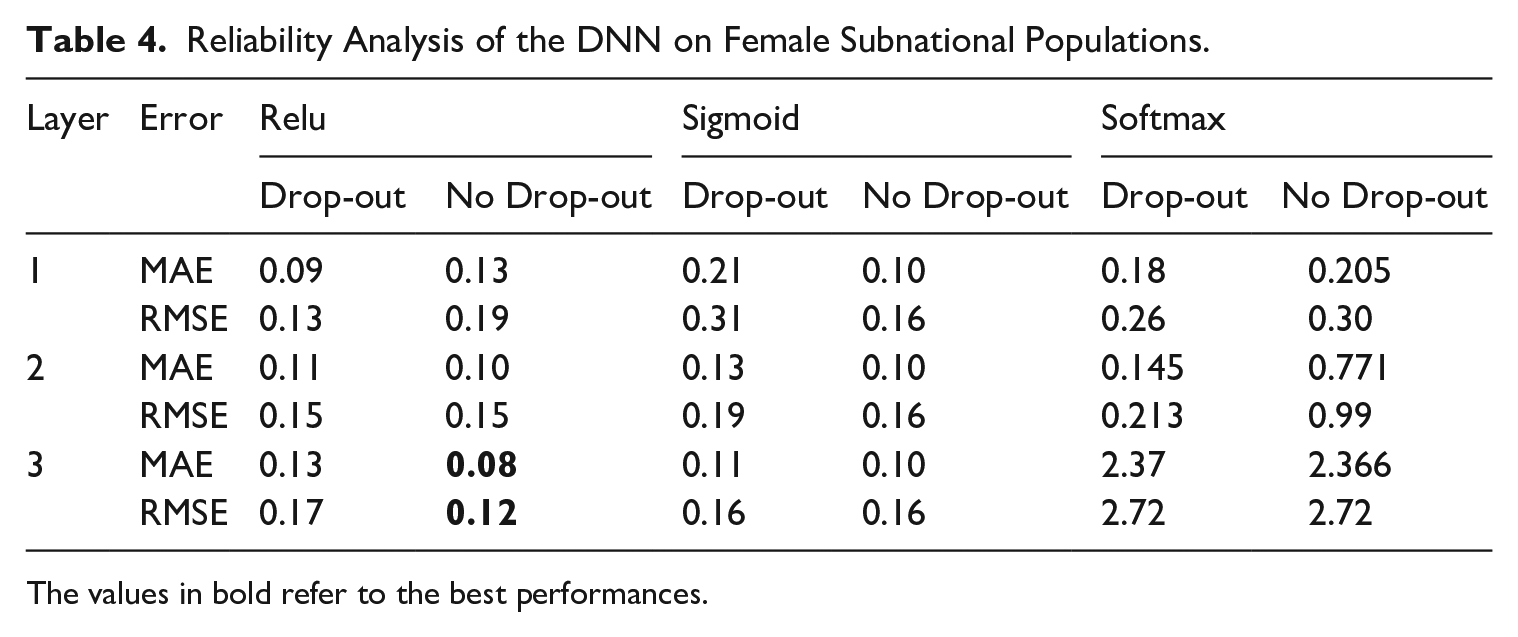
The values in bold refer to the best performances.
Figures 4 and 5 illustrate age-specific death rates (in logarithmic scale) for females and males across Italian regions in the years 2004 and 2016. The depicted mortality profile utilizes points for observed values and lines for estimated ungrouped values derived from models trained and validated during the 1974 to 2003 period.
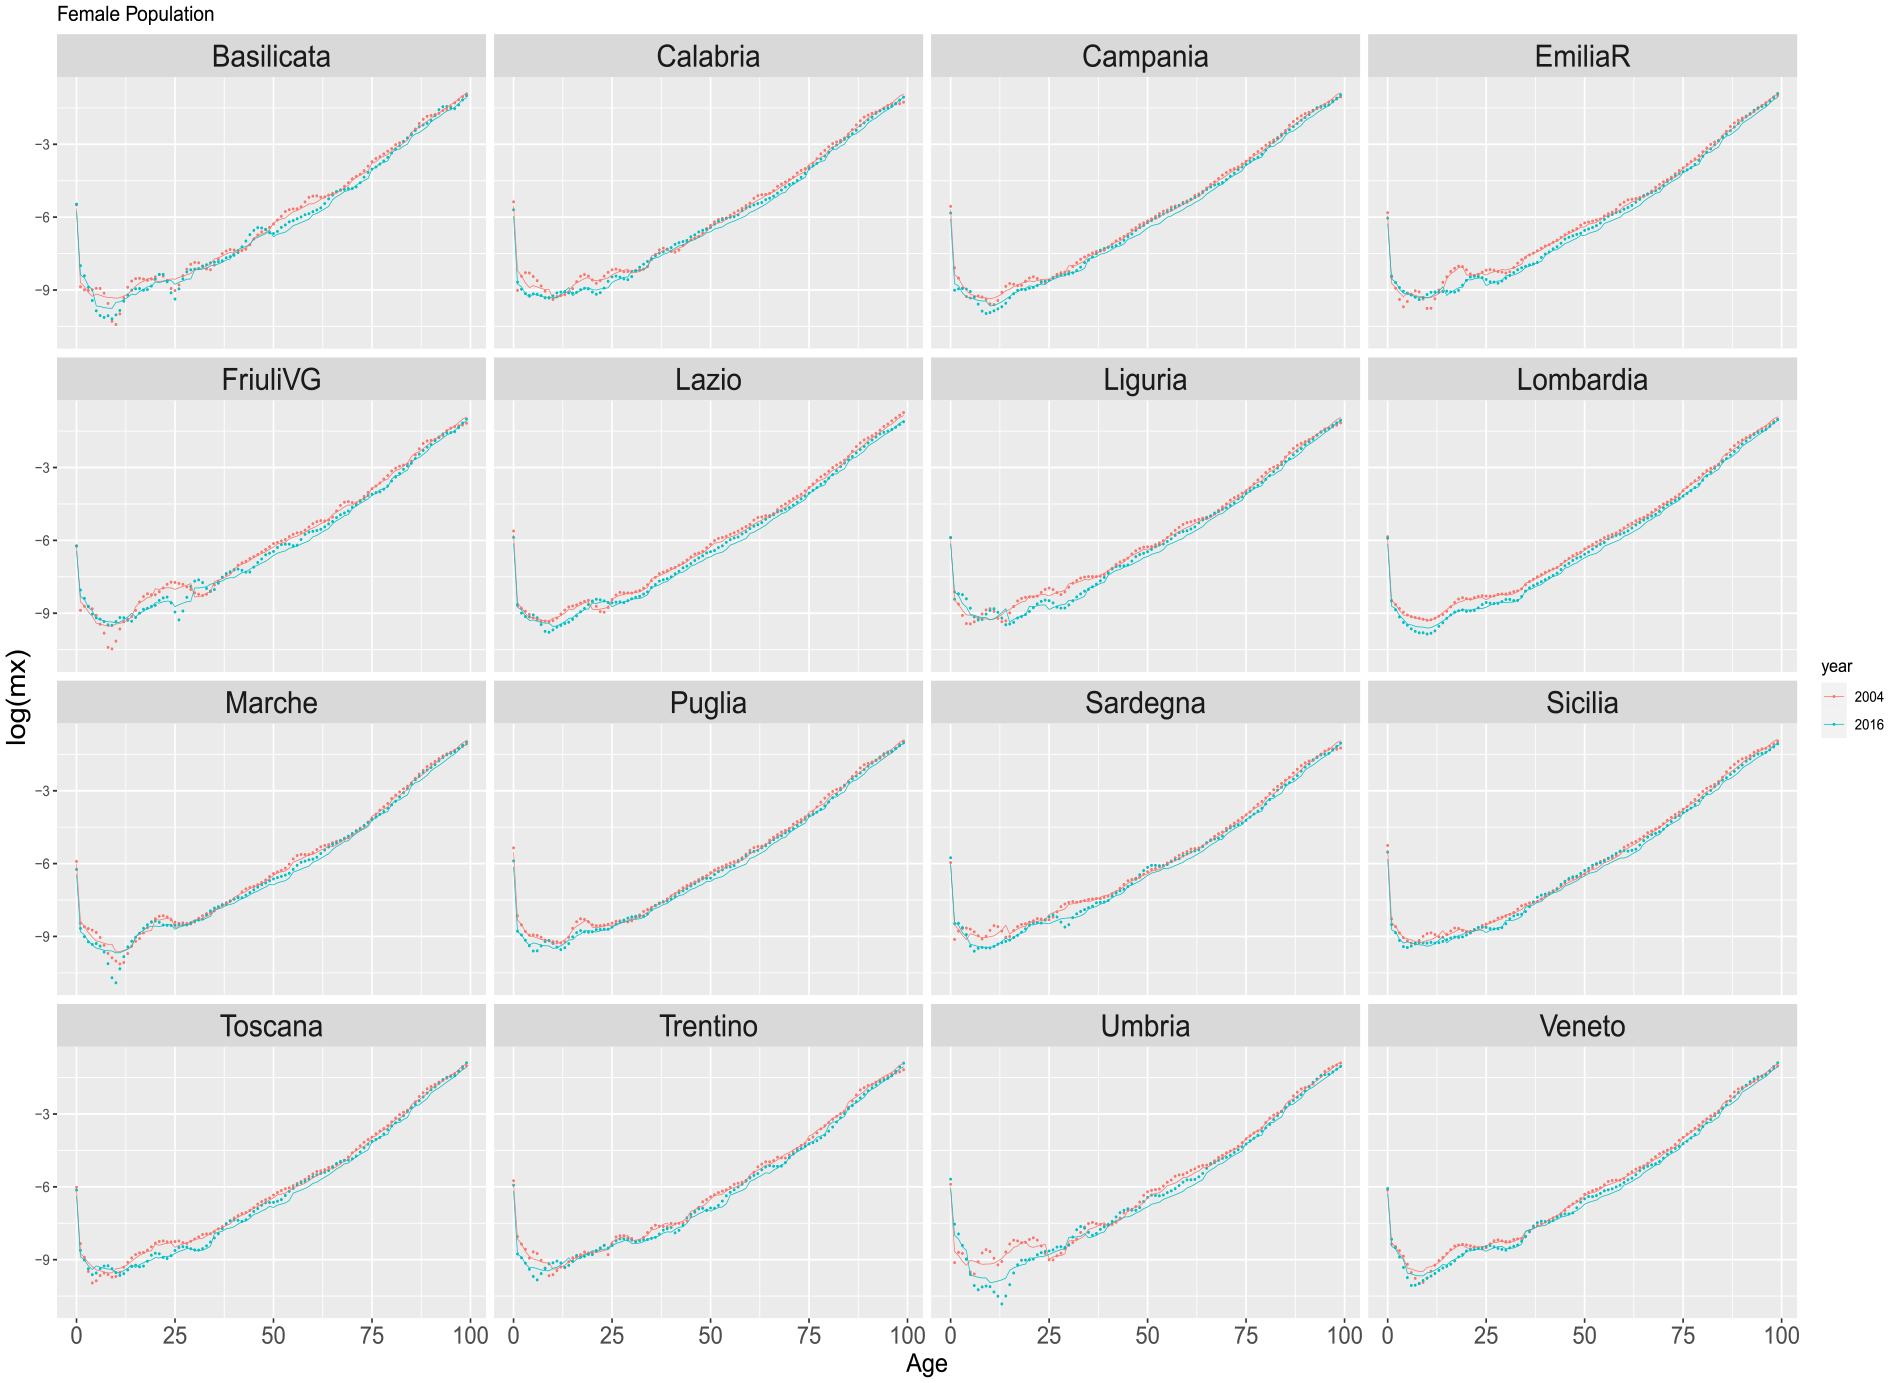
Estimated ungrouped death rates by Italian regions for years 2004 and 2016 based on the period 1974 to 2003 (training and validation). Dots refer to the observed rates. Solid red lines are the DNN reconstructed ungrouped death rates. Females.
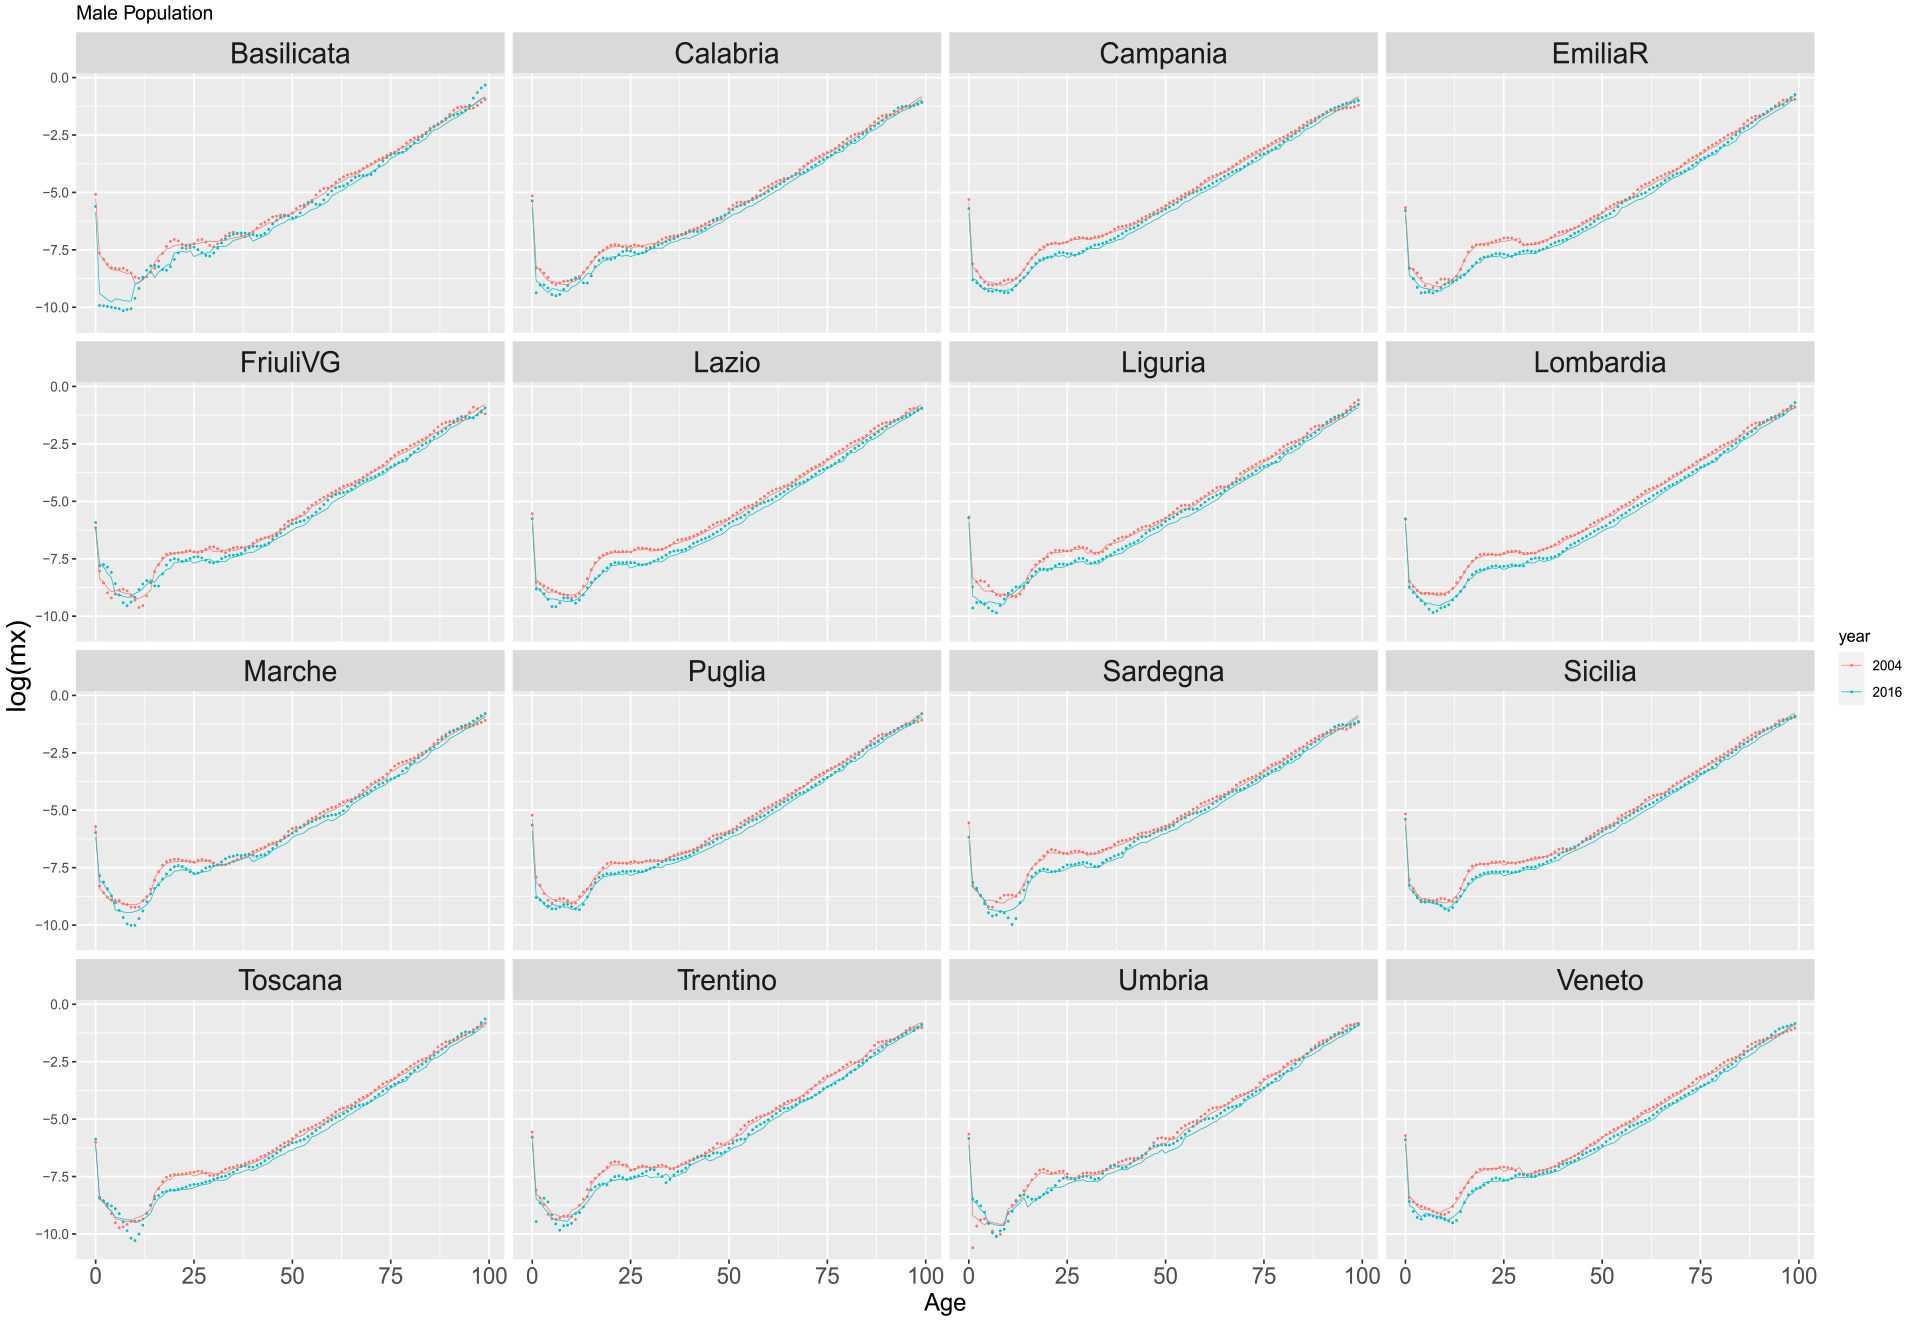
Estimated ungrouped death rates by Italian regions for years 2004 and 2016 based on training period 1974 to 2003 (training and validation). Dots refer to the observed rates. Solid red lines are the DNN reconstructed ungrouped death rates. Males.
It is imperative to emphasize that, although the model employs data from eighteen regions for training, the results exhibit sixteen regions due to the unavailability of data for the omitted regions during the years considered in the test set.
The deep neural network model adeptly captures mortality patterns, even at a subregional level, where data exhibit heightened stochasticity and diminished quality. Through this analysis, we substantiate the model’s capacity not only for delivering high accuracy but also for demonstrating a remarkable degree of flexibility, accommodating both national and subnational data, as well as data of varying quality levels.
We can speculate that by working on subpopulations, the network requires an additional layer to achieve greater accuracy in estimation, particularly when dealing with data characterized by higher stochasticity. This aspect was not necessary for the model estimated on the HMD, where the additional layer, and therefore a more complicated model, did not bring any benefit to the estimation. Also in this case, we provide in the Supplemental Material scatter plots
6. Conclusions
This paper contributes to the current literature on the demographic methods for ungrouping vital rates leveraging deep learning, which has provided reliable estimates in many fields of application. We propose a DNN model in a multi-population framework to ungroup death rates from rates gathered in five-year age-groups. This method represents an advance in mortality modeling as it may be used to estimate vital rates for single ages in regions or populations where present information is lacking. We investigate the ability of our model to provide reliable predictions of age-specific death rates by also studying how the hyperparameters’ choice affects the model’s reliability. We measure the accuracy of our method by analyzing the age-specific relative differences between the real and the estimated death rates. The results of the numerical experiments show the high accuracy of the proposed model, which captures the dynamics of mortality by age over time and between different populations. Indeed, mortality modeling is challenging due to its dynamic; thus one of the main tasks is to grasp the heterogeneity of mortality in different regions.
We also contribute to the state of the art in indirect estimation by introducing a multi-population indirect estimation leveraging subnational data. The proposed model yields impressive results, even when using a lower-quality data source.
Through our model, we can offer a comprehensive picture of specific mortality levels, providing reliable results that might be exploited by public health and national systems, aiming to obtain granular information on mortality profiles for more accurate social planning.
Supplemental Material
sj-pdf-1-jof-10.1177_0282423X241240739 – Supplemental material for Disaggregating Death Rates of Age-Groups Using Deep Learning Algorithms
Supplemental material, sj-pdf-1-jof-10.1177_0282423X241240739 for Disaggregating Death Rates of Age-Groups Using Deep Learning Algorithms by Andrea Nigri, Susanna Levantesi and Salvatore Scognamiglio in Journal of Official Statistics
Footnotes
Funding
The author(s) disclosed receipt of the following financial support for the research, authorship, and/or publication of this article: A.N. was supported by the MUR-PRIN 2022 project CARONTE (Prot. 2022KBTEBN), funded by the European Union - Next Generation EU.
Supplemental Material
Supplemental material for this article is available online.
Reccived: May 2023
Accepted: February 2024
References
Supplementary Material
Please find the following supplemental material available below.
For Open Access articles published under a Creative Commons License, all supplemental material carries the same license as the article it is associated with.
For non-Open Access articles published, all supplemental material carries a non-exclusive license, and permission requests for re-use of supplemental material or any part of supplemental material shall be sent directly to the copyright owner as specified in the copyright notice associated with the article.