
Abstract
Adaptive survey design is a framework for making data-driven decisions about survey data collection operations. This article discusses open questions related to the extension of adaptive principles and capabilities when capturing data from multiple data sources. Here, the concept of “design” encompasses the focused allocation of resources required for the production of high-quality statistical information in a sustainable and cost-effective way. This conceptual framework leads to a discussion of six groups of issues including: (1) the goals for improvement through adaptation; (2) the design features that are available for adaptation; (3) the auxiliary data that may be available for informing adaptation; (4) the decision rules that could guide adaptation; (5) the necessary systems to operationalize adaptation; and (6) the quality, cost, and risk profiles of the proposed adaptations (and how to evaluate them). A multiple data source environment creates significant opportunities, but also introduces complexities that are a challenge in the production of high-quality statistical information.
Keywords
1. Introduction
The purpose of survey data collection (and any statistical information collection process) is to generate substantive insight on topics of interest, for a given target population. That insight is often summarized or communicated through statistical parameters of interest at the population or domain level, including means, quantiles, regression coefficients, measures of variability like variance, or even differences over time. The accuracy of these parameter estimates can be degraded by a variety of issues described in the Total Survey Error context (Biemer 2010; Biemer et al. 2017; Groves and Lyberg 2010), including but not limited to coverage error, sampling error, measurement error, and nonresponse error. Under ideal conditions, we could accurately specify the types and magnitudes of each of these error sources and incorporate information about error processes into our design plans for sampling, data collection, weighting, and estimation. The current era of increasing data collection costs and reduced rates of unit contact, participation, and wave and item response, however, is far from ideal. In some countries, cost and quality challenges are compounded by the proliferation of surveys, which increases respondent burden; and by the desire for information at finer levels of granularity, for which some dimensions of data quality may be particularly problematic.
Survey methodology has evolved to meet multiple changes in survey environments by incorporating new features that respond to the most pressing constraints, which often include the cost associated with high-quality data collection operations. Neyman (1938) developed two-phase sampling to control variances of survey totals by selecting a large sample of units to collect a small set of information, stratifying on information collected during that first phase, and selecting a small subset of those cases from which to collect detailed information. Additionally, his optimal allocation minimized variance of specified estimators, with respect to cost constraints. Subsampling (Cochran 1977) has long been used in surveys to meet budget constraints while devoting additional resources to a subset of cases to encourage response late in data collection. Dillman (1978) developed the Total Design Method (TDM) as a framework for designing a mail or telephone survey with the ideal mix of components. As technologies advanced, new contact and collection modes became possible, allowing modes to be offered simultaneously or sequentially (De Leeuw 2005) to address different types of error.
Most recently, continued technological advances, including increased computing power and the advent of formal literature on paradata (Couper 2000, 2017), have enabled adaptive and responsive survey designs (Groves and Heeringa 2006; Rosenblum et al. 2019; Schouten et al. 2017; Tourangeau et al. 2017). Now, rather than offering a single data collection pathway to all sample units, available data collection features can be tailored to particular sample units to improve the quality and cost profiles for collected survey data.
While continued improvements in paradata capture and real-time data processing will lead to further refinements of the adaptive and responsive design frameworks, survey methodology is at a new crossroads with respect to information production. Administrative data, third-party commercial data, and found data have the potential to improve data quality, increase granularity, accelerate production, and reduce costs, but only under certain conditions, which often are not known a priori (Federal Committee on Statistical Methodology [FCSM] 2020). In addition, information in these new data sources may serve as covariates for predictive models that inform and enhance decisions regarding sampling, imputation, supplementation, or adaptive and responsive design. The remainder of this article explores some extensions of adaptive survey design concepts and methods to the capture and integration of both survey and non-survey data sources, which we will refer to as the “survey plus” environment. Some of these extensions focus on adaptation of the data-capture process, and others apply primarily to post-collection processing. Six questions receive principal attention.
(1) What is the general framing for our production of statistical information, and what are the goals for improvement through design adaptation?
(2) What are the principal design features we will consider adapting?
(3) What auxiliary data will potentially inform decisions about adaptive changes in the design?
(4) What are prospective decision rules that operationalize auxiliary data and guide specified adaptive design changes?
(5) To what extent will adaptive procedures require, or be enhanced by, systems that capture, integrate, and use auxiliary data?
(6) What are the quality, risk, and cost profiles of the proposed adaptive procedures, and what are realistic ways to evaluate those profiles empirically?
Sections 2 focus on questions (1) through (6), respectively. Each section, provides examples of how each of these six questions are addressed in the current adaptive survey design environment at the U.S. Census Bureau or in the survey methodological literature, and then discusses how these questions apply to this new environment.
2. Key Goals for Improvement Through Adaptation
Production of statistical information generally uses a design intended to balance numerous dimensions of quality and cost. Important quality dimensions generally will include accuracy (as reflected in the mean squared errors of specified estimators, and the widths and coverage rates of interval estimators), as well as other features like comparability, granularity, punctuality, interpretability, accessibility, and relevance. See, for example, Brackstone (1999) and National Academies of Sciences, Engineering, and Medicine (NASEM 2017). Cost dimensions potentially include all resources allocated to all steps in the statistical production process. Each cost dimension may include both fixed and variable cost components (Olson et al. 2021). Some cost components may be relatively simple to identify or quantify (e.g., the cost of purchasing a sampling frame, or the cost of interviewer training or travel). Other components may be more complex (e.g., the cost of specialized management or technical capabilities, which may be spread across many projects; or the maintenance and upkeep of data collection instruments or software, the costs of which may be highly variable).
Not all dimensions of quality or cost can be measured, and some are not under a survey organization’s control. Consequently, adaptive and responsive design work has typically focused on indicators of quality and cost that are measurable but, in some cases, indirect, for example, quality measures based on response rates or R-indicators; or cost measures based on the number of contact attempts or interviewer hours. Similar issues of measurement and control warrant consideration in evaluation of quality and cost in extensions of customary adaptive surveys to survey plus environments.
2.1. Current Environment
Adaptive and responsive survey designs tailor data collection features to impact measures of data quality, such as nonresponse error or measurement error, or measures of cost (Schouten et al. 2017). The tailoring decisions are anchored in specific pre-defined survey goals, such as increasing response rate or balance in the respondent population (Coffey et al. 2020; Wagner et al. 2012); reducing the variance of key survey estimates or the variation in weighting adjustments (Beaumont et al. 2014; Paiva and Reiter 2017); or controlling specified data collection costs (Coffey and Elliott 2023; Peytchev 2014; Wagner et al. 2023). As a result, adaptive and responsive designs typically increase effort (i.e., resources) to certain cases; and decrease effort in others.
Tailoring and interventions are informed by estimated parameters of the data collection process, such as propensity to respond, propensity to have a particular data collection characteristic, predicted values of responses, predicted costs of obtaining a response (or nonresponse), etc. Parameter selection is based on the goals of the adaptive design itself (Groves and Heeringa 2006). If reducing nonresponse error is the goal, R-indicators or coefficients of variation (CVs) of response propensities could be used to guide interventions, while R-indicators or CVs of nonresponse weighting adjustments could be used as evaluation criteria (Schouten et al. 2009, 2011). For example, in 2017, the U.S. Survey of Income and Program Participation (SIPP), a longitudinal, in-person, and nationally representative survey, implemented a series of case prioritization interventions in an attempt to improve both response rates and representativeness. To achieve both goals, the survey team developed prioritization rules that would help to redistribute resources to cases that were likely to respond and would increase representativeness (Tolliver et al. 2017). Alternatively, Wagner et al. (2012) attempted to maximize response rate, among other goals, by using response propensity to identify and prioritize the cases most likely to respond.
2.2. Survey Plus Environment
As we move from the current environment to a survey plus environment, we may consider additional options for data quality improvement and cost reduction. For example, imputation may help to reduce the aggregate cost and burden of survey data collection. In particular, one may develop an imputation procedure through rigorous regression or hierarchical models that use some directly collected survey data in conjunction with extensive amounts of administrative record or other non-survey data. Depending on the target variable, these procedures may range from direct replacement (i.e., an imputation procedure based on a single-variable regression model with a slope equal to one and an intercept equal to zero) to sophisticated statistical models. The resulting procedure may improve quality and efficiency, depending on the model goodness-of-fit, and on the conditional variances of the resulting unit-level imputations.
Also, to improve timeliness in the current survey environment, survey plans may offer multiple response modes to increase participation convenience, increase the number of interviewers to reduce the length of the data collection period, or restructure data processing to reduce the time between the end of data collection operations and the release of the survey data for users. In some forms of the survey plus environment, imputation, or other work with integration of multiple data sources may lead to improvement of timeliness by reducing the number and duration of cases involved in survey operations (Beaumont 2020; Elliott and Valliant 2017; Hand 2018; Lohr and Raghunathan 2017).
Expanded work with survey nonresponse and non-survey data sources have led to further empirical exploration of bias, which in many cases may make the predominant contribution to mean squared error (Bradley et al. 2021; Meng 2018; Rao 2021). If sensitivity analyses and other empirical work indicate that bias may dominate mean squared error of a “survey plus” estimator, then adaptive procedures, such as tailored use of non-survey data for different domains, may help to reduce some important sources of that bias.
In addition to goals related to quality and cost, alternative data sources have led to new goals for survey production. The NASEM (2017, 2021) have noted that the interest in alternative data sources stems at least partially from the need to generate estimates at more granular levels, for example, subdomains defined by relatively fine-level geographical or demographic classifications. Extension of previously developed methods of small domain estimation (e.g., Rao and Molina 2015) based on alternative data sources can help to address that interest. Additionally, some reduction of respondent burden can occur with the use of alternative data sources as a primary choice, only conducting survey data collection for sample units where we do not have alternative data, or where the quality of the alternative data is unacceptable.
Finally, expanded use of non-survey data sources generally will take place in the presence of important legal, regulatory, and operational constraints, which can have important effects on quality and efficiency. For web-sourced data, it is necessary to evaluate whether the statistical organization’s collection process (e.g., web scraping) must comply with websites’ Terms of Use; other cases may require informed consent to collect data (Ten Bosch et al. 2018). In addition, it will be critical to ensure that adaptive survey plus procedures maintain or enhance privacy and confidentiality protections (NASEM 2017, 2021); have increased transparency regarding the quality of processes and data products; and take other steps to ensure the trust of both data sources and data users.
3. Principal Design Features Under Consideration
3.1. Current Environment
Current adaptive and responsive procedures focus on data collection operations themselves and can be roughly divided into two types: recommendation and deterministic. Recommendation decision rules most frequently occur in decentralized, interviewer-administered operations, like Computer Assisted Personal Interviewing (CAPI), where the interviewer may have unique information about the data collection process, and where there is less centralized control over how workloads are managed. This environment can lead to adaptive procedures that are informational but still give the interviewer discretion on how those procedures are implemented. For example, a response propensity model based on housing unit characteristics may determine a case is likely to respond, but the interviewer may ignore that recommendation because they know the householder is away on vacation. Recommendation-type adaptive procedures typically involve case prioritization where cases are prioritized to decrease the risk of survey error (Wagner et al. 2012), increase the representativeness of harder-to-reach populations (Dahlhamer 2017; Tolliver et al. 2017, 2019), or increase overall response by targeting the cases most likely to respond (Walejko and Wagner 2018).
Deterministic procedures, on the other hand, lead to a specific action, such as introducing a particular data collection feature, such as an incentive or a mailed questionnaire (Coffey et al. 2015; Jackson 2020; Lavrakas et al. 2018); introducing or withholding a mode of data collection in multi-mode surveys (Coffey et al. 2020); or putting cases on hold or removing them from interviewer workloads to reduce effort applied to specific case (Coffey and Elliott 2023; Dahlhamer 2017; Tolliver et al. 2017; Wagner et al. 2023). The 2017 SIPP prioritization made use of deterministic business rules, in addition to its dynamic prioritization rules. The deterministic rules automatically assigned a high priority to individuals that could not be linked to administrative records, as well as individuals who likely moved between interview periods (Tolliver et al. 2017).
Once we have identified the collection of features that could be used for adaptation, the goals outlined in Section 2 will inform what features should be considered for adaptation. For example, if a multimode survey had a goal to reduce the length of data collection, mode preference models might be built to try to match a sample unit with their preferred mode of response, rather than having all cases progress through a standard sequential design (Van Berkel 2022). One natural limitation is that the features available for adaptation are constrained by planned survey data collection activities. For example, a survey that does not include mailing operations would not consider mailing questionnaires as an adaptive feature.
The impact of adaptive use of any of these design features may be mediated by external factors over which statistical organizations have little to no control. For example, Larsen et al. (2020) found that refusal rates in the Current Population Survey (CPS) were associated with a variety of environmental factors, including the unemployment rate, inflation rate, GDP, the presidential approval rating, whether it is a decennial Census year, and consumer sentiment scores. Survey data collection output also can be affected by advances in technology, such as increases in internet access (Callegaro et al. 2015) or increases in cell phone-only households (Bates 2009; Blumberg 2021). Data collection outcomes also can be affected by external events like unanticipated natural disasters or the recent COVID-19 pandemic (U.S. Bureau of Labor Statistics [BLS] 2021). In some cases, adaptive and responsive survey features can help to address these external disruptions.
3.2. Survey Plus Environment
In this new survey environment, we will consider additional sources of data for different design decisions throughout the data production lifecycle. These auxiliary data sources could be used to enhance current adaptive procedures and to inform adaptive decisions about supplementation of data collection responses. For example, survey procedures (including adaptive features) may be focused primarily on collection of data from subpopulations that are not covered adequately by the available non-survey (e.g., administrative) data. Similarly, some survey procedures might focus on collecting data for domains or cases that are not well-represented in alternative data sources (Wagner 2014). These survey data also may help improve adjustment or imputation models.
Access to these additional sources of data before the start of data collection can support tailoring of sampling strategies. In an experimental setting, improved propensity models could help identify likely respondents across experimental groups (Zotti 2019). These additional sources of data could also be used after data collection to improve imputation and weighting models (Benedetto et al. 2015; Giefer et al. 2015).
Depending on the quality and reliability of these auxiliary data sources, we might even consider a range of adaptive imputation and modeling options to supplement standard survey operations for specific domains or survey items, as discussed in Section 2. If we have an additional data source that reliably provides data on items of interest for a specific domain of cases, we might consider imputations based on these external data. For example, in the 2020 Decennial Census of the United States, a housing unit with satisfactory auxiliary data could be removed from data collection after receiving a certain number of contact attempts to redirect resources (Mule 2021). This would allow survey teams to implement survey operation stopping rules while losing relatively little information for those stopped cases.
Alternatively, some of these additional sources might be reliably available for a large portion of the sample but might only address one survey item, prompting the removal of that item from a survey questionnaire or instrument for many sample units, and thus reduce aggregate respondent burden. This is an area of current research in the American Community Survey (Ortman et al. 2019).
In some cases, auxiliary data could even function as the primary source of information for an estimate, with survey operations providing supplemental data collection. In this instance, the data collected through survey operations could be used to correct for gaps in coverage in the auxiliary data source, to construct adjustment models for auxiliary data to account for temporal or measurement issues, or just to validate the auxiliary data.
Realistically, however, these new data sources will have limitations of coverage, accuracy, and consistency, and so it is unlikely they will replace survey-based data collection entirely (Cornesse 2020). Further, some survey target variables may not be present in alternative data sources. If certain items are not available in alternative data sources, traditional survey data collection operations will continue to be needed, even if only in a limited manner to enable imputation or other model-based methods for estimation. Additionally, even high-quality alternative datasets will need to be linked, either to a population frame or a survey sample, to enhance adaptive procedures or provide new ways of producing information. Record linkage (Christen 2019), either through unique identifiers, probabilistic linkage, or even data fusion, is a critical area for research, as it will enable survey data and alternative data sources to be integrated to improve the production of information in a cost- and time-effective way.
4. Necessary or Desired Auxiliary Data
4.1. Current Environment
To inform adaptations and tailoring in the current setting, auxiliary data are necessary to identify the parameters that drive adaptation under different scenarios. Survey organizations currently leverage a variety of auxiliary data sources across different operations for adaptive and responsive strategies. Administrative data or commercially available data may be linked to the survey sample to provide more information for stratification and assignment to different contact strategies prior to data collection (Van Berkel et al. 2020; Zotti 2019). For example, the National Teacher and Principal Survey (NTPS), a national, cross-sectional survey of public and private schools, has historically used commercially available data to obtain the list of names and positions of teachers at the schools in sample. If a school does not provide the requested list of teachers, the information from the vendor data is used instead. If a school does not have available vendor data, it may be prioritized in data collection (Zotti 2019).
In addition to data that enrich the frame, paradata (Couper 2000, 2017) are also vital for estimating response propensities, and thus to inform interventions during the data collection period (Groves and Heeringa 2006; West et al. 2021). Predicted or imputed responses, or information similar to key survey items, may be compared to accumulating response data to evaluate the quality of responses, and thus to inform intervention decisions (Morris et al. 2015). Additionally, information about the costs of survey operations may be used to predict future data collection costs (Wagner 2019; Wagner et al. 2020) to guide intervention decisions such as the optimal time to move cases from one less expensive phase of data collection to the next, potentially more expensive, phase (Wagner et al. 2020).
Given the broad array of auxiliary data, and the importance of these data sources to inform adaptive and responsive interventions, many researchers have investigated the quality of these data sources (Bates et al. 2010; Biemer and Peytchev 2012; Valliant et al. 2014; West and Kreuter 2013). As new data collection technologies have emerged and more information becomes available to append to the sampling frame, the sample, or attempt-level information during data collection, research into and analyses of the quality of these data sources and items will continue to be important.
4.2. Survey Plus Environment
In the new environment where survey data will be combined with other existing data, additional information will be needed about features of the alternative data to guide decisions about use of these new data sources for adaptive and responsive procedures. Measures of usability, quality and cost will need to be developed for these new data sources.
For example, in the current environment, methodologists may use estimates of response propensity conditional on certain different features (e.g., incentives, as well as contact or collection modes), in order to determine which data collection operations to apply to a specific sample unit. Here, we may need to consider not just the propensity of a case to respond during data collection, but also the quality and cost of the information in the alternative data source that could be used for modeling and imputation of specified survey items.
At a conceptual level, we may prioritize for nonresponse follow-up the sample units with relatively high response propensities and with relatively large imputation variances (due, e.g., to poor local model fit or outdated auxiliary data), relatively high propensities of future response, and relatively low costs for continued survey effort. Implementation of this particular adaptive strategy also would require careful nonresponse bias diagnostics, and other information that would guide decisions about tradeoffs between costs and errors.
For example, in 2021 the NTPS began research into the feasibility of using web scraped data in their data collection (Avenilla 2022) to collect information from school websites about teachers and principal employment. However, there is no standardization of school websites, nor is the information on all websites current, making total replacement of survey data with web scraped data unlikely. If the NTPS were to consider prioritizing some schools over others, they might consider prioritizing schools that do not have an online presence, or do not have current teacher information available online in a format that can be easily collected through web scraping.
Similar to the way auxiliary data are used in surveys to generate measures of quality, progress or cost, measures of quality and cost could be constructed from auxiliary information about the alternative data sources. Auxiliary items that could inform measures of quality could include: the likelihood of continued access to the alternative data; the age of the alternative data, with respect to the reference period of the desired estimate; the granularity of the data (e.g., is the data at the sample unit level or at a coarser level); accuracy; and reliability. Measures of cost could be generated from past purchases of data, information from producers, aggregators, or sellers of alternative data, and the reusability of the data (either over time or across projects). The FCSM recently published guidance on these types of measures of data quality for alternative data (FCSM 2020). The availability of auxiliary data from which to derive these measures is critical to understanding the cost and quality properties of alternative data sources, helping survey organizations determine how best to leverage them for information production.
5. Prospective Decision Rules
5.1. Current Environment
Current adaptive and responsive frameworks utilize a variety of decision rules to inform procedures and protocols. Decision rules fall into one of several categories: threshold-based, rank-based, or optimization-based. Threshold-based decision rules are straightforward: when a sample unit crosses a threshold, it becomes eligible for an adaptation or intervention. Peytchev (2014) and Tolliver et al. (2017) used thresholds to stop work on cases with estimated response propensities below a pre-defined value. Coffey et al. (2020) used a threshold to decide whether to offer additional modes of response (e.g., paper questionnaires, telephone interviewing) to sample units based on fixed values of partial R-indicators (Schouten et al. 2011). Thresholds can be difficult to define strictly, as repeated implementations of a survey over time may not be subject to identical environmental conditions. For example, if a survey stops work on cases which have an estimated response propensity of 10% or lower, a year with lower-than-typical response rates could result in a larger than expected proportion of cases meeting that threshold, reducing the set of achieved responses more than expected.
As a result, many decision rules are rank-based, and are implemented by identifying the top, bottom, or some percentage of cases for an intervention. Coffey et al. (2015), identified the 20% of cases with the highest weighted response influence (Särndal and Lundström 2008) for incentivization. The percentage of cases was set at 20% to meet budget requirements, which is often a limitation on higher-cost interventions. Dahlhamer (2017) prioritized the top and bottom 25% of open cases as part of an adaptive design experiment to ensure a reasonable number of cases were affected by adaptive procedures. Tolliver et al. (2019) used a rank-based rule to ensure that no fewer than one case, and no more than 20% of cases, in any interviewer caseload were assigned high priority, to avoid a situation where a case load had too many high priority cases for a given interviewer to handle.
The last category of decision rules relies on optimization, by either maximizing or minimizing some function of survey data collection parameters to identify the optimal set of cases for intervention. Coffey and Elliott (2023) applied cost- and effort-reduction interventions to the set of cases that minimized the product of root mean squared error (RMSE) of the mean of a key survey statistic (salary) and data collection costs. Optimization provides a mathematical way to evaluate tradeoffs between estimated cost savings that come from reduced effort with expected increases in RMSE that come from lower response rates due to that reduced effort. Wagner et al. (2023) also defined an optimization rule for identifying cases for intervention and sought to minimize a function of data collection costs and mean squared error (MSE) of several key survey variables. Optimization-based rules are complex to implement as they often require predictive models for survey estimates, response propensity, and data collection costs under different sets of data collection strategies. However, they provide a statistically rigorous method to identify cases for intervention and their expected effect on cost and quality measures of interest.
5.2. Survey Plus Environment
In the new environment, all three types of rules will continue to exist, and may be useful in different settings. An example of a threshold-based rule would be one where imputations of target variables based on alternative data sources are used instead of direct survey data collection when alternative data sources have sufficient coverage of the target population and produce imputations with sufficient quality. For example, a survey may require an alternative data source to have 65% coverage of the target population in a county, and a county-level fraction of missing information (FMI; Wagner 2010) lower than the county-level missingness rate to help ensure quality. Counties which met these thresholds in the alternative data could have questions related to the target variable removed from data collection instruments.
In the case where all counties met these criteria, perhaps because of a new alternative data source that provided high coverage but unproven quality, a rank-based rule could be implemented that only replaced survey data collection with alternative data sources if the county was in the top 20% of counties with respect to coverage of the target population and in the lowest 20% of counties with respect to FMI of the target variable. This rank-based rule would identify a subset of counties with the best quality profiles in both dimensions.
An optimization rule might resemble those described in Subsection 5.1 but focus on alternative goals. For example, to minimize the resources spent on attempting to interview a set of sample units likely to be nonrespondents, we could generate predictive models for the costs each case would incur under both normal and reduced data collection operations, and for the likelihood a case would respond under both normal and reduced data collection operations. We could then identify the set of cases for which we have alternative data, and for which we can reduce the accrued costs while minimizing the impact on response rate.
Other functions of effort and error could be constructed. Measures of effort could be estimated using past information from past data collection efforts or expert opinion from data collection staff or other sources (Coffey et al. 2020). Measures of prediction error could incorporate error associated with linkage error, nonresponse, measurement error, and/or a measure that accounts for confidence in predictions to help identify cases that will have the largest impact on survey goals.
The goals for adaptive procedures will affect the type of adaptive rule, and in the case of optimization, help define the preferred objective function. An additional challenge arises from limitations on the data available to evaluate these rules at the time of intervention.
6. Systems for Capture, Integration and Use of Auxiliary Data
6.1. Current Environment
To implement an adaptive design in a multi-survey environment with multi-mode surveys, a model execution engine must be implemented and connected to the survey data collection ecosystem (Thalji et al. 2013; Thieme and Mathur 2014). The model execution engine draws intelligence from various inputs received from the data collection ecosystem and is capable of driving interventions that affect various data collection modes. Typical inputs to the model execution engine include sampling frame data, accumulating survey paradata for all modes, interviewer and case assignment data, response data, cost, and effort data, as well as administrative and other third-party data.
Minimalist implementations of model execution engines may have simple file-based interfaces with survey Operational Control Systems (OCS). Input data may be read from files arriving at a set frequency and interventions may be sent to the OCS for action that affects the data collection modes. The models being executed can vary from simple branching logic and mathematical functions to AI-based models.
At the U.S. Census Bureau, the core of the adaptive design ecosystem is the Concurrent Analysis and Estimation System (CAES), a platform that, in near real-time, can run models to inspect responses; perform microdata-level coding and editing; execute statistical models, including imputation and weighting; and produce survey estimates and variances of those estimates, all on a flow basis. CAES statistical models can perform activities such as concurrent analyses to determine the status of individual responses as well as the overall state of data collection for a given survey. The outcome of those analyses can update the OCS case status and trigger actions such as starting a case, stopping a case, or changing case mode assignment, as well as changing the course of planned data collection activities. CAES supports an agreed upon suite of statistical and analytical tools, including software packages such as SAS, R, and Python, but is flexible enough to allow the rapid addition of new software packages as needed. Current architectural plans include symmetric multiprocessing (SMP) as well as multi-node, in-memory distributed processing, using a cluster of commodity servers.
CAES contains a cluster based on the Cloudera and Spark technology platform. It also contains a separate cluster based on the SAS-Viya distributed computing technology platform. CAES is directly connected to the data collection ecosystem through a variety of file and message-based interfaces that can bring inputs to and supply interventions from CAES in up to near real time.
CAES has been in operation since 2018 and has been used to execute several adaptive design models for research and in production. For the 2020 Decennial Census, CAES executed two critical models. First, the administrative record-based nonresponse follow-up (NRFU) model performed analyses on administrative data from various agencies such as the Internal Revenue Service, the Social Security Administration, and the Department of Housing and Urban Development (Morris et al. 2015). This model identified cases in the NRFU workload that have existing administrative records and withheld such cases from field case workloads to avoid further contact attempts. Additionally, CAES supported the self-response quality assurance system (SRQA), an analytical model that performed analyses on administrative data received from various agencies to identify response data from the 2020 Census that may be fraudulent. CAES also hosts adaptive design models for various surveys such as the National Survey of College Graduates (NSCG; Coffey et al. 2020), the SIPP (Tolliver et al. 2017), the NTPS (Zotti 2019), and the Post-Enumeration Survey (PES). In the NSCG, for example, CAES has enabled the near-real time ingestion and processing of survey paradata and lightly edited response data to enable the estimation of multiple Bayesian predictive models to inform optimization decision rules about how to allocate effort to cases (Coffey and Elliott 2023).
6.2. Survey Plus Environment
In this new survey environment, an even broader array of data sources must be integrated. Automated methods like web scraping, web harvesting, or web data extraction are used to extract such data from websites. At BigSurv18 personnel from Statistics Netherlands presented a thorough look at the use of web-scraped data to accelerate and improve statistics (Ten Bosch et al. 2018). Additionally, they highlighted various organizations and programs that were able to successfully explore the feasibility of integrating web-sourced data into their statistics. For example, Cavallo (2015) was able to compare measures of price-stickiness (i.e., the stability of the price of a product despite changes in cost, supply, or demand) from scraped data to measures from standard data sources including the Consumer Price Index (CPI) and scanner data. This measure required the collection of large volumes of micro-price data, which would have been impossible to scrape from the web without building a specialized program.
To enable similar research, the U.S. Census Bureau has established a multi-tenant web scraping platform, which is currently available for application development. One ongoing project aims to scrape teacher names and subjects from school websites alongside information collected in the Teacher Follow-up Survey (TFS) of the NTPS (Mathur et al. 2021). Successful work on this project could lead to imputation or other supplementation with information extracted from public school websites to portions of data collection operations.
Advances toward the new survey plus environment have led to changes in to acquire, process, integrate, and disseminate Census Bureau data assets. This also affects how adaptive procedures will be carried out. The need for the integration of acquisition, processing, and dissemination ecosystems is one of the key drivers behind the development of an Enterprise Data Lake (EDL). As Figure 1 (Peters and Tracy 2020) shows, the EDL will allow for the integration of all acquired data including data collected from surveys, administrative, and other external sources. The EDL will provide data to the adaptive design systems, as well as data for production of estimates for external publication.
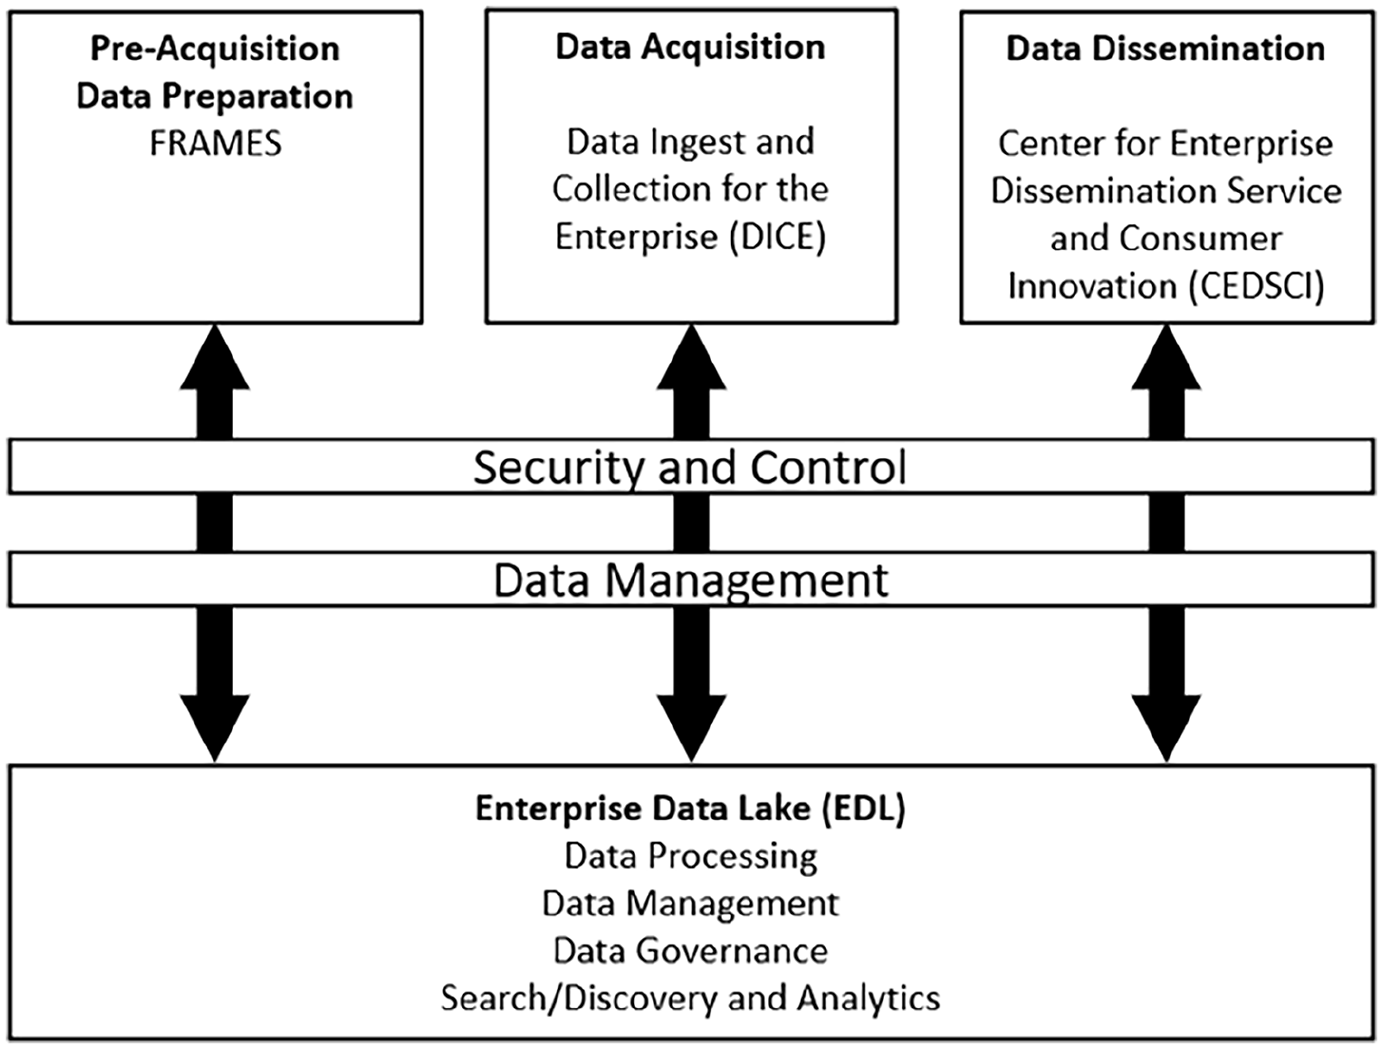
Schematic design of the Enterprise Data Lake (EDL).
In the future, the EDL will not only be the reservoir of all acquired data, but it will also provide a cloud-based computation platform to process that data. This will allow CAES-like model execution capabilities to exist directly on the EDL.
7. Adaptive Procedures: Quality, Cost, and Risk Profiles and Empirical Evaluation
7.1. Current Environment
Design, implementation, and evaluation are critical components of adaptive design. Survey organizations have attempted to empirically evaluate properties of their adaptive and responsive procedures, typically during survey data collection operations, but also through simulation. We summarize several recent empirical assessments here, which rely on a variety of measures for quality and cost, but also see Tourangeau et al. (2017) for a detailed review of select adaptive and responsive experiments prior to 2013.
Peytchev et al. (2010) considered coefficients estimated from propensity models that relied upon historical survey data and used these historical estimates in conjunction with current covariates in a new survey sample to classify cases into propensity strata for incentivization. However, the monetary incentives offered neither improved response rates nor reduced nonresponse bias for this particular study. For another study, Peytchev (2014) used paradata collected during a random digit dial (RDD) telephone survey to identify and stop work for cases falling below a pre-defined response propensity threshold. There was no statistically significant difference in the number of interviews obtained using this adaptive strategy versus the standard data collection protocol, though there was a statistically significant decrease in the mean number of call attempts needed to complete an interview, suggesting significant data collection cost savings.
Wagner et al. (2012), described a complex case prioritization experiment carried out in the National Survey of Family Growth (NSFG), an in-person interviewer-administered survey. Cases could be prioritized based on a variety of measures, including base weights, paradata from the early part of the NSFG, and characteristics collected in the screener portion of the survey. For most of the experimental prioritizations, measures of data quality (e.g., response rates, CVs of response rates, etc.) were improved when compared to the control group.
The goal of case prioritization in SIPP is to reduce attrition across the four waves of the survey, leading to increased representativeness, measured by R-indicators. Tolliver et al. (2019) found that the static business rules did not have a significant effect on R-indicators, but that the dynamic case prioritization led to statistically significantly higher R-indicators than in the control group.
Coffey et al. (2020) achieved statistically significant increases in representativeness, measured by R-indicators (Schouten et al. 2011), in the NSCG, a sequential multimode survey. This increase was achieved by increasing effort on some cases, while decreasing effort on others. Response rates and mean costs-per-case were consistent across the group managed using adaptive procedures and the control group. Recently, Coffey and Elliott (2023) demonstrated, through the use of an optimization rule, that data collection costs in the NSCG could be reduced by nearly 10% versus the control group, without significant decreases in unweighted response rates nor increases in root mean squared error (RMSE) of the mean of a single key survey estimate, self-reported salary.
Despite the promise of some adaptive procedures, it is difficult to generalize these findings across surveys due to wide variability of available interventions and the conditions under which interventions are carried out. Some adaptive designs may involve the manipulation of specific features, such as sending a tailored incentive (Coffey et al. 2015), and the evaluation of such protocols would estimate the marginal impact of the incentive over experimental treatment groups or domains within treatment groups. Other adaptive designs, such as case prioritization (Tolliver et al. 2019; Wagner et al. 2012), are more difficult to evaluate and generalize because it is necessary to evaluate the impact of a protocol, where the overall impact of case prioritization is the cumulative impact of many individual contact attempts and decisions that interviewers make while complying with the protocol.
7.2. Survey Plus Environment
In the new environment, it will be important to empirically evaluate the effects of the expanded suite of adaptive interventions that may use additional non-survey data. In particular, one broad source of risk with alternative data sources is that survey organizations do not “design” this data, and thus may have limited information on variable specification issues and may have no control over the original data production process. This also means that we may not have control over, or even know, when processes for data production vary or when changes to those processes occur. For example, the National Ambulatory Medical Care Survey (NAMCS) attempted to mix information which was abstracted from medical records by interviewers with information directly extracted from electronic health records (EHR) to take advantage of the proliferation of EHRs for data collection. However, there were technological, analytic, and disclosure challenges with EHR data (DeFrances and Lau 2018), particularly because of an assumption than an EHR record was static. While this may be true for a paper record created by an interviewer abstracting data, electronic systems may be updated to reflect new information, but also to edit information in the past. Additionally, EHRs often had errors, or were missing fields required for the NAMCS reporting requirements. Limited control over the auxiliary data production may mean that additional adaptive work will need to focus on the ongoing quality of alternative data streams, both for continuing periodic production (as occurs in surveys such as the ACS or the SIPP), and for the use of these data streams for one-off information production exercises.
8. Discussion
In recent years, the production of high-quality statistical information has encountered extraordinary opportunities arising from the expanded availability of multiple data sources (e.g., administrative records and web-scraping, as well as customary sample surveys); and has also encountered important challenges arising from, for example, declining survey response rates, as well as open questions about the quality, risk, and cost profiles related to non-survey data sources. Consequently, it will be important to expand the concept of “design” to include the focused allocation of resources for production of high-quality statistical information on a sustainable and cost-effective basis; and to explore a wide range of ways in which one may adaptively improve the quality, risk, and cost profiles of statistical information production procedures, based on paradata or other data that were not available at the start of the design process.
This paper provides an overview of dimensions for consideration, to extend customary adaptive survey design approaches to applications that use data from both sample surveys and non-survey data sources. Similar to typical adaptive survey designs, it is necessary to: (1) identify the goals of a particular information production process (survey or otherwise), (2) determine the available design features available for adaptation, (3) identify available auxiliary data that could inform adaptation, (4) define decision rules to drive adaptation, (5) implement systems that enable adaptation, and finally, (6) develop measures by which to evaluate the impact of adaptation on the quality, cost, and timeliness of the information production process.
While the steps to enable adaptation may be similar when we consider a survey-focused or a survey-plus environment, focused research in a variety of areas is required to realize the benefits to information production of the integration of alternative data sources. Survey methodological research has a rich literature focused on topics such as the effectiveness of different frames for survey data quality; the impact on response from different modes of contact; the impact on measurement from different modes of data collection; and the impact on data quality from different imputation and weighting methods. In a survey-plus environment, it is necessary to extend those areas of research to evaluate the effectiveness of alternative data sources to meet estimation requirements related to coverage, accuracy, and timeliness; the impact on measurement from the linkage and use of alternative data sources; and the impact on data quality of different methods for integration, calibration, and use of alternative data sources. In particular, investigation of the quality and stability of alternative data sources will be critical, as will the further development of record linkage methodologies to enable the integration of multiple data sources for high quality information production.
Further, it may be necessary to develop rigorous procedures to evaluate the conditional bias and conditional variance of some of the key estimates produced through the integration of multiple data sources in a survey plus environment. Estimators of conditional variances could account for the multiple sources of variability associated with the imputation procedures described in Subsection 2.2, including measurement error and other imperfections in specific non-survey data sources, as well as the effects of weighting used to combine information from multiple sources.
Where possible, both exploratory and mature survey-plus information production systems should document (A) paradata or other near-real-time process data that may offer important insights into important dimensions of quality, risk, or cost; (B) how those data inform practical adaptations or design modifications that have the potential to produce substantial improvements in the overall profiles of quality, risk and cost; and (C) methods to evaluate the resulting improvements, and to explain to key stakeholders the practical impact–and potential limitations–of the resulting adaptive procedures.
Footnotes
Acknowledgements
The views expressed in this article are those of the authors and do not reflect the policies of the U.S. Census Bureau. The authors are grateful to Paul Beatty for his helpful thoughts on evaluating administrative data, and to John Abowd, Michael Thieme, and Jason Fields for their time and very insightful comments. The authors also thank David Peters and Tamara Adams for providing Figure 1.
Correction (April 2024):
Article has been updated online to correct a minor error in the Acknowledgements section.
Funding
The author(s) received no financial support for the research, authorship, and/or publication of this article.
Received: May 2022
Accepted: July 2023