
Abstract
A statistical classification model was developed to identify online platform organizations based on the texts on their website. The model was subsequently used to identify all (potential) platform organizations with a website included in the Dutch Business Register. The empirical outcomes of the statistical model were plausible in terms of the words and the bimodal distribution of fitted probabilities, but the results indicated an overestimation of the number of platform organizations. Next, the external validity of the outcomes was investigated through a survey of the organizations that were identified as a platform organization by the statistical classification model. The response by the organizations to the survey confirmed a substantial number of type-I errors. Furthermore, it revealed a positive association between the fitted probability of the text-based classification model and the organization’s response to the survey question on being an online platform organization. The survey results indicated that the text-based classification model can be used to obtain a subpopulation of potential platform organizations from the entire population of businesses with a website. This subpopulation may form a good starting point to study platform organizations in more detail.
1. Introduction
Obtaining reliable information from a small or rare subpopulation is a challenging topic for survey researchers (Snijkers et al. 2023; Tourangeau et al. 2014), especially in an era where response rates continue to decline (Luiten et al. 2022; Wu et al. 2022). Approaches commonly used to find rare or so-called hard-to-identify groups are a screening survey, network sampling, area sampling, or a combination (Snijkers et al. 2013). Sometimes, lists of particular types of units are obtained from commercial organizations or they are constructed from administrative data sources (United Nations 2020). Unfortunately, these approaches do not always provide a good overview of the population of interest, especially when the topic of the study is new (Tourangeau et al. 2014; United Nations 2020, chap. 8). However, the increasing availability of new data sources, so-called Big Data (Daas et al. 2015), may offer a solution to this problem. For example, such sources could be used to identify the relevant subpopulation, that is, the target population of the survey, as completely as possible without contacting those units. More specifically, it can be applied to identify businesses with an online platform (defined below).
The surge of internet technology in recent decades has enabled the rapid development of online platform organizations, and it has strongly altered the functioning of society. As a virtual digital meeting point, the intermediary platforms bring together persons and organizations, via which goods, services, or information can be exchanged. The Organisation for Economic Co-operation and Development (OECD 2019) defines online (digital) platforms as “a digital service that facilitates interactions between two or moredistinct but interdependent sets of users (whether firms or individuals) who interactthrough the service via the Internet.” Digital labor platforms can, for instance, be applied to a geographically dispersed crowd, for example, “crowdwork,” and by apps (Berg et al. 2018; Howcroft and Bergvall-Kåreborn 2019). Furthermore, online platforms have been applied to shopping (Ducci 2020) as well as to the sharing economy (Sutherland and Jarrahi 2018). A substantial number of online platform organizations, such as Airbnb, Greenwheels, and Uber, are profit-driven, and it may have implications for competition in two-sided markets (Cui et al. 2020; Ducci 2020; Rochet and Tirole 2003).
In recent years, national statistical institutes (NSIs) were lagging behind the phenomenon of the emergence and rapid growth of online platforms. Reliable statistics on the key components and dimensions of the online platform economy are still lacking (United Nations 2019). To fill this gap, in the past years NSIs have debated a framework for measuring elements of the online economy for the Gross Domestic Product and the national accounts (OECD 2020). However, many empirical studies that investigate the (size of the) platform economy are solely based on surveys asking businesses or individuals about their use of online platforms (De Groen et al. 2017). Directly targeting online platform organizations instead of their users has proven to be more difficult (Heerschap et al. 2021; Klijs 2021). The main reason is that the identification of an online platform organization is far from straightforward. Online platform organizations cannot adequately be identified from Business Registers of NSIs, since the business classification system (NACE) classifies businesses according to their main economic activity; the system has no separate category for online platforms (Eurostat 2008). This means that these types of businesses cannot easily be approached with questionnaires assessing their economic activity. Also, alternative approaches, such as a generic list or a register of online platform organizations, are currently not available.
The inability to obtain a population of online platforms has hindered the direct research of those organizations using questionnaires or administrative data sources. However, because all online platform businesses have a website, it is of interest to investigate if the texts on those websites could be used to accurately identify them. In that way, a list of potential online platform organizations active in a country could be obtained. Text mining techniques could be used to do this (see Becue et al. 2004). In this article, we describe the results of our study which aims to identify the online platform organizations in the Netherlands. Our empirical analysis is based on information obtained from the websites of about six hundred thousand Dutch organizations; these are, in principle, all websites that have been assigned to the businesses in the Business Register of Statistics Netherlands (Daas and Van der Doef 2020). For all these businesses, we have collected the textual content of the pages on their website. During the text mining analysis, we focus on combinations of words that tend to be associated with online platforms. The organizations will be ranked with respect to the likelihood of being an online platform. We demonstrate that the selection of platform organizations obtained is confirmed by an ex-post statistical analysis. The findings are subsequently validated using the information from the Dutch Online Platform survey conducted among the organizations identified as online platforms. To the best of our knowledge, only a limited number of empirical studies have assessed the validity of web-based text mining results through ex-post survey information (García Lozano et al. 2020).
Our study has two major implications. First, it demonstrates that text-based classification is a valid way to obtain a subpopulation strongly enriched with the target population of interest. Second, it demonstrates the advantages of combining text mining techniques and survey data for the study of the online economy.
The setup of this article is as follows. Section 2 describes the general methods used and introduces text mining as a classification method. In Section 3, this method is applied to the texts extracted from the websites of Dutch organizations and the external validity of the text-based classification results is examined using survey information. Finally, in Section 4 the findings are discussed.
2. Material and Methods
2.1. Data Collection and Text Processing
All scripts used are written in Python (v3.7). The Business Register of Statistics Netherlands (Ritzen 2007) is used to provide an overview of all businesses in the Netherlands. To this register, at the most detailed level possible, the corresponding websites are linked. The linking procedure, amongst others, compares the Chamber of Commerce number and address displayed on the website with those in the Business Register; for more details see Oostrom et al. (2016) and Daas and Van der Doef (2020). Websites are assigned to a total of 960,588 organizations, at the level of the local unit. The relationship between these units and their website is essentially one-to-one.
Web pages are collected, that is, scraped, with the urllib.request function in Python. Each page is verified with the Beautiful Soup library (v4.7.1) after which it is stored on the local machine. Pages that can’t be scraped during the first attempt are visited at least four times, at later points in time, to deal with temporarily unavailable websites. Scraping started at the main page of the website, followed by all pages referred to on the same website, up to a maximum of one thousand. Collecting all data took 3.5 weeks and resulted in a total of nearly 1 Terabyte of data. The locally stored files are processed in several steps illustrated in Figure 1. The language of the extracted text is determined with the langdetect (v1.0.7) library. Since the majority of the pages are either written in Dutch or English only those languages are discerned; for example, any non-Dutch text is classified as English. For the removal of language-dependent stop words the Dutch and English stop word lists in the NLTK-library (v 3.4.1) are used. The words remaining could be stemmed, for example, reducing words to their root form. For this, the SnowbalStemmer library (v1.2.1) is used. Stemming has the advantage that it considerably reduces the number of variants of a word; for example, the words “helpful,” “helpfully,” and “helping” are all converted to “help”. For model development, either only the text on the main webpage or the texts extracted from all pages collected on the website are used. The texts were combined into a single document in which the words are separated by single spaces. Websites for which ten or fewer words remain after processing, which is particularly relevant when only the text of the main page was studied, are excluded for further analysis as this has been demonstrated to hardly provide any relevant information (Daas and Van der Doef 2020).
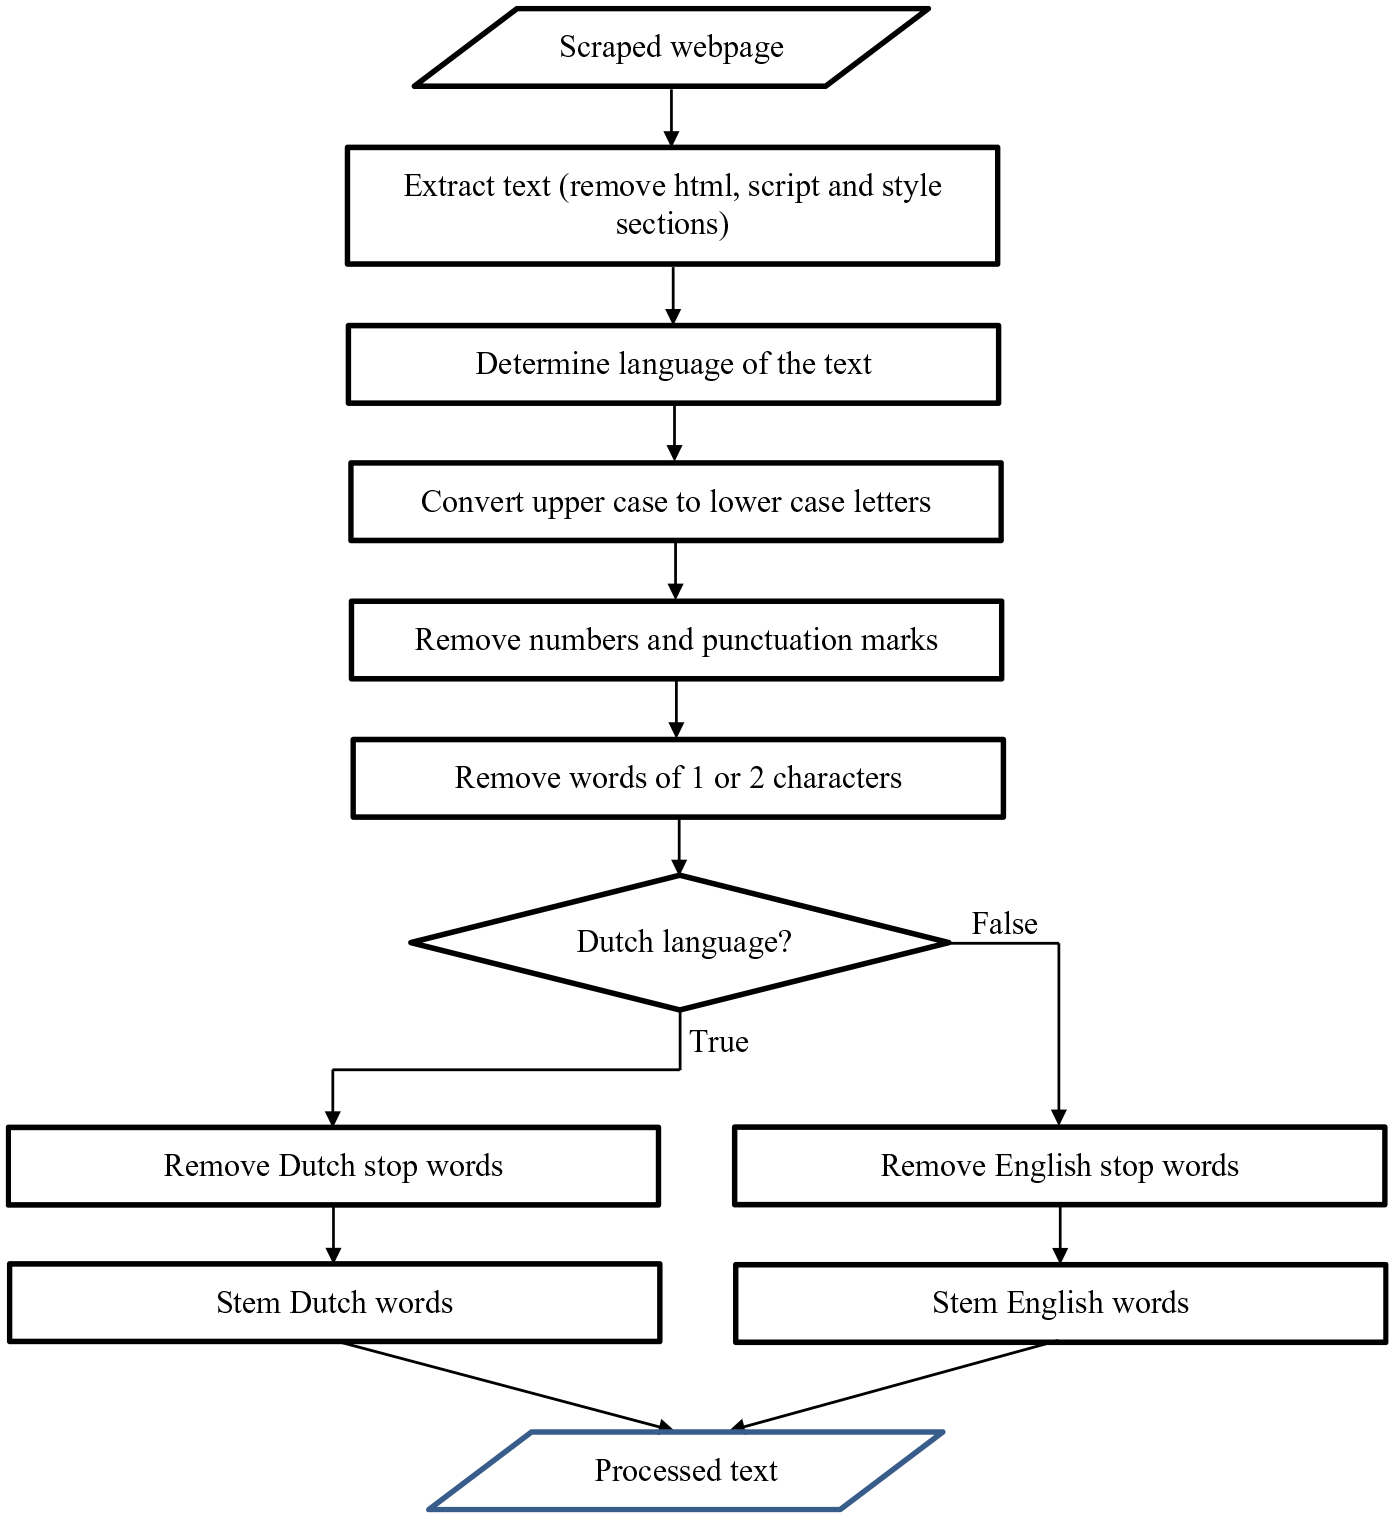
Flow schema of the processing of the texts extracted from scraped webpages. Because a large majority of the non-Dutch texts were found to be written in English, these texts were all processed as such.
To enable model development, the well-known representation of the text extracted in the form of frequency-annotated bag-of-words is used (Aggarwal 2016). This starts by creating a document-term matrix in which the rows correspond to the business webpages and the columns to the unique words included in all the text extracted. The natural logarithm of the term frequency-inverse document frequency (log(tf-idf) + 1) for each word is used as a feature value (Daas and Van der Doef 2020). The tf-idf value indicates how important a word is in the texts as the term frequency increases proportionally to the number of times a word appears in it. The inverse document frequency offsets this number by the number of texts that contain the word. The latter adjusts for the fact that some words appear more frequently than others in website texts, of both platform and non-platform texts, which severely reduces the influence of often occurring, non-discriminating, words. In addition, the language of the text is added as a binary feature to the matrix, for which English = 1 and Dutch = 0. Word Embeddings, a technique focused on word co-occurrences that is often used to improve text classifications by encoding semantic and syntactic information (Allen and Hospedales 2019), are included by applying the gensim library (v3.4.0). Up to three hundred vectors of either the word2vec skip-gram or Continuous Bag Of Words algorithms of the gensim library could be additionally added to the matrix. Machine Learning models are developed with the scikit-learn library (v0.21.2; Pedregosa et al. 2011).
2.2. Model Development and Classification
The overall process of text processing, which is applied in the empirical analyses, consists of three steps. In the first step, a data set with known examples of platform and non-platform websites is constructed by experts. All three experts involved are employees of Statistics Netherlands with at least five years of experience in business statistics and have been studying online platforms for at least two years. To identify the platform and non-platform organizations, the experts review information on websites for a set of organizations. To identify online platforms, the experts essentially answer the two questions included in the Appendix. Websites for which the experts’ opinions are not identical (around 15%) are discussed by all experts after which a joint decision is made. Based on the definition of an online platform (see the introduction) this leads to a set of

where the 0 or 1 variable

In the second step of text processing, a supervised generative model-based approach (Gentzkow et al. 2019) is applied to a large random sample of the combined data set; this is 80% in our case. The sample is referred to as the training data. The model-based approach reduces the multidimensional variable

As is usual in machine learning, an independent sample, referred to as a test set (also known as a holdout set), is used to check the performance of Equation (2). Here, the test set is the 20% part of the combined data that remained after selecting the training data.
In the third step, for the entire population of organizations, the statistical model of Euation (2) is used to predict the probability of

The elements of the population are referred to by the subscript
Following the three steps described above, there are two major outcomes regarding the identification of online platform organizations. First, there is the set of platform organizations, included in the test set, that have been classified by the statistical model (Equation 2). This set solely consists of organizations for which the correct classification is known as these have been assessed by the experts. This result is used to determine the performance of the model developed, which, in the case of accuracy, refers to the correct identification of platform and non-platform businesses in the total of all businesses classified. Here, one wants to obtain a model with the highest accuracy possible. Second, there is the outcome of the classification of the organizations in the population that were not assessed by the experts. Some of them are identified as online platform organizations (Equation 3). How well the classification model performs on the unobserved organizations, for example, the second outcome, affects the findings tremendously. Especially for the latter results (Equation 3), there is usually no information on the size of the type-I and type-II errors. The type-I errors, that is, the false positives, consist of businesses that are identified by the model as online platforms, even though they are non-platform organizations. The type-II errors, that is, the false negatives, are organizations not classified as a platform by the model but they are actually online platforms. Given that the number of platform organizations is expected to be relatively limited (Heerschap et al. 2021), it will be hard to assess the type-II errors through a survey.
It would be possible, however, to estimate the size of the type-I error. In order to do so, we sent all organizations, after extensive checking, with a value above the threshold (obtained by Equation 3) the Dutch Online Platform questionnaire. Businesses themselves will disclose in the survey whether they can be categorized as an online platform organization, according to the OECD definition. We used the first two questions in this survey for this purpose. The questions are included in the Appendix. Thus there are two outcomes of the external validation. Either a business confirms the outcome of the text-based classification, “the model is right”, or it reports that it is not a platform organization, which leads to a type-I error. More formally, the external validation is based on the external measure
Overall, the external validation of the businesses above the threshold provides two important pieces of information that will be examined in the empirical analysis. First, it gives an estimate of the fraction of type-I errors in the estimated platform organizations obtained after applying the model. Second, it leads to an estimate of the statistical association between
3. Results
3.1. Analysis of Text-Based Results
3.1.1. Step 1: Combined Data Set Creation and Data Collection
In the first step, we constructed a data set containing known examples of platform and non-platform organizations (Equation 1). The websites assigned to the organizations in the Business Register of Statistics Netherlands were an important starting point. Based on this register, the content of the associated websites, the findings of some initial studies (Heerschap et al. 2021), and their expertise, three business statistics employees of Statistics Netherlands created a set of 590 online platform organizations and identified 303 non-platform organizations, with very similar characteristics, during this process. To the latter, a random sample of 287 non-platform organizations, from the websites linked to the Business Register, were additionally added. The websites in this sample were manually checked to assure they were active, were not already included, and were definitely of non-platform organizations. This resulted in a combined data set of in total 1,180 organizations with a website. The organizations and websites included in the combined data set were removed from the large Business Register linked data set in subsequent analysis.
The combined data set of 1,180 organizations was used as the training and test set to develop an online platform text-based classifier. To obtain the texts required for our study, the websites in the combined data set, for example, all 1,180, and all websites linked to the Business Registers units, a total of 960,588, were attempted to be scraped. We found that all websites in the combined data set and 629,284 (66%) of the websites linked to the Business Register could be scraped. The websites that could not be scraped were found to be no longer active.
3.1.2. Step 2: Text Processing and Model Development
In the second step, the variable
The metrics for various trained classification methods, such as Naive Bayes, Logistic Regression, Support Vector Machines, Regression Trees, and Neural Networks, were compared. During this comparison, the effect of various processing steps on the texts and the choice to use only the words on the main page or the words on all pages scraped for a website were compared. Hyperparameter tuning, via a Tree of Parzen Estimators (Bergstra et al. 2011) followed by five-fold cross-validation, was used to assure the best possible outcome was obtained for each method. It was found that a trained Support Vector Machine (SVM) model with a linear kernel produced the best results when: (A) the words on all pages collected from of a website were used, (B) the words were stemmed, and (C) only words of three or more characters were included. Hyperparameter optimization revealed that the standard settings for this method already resulted in the best performance. For the SVM model, an accuracy of 82% (±2%) was obtained on the test set (as defined above in this section). The standard deviation was determined by repeating the entire procedure on resamples, with replacement, one thousand times. The precision was 84% (±3%), and the recall was 79% (±4%). Applying deeply trained Bidirectional Encoder Representations from Transformers (BERT) or its Dutch version BERTje (Fialho et al. 2020) did not produce better results. The creation of two language-specific models, one for Dutch and one for English websites, did also not improve the overall findings. Even though the SVM approach did not work perfectly, it produced the best statistical model to identify online platform websites of all options and combinations tested. Including Word Embeddings derived features did not improve the classification findings even after additional hyperparameter optimization. The SVM model obtained provided a score of being an online platform website that was scaled to a probability via a five-fold cross-validation procedure (Platt 2000). That probability (Equation 2) is, from here on, indicated as
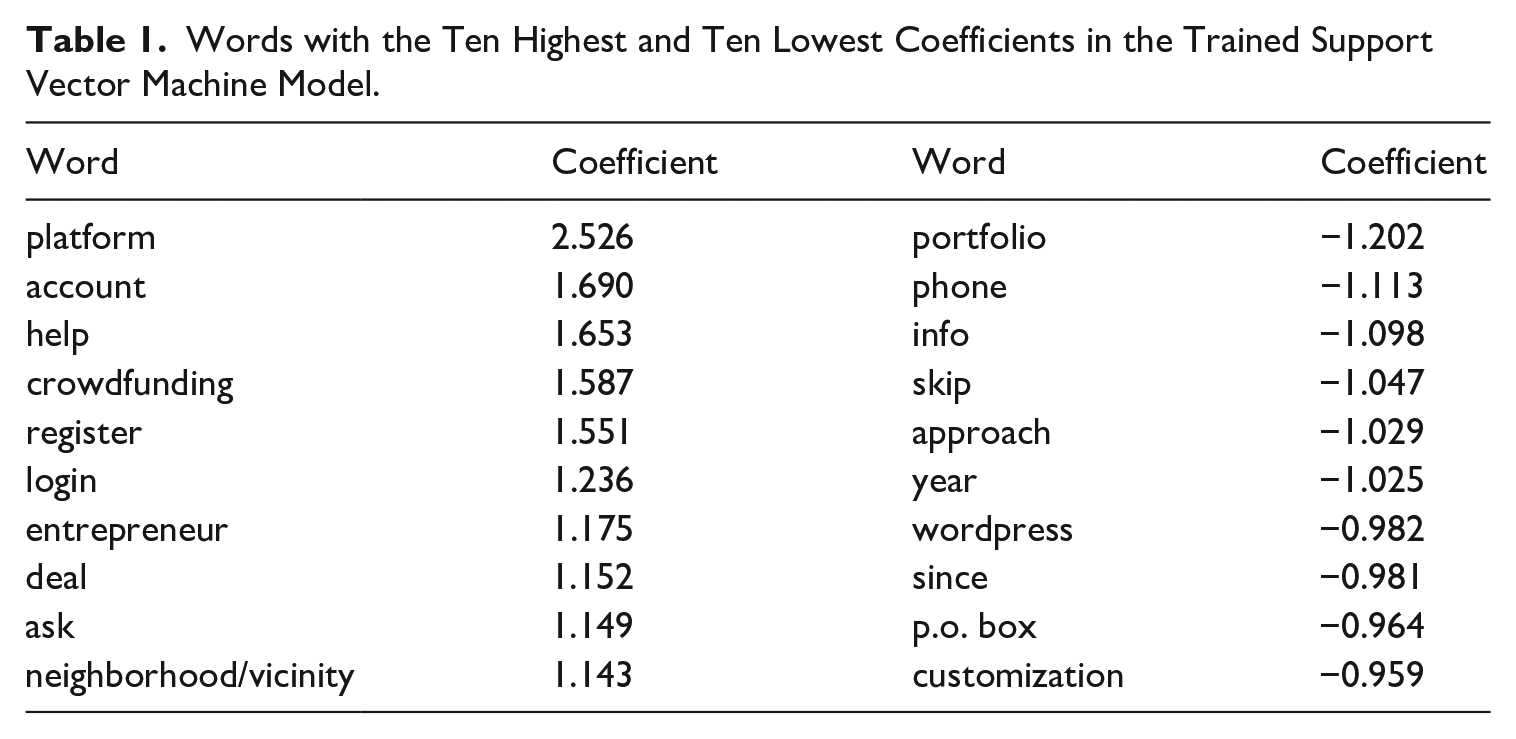
The findings of the SVM model were additionally checked by studying the distribution of the probabilities on the test set. This revealed a, somewhat noisy, U-shape indicating that the two cases could be separated fairly well. In addition, the ten words with the highest positive and highest negative coefficients used by the SVM model were inspected (see Table 1). The findings for the words with high positive coefficients indicate that the trained model picked up the intended classification topic. The words with high negative coefficients are indicative of a heterogeneous group of websites which is not an unexpected finding as there is a whole range of non-platform websites. Let it be clear that it is the combination of words, that remain after processing website texts, that is used by the SVM model to produce a probability score. As a consequence, the presence of a login module on a particular website alone does not have to result in a score high enough to be considered an online platform, for instance when other important words (such as platform) are absent.
Words with the Ten Highest and Ten Lowest Coefficients in the Trained Support Vector Machine Model.
3.1.3. Step 3: Prediction
In the third step, the statistical model is used to predict which organizations in the population are online platforms (Equation 3). Hence, the SVM model was applied to the texts extracted and processed from the huge set of web pages linked to the Business Register, while excluding those included in the combined data set. From the 629,284 websites linked a total of 10,964,998 pages could be scraped; indicating an average of slightly more than seventeen pages collected per website. The web pages were processed according to the optimal procedure described above which resulted in a text file for each website. Of those files, 594,574 (94.5%) contained ten words or more. These files were classified with the SVM model developed and, for each case, the probability of being an online platform website was determined. This resulted in 41,811 (7%) websites with a value above the standard cut-off value of 0.5 which is usually used as a threshold to indicate the positive cases. However, the histogram of the distribution of the probabilities for these websites indicated a strongly negatively skewed distribution (Figure 2). Because of this finding and the fact that the model was developed on an equal number of platform and non-platform websites, a situation that is expected to be far off from the platform-non-platform ratio of websites linked to the Business Register, made clear that the classification findings needed to be studied in more detail. This was done by drawing random samples of fifty websites in nine probability ranges, each 0.1 wide, and manually inspecting the websites selected. This revealed that in these samples, online platform websites started to occur at probabilities values of 0.8 and higher. In the lower value ranges, none were detected in the samples drawn. From this, it is clear that the model obviously overestimates the number of platform websites in the Business Register when a value of 0.5 is used as the positive detection threshold. This is an important finding as it reveals that the model behaves differently on the Business Register data compared to the training and test data. This not only has interesting research applications, described in more detail in Puts and Daas (2021), but also suggests applying a higher threshold value for online platform identification. The fact that the lowest point in the probability distribution is somewhere located around 0.90 corroborates this observation (Figure 2). We found that the number of websites with a
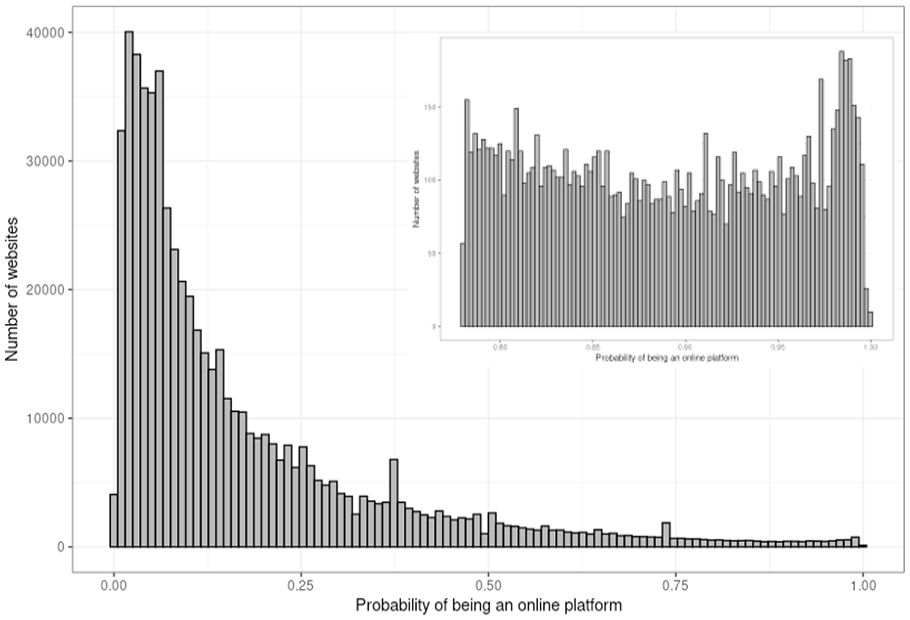
Histogram of the model-based probabilities of being an online platform website.
3.2. External Validity
3.2.1. Survey and Selection Procedure Used
To determine the extremal validity of the findings described above, an additional (new) source of information is needed. For this, we use the response of the organizations to the Dutch Online Platform survey of Statistics Netherlands (Klijs 2021). First, we report the selection procedure followed for the organizations given in Table 2. We start with the 9,129 websites identified as those of an online platform organization by the statistical model, all of which have a fitted probability
The Selection Procedure Followed.
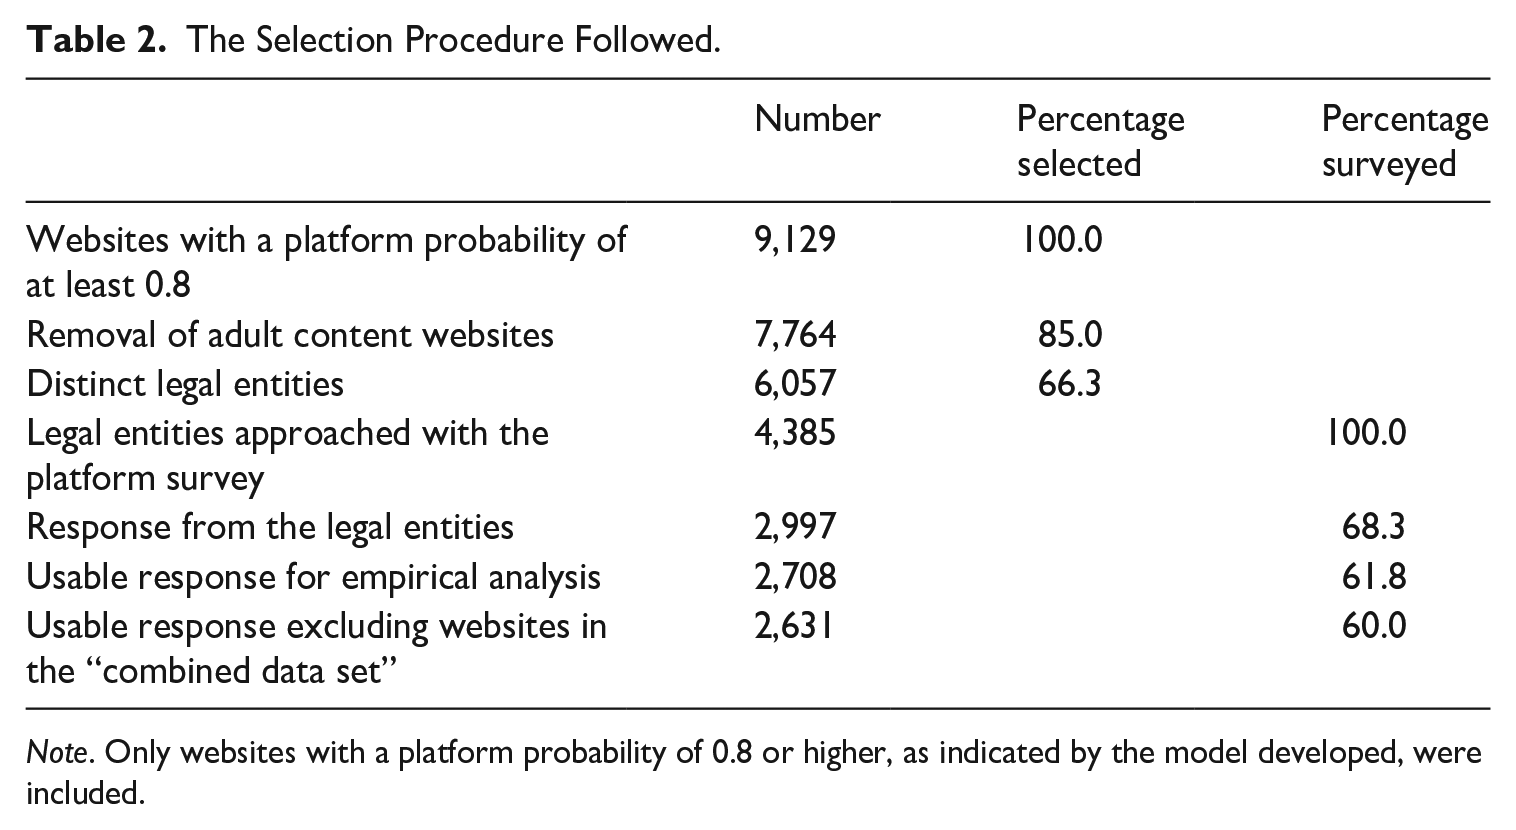
Note. Only websites with a platform probability of 0.8 or higher, as indicated by the model developed, were included.
3.2.2. Type-I Errors
To validate the results of the text-based classification, we examine the relative size of the type-I errors, which are the false positives of observing an online platform organization. There are two reasons for a type-I error. First, in the first step of the estimation procedure, the expert opinion leads to a wrong assessment of some of the organizations that are considered platform organizations. Second, in the third step of the estimation procedure, in which the empirical model is applied to the entire population, some of the organizations are mistakenly predicted as platform organizations.
To inspect the false positives, the responses to two questions included in the Dutch Online Platform survey are used; see Appendix. First, we report on the percentage of false positives. Out of the 2,708 organizations with a usable response, 2,064 organizations (76.2%) responded negatively to the question of whether their website is an online platform. This result suggests a substantial percentage of (potential) false positives. So a total of 644 platform organizations were initially found.
Next, a comparison is made between the combined data (used for model development in steps 1 and 2) and the classified organizations. The latter data are retrieved by step 3 of the statistical procedure, and in what follows they are referred to as the “predicted data.” Of the 2,708 responding organizations, there are seventy-seven organizations included in the combined data set of step 1 and 2. This means there are 2,631 responding organizations in the predicted data set. The percentage of organizations that indicated they are not an online platform is 54.5% for the organizations in the combined data and 76.9% for the organizations in the predicted data; a total of 2,022. This brings us to the second result, that organizations in the combined data, obtained through expert assessment in step 1, better reflect the platforms than the remaining (“predicted”) organizations obtained by prediction in step 3.
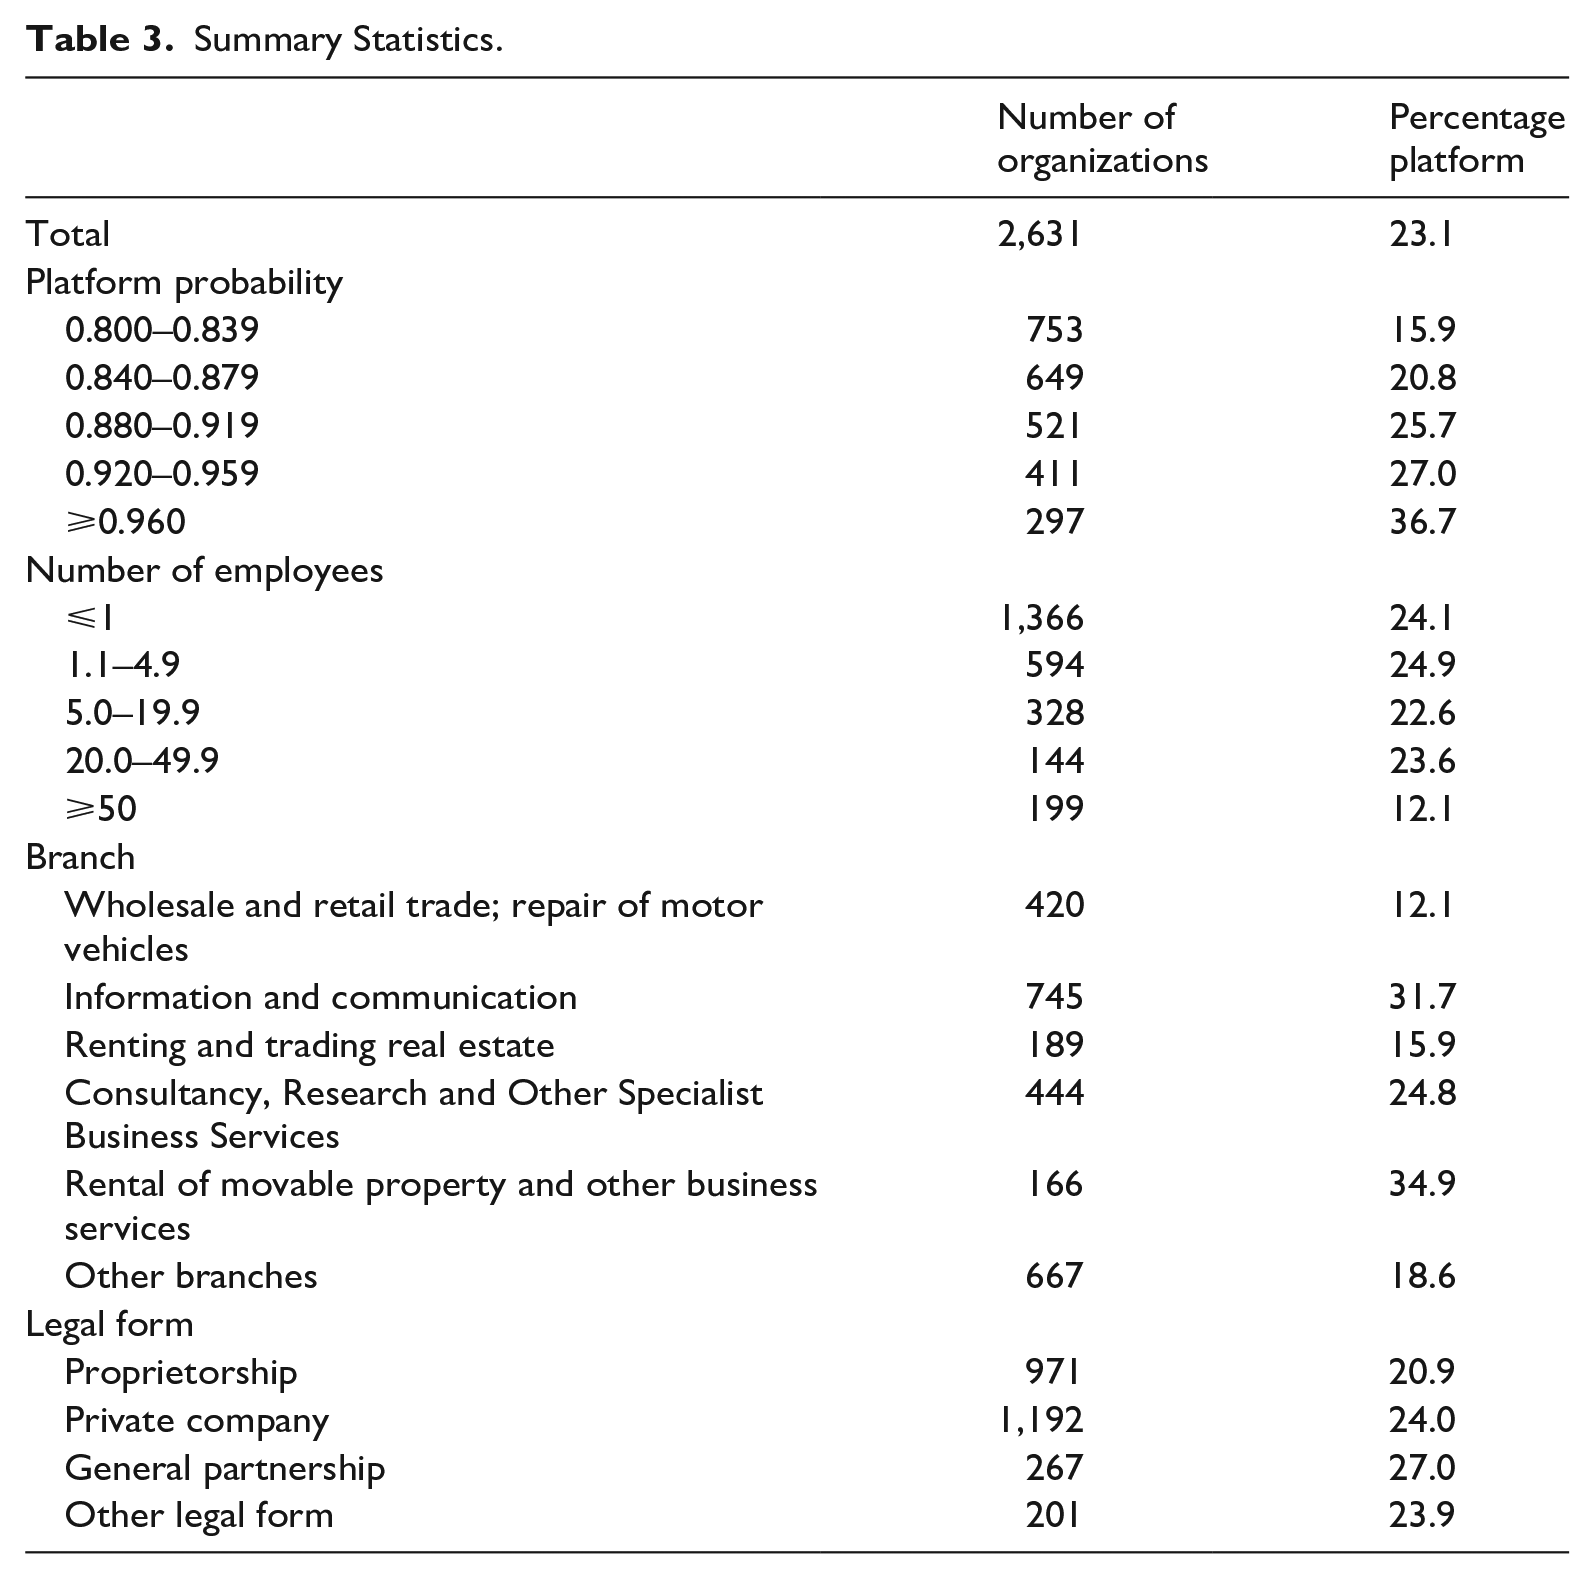
Next, we focus on the relationship between the false positives and
Summary Statistics.
Experts’ Second Opinion on the False Positives.
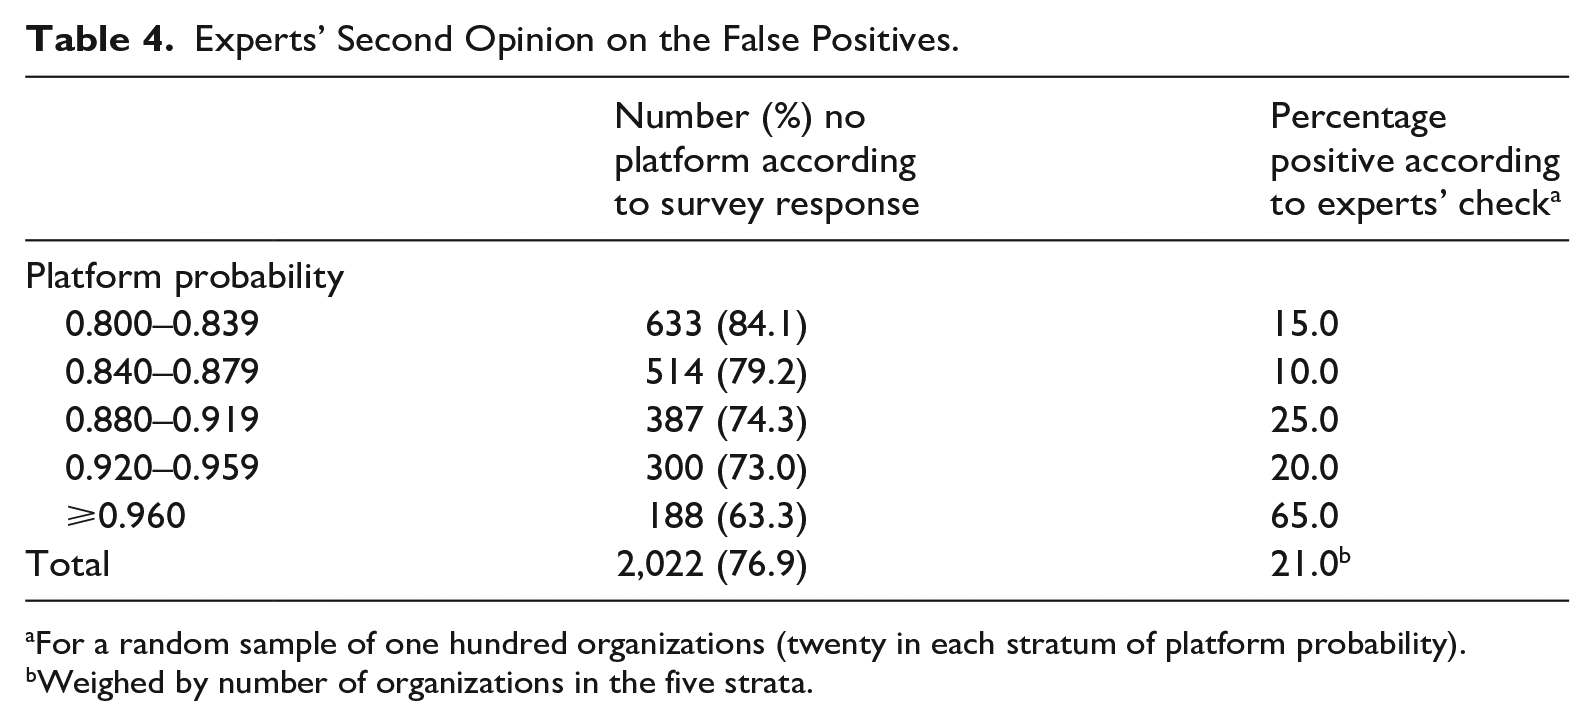
For a random sample of one hundred organizations (twenty in each stratum of platform probability).
Weighed by number of organizations in the five strata.
Finally, we reassessed a sample of the false positive organizations in the predicted data set by re-evaluating their website by the experts of Statistics Netherlands; a so-called second opinion. A random sample of one hundred (false positive) organizations was drawn from the 2,022 organizations identified as false positive in the predicted data set. The sample was stratified by the
Based on these empirical findings, we computed a lower and an upper bound for the percentage of false positives. There are two extreme situations. If we assume that the response to the survey gives a correct representation of whether or not the organizations surveyed are online platforms, the percentage of false positives is 76.9%. Alternatively, if we interpret the expert opinion as the gold standard, the percentage of false positives is only 60.8%; (76.9 × (100−21)/100). Based on the information available, it is expected that the actual percentage of false positives is somewhere between 60.8% and 76.9%. This suggests that the population contains at least 1,121 to 1,455 online platform organizations after correcting for false positives. Since there is no information on the false negatives, we emphasize that this value is, very likely, an underestimation of the true number of platform organizations. The group of organizations not surveyed, that is, those with a
3.2.3. Statistical Association
In this subsection, we measure the statistical association between
The starting point for the empirical specification is the response of the organizations to the survey questions about whether their website is an online platform. The dependent variable is a 0 or 1 indicator that gets the value of 1 if there is a positive response to the two questions shown in the Appendix. If that is not the case, the organization is characterized as a false positive. The variable regressed on is the fitted probability value of the platform organization, reported in subsection 3.1.3, as well as some control variables. The average of the dependent variable is 0.231 (Table 2), which makes it sufficiently large to specify the regression as a linear probability model (LPM)

where subscript
Although a valid probabilistic measure of
Next, we discuss the parameter estimates of Equation (4) that are reported in Table 5. According to the various specifications, the marginal effect of the estimated parameter on the platform probability ranges from 0.011 to 0.013. It means that an increase of the probability
Estimates Equation (4), Part 1.
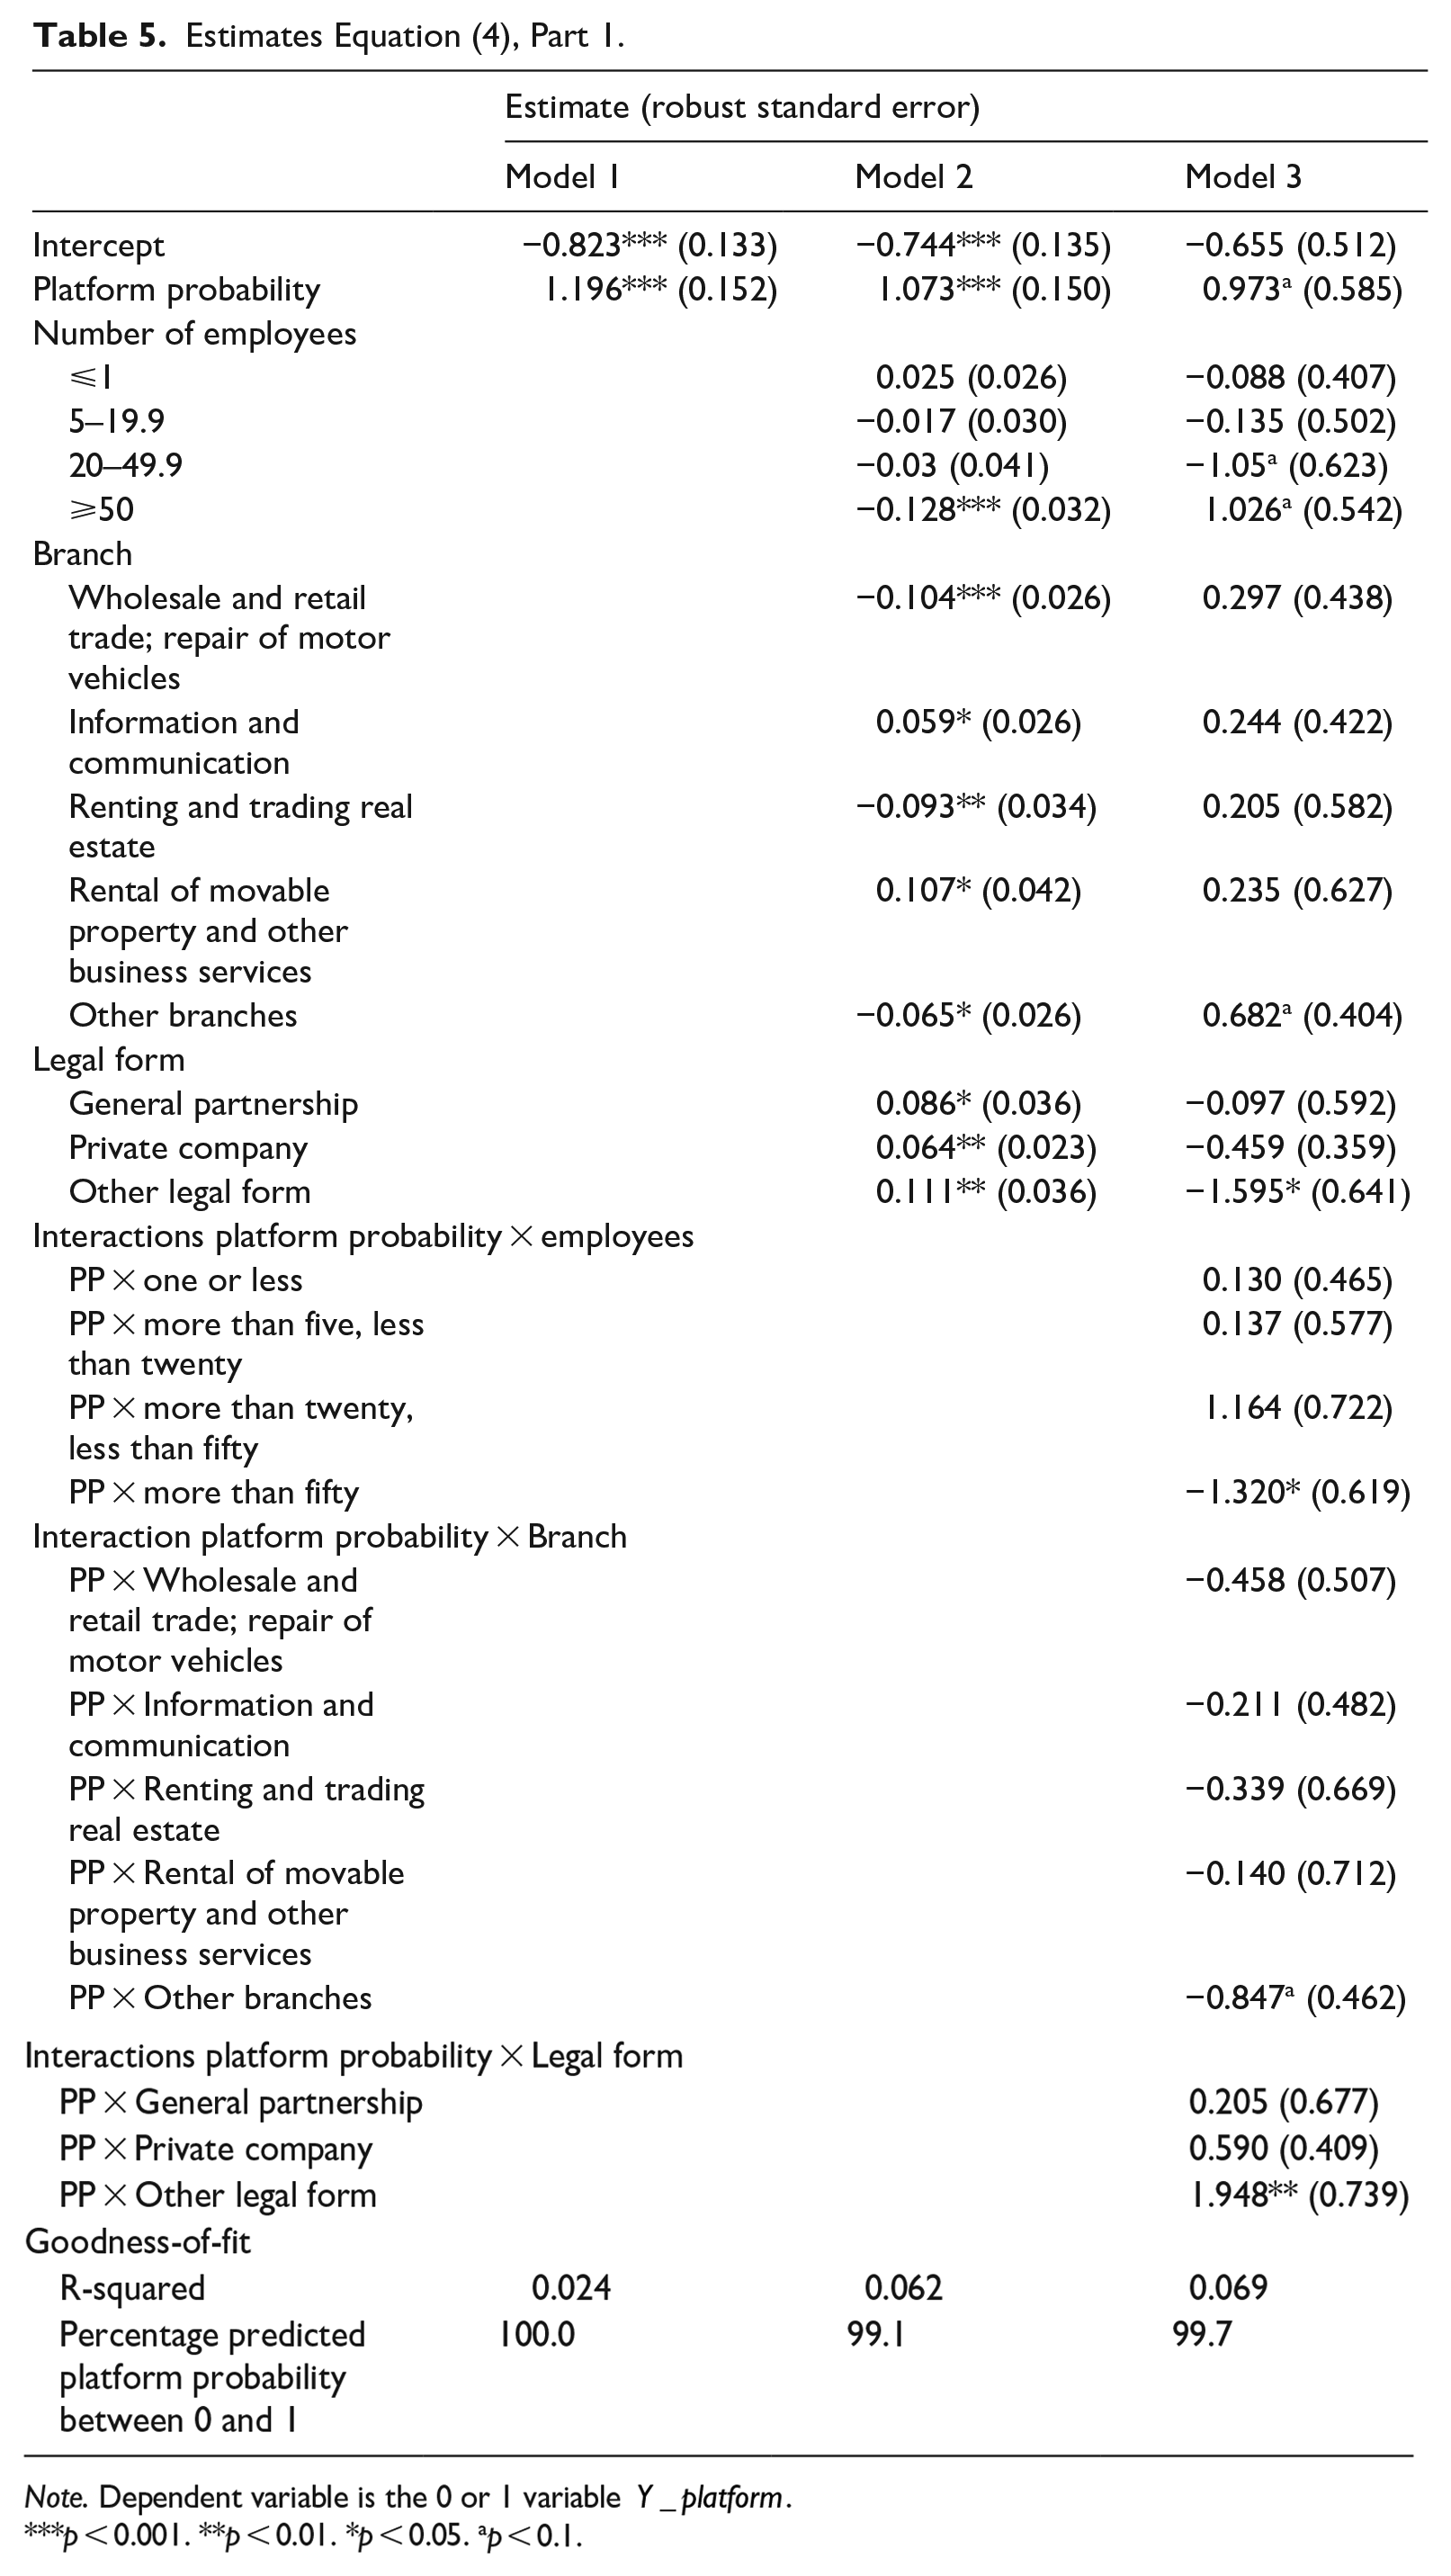
Note. Dependent variable is the 0 or 1 variable
p < 0.001. **p < 0.01. *p < 0.05. ap < 0.1.
Estimates Equation (4), Part 2.
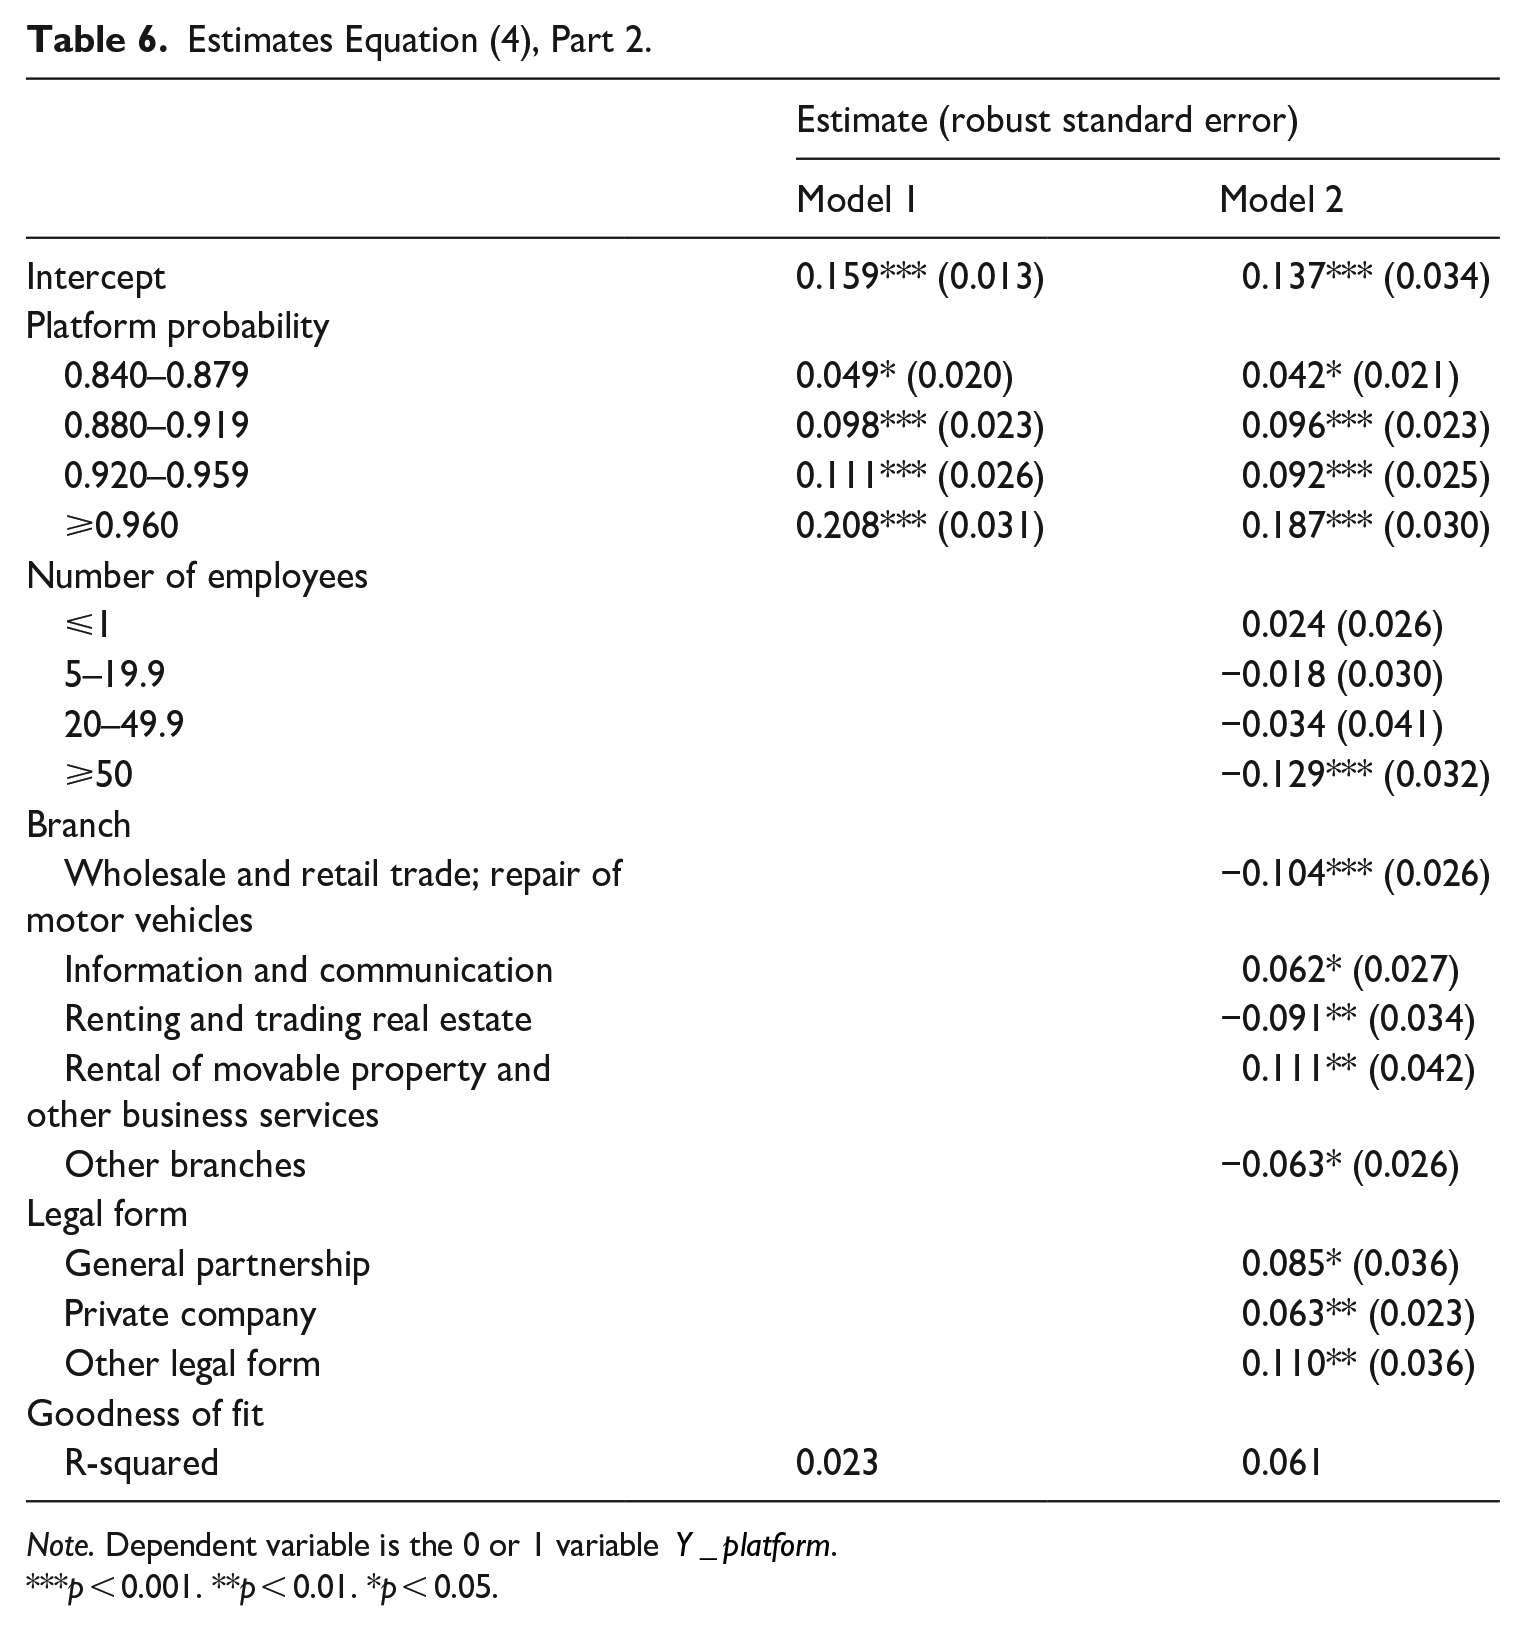
Note. Dependent variable is the 0 or 1 variable
p < 0.001. **p < 0.01. *p < 0.05.
4. Discussion
In this article we have reported an ex-post empirical analysis of the validation of a subpopulation that was identified through the combination of web scraping and text-based classification. Such a statistical procedure is a useful tool in case it is hard to identify the target population of research when conventional sampling methods from a predefined population, such as stratified sampling or cluster sampling, cannot be applied. Here, it helps that the procedure can be easily applied to large amounts of data. Indeed, for the application that is described in this article, it became clear that online platform activities are unevenly distributed economy-wide.
The estimates of the text-based classification procedure on online platform organizations lead to satisfactory outcomes after a number of additional selection steps. We consider the most relevant and least relevant words identified by the statistical model to be plausible. Furthermore, the distribution of fitted probabilities of being an online platform for the population of businesses gives a bimodal distribution. Our analysis also confirmed the earlier observation that a model developed on 50% positive (platform) and 50% negative (non-platform) cases, behaves differently when the model is applied to real-world ratios of these cases (Puts and Daas 2021). For online platform detection, which occurs much less than 50% in our “real-world” data, this results in an overestimation of the number of positive cases and makes the study, and consequently the reduction, of the number of false positive cases an important topic of the work described in this article. Here, it becomes clear that the model is able to identify a rare occurring group of (potential) online platform organizations in a very large population.
Our results show that applying the classification model seriously reduces the initial population of around 600,000 organizations to a set of a bit more than nine thousand organizations; a more than 60-fold reduction. The latter data set is highly enriched in platform organizations and could be, after some additional checking and selection, almost completely surveyed. To statisticians that want to apply our empirical approach, we strongly advise first making sure that the machine learning model is able to discern between the positive and negative cases of the topic studied in the best possible way. This requires not only a data set with typical positive and negative examples but also clear negative examples that, at first sight, resemble the positive cases reasonably well. In this way, one tries to make sure that only the relevant (and hence important) words are to be included in the model. When such a model is applied to the entire population, one subsequently needs to carefully check the external validity of the model by, for instance, manually inspecting websites.
We list a number of methodological learning points from our study. First, the quality of the data set used to build a classification model is important to get a bi-modal distribution of predicted outcomes. Second, the fraction of units in the target population must be sufficiently large to enable adequate detection. Third, the external validation indicates a positive association between the fitted probability of the text-based model and a positive response to the survey question on being an online platform organization. Fourth, the fraction of false positives is large. Fifth, we observe a remarkable disagreement between the organization and the experts’ opinion on the question of whether the organization can be characterized as an online platform. The latter could, for instance, be caused by the fact that the first two questions in the Dutch Online Platform survey focus on deriving if the organization can be characterized as an online platform. Any respondents that do not want to answer the remaining questions of the survey can simply end the survey by stating the business is not a platform organization. Future research will focus on dealing with the last three learning points since we expect it will substantially enhance the application of machine learning in official statistics and the study of rare business subpopulations. Finally, we leave to further empirical research the size of type-II errors.
Footnotes
Appendix
Questionnaire items and definition included in the Dutch Online Platform survey to assess whether the organization’s website is an online platform.
An online platform is a website or app where different people, organizations, or companies come into contact with each other and can be linked to each other. Goods, services, or information can then be exchanged via the online platform. The online platform usually does not supply these goods, services, or information itself, but mainly acts as an intermediary.
Platform confirmed: question 1 = “Yes,” question 2 = “No, in addition. .” or “No, there is. .”
Acknowledgements
The authors like to thank Kelby Çakim for her excellent assistance during the beginning of the project, Tim de Jong for his assistance in the hyperparameter optimization part of the study, and Marco Puts for stimulating discussions. Comments by Joep Burger, Javier Garcia-Bernardo, Joram Vuik, Ger Snijkers, and Yvonne Gootzen are gratefully acknowledged. We highly appreciate the comments and suggestions of the anonymous reviewers and (associate) editors on earlier versions of the article which have greatly improved the final manuscript.
Authors’ Note
The views expressed in this article are those of the authors and do not necessarily reflect the policies of Statistics Netherlands. Part of this article is based on the Dutch Online Platform survey carried out on behalf of the Dutch Ministry of Economic Affairs and Climate Policy.
Funding
The authors received no financial support for the research, authorship, and/or publication of this article.
Received: July 2022
Accepted: November 2023