
Abstract
The York University Teledyne Optech (YUTO) Mobile Mapping System (MMS) Dataset, encompassing four sequences totaling 20.1 km, was thoroughly assembled through two data collection expeditions on August 12, 2020, and June 21, 2019. Acquisitions were performed using a uniquely equipped vehicle, fortified with a panoramic camera, a tilted LiDAR, a Global Positioning System (GPS), and an Inertial Measurement Unit (IMU), journeying through two strategic locations: the York University Keele Campus in Toronto and the Teledyne Optech headquarters in City of Vaughan, Canada. This paper not only delineates the comprehensive overview of the YUTO MMS dataset, delving into aspects such as the collection procedure, sensor configuration, synchronization, data structure and format but also presents a robust benchmark of prevailing Simultaneous Localization and Mapping (SLAM) systems. By subjecting them to analysis utilizing the introduced dataset, this research lays a foundational baseline for ensuing studies, thereby contributing to advancements and enhancements in the SLAM-integrated mobile mapping system. The dataset can be downloaded from: https://ausmlab.github.io/yutomms/.
Keywords
1. Introduction
SLAM is a crucial technology in the field of self-driving vehicles and robotics. It enables autonomous systems to navigate, avoid obstacles, and interact with the environment. The development of SLAM has led to the creation of various benchmark datasets designed to improve robotic capabilities. Recent SLAM datasets by Corte´s et al. (2018); Helmberger et al. (2022); Zhang et al. (2022); Gao et al. (2022) have tackled challenges in visual and LiDAR-based SLAM. These include rapid camera movements, dynamic object presence, navigation in textureless environments, and adaptation to varying lighting conditions. These datasets provide standardized data and evaluation metrics essential for impartially assessing SLAM algorithms. Such benchmarks help identify algorithmic strengths and weaknesses and steer innovation towards greater efficiency, precision, and robustness.
However, SLAM datasets do not fully cater to the specific needs of MMS aimed at creating detailed maps for autonomous vehicles and smart city initiatives. MMS traditionally requires expensive sensors and significant processing power to generate high-quality, survey-grade maps. Recent advancements have shifted towards adopting more economical, lower-grade sensor designs in MMS to balance quality with affordability and computational efficiency (Elhashash et al., 2022). Integrating SLAM technology with MMS, called SLAM-Integrated MMS, utilizes SLAM’s accuracy in environments with unreliable GPS signals to produce precise maps (Li et al., 2020). This integrated approach addresses several traditional MMS challenges, such as unreliable localization in complex environments due to GPS and INS limitations, mapping inconsistencies leading to point cloud ghosting, and the heavy computational demands of traditional mapping techniques (Ahmadi et al., 2023; Kang et al., 2021; Zhang et al., 2023). Despite the critical role of SLAM-Integrated MMS, there is a noticeable gap in datasets specifically tailored for this application, underscoring the significance of developing a dedicated dataset.
The YUTO MMS dataset addresses this gap by providing a meticulously collected dataset explicitly designed for SLAM-Integrated MMS applications while offering utility for general SLAM and odometry research. This dataset is distinct from others primarily aimed at autonomous driving and robotic navigation, as it is designed to fulfill the intricate requirements of accurately mapping urban and natural landscapes on a large scale. Captured using a state-of-the-art (SOTA) sensor suite mounted on a vehicle, the dataset encompasses four sequences from two distinct collection dates: August 12, 2020, and June 21, 2019.
Covering a distance of over 20.1 km across varied environments, this dataset has been meticulously assembled to provide a comprehensive resource for developing, testing, and benchmarking advanced systems.
The collection of the YUTO MMS dataset involved extensive fieldwork at strategic locations, including York University’s Keele Campus in Toronto and the Teledyne Optech headquarters in Vaughan, Ontario, Canada. The data was gathered under typical daily conditions, capturing the dynamism of urban life with busy roads filled with cars, buses, pedestrians, and cyclists. The dataset intricately includes several loops, multiple turning points, traffic lights, and stop signs, introducing complexities such as acceleration. This rich detail makes the dataset invaluable for assessing the effectiveness and resilience of visual SLAM algorithms in dynamic urban settings.
In addition to its comprehensive environmental coverage, the YUTO MMS dataset is noted for its unprecedented level of detail in documentation. It meticulously covers aspects such as the data collection procedure, sensor configurations and synchronization, as well as the data structure and format. This granularity ensures researchers have the necessary information to utilize the dataset fully for their specific research needs.
A significant feature of the dataset includes a tilted LiDAR sensor, which introduces both unique challenges and opportunities for SLAM applications. The tilt of LiDAR enables it to detect and capture features at greater heights around the road, such as traffic signs, lights, light poles, highway billboards, and tall buildings. These mostly static tall features can provide valuable information for accurate localization and mapping. However, the performance of SLAM may be compromised at lower heights where dynamic objects are prevalent. Despite these challenges, the ability of the tilted LiDAR to utilize static tall features can meaningfully contribute to the overall effectiveness of SLAM systems, enhancing their robustness and accuracy in urban environments (Xu et al., 2019).
The tilted configuration of the LiDAR sensor presents specific challenges for both LiDAR-centric and coupled visual-LiDAR SLAM methodologies. In LiDAR-centric SLAM, tracking objects becomes difficult due to the limited coverage width, as objects remain within the LiDAR-covered regions for only brief periods. Additionally, the tilted setup complicates point matching and accurate geometry modeling, since it does not provide full coverage of the road ahead and offers sparse coverage, especially at lower heights. Coupled visual-LiDAR SLAM systems also face difficulties due to the non-rectangular overlapping region between the camera and the tilted LiDAR sensor, which results in a restricted and challenging area for data integration. Furthermore, the topmost LiDAR beams often fail to intersect with objects due to the absence of tall structures, leading to sparse data in the upper parts of the LiDAR scans. To address these unique challenges, the dataset utilizes the Maverick MMS developed by Teledyne Optech, a system specifically designed for mapping applications in environments with tall buildings. The Maverick MMS combines the Ladybug 5 panoramic camera with the Velodyne HDL-32E LiDAR, which features a spinning axis positioned at a 45-degree angle to the camera’s optical axis.
This configuration enables the system to effectively capture a comprehensive view of the environment, both visually and through LiDAR data. The Maverick system’s use of real-time kinetic (RTK) positioning, based on GPS receiver signals, ensures the establishment of accurate ground truth for the dataset.
This dataset primarily focuses on SLAM-Integrated MMS applications. However, its diverse and rich data can be used for general SLAM and odometry research and beyond. The dataset offers potential for various applications, including depth estimation, object detection and tracking, place recognition, and visual feature descriptor learning. The objects in the dataset are diverse, encompassing both dynamic and static entities, which makes it suitable for various computer vision tasks.
The YUTO MMS dataset is a valuable asset for advancing SLAM-Integrated MMS, SLAM and odometry research, setting a new benchmark in this field. It enables a deeper understanding of the complexities involved in mobile mapping. It showcases the potential of integrating advanced SLAM technologies to overcome traditional data collection and mapping accuracy limitations. In summary, the work presents significant contributions to the domains of SLAM and MMS, offering: • Innovative dataset for SLAM-Integrated MMS that directly addresses the specialized needs of SLAM-integrated MMS, filling an essential gap in research resources. • Comprehensive environmental data from over 20.1 km of varied urban and natural landscapes, enhancing SLAM and odometry research with a focus on dynamic urban complexities. • SOTA Sensor suite with tilted LiDAR introduces novel data acquisition challenges and opportunities, significantly enriching mapping applications with detailed urban and natural landscape data. • Granular dataset presentation provides unprecedented detail on collection procedures, sensor configurations, and data structure, supporting the development, testing, and benchmarking of advanced systems. • Facilitates a wide range of applications beyond traditional SLAM, like depth estimation, contributing to advancements in autonomous navigation and environmental mapping.
2. Related works
Comparison with the related datasets on the dataset name, publication time, sensors, carrier, data acquisition environment, total distance and ground truth estimation method.
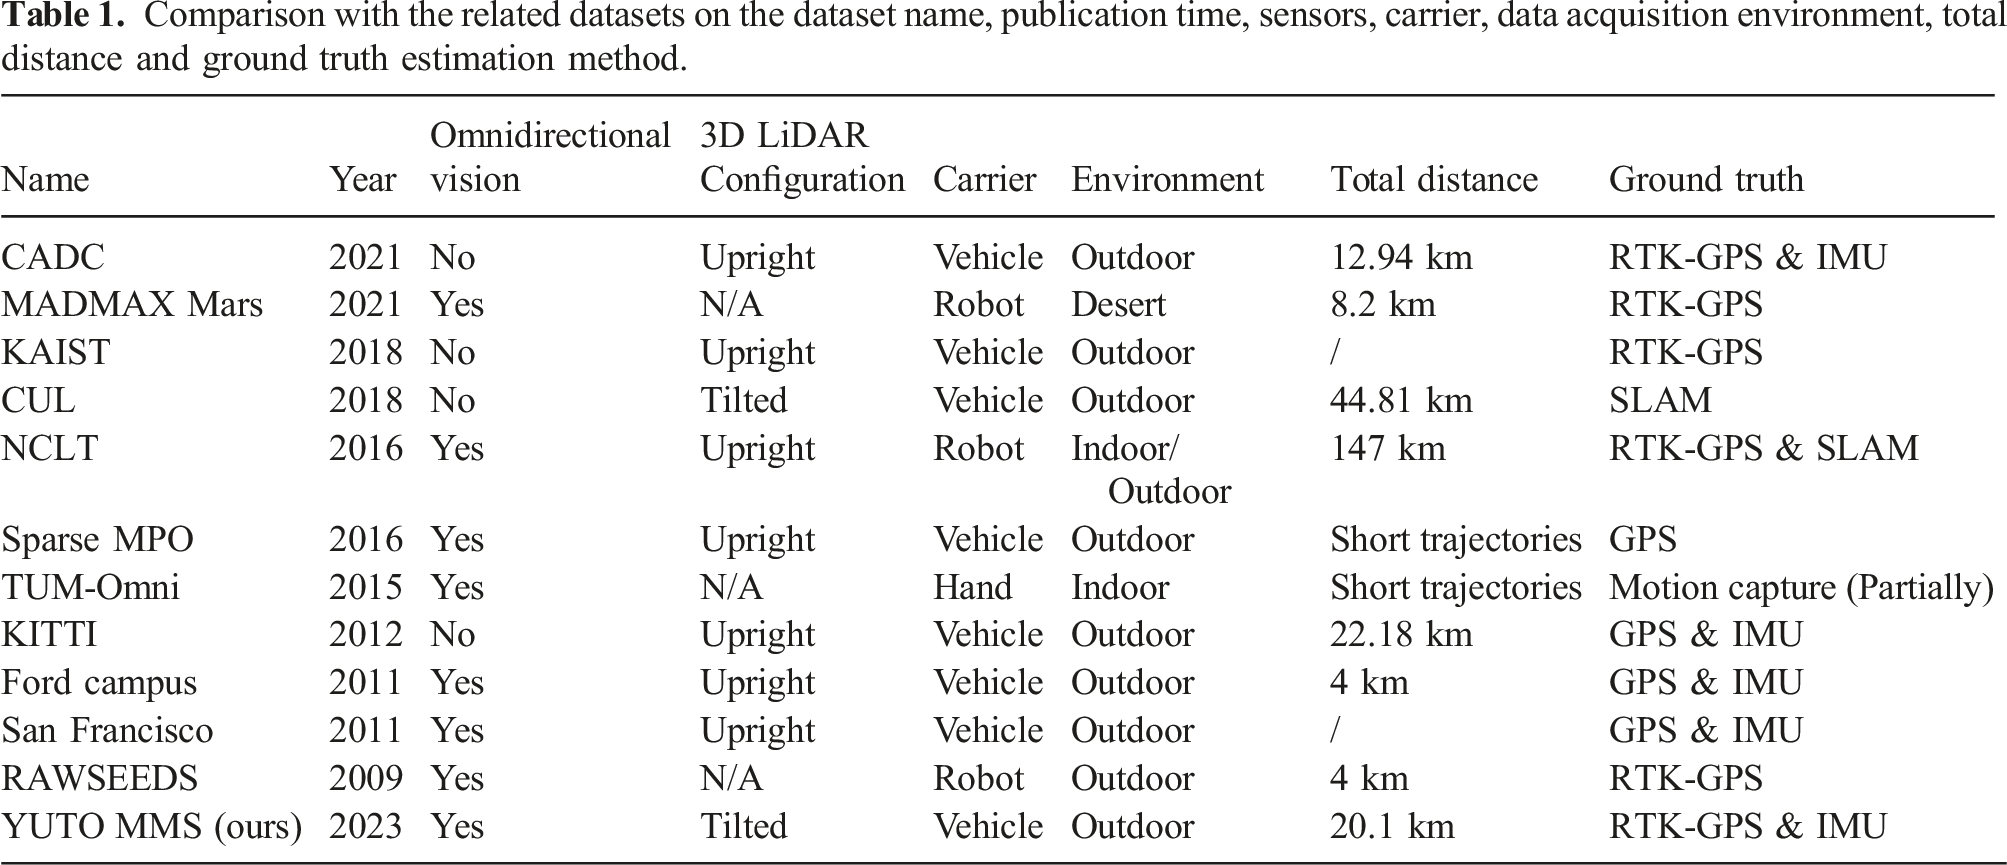
The Canadian Adverse Driving Conditions (CADC) dataset (Pitropov et al., 2021) is the first autonomous vehicle dataset that focuses on adverse driving conditions specifically. This dataset was collected during winter within the Region of Waterloo, Canada. It contains 7000 frames of annotated data from 8 Ximea MQ013CG-E2 cameras, VLP-32C LiDAR and a Novatel OEM638 GNSS + INS system. The sensors are time synchronized and calibrated. Scale AI provides Lidar frame annotations that represent ground truth for 3D object detection and tracking.
MADMAX (Meyer et al., 2021) focuses on the development of a data set specifically designed for planetary rovers. The data was collected from various Mars analog sites in the Moroccan desert, featuring diverse environ-mental conditions. The data set comprises 36 navigation experiments and incorporates multiple types of sensors, including monochrome stereo cameras, a color camera, stereo omnidirectional cameras, and an IMU. Notably, the data set does not include a 3D LiDAR sensor. The authors evaluate the performance of ORB-SLAM2 and VINS-mono algorithms on the dataset, providing a valuable baseline for future research. To establish ground truth pose information, they utilize a RTK-GPS with two antennas, enabling precise measurements of both position and orientation.
KAIST (Choi et al., 2018) introduces a multi-spectral dataset that covers regions from urban to residential for autonomous systems. KAIST dataset provides the different perspectives of the world captured in day and night, in addition to sunrise, morning, afternoon, sunset, night, and dawn time slots. A multi-sensor platform is developed, which includes a co-aligned RGB/Thermal camera, RGB stereo, 3D LiDAR, and GPS/IMU sensor with a related calibration technique. The dataset can be applied in a wide range of visual perception tasks, including the object detection, drivable region detection, localization, image enhancement, depth estimation, and colorization using a single/multi-spectral approach.
CUL (Jeong et al., 2018, 2019) was collected using a mobile mapping vehicle in South Korean cities: Gangnam, Pangyo, and Daejeon. The data collection utilized a range of sensors including four LiDARs, with two 3D LiDARs for maximum data acquisition range and two 2D LiDARs for effective information gathering on buildings and roads, GPS, Virtual Reference Station (VRS)-GPS, 3-axis Fibre Optic Gyroscope (FOG), IMU, and an altimeter sensor.
Notably, the dataset includes two 3D LiDAR sensors tilted at 45°, positioned on the right and left sides of the vehicle, enabling comprehensive coverage of high-rise buildings. The dataset comprises six sequences with a total distance of approximately 44.81 km. Although ground truth data is unavailable, the authors utilized the most accurate sensors in conjunction with pose graph SLAM, semi-automatic ICP (Iterative Closest Point) registration, and manual loop closure selection to generate a reliable baseline for benchmarking and evaluation purposes. The dataset serves as a valuable resource for researchers in the fields of urban LiDAR data analysis and SLAM algorithm development.
NCLT (Carlevaris-Bianco et al., 2016) is a useful dataset for the advancement in fields such as autonomous driving, robotics, and 3D scene reconstruction. This dataset comprises a large collection of indoor and outdoor data, including LiDAR scans and high-resolution panoramic images captured by a variety of diverse sensors. The sensor suite includes an upright Velodyne HDL-32E 3D LiDAR, a panoramic camera, and two 2D Hokuyo planar LiDARs, as well as IMU, GPS, and FOG. The dataset provides diverse scenes and environmental conditions, with over 15 months of data collected during 27 collection sessions, each varying in length, time, sky, foliage, and snow. The repeated exploration of the same environment and using a Segway robot to collect the data ensures a comprehensive and diverse dataset. For their ground truth, they have used GPS signals and SLAM wherever the GPS signal is unavailable.
MPO (Jung et al., 2016) provided two specialized datasets, Dense MPO and Sparse MPO, aimed at advancing place categorization. The Dense MPO is a collection of static images that are not suitable for SLAM purposes. However, the Sparse MPO dataset comprises real-time panoramic scans of sparse 3D reflectance point clouds recorded while driving a car, making it suitable for SLAM. The Sparse MPO was gathered by driving a vehicle at speeds between 30 and 50 kph through different areas of Fukuoka city. The sensors used to acquire the Sprase MPO dataset include an upright 3D LiDAR, an omnidirectional camera, IMU and a GPS. The data was collected under different weather conditions and at various times of the day, providing a diverse range of scenes and environmental conditions. Nonetheless, the sequences in the dataset are too short for SLAM, as noted in their following journal paper by Mart´ınez et al. (Mart´ınez Mozos et al., 2019).
In TUM-Omni (Caruso et al., 2015), in addition to their proposed methods, the authors have curated a dataset for evaluation purposes. The dataset has been captured using a handheld global-shutter USB3 camera equipped with a 185◦ field of view fisheye lens, in indoor environments. The authors publicly provide five indoor sequences on their website for research purposes. Ground truth data was acquired using a motion capture system that covers an area of approximately 7 × 12 m. However, errors were only computed on the part of the trajectories where ground truth data was available, meaning that some sequences fell out of the motion capture-covered region. The authors also generated two additional sequences using the Gazebo simulator, which were not released publicly.
KITTI dataset (Geiger et al., 2012, 2013) introduces a novel real-world dataset captured for use in mobile robotics and autonomous driving research. Various sensor modalities are employed for data collection, including high-resolution color and grayscale stereo cameras, a Velodyne 3D laser scanner, and a high-precision GPS/IMU inertial navigation system. The dataset comprises 6 h of diverse traffic scenarios featuring numerous static and dynamic objects recorded at 10 to 100 Hz. The KITTI data is well-calibrated, synchronized, and timestamped, and it also provides object labels in the form of 3D tracklets. Additionally, KITTI offers online benchmarks for stereo, optical flow, object detection, and other tasks.
In Ford Campus dataset (Pandey et al., 2011), the data collection was conducted in an urban environment encompassing both the Ford research campus area and the downtown area in Dearborn, Michigan, U.S.A. The dataset was acquired using a modified Ford F-250 vehicle equipped with a variety of sensors, including an upright 3D LiDAR, a panoramic camera, two 2D Riegl LMS-Q120 LiDARs, GPS, and IMU. The vehicle traversed the test environment multiple times, resulting in two distinct trajectories that provided extensive coverage of the surroundings. The authors have not provided the total sequence length, but we estimated the sequences using Google Maps 1 distance calculations, and it is around 4 KM in total. Also, in their dataset directory, the images folder within the dataset comprises five subfolders, each dedicated to an undistorted camera view captured by the panoramic camera without any additional processing.
In the San Francisco dataset (Chen et al., 2011), the authors employed a range of sensors, including an upright 3D LiDAR, Ladybug3 panoramic camera, IMU, GPS, high-definition cameras (Prosilica), and a Distance Measurement Instrument (DMI), mounted on a mobile mapping vehicle. The dataset was collected in San Francisco and comprises approximately 150,000 panoramic images captured at 4-meter intervals, which were subsequently converted into approximately 1.7 million perspective images. It is important to note that the dataset’s sampling rate, though beneficial for landmark identification, may not be suitable for SLAM due to the relatively sparse capture intervals. The authors aligned the LiDAR data and the panoramas with the building outlines, facilitating more accurate landmark identification and localization. This dataset provides a valuable resource for research in mobile mapping, landmark recognition, and related areas.
Bovisa (Bonarini et al., 2006) presents a RAWSEEDS dataset collected using a variety of sensors mounted on a robot. The sensors used include a two-camera setup for binocular vision, a single camera for monocular vision, an omnidirectional camera, two pairs of 2D Laser Range Finders (LRFs), an IMU, and GPS. The data was collected in three sequences from the same location at the Bovisa campus of Politecnico di Milano, focusing on outdoor environments. The ground truth for the dataset was obtained from Real-Time Kinematic (RTK)-GPS. While the authors have not provided the exact sequence length, an estimated length of approximately 4 km was determined using Google Maps.
In conclusion, the literature review has provided an in-depth analysis of the most relevant papers in the field of outdoor SLAM datasets. While each reviewed work offers valuable insights and contributes to the advancement of SLAM research, it often lacks certain aspects of particular interest in our study. RAWSEEDS, TUM-Omni, NCLT, MADMAX Mars datasets utilize non-vehicle carriers, such as handheld devices or robots, which may not fully capture the complexities of vehicular motion, which is crucial for realistic SLAM analysis. Additionally, RAWSEEDS, San Francisco, Ford Campus, TUM-Omni, Sparse MPO, KAIST, MADMAX Mars datasets have limited coverage in terms of total distance, which restricts the evaluation of SLAM performance in expansive environments. Furthermore, TUM-Omni dataset focuses on indoor scenarios rather than the challenging conditions encountered in outdoor environments. Regarding ground truth accuracy, CUL, Sparse MPO, TUM-Omni datasets do not provide precise calculations, hindering the potential for accurate benchmarking. Moreover, the absence of a tilted LiDAR configuration limits the ability to effectively capture and model high-rise buildings and other tall structures. Lastly, the absence of a panoramic or an omnidirectional camera restricts comprehensive visual perception. In contrast, our newly introduced dataset, the YUTO MMS dataset, stands out for its unique combination of a vehicle-based carrier, considerable total distance coverage, outdoor scenarios, precise ground truth, tilted LiDAR configuration, and inclusion of a panoramic camera. These distinctive characteristics make the YUTO MMS dataset a valuable resource for advancing research and development in SLAM-Integrated MMS and outdoor SLAM applications.
3. Maverick mobile mapping system
3.1. System overview
The development of Maverick MMS by Teledyne Optech was driven by the demand for a versatile and high-performance mobile mapping unit that can be easily transported. The Maverick MMS has proven to be a valuable tool in a wide range of industries and applications, owing to its robust and versatile data collection capabilities. Its datasets have been utilized in projects related to transportation safety, construction, asset management, rail, utilities, and 3D modeling. Figure 1 illustrates the comprehensive configuration of Maverick MMS along with planned route for data collection. (a) The sensor configuration of the Maverick MMS; (b) An example of the vehicle platform utilized for data collection; (d) The planned route within the Teledyne Optech headquarter, overlaid on Google Maps; (c) The planned route within the York University campus, overlaid on Google Maps.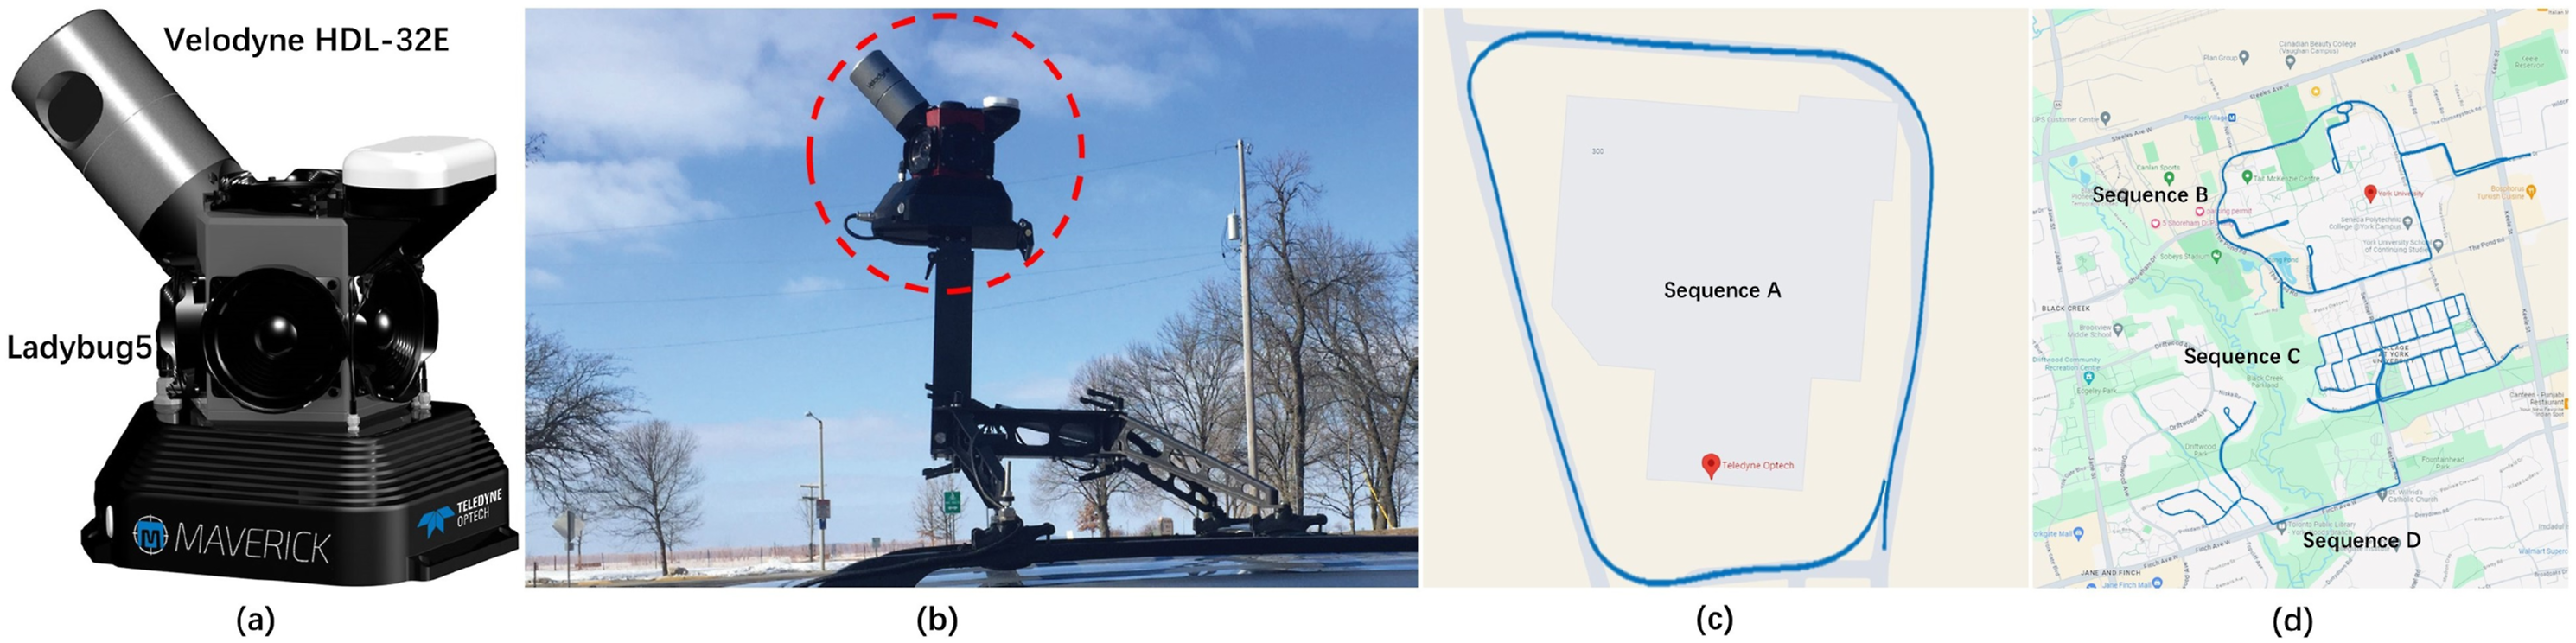
3.2. System characteristics
Maverick MMS specifications.
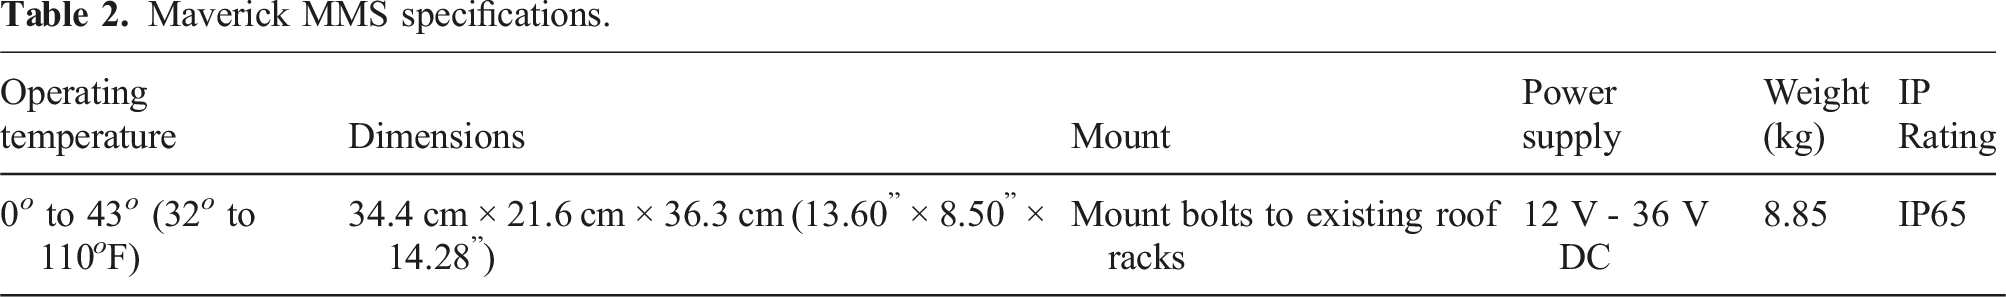
3.2.1. Configuration
The Maverick MMS is mounted at a 45-degree angle between the optical axis of the camera and the spinning axis of the LiDAR. When mounted on a car, this results in the camera’s optical axis being parallel to the ground, while the LiDAR’s spinning axis is tilted 45° with respect to the ground. In the experiments, images were captured at an average of 7.5 frame per second (FPS), while LiDAR points were acquired at a spinning rate of 15 revolution per second (RPS).
3.3. Sensors
The Maverick MMS comprises a Ladybug 5 panoramic camera as the imaging component, a Velodyne HDL-32E LiDAR as the LiDAR component, and a high-precision GPS/IMU. It also includes a post-processing software called LMS (LiDAR Mapping Suite) that generates trajectories with centimeter-level precision by performing offline bundle adjustment with the aid of high-precision GPS/IMU data and LiDAR points.
3.3.1. LiDAR
The LiDAR component used in the Maverick MMS is the Velodyne HDL-32E, which has 32 detector pairs and a vertical field of view ranging from +10 to −30°. It provides a 360-degree horizontal field of view and can scan up to 100 m. The absolute accuracy of this LiDAR sensor is typically within +-3 cm, making it a reliable and high-precision tool for capturing 3D spatial data from a moving vehicle.
3.3.2. Camera
The imaging component of the Maverick MMS is the Ladybug 5 camera, which uses six Sony ICX655 CCD sensors, each with a 2/3” format. The Ladybug 5 provides a 90% field of view of the full sphere, making it capable of capturing panoramic images from all directions. With a focal distance of approximately 200 cm, it can capture high-quality images with a resolution of up to 30 megapixels (5 MP * 6 sensors). The camera’s optics consist of six 4.4-mm focal length lenses, and it has been calibrated for spherical distance from 2 m to infinity. These specifications make the Ladybug 5 camera a powerful tool for capturing high-resolution panoramic imagery in a mobile mapping context.
3.3.3. GPS/IMU
Maverick has a NovAtel SPAN-IGM-S1, which serves as a GNSS unit. It represents a powerful solution for navigation and positioning applications, seamlessly merging raw inertial measurements with comprehensive GPS information through the SPAN system. It guarantees robust performance, equipped with three accelerometers, three gyroscopes (gyros), and a NovAtel OEM615 receiver. The dual-frequency GPS antenna ensures reliable satellite signal reception, while integrating the STIM300 IMU further enhances accuracy. In the dataset collection process, the average values of IMU accelerometer bias are [0.014, −0.006, 0.022] m/s2 and the gyro drifts are [−15, 13, 31] deg./hr in X-Y-Z directions.
4. Data acquisition and processing
To achieve this, a photogrammetric bundle block adjustment is performed using GNSS and INS position and orientation information, with automated tie-point measurement used to estimate corrections for interior orientation, boresight parameters, and trajectory position.
4.1. Operation
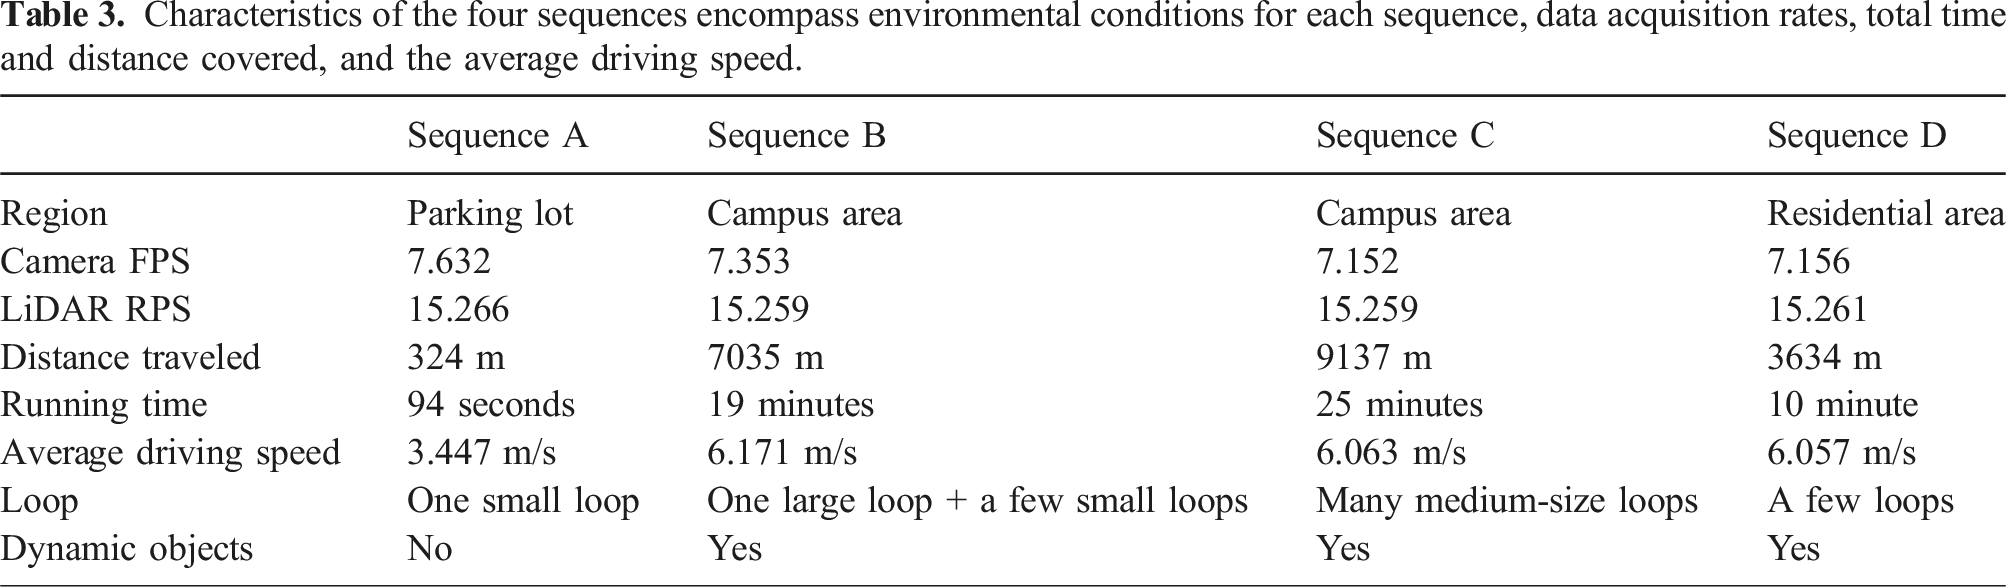
Characteristics of the four sequences encompass environmental conditions for each sequence, data acquisition rates, total time and distance covered, and the average driving speed.
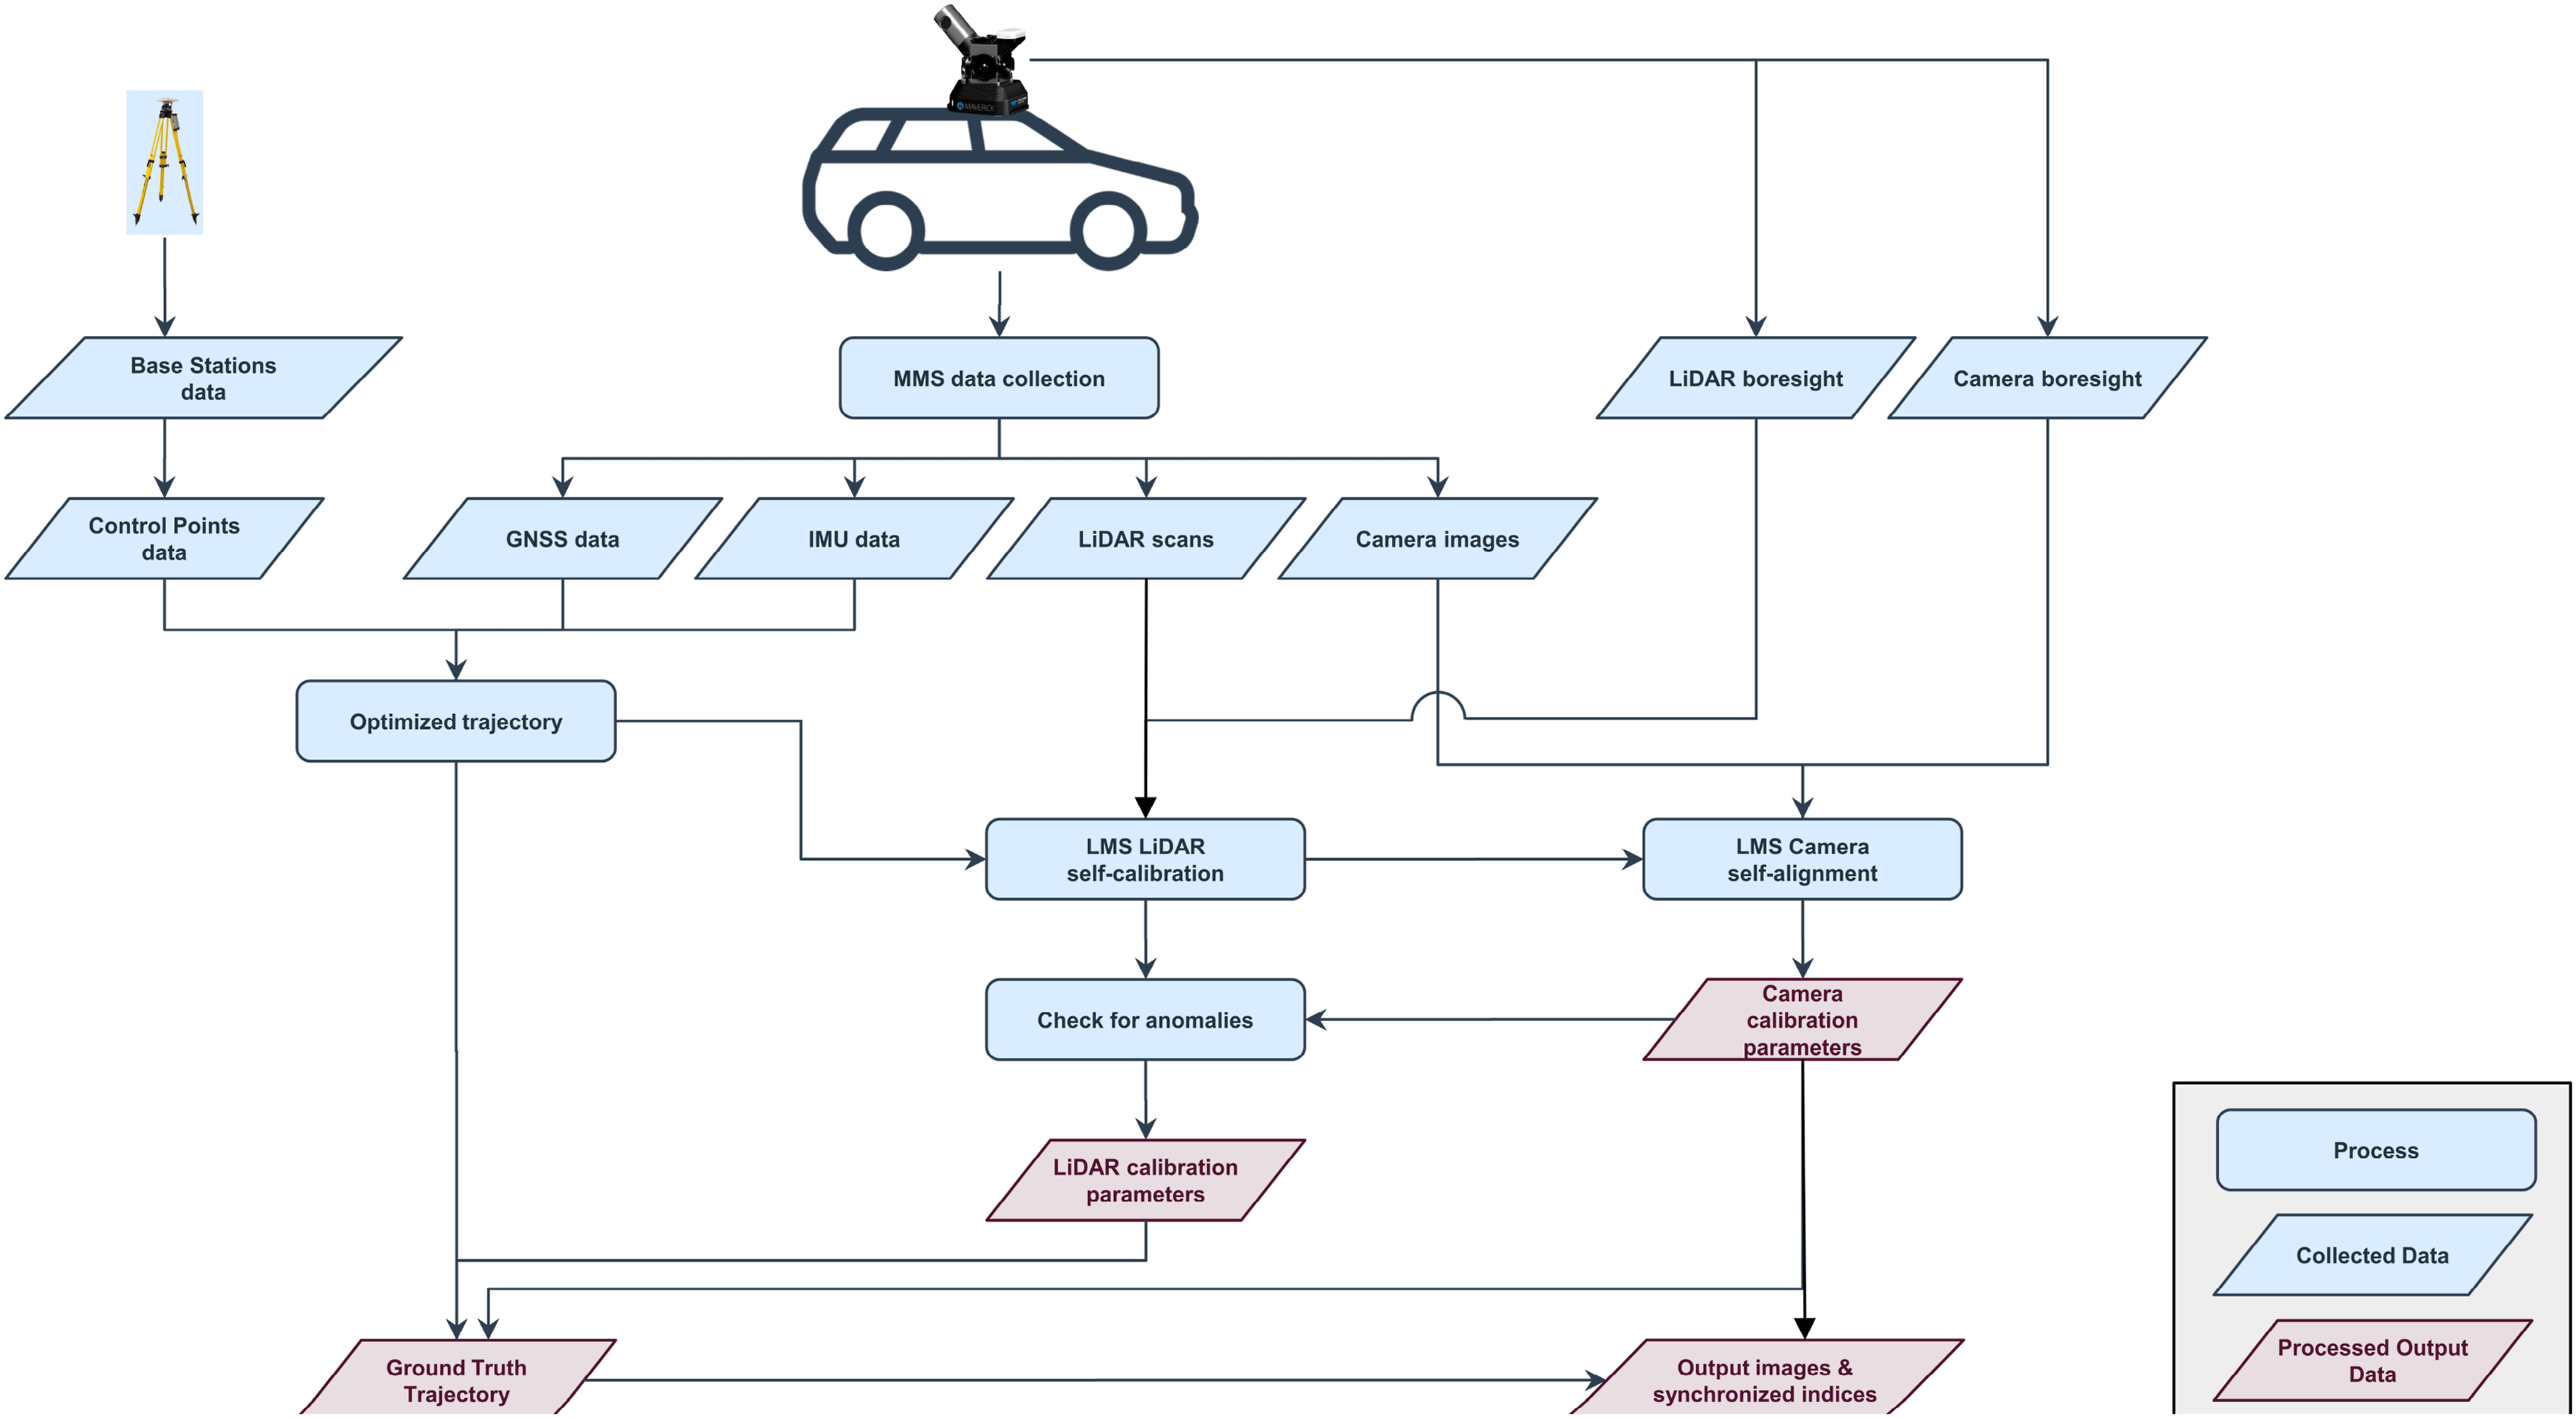
The workflow for data acquisition and processing involves the collection of raw data, including camera images, LiDAR scans, GNSS and IMU data, by the Maverick MMS. Base stations are used to correct the GPS/IMU data through RTK positioning, improving the accuracy of the IMU simultaneously. The optimized GPS/IMU trajectory and initial LiDAR boresight value are then used to perform LiDAR self-calibration with advanced least-squares algorithms. This enables reliable and repeatable calibration parameters, which are used for camera self-calibration. A photogrammetric bundle block adjustment using GNSS and INS position and orientation information is applied for camera self-calibration, and automated tie-point measurement is used to estimate corrections for interior orientation, boresight parameters and trajectory position. This process yields accurate camera interior and exterior orientation parameters, which are then used for anomalies checking by comparing with ground control before and after calibration. Finally, the corrected LiDAR and camera calibration parameters, optimized ground truth trajectory and synchronized indices are processed to generate output data.
4.2. Calibration
Calibration is a crucial step in the utilization of the Maverick MMS system, ensuring accurate sensor integration. The calibration of the Maverick MMS is conducted using professional LMS software by applying base stations and control points. The world coordinates system, denoted as w is based on the geodetic reference frame WGS84, providing a standardized global reference. Additionally, the vehicle coordinate system, known as the body frame b, is utilized for local positioning and orientation. Within the Maverick MMS, the frames denoted as i, l, and c correspond to the IMU, LiDAR, and camera. It is worth noting that all sensors undergo meticulous calibration using external parameters. These calibrations ensure that the X-Y-Z axes align correctly, with the X-axis pointing forward, the Y-axis pointing right, and the Z-axis pointing downward. This alignment enables accurate sensor fusion and precise mapping capabilities.
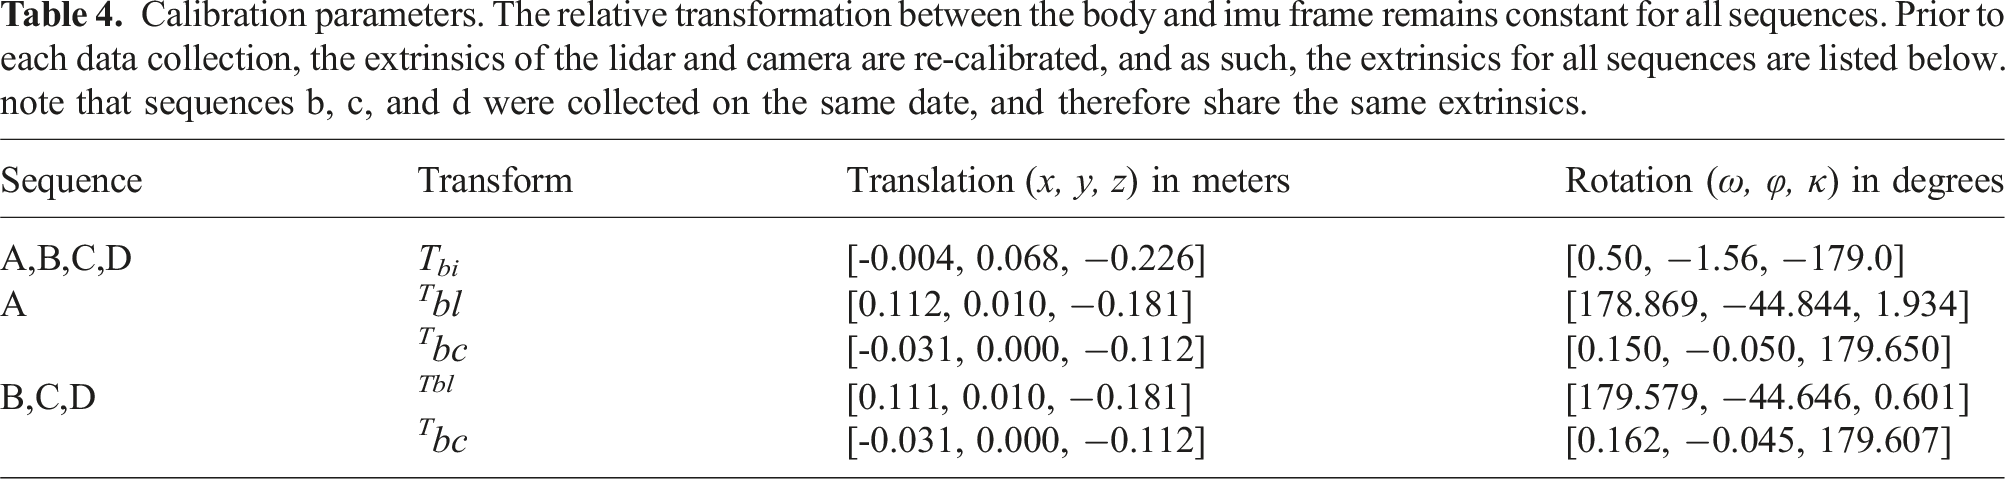
Calibration parameters. The relative transformation between the body and imu frame remains constant for all sequences. Prior to each data collection, the extrinsics of the lidar and camera are re-calibrated, and as such, the extrinsics for all sequences are listed below. note that sequences b, c, and d were collected on the same date, and therefore share the same extrinsics.
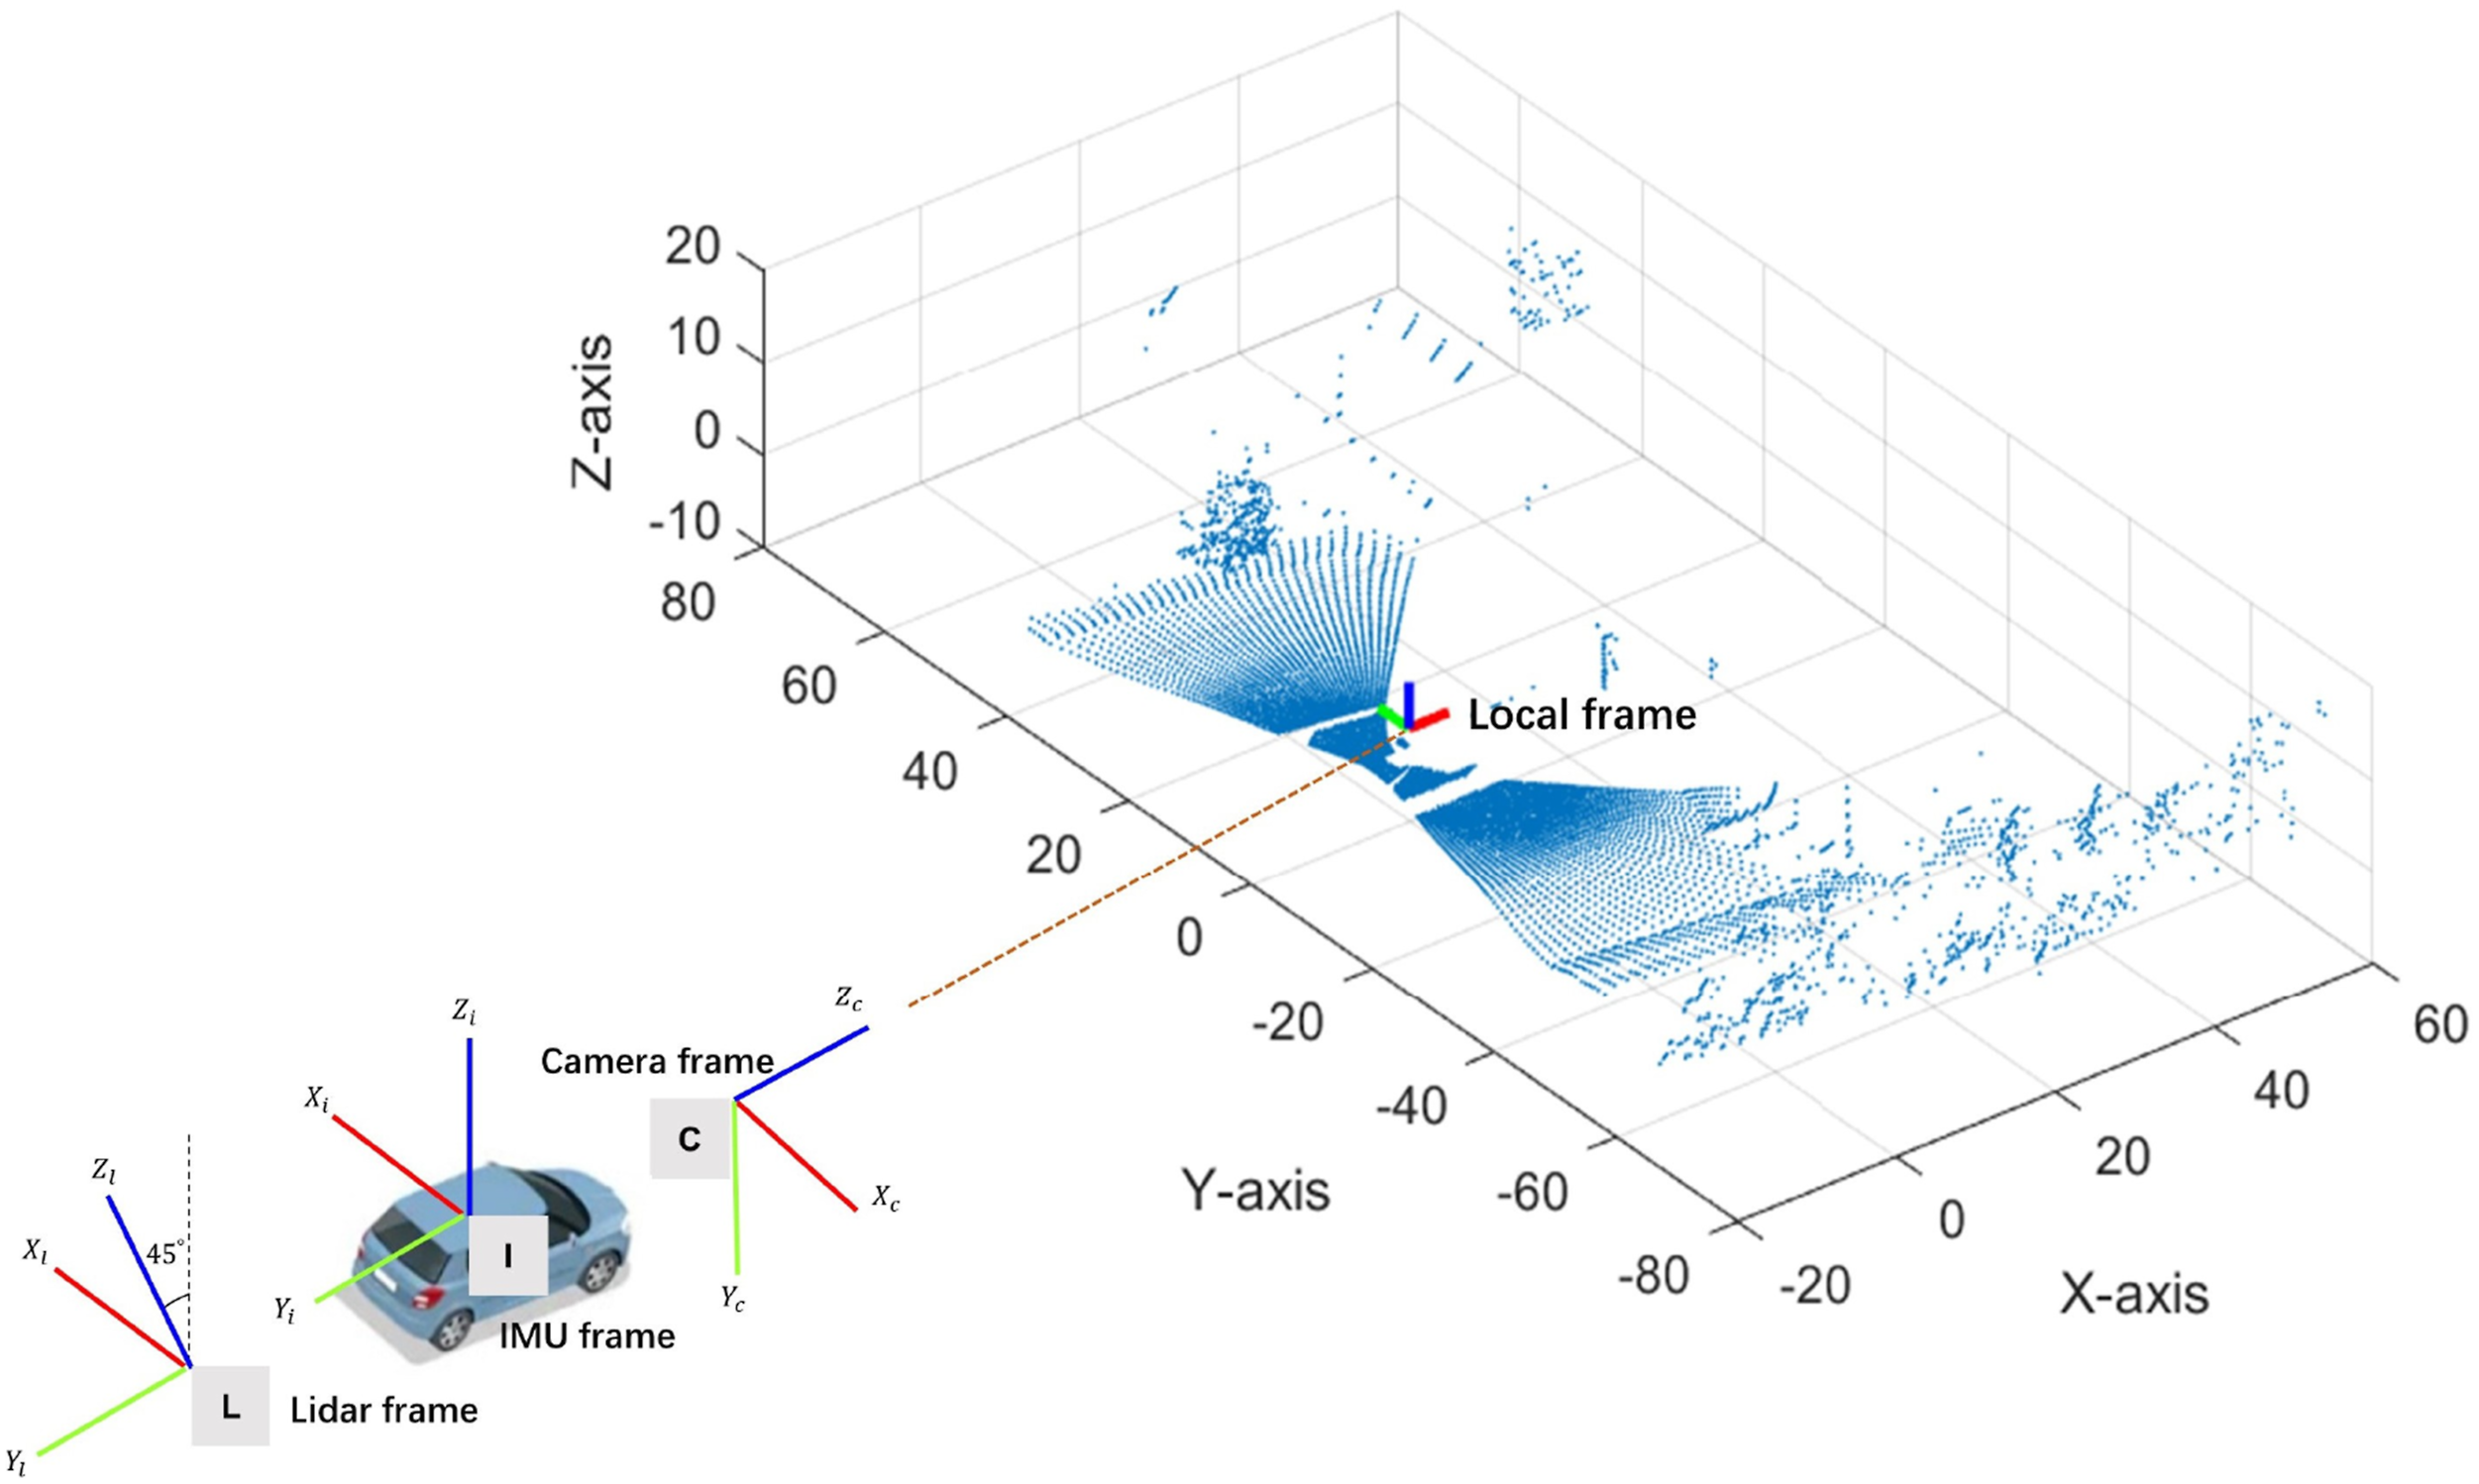
Schematic diagram of the relative positions of LiDAR, IMU and camera with respect to the local frame.
4.2.1. IMU calibration
In the tightly coupled NovAtel SPAN on the OEM6 system, the IMU undergoes an initial calibration process. To determine the lever arm offset between the IMU and the GPS antenna, as well as the body to IMU rotation, the base station coordinates of the trajectory are utilized. During trajectory processing, the output is set to the NAD83 (North American Datum of 1983) processing datum in the selected processing frame. This ensures precise alignment and compatibility between the IMU and GPS data. The calibration process in the GPS/IMU system begins with the utilization of initial value of the offset between IMU and GPS antenna. Next, the self-calibration engine is employed to control the calibration of the IMU-to-antenna lever arm. The calibration process continues for a duration of 600 seconds or until the standard deviation of the estimated lever arm values falls below 0.05 m. This convergence criterion ensures that the lever arm calibration reaches an acceptable level of accuracy and stability.
4.2.2. LiDAR calibration
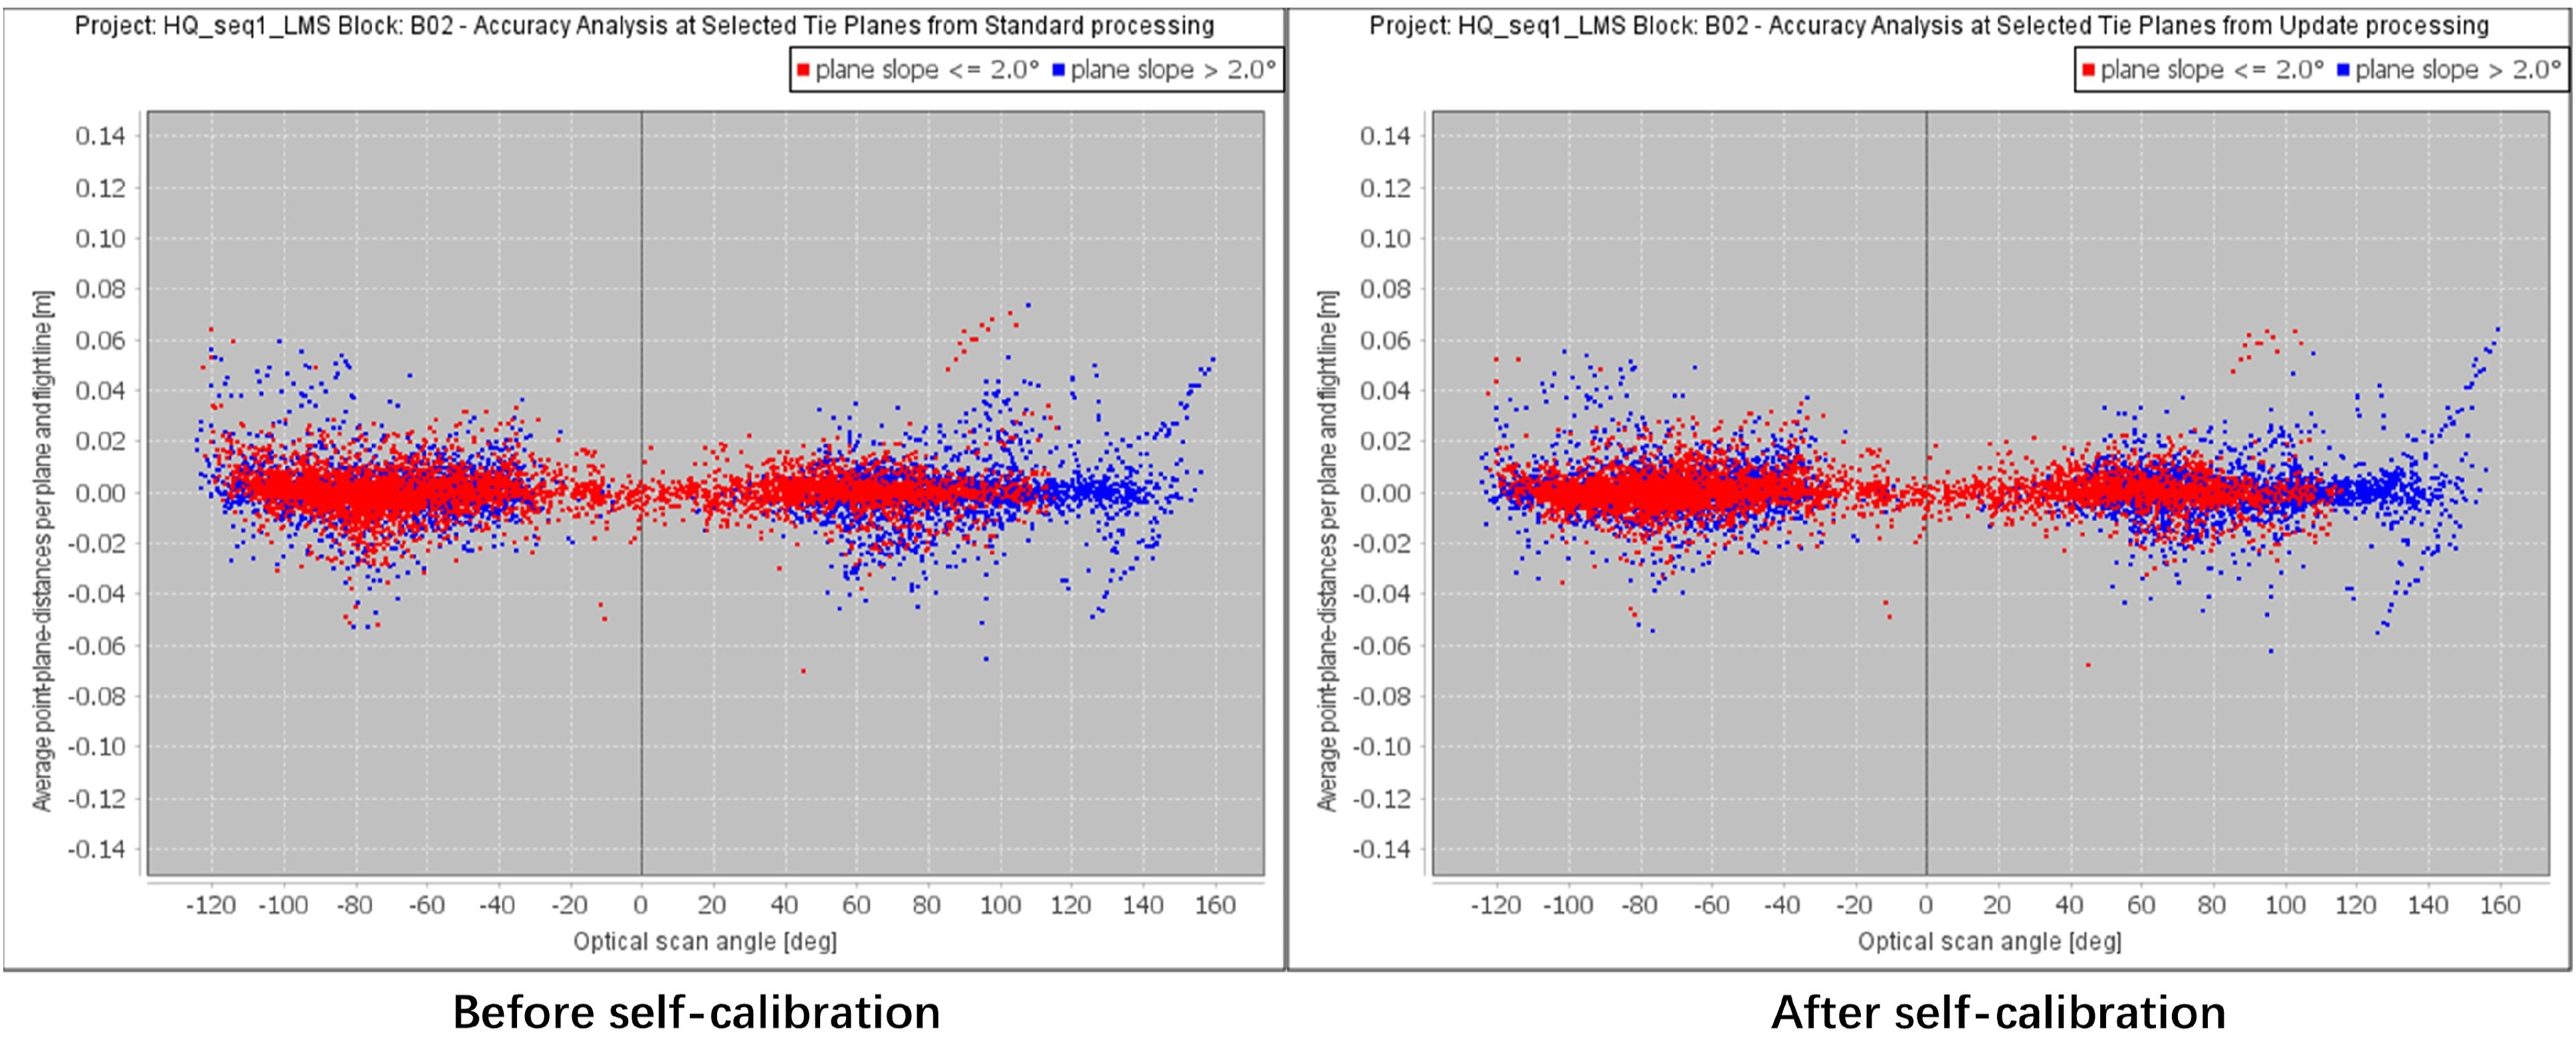
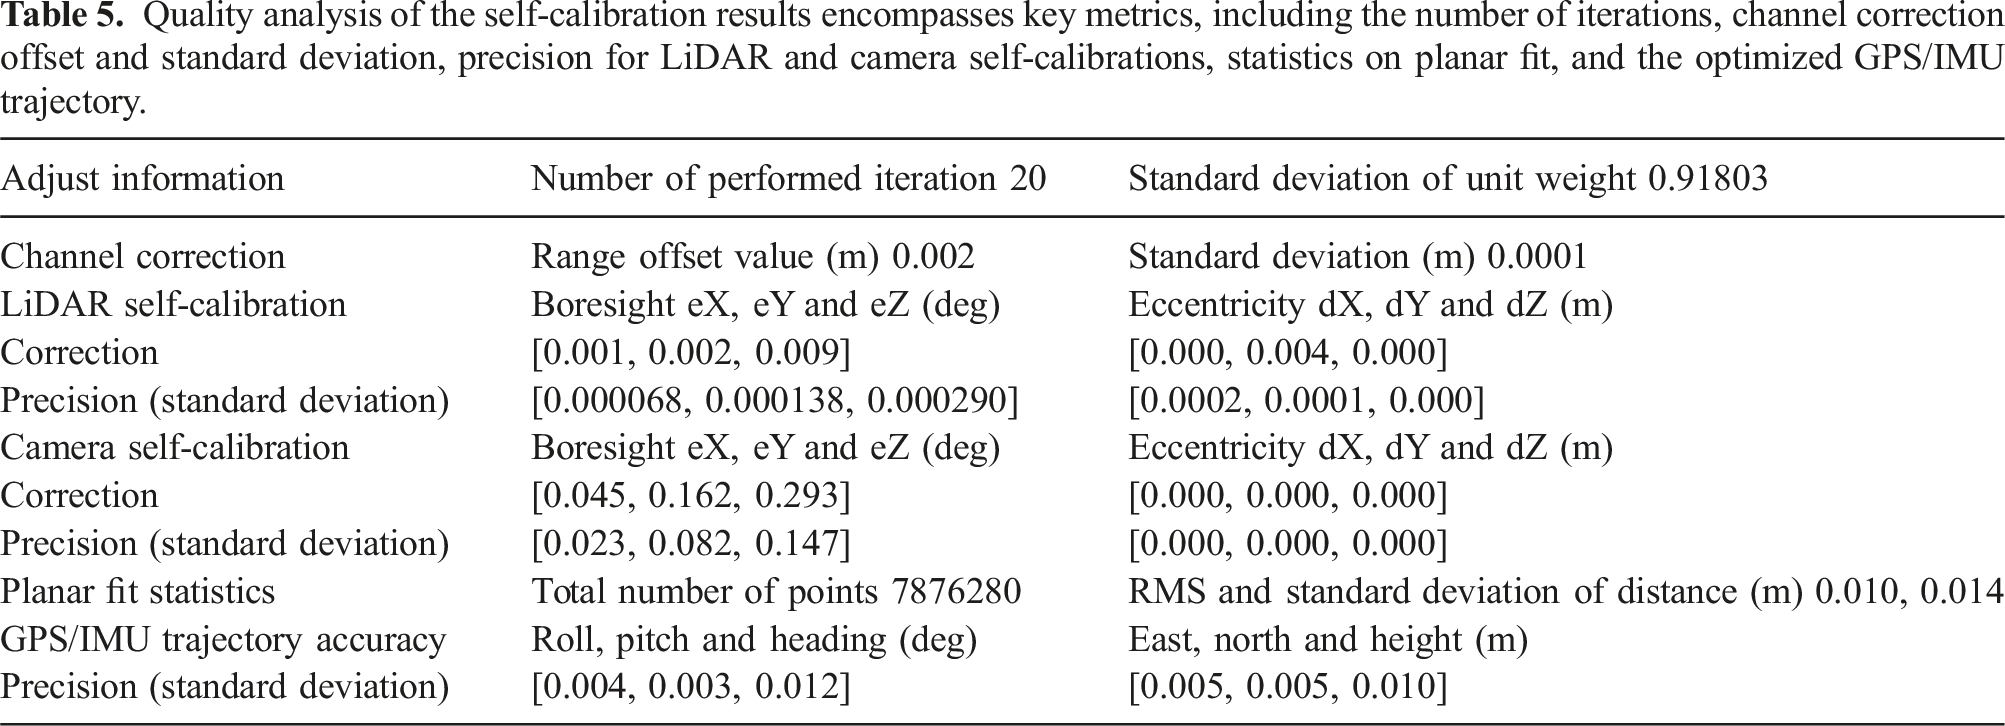
To accurately determine the LiDAR’s position relative to the body frame, a selection of control points on the wall and ground is performed, as depicted in Figure 4. For adding control sites, the reference frame is NAD83 and UTM zone 17N. To ensure precise LiDAR boresight calibration, optimal GPS conditions and sufficient planar surface geometry, both horizontal and vertical, are essential. Additionally, capturing opposing passes enables scanning of objects from different angles and relative positions. Firstly, the LiDAR boresight adjustment is conducted during the self-calibration process with control points. This adjustment involves treating the offsets in x-y-z directions in position corrections as free unknowns and the drifts and accelerations in X-Y-Z directions as constraint unknowns. The adjustment encompasses time corrections, channel corrections, boresight corrections, position corrections, and orientation corrections. To refine the boresight results, the adjustment process is repeated until no estimated corrections to the boresight parameters exceed 0.009° for the angles and 0.009 m for the lever-arms in two consecutive runs. Subsequently, to solve for the sensor calibration parameters while keeping the boresight angles fixed, a LiDAR sensor calibration is performed. The quality analysis of the self-calibration results are shown in Table 5. Upon completion of the LiDAR sensor calibration, the final calibration.lcp file is generated. A noise level check procedure is then carried out, and planar fit statistics with respect to the standard deviation values are reported to assess calibration accuracy. Figure 5 displays the planar fit statistics before and after self-calibration. The mission data utilized for calibration comprises short and long loops executed in opposing directions. As illustrated in the right figure, the calibration process involves the use of a checkerboard target to detect the control points. The control points are denoted by red triangles, while the blue lines represent the LiDAR surveyed lines and the green lines display the camera lines. The planar fit statistics results for sequence A, which highlights the absolute accuracy of data collected by the LiDAR and camera systems. The separation between individual control points and the LiDAR data is calculated before and after self-calibration, providing a clear visualization of the improvement in accuracy.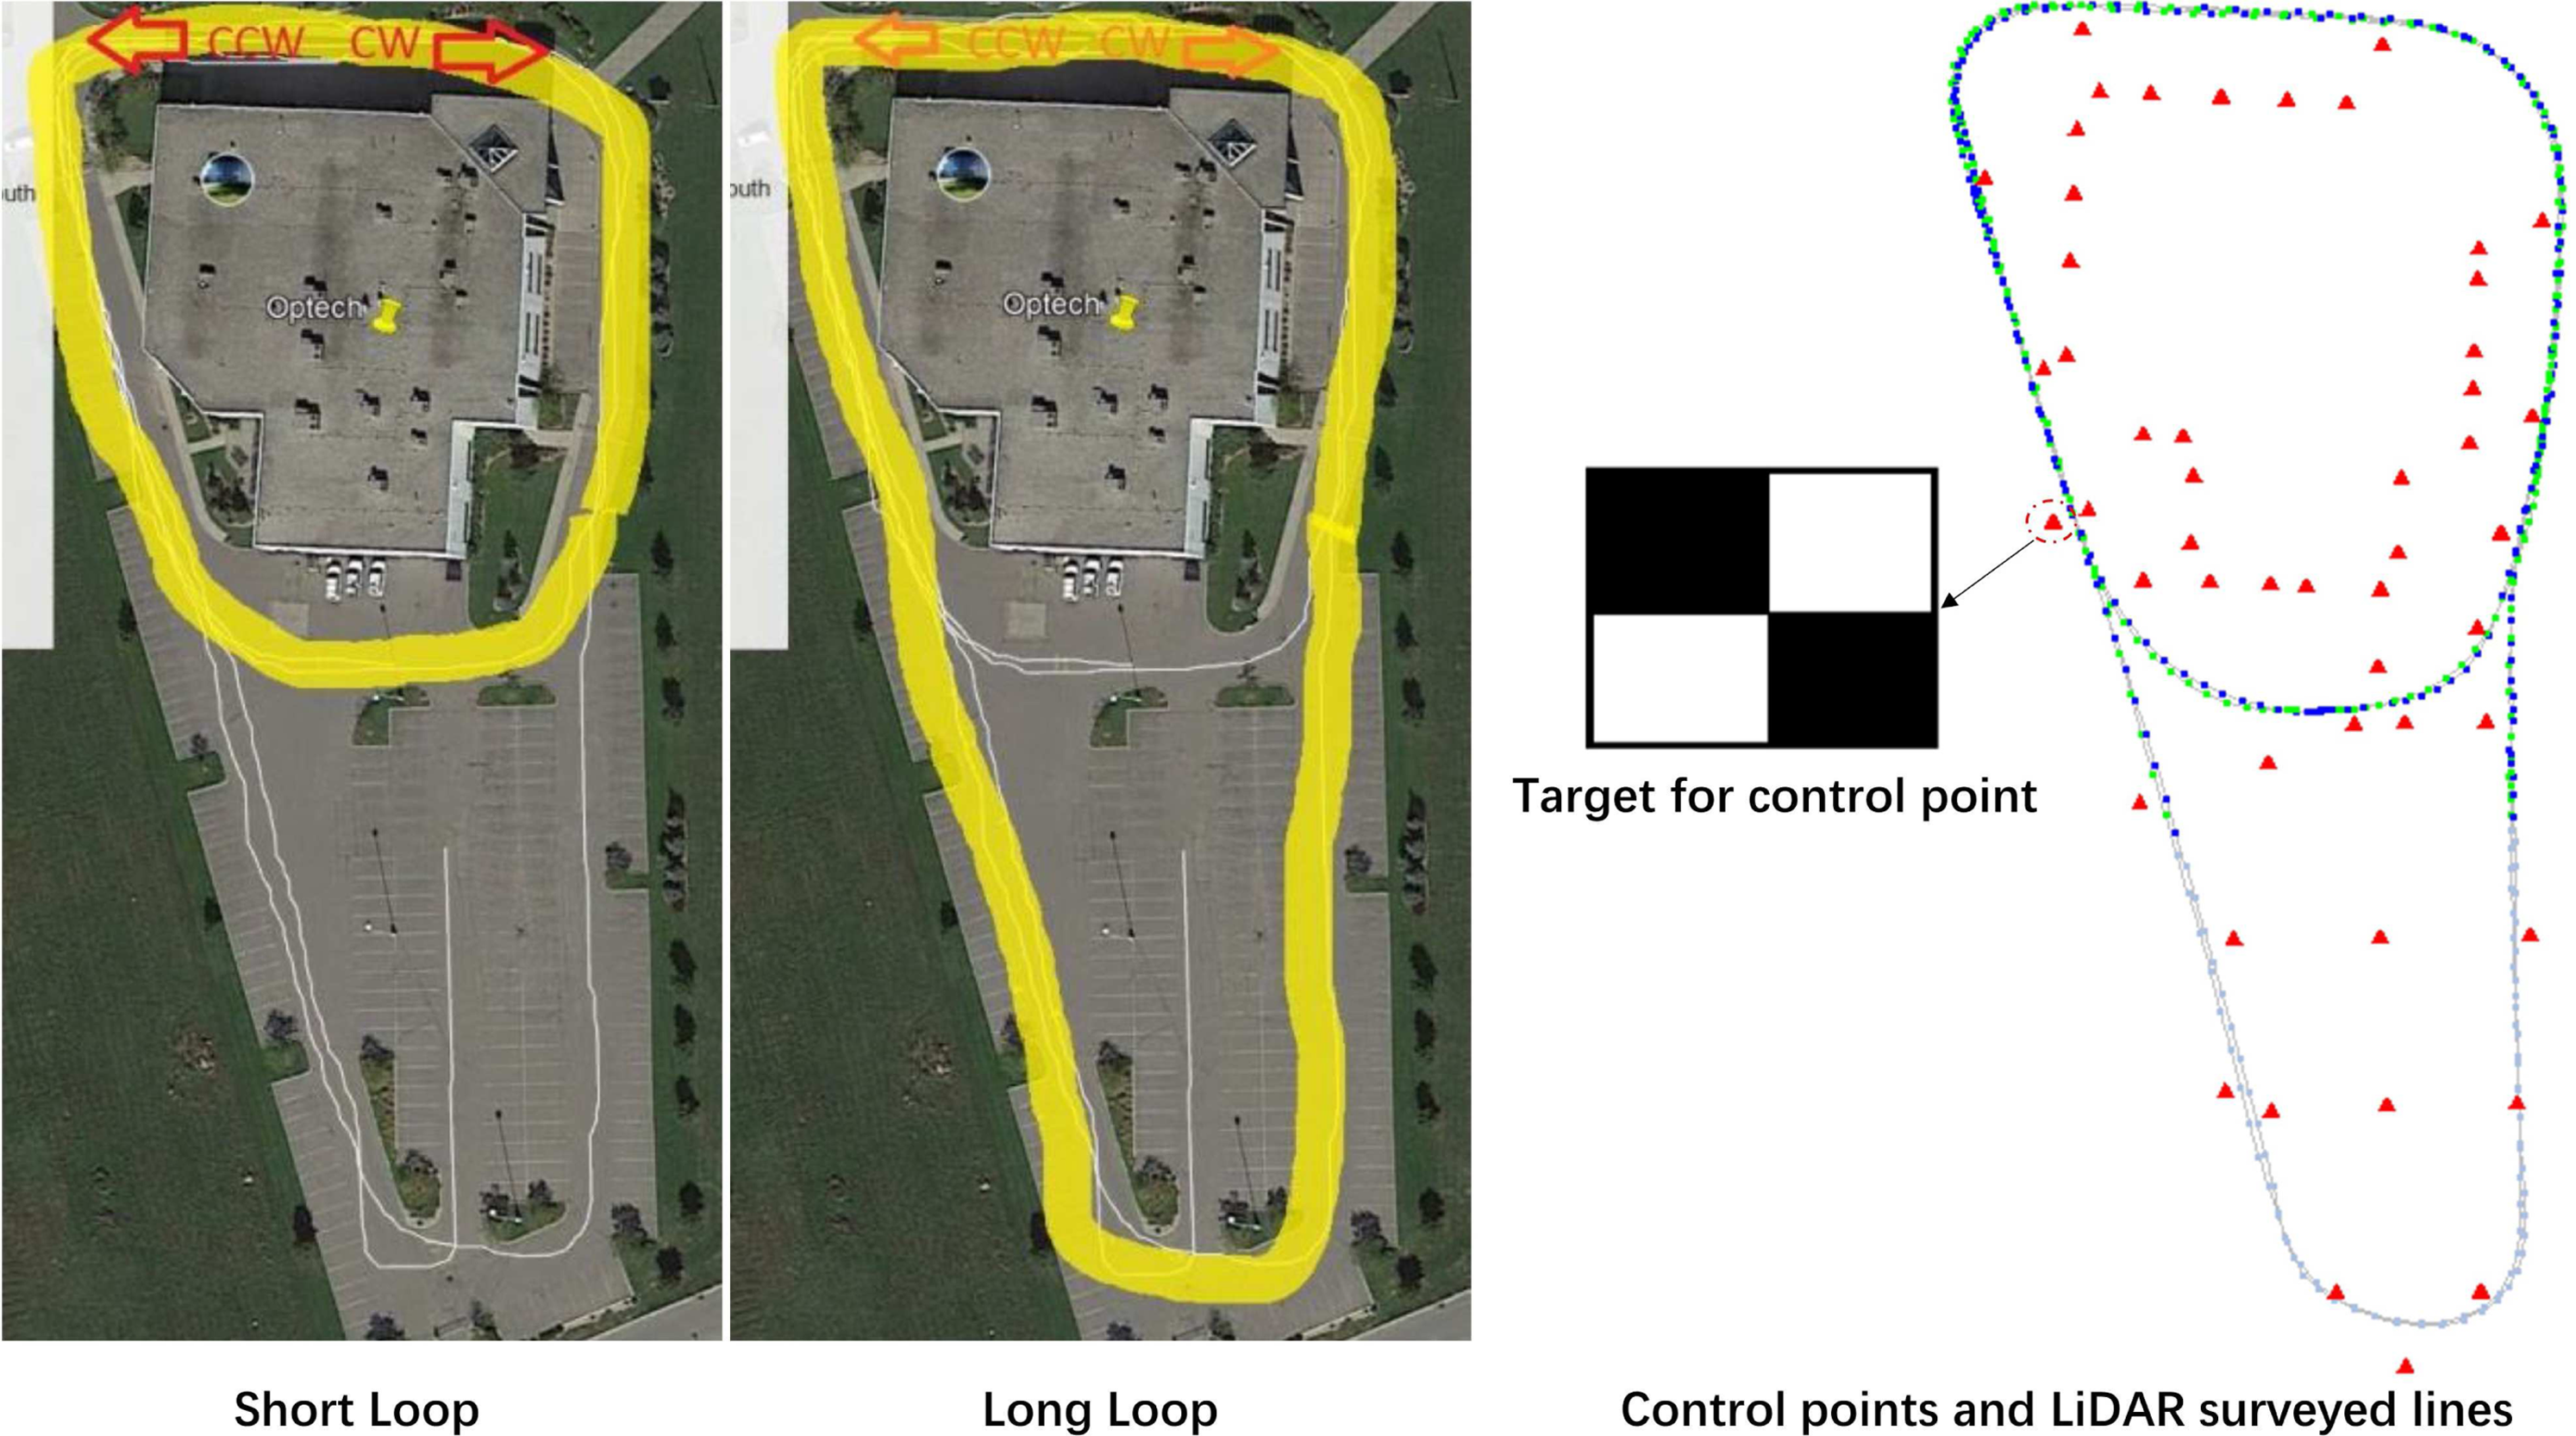
4.3. Panoramic camera calibration
Quality analysis of the self-calibration results encompasses key metrics, including the number of iterations, channel correction offset and standard deviation, precision for LiDAR and camera self-calibrations, statistics on planar fit, and the optimized GPS/IMU trajectory.
4.4. Synchronization
4.4.1. Trajectory refinement
The ground truth trajectory is obtained by performing post-processing techniques to refine the GNSS trajectory. Prior to trajectory refinement, the trajectory file and its corresponding precision file are readily available. Furthermore, the LiDAR and camera systems are calibrated to ensure accurate data acquisition. During the refinement process, painted control points, which can be precisely identified and measured in the LiDAR intensity data, are carefully selected. The LiDAR surveyed lines are then chosen, while the camera lines are automatically synchronized with the LiDAR lines. Next, the images captured by the camera system are processed, with an image mask applied to exclude certain areas, such as those depicting the survey vehicle, from influencing the colorization of the point cloud. The centers of the control points in the LiDAR point cloud are measured, ensuring that they are unobstructed and contain sufficient laser points for accurate measurements. Once all the control points have been measured, the desired survey lines are selected for further processing. Given that the instrument used for the sample data is already calibrated, the channel corrections and boresight corrections remain fixed in the correction settings. The position offsets are set as “free unknown,” while the drift and accuracy corrections are set as “constrain unknown.” The resulting optimized trajectory serves as the ground truth, representing the refined and accurate trajectory of the system. For a visual depiction of this process, please refer to Figure 2.
4.4.2. Time synchronization
In the Maverick MMS, the GPS/IMU system operates at a high frequency of 125 Hz, providing precise timing information. To ensure synchronization, GPS timestamps are used as a reference throughout the trajectory refinement process. By refining the trajectory, we generate ground truth data for all image frames, effectively synchronizing the GPS/IMU system with the panoramic camera. Given that the LiDAR and the panoramic camera operate on different time scales, with images captured at an average rate of 7.5 frames per second and LiDAR scans acquired at a spinning rate of 15 revolutions per second, careful synchronization is required. We achieve this synchronization by aligning the LiDAR data with the GPS/IMU system as part of the trajectory refinement process. The timestamps are recorded using GPS time for accurate temporal alignment. To precisely synchronize the laser scans and panoramic images, we employ an interpolation method to determine the closest timestamp of each laser scan relative to the corresponding image. This interpolation technique ensures that the LiDAR data and panoramic images are temporally aligned, facilitating accurate sensor fusion and subsequent data analysis.
4.5. Translation
Considering the interdependence between certain SLAM methods discussed in Experimental Results and the projection of LiDAR point clouds onto corresponding panoramic images, this section elucidates the essential steps involved in this process. In the next section, we elaborate on the mappings between the pixel coordinate space.
4.5.1. Mappings Between 3D Points to Pixels in the Panoramic Image
In order to find correspondences from a pixel in the panoramic image to the camera 3D coordinate system, we use the unit sphere projection and the polar coordinate system as intermediates between them.
4.5.2. 3D - Unit Sphere
Going from the 3D camera coordinate system to the unit sphere for a 3D point, we calculate range r. To obtain the unit vector of the 3D point by projecting it onto the unit sphere: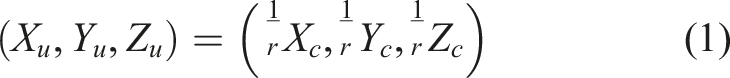
where (X c , Y c , Z c ) points to the mentioned 3D point in the 3D camera coordinate system and (X u , Y u , Z u ) is the projection of the point on the unit sphere.
Reversely, from the unit sphere to the camera 3D coordinate system, getting the range r for the 3D point from other sources is needed. There are two ways to acquire: • Depth from LiDAR point cloud • SLAM-based methods (e.g., Triangulation)
4.5.3. Unit sphere - polar
Mapping from the unit sphere to the polar coordinate system is done by the following equation: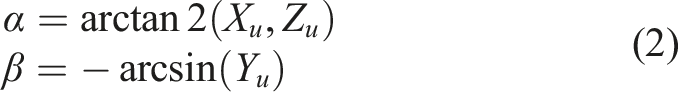
The inverse of equation (2) is calculated by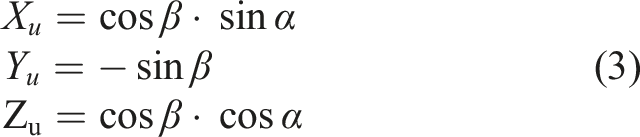
4.5.4. Polar - image
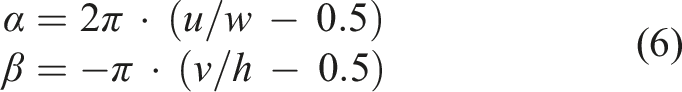
Lastly, mapping from the polar coordinate system to a pixel in the image is shown in the following equation: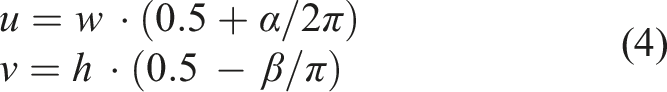
where (u, v) is the presentation of the corresponding pixel in the image. And ρ is the pixel coordinate space where:
We use the extrinsic parameters matrix between the panoramic camera and the LiDAR sensor in the MMS. Then, using Equations (1), (2), and (4), we can project the 3D points on the corresponding panoramic image. Figure 6 presents the visual representation of a captured 3D laser scan, showcasing the collected point cloud data. Additionally, this figure demonstrates the accurate projection of laser points onto the corresponding panoramic image, allowing for a comprehensive fusion of visual and depth information. The 3D laser points (up) and the projection of these laser points onto the corresponding panoramic image (down).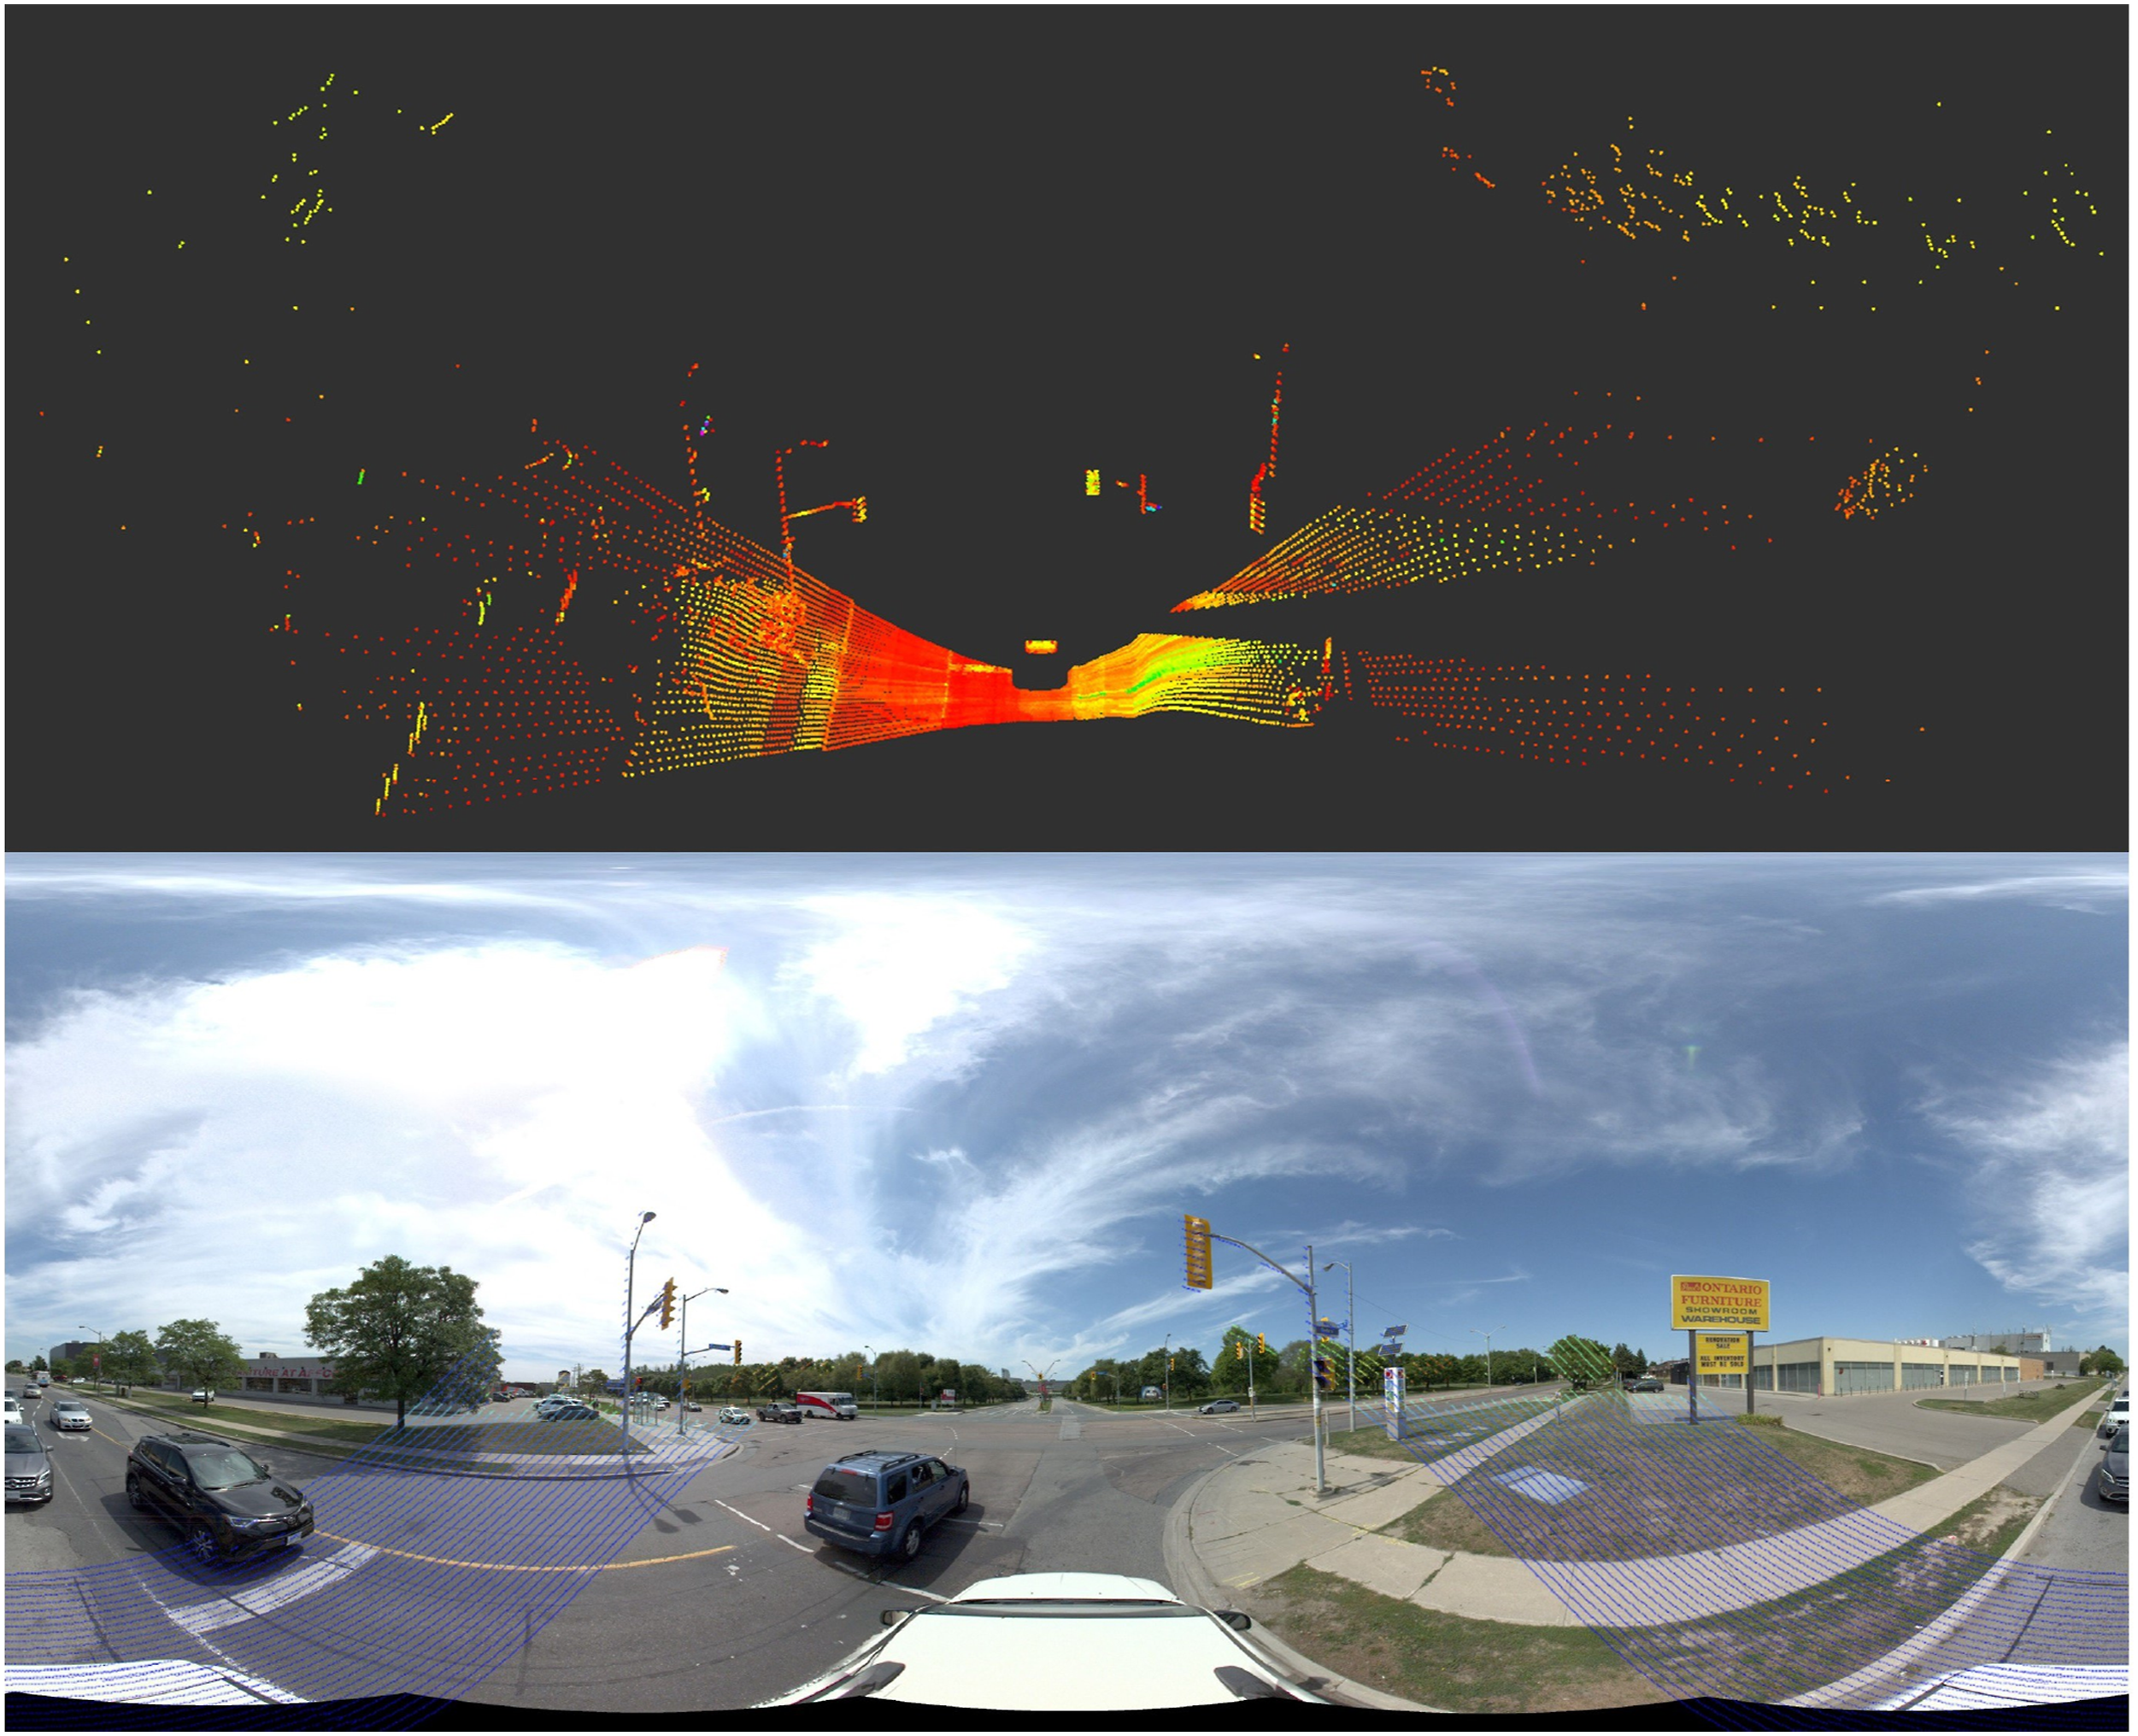
5. Dataset
The dataset is available and can be downloaded from https://ausmlab.github.io/yutomms/.
5.1. Benchmark data
5.1.1. Panoramic images
General information of the YUTO MMS dataset, including its sequence name, number of image, LiDAR and GPS/IMU data. Additionally, the total directory size for downloading is provided.
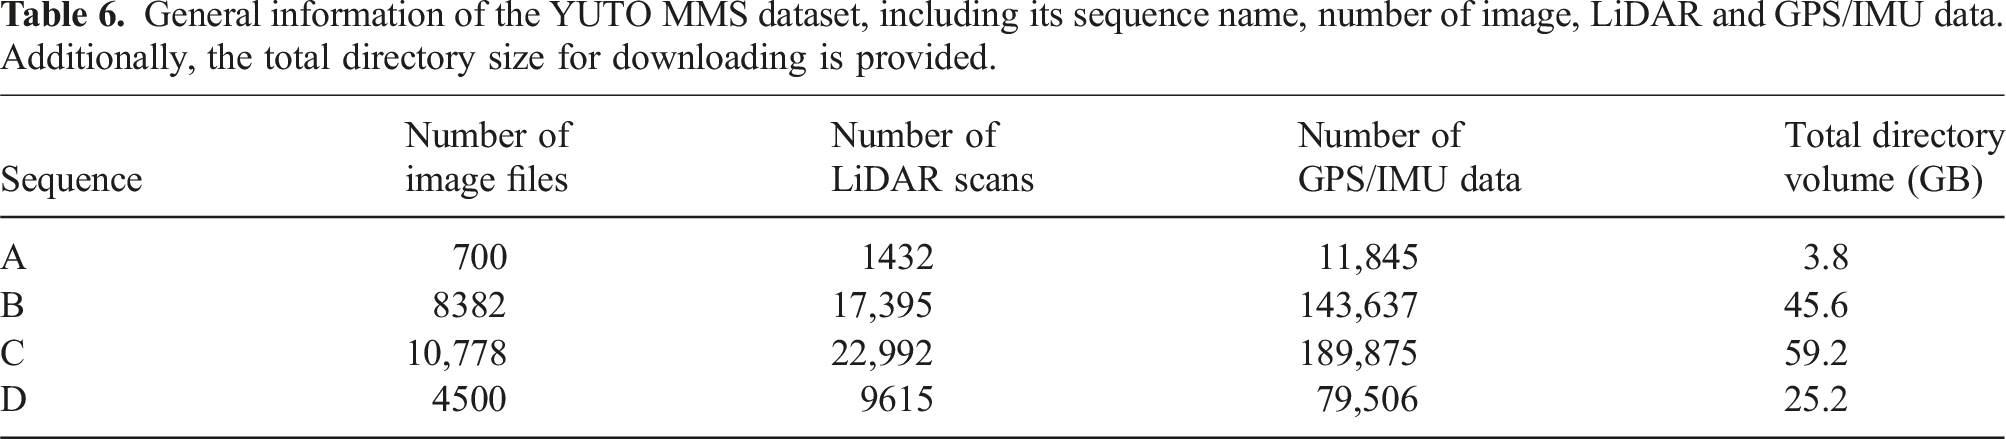
5.1.2. LiDAR
The dataset includes LiDAR point cloud data, with comprehensive details provided in Table 6. The data is provided in the widely adopted .bin file format, which is consistent with the format used in the publicly available KITTI dataset. This ensures compatibility and ease of integration with existing LiDAR processing pipelines and algorithms. Similar to the panoramic images, Sequence A may differ slightly in size compared to the other sequences due to its capture at a different time. However, the essential information pertaining to point cloud data, such as point density and coordinate representations, remains consistent across all sequences.
5.2. Reference data
5.2.1. LiDAR mapping suit
Teledyne Optech’s Lidar Mapping Suite Pro (LMS Pro) serves as a robust data processing solution specifically designed for the Maverick MMS. The software enables comprehensive data processing for the entire project, encompassing trajectory, camera, and LiDAR data. The ground truth trajectories were obtained using it which is capable of producing trajectories with cm-level accuracy. The LMS utilizes high-precision GPS/IMU data and LiDAR points to perform offline bundle adjustment, ensuring precise alignment and synchronization between the ground truth trajectories and the collected data. By leveraging the capabilities of the LMS, we are able to provide ground truth trajectories that serve as a reliable reference for evaluating and validating SLAM and odometry algorithms in our dataset.
5.2.2. Ground Truth
The ground truth data structure for our dataset is saved in .txt format, providing precise and accurate information regarding the vehicle’s pose in a 6-degree-of-freedom (6-DoF) representation. Each line of the file corresponds to a specific image frame captured during the data collection process. The line contains the east, north, height coordinates representing the position of the vehicle, while the omega, phi, and kappa values denote the orientation of the vehicle at that particular point.
5.3. Benchmark data structure
5.3.1. Raw data
Figure 7 shows the details of the directory structure of our dataset. Each sequence has its related data, and also we have included auxiliary files for data transformation, sensor calibration, and performance evaluation of the future SLAM systems running on our dataset. The directory structure of the YUTO MMS dataset, with rounded rectangles representing folders and rectangles representing files. The “Sequence X” folder contains the data for a particular sequence.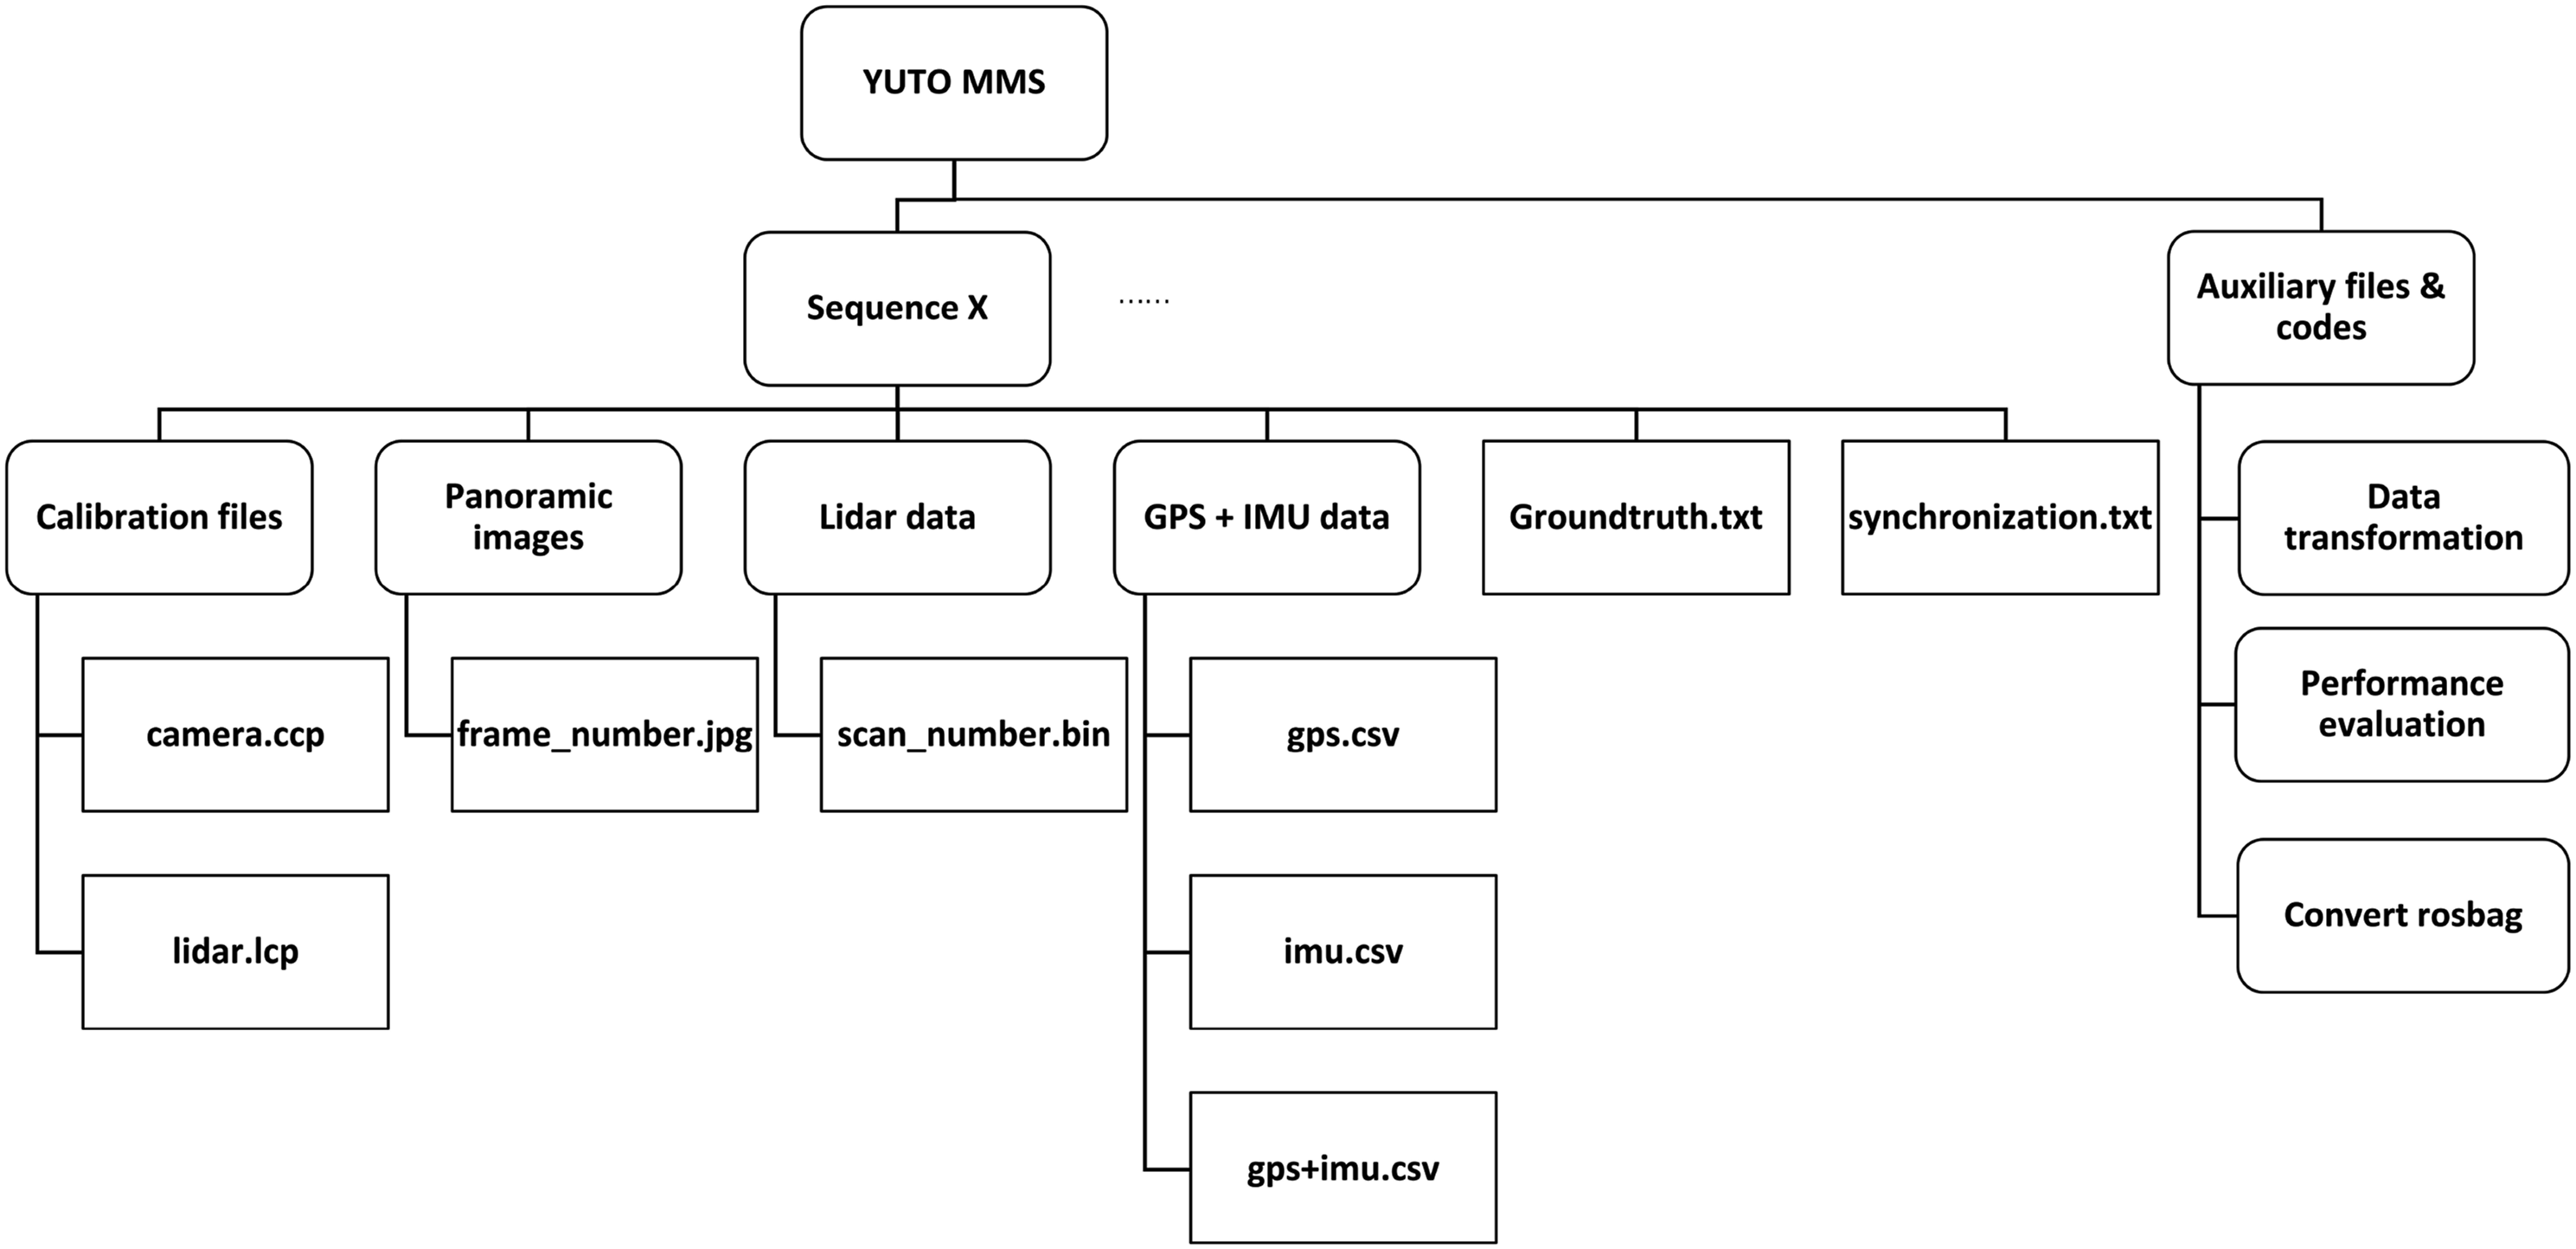
5.3.2. Synchronization data
The synchronization data of the camera and LiDAR is saved in a .txt format, where each line of the file corresponds to a specific image frame and lists the corresponding LiDAR frame.
5.3.3. Calibration data
The IMU calibration parameters of the Maverick MMS remain fixed due to the tight coupling of the GPS and IMU sensors, as illustrated in Table 4. However, for accurate localization, it is necessary to perform recalibration of the panoramic camera and LiDAR prior to each data collection. The camera calibration parameters are saved in a .ccp format, while the LiDAR calibration parameters are stored in a .lcp format.
5.3.4. Transformation data
In addition, we have included the depth map corresponding to each panoramic image. The depth values in the map are derived through the process explained in Section Data Acquisition and Processing where raw ranges obtained from LiDAR points projected onto the panoramic image space. The depth maps are saved in JPG format and share the same dimensions as the panoramic images.
5.3.5. Auxiliary codes (data transformation, sensor calibration, etc)
We have developed MATLAB scripts that facilitate the loading and visualization of panoramic images and LiDAR scans within the MATLAB environment. These scripts enable the re-projection of LiDAR ranges onto the corresponding panoramic images using the calibration parameters. Furthermore, C++ code that generates rosbag format from our dataset is also provided. In order to evaluate the performance of Odometry or SLAM systems, we employed the rpg trajectory evaluation toolbox (Zhang and Scaramuzza 2018).
6. SOTA SLAMs
6.1. Visual SLAM
ORB-SLAM2 (Mur-Artal and Tardo´s 2017) is a widely recognized visual SLAM approach that exploits visual features for the purpose of simultaneous tracking and mapping. It employs the ORB descriptor to extract distinctive visual features within the scene. The keyframe-based methodology of ORB-SLAM2 involves the initial detection of visual features in keyframes, followed by their tracking across subsequent frames. Loop closing, a crucial component of this SLAM system, benefits from the utilization of bags of binary words. Notably, ORB-SLAM2 exhibits real-time performance, with all three modules, tracking, mapping, and loop closing, operating in parallel. Moreover, this SLAM framework is not limited to monocular cameras alone, as it is compatible with both stereo and RGB-D cameras.
6.1.1. Visual-inertial SLAM
VINS-Mono (Qin et al., 2018) is a versatile and robust monocular visual-inertial state estimator that leverages a tightly coupled, nonlinear optimization-based method to achieve precise visual-inertial odometry. By integrating pre-integrated IMU measurements and feature observations, VINS-Mono achieves high-precision estimation. The system incorporates loop detection and loop closure modules, which facilitate efficient re-localization with minimal computational overhead. Moreover, VINS-Mono introduces an online temporal calibration technique (Huai et al., 2015) to enhance sensor fusion performance. This approach jointly optimizes time offset, camera and IMU states, as well as feature locations in a SLAM system.
ROVIO (RObust Visual Inertial Odometry) (Bloesch et al., 2015) is a monocular visual-inertial odometry algorithm that is suitable for use in dynamic handheld experiments and unmanned aerial vehicles (UAVs). ROVIO employs an extended Kalman filter (EKF) to track multilevel patch features and uses pixel intensity errors as innovation terms during the update step. The landmark representation in ROVIO involves a bearing vector and inverse-distance parametrization, which are refined as part of the iterated EKF states, eliminating the need for an initialization procedure. Maplab (Schneider et al., 2018), an open and research-oriented visual-inertial mapping framework, includes ROVIOLI (ROVIO with localization integration), which serves as a mapping and localization frontend based on the ROVIO algorithm.
6.2. RGB-D SLAM
RPV-SLAM (Range-augmented Panoramic Visual SLAM) (Kang et al., 2021) is an innovative RGB-D SLAM that enhances the capabilities of ORB-SLAM2 (Mur-Artal and Tardo´s 2017) and OpenVSLAM (Sumikura et al., 2019) framework by integrating a 360° panoramic camera and sparse LiDAR ranges. This novel approach leverages bi-interpolation to create a dense depth map for a specific region in the image plane, which is then merged with the RGB image to create an RGB-D representation. By incorporating depth information, some map points are directly generated, while others are triangulated based on the proximity of keyframes. The resulting RGB-D mode is subsequently processed by ORB-SLAM2’s tracking, mapping, and loop closing modules.
6.3. LiDAR SLAM
LOAM (Zhang and Singh 2014) proposes an innovative methodology that integrates scan matching techniques with a robust motion estimation framework, enabling real-time odometry estimation and map generation. Leveraging the inherent geometric properties of LiDAR point clouds, specifically exploiting point-to-plane correspondence, the LOAM approach achieves optimized odometry estimation and accurate mapping outcomes. Comprehensive experimental evaluations conducted in diverse environments, encompassing both indoor and outdoor scenarios with varying motion dynamics, demonstrate the exceptional accuracy and real-time performance of LOAM. With its practical implementation and significant contributions to real-time LiDAR-based SLAM, the paper serves as a guiding resource for the advancement of robotic perception and autonomous systems, driving further research and innovation in the field.
6.4. LIDAR-Inertial SLAM
Google’ Cartographer is a LiDAR-centric SLAM system using backpack mapping platform, which achieves real-time mapping and loop closure at a 5 cm resolution. It uses grid map-based representation with flexible resolution and sensor choices. The Cartographer technique is divided into two processes. The first process is called local SLAM which uses a Ceres scan matcher on a small map, known as a submap, to estimate the pose and orientation of the vehicle. The second process is known as global SLAM, which optimizes the pose by utilizing a larger scan matcher on global maps (a global map generated from assembling all submaps).
6.5. Sensor-fusion-based SLAM
The PVL-Cartographer SLAM (Zhang et al., 2023) is a sensor-fusion-based SLAM system specifically designed for the Maverick MMS. This approach effectively integrates multiple sensors, including a panoramic camera, LiDAR, and IMU, within a pose graph framework, resulting in a robust and accurate SLAM solution. The system comprises two key components: the early fusion range-augmented panoramic visual odometry system, RPV, and the middle fusion approach based on pose graph integration. The performance of the PVL-Cartographer surpasses that of camera-centric, camera-inertial, LiDAR-centric, and LiDAR-inertial SLAM systems, even when only a limited number of visual features are augmented with ranges due to the limited overlap between the image and LiDAR points. These findings underscore the superior capabilities of the sensor-fusion-based SLAM system, particularly in challenging outdoor scenarios involving localization and mapping.
6.6. Dynamic SLAM
Dynamic SLAM has been studied for several decades, which is designed to handle environments with moving objects or dynamic elements (Wang et al., 2003). MID-Fusion (Xu et al., 2019) proposed a new multi-instance dynamic RGB-D SLAM system using an object-level octree-based volumetric representation. MID-Fusion achieved robust camera tracking in dynamic environment, while estimate geometric, semantic, and motion properties for arbitrary objects continuously. Kimera (Rosinol et al., 2021) is the first fully automatic method to build novel 3D Dynamic Scene Graph (DSG) from visual-inertial data, which seamlessly captures metric and semantic aspects of a dynamic environment. SuMa++ (Chen et al., 2019) facilitated semantic segmentation of point clouds using laser-based technology in complex and uncertain circumstances. We believe that our YUTO MMS dataset provides real-word scenarios with numerous dynamic objects in the outdoor road environments, which will enhance the proposed dataset’s utility for dynamic SLAM development.
7. Experimental Results
In this section, we will provide the experimental results of the mentioned methods. But first, we describe our evaluation metrics.
7.1. Evaluation metrics
7.1.1. Absolute Trajectory Error
Absolute Trajectory Error (ATE) is an evaluation metric in SLAM that quantifies the positional discrepancy between the estimated trajectory and ground truth. It measures the accuracy of the estimated trajectory by computing the Euclidean distance or RMSE between corresponding pose points. ATE provides a global assessment of localization performance, enabling researchers to compare SLAM algorithms and drive advancements in accurate trajectory estimation.
7.1.2. Relative Trajectory Error
Relative Trajectory Error (RTE) in SLAM quantifies the positional deviation between estimated and ground truth trajectories at intervals of 100, 200, …, and 800 m. It measures the Euclidean distance or RMSE between corresponding pose points to evaluate the accuracy of relative motion estimation. RTE provides valuable insights into the performance of SLAM algorithms in maintaining accurate inter-frame motion estimation at different distances, aiding in the assessment and improvement of localization and mapping systems.
7.1.3. Relative Rotation Error
Relative Rotation Error (RRE) in SLAM measures the angular deviation between estimated and ground truth relative rotations, often expressed in degrees per meter. It quantifies the rotational accuracy of the system, enabling the evaluation of rotation estimation performance at varying scales. By considering the rotational error relative to the translation distance, RRE provides valuable information on the consistency and precision of rotation estimates in SLAM algorithms.
7.2. Quantitative evaluation
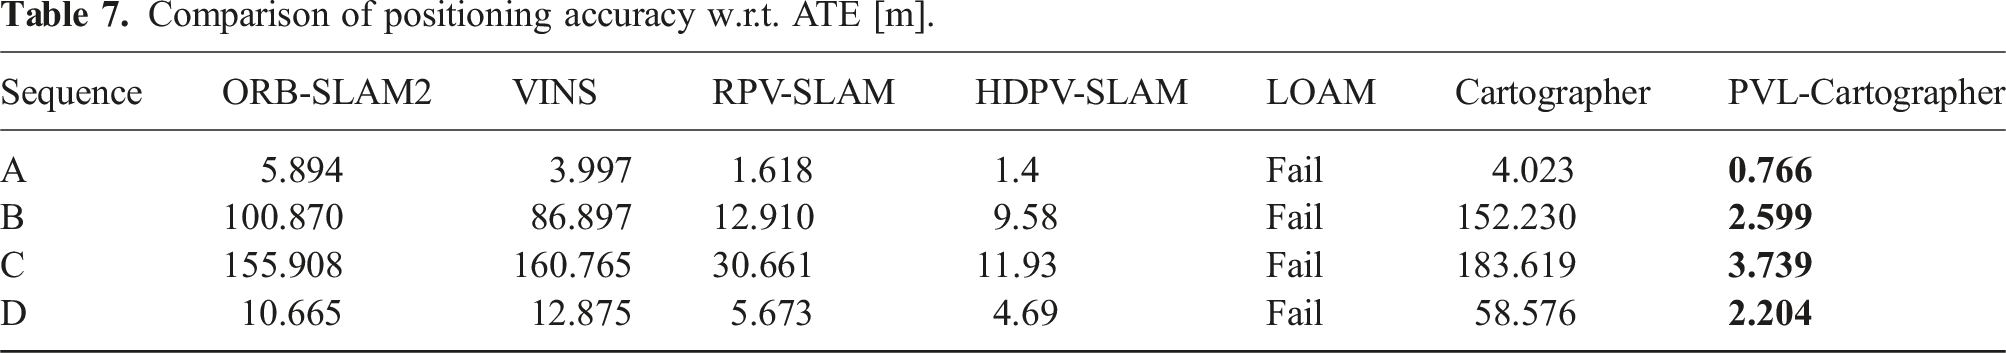
Comparison of positioning accuracy w.r.t. ATE [m].
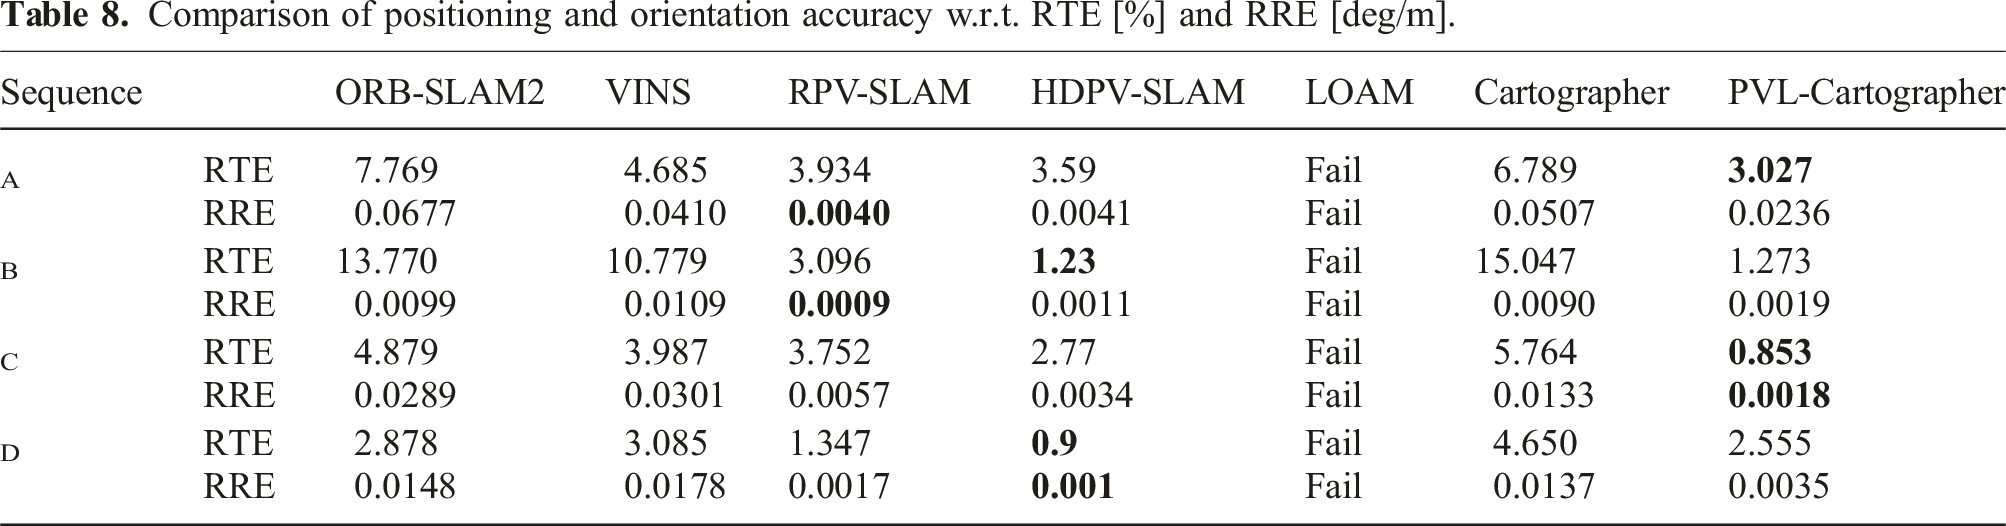
Comparison of positioning and orientation accuracy w.r.t. RTE [%] and RRE [deg/m].
7.3. Qualitative evaluation
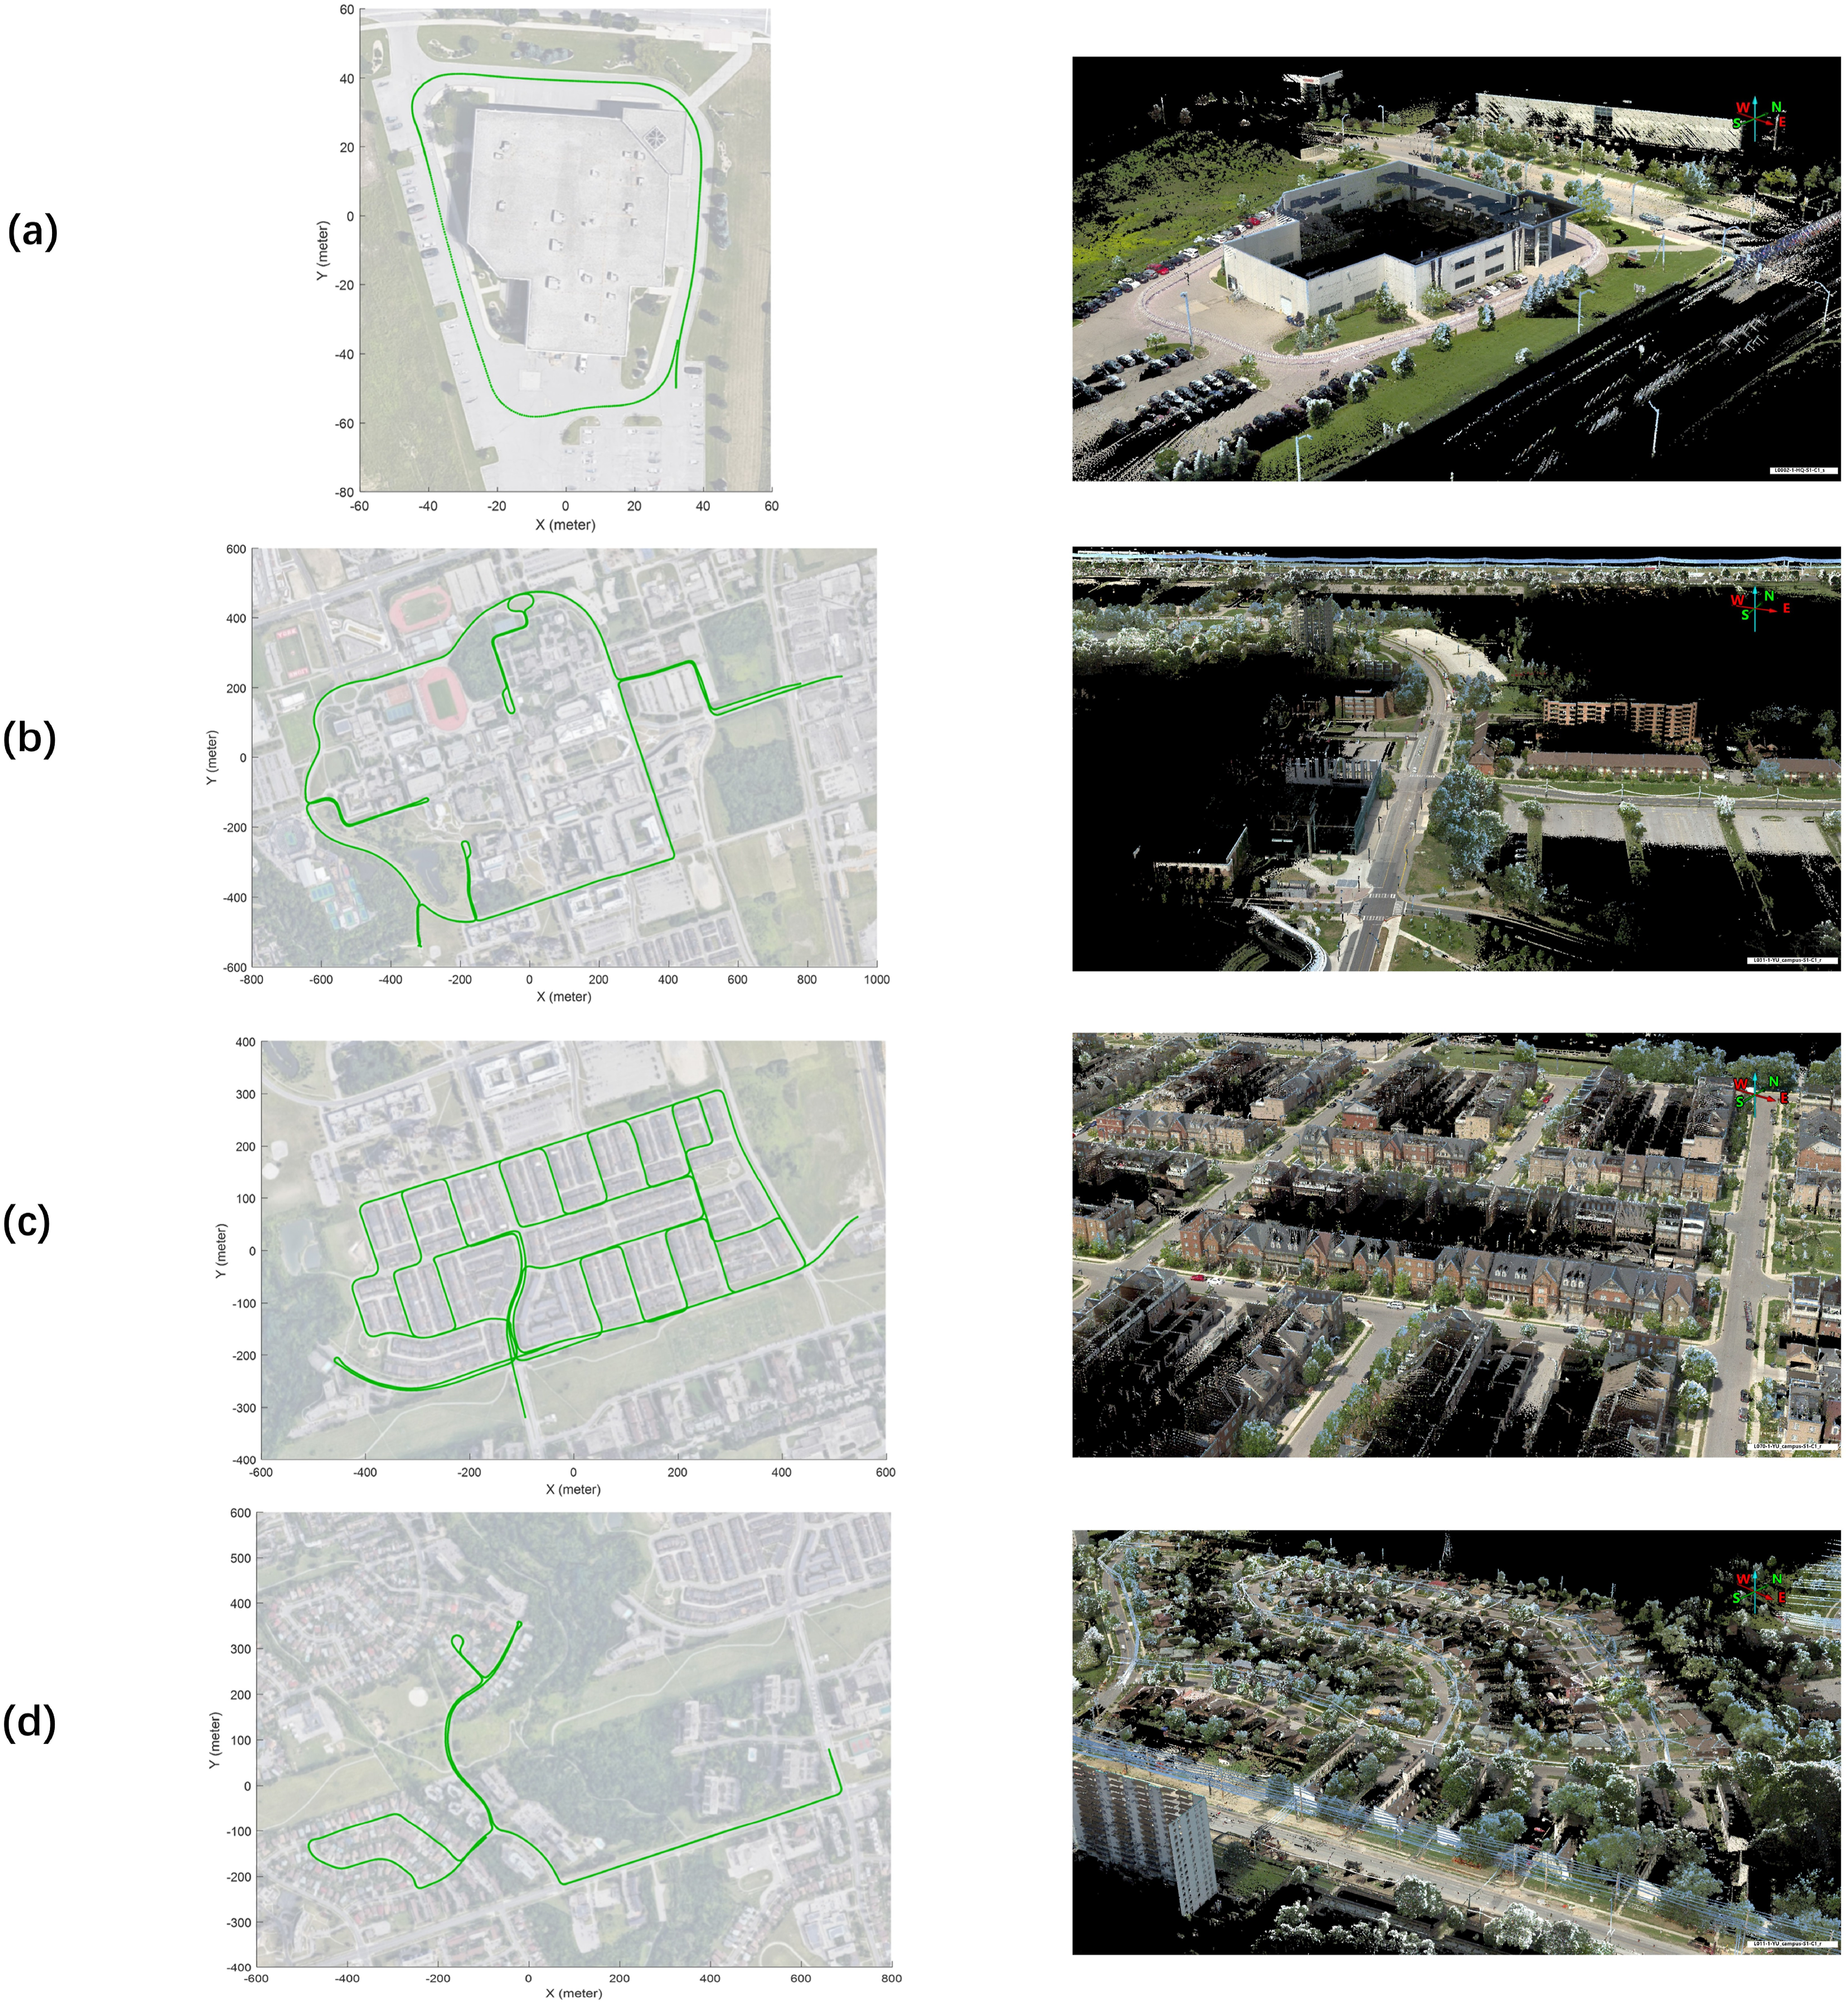
Figure 8 displays the trajectories generated by SOTA SLAMs. Furthermore, the YUTO MMS dataset has proven to be a valuable resource not only for odometry and SLAM research but also for a wide range of applications in depth estimation, mapping, and 3D reconstruction. The panoramic camera has emerged as a powerful tool with distinct advantages for mapping applications. Its wide field of view enables the capture of a comprehensive and continuous visual representation of the surrounding environment. This panoramic imagery provides crucial contextual information, allowing for a more accurate and detailed mapping process. Figure 9 showcases the remarkable color textured point cloud generated from our YUTO MMS data, which provides a detailed representation of the urban scenarios. This high-quality dataset holds great potential for advancing various fields, such as robotics, computer vision, and geospatial analysis. Researchers can leverage this dataset to explore novel algorithms, validate existing methodologies, and drive innovation in the realm of visual perception and spatial understanding. The availability of such comprehensive and well-curated datasets like YUTO MMS contributes significantly to the advancement of scientific knowledge and the development of robust and reliable intelligent systems. Trajectory comparisons are presented for each sequence. It’s important to note that in ( GPS/IMU trajectories overlaid on satellite images and the corresponding color textured point cloud (LAS data) of YUTO MMS dataset in York University campus and Teledyne Optech headquarters.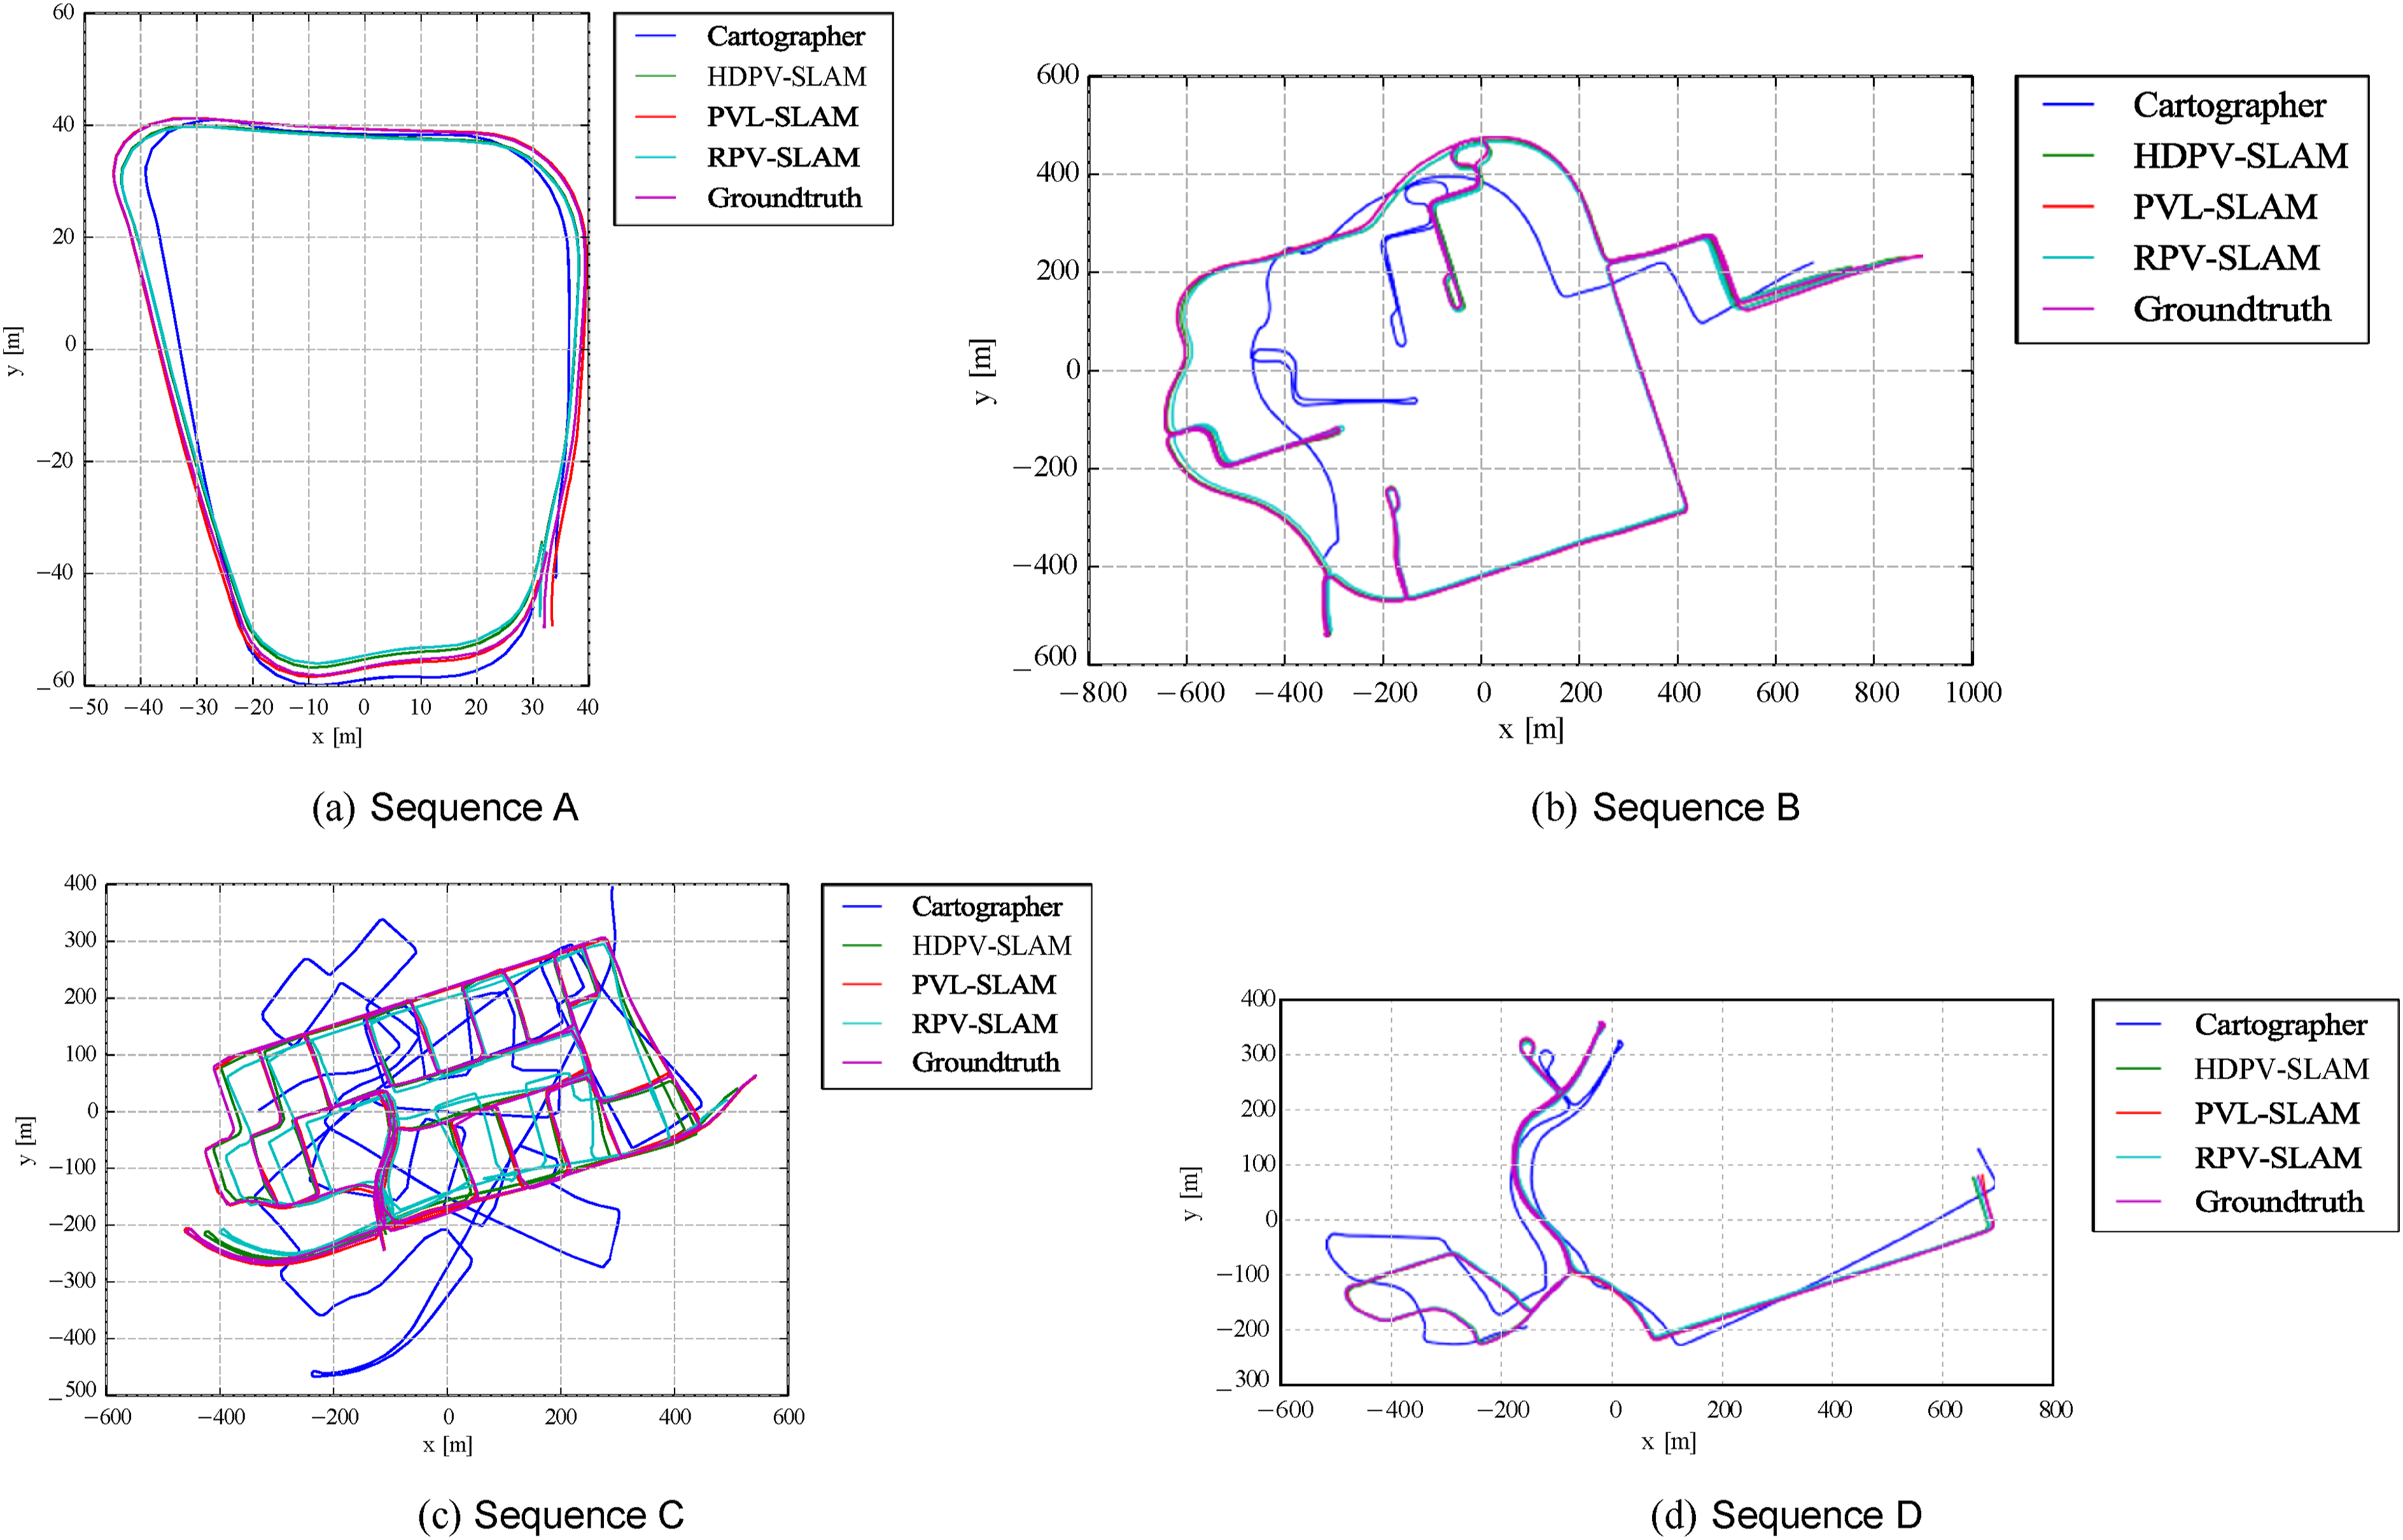
8. Discussion
Our findings highlight the strengths of different SLAM systems in specific aspects of estimation. Camera-centric SLAM systems, RPV-SLAM and HDPV-SLAM, demonstrate superior performance in orientation estimation. On the other hand, LiDAR-centric systems exhibit better accuracy in position estimation. Among the collected data, Sequence C presents significant challenges due to its long distance and intricate loop structures. Nonetheless, the sensor-fusion-based SLAM system, PVL-Cartographer, outperforms other methods in terms of ATE, RTE, and RRE. This achievement is attributed to the effective loop closure and pose graph optimization modules, which minimize errors through map optimization when multiple loops are detected. Despite the challenges posed by this scenario, the PVL-Cartographer system showcases robustness and exceptional performance.
The comparative analysis demonstrates the superiority of RPV-SLAM, HDPV-SLAM, and PVL-Cartographer over existing methods, emphasizing the effectiveness of sensor-fusion-based SLAM. In contrast, ORB-SLAM2, VINS-Mono, LOAM, and Cartographer can only produce partial or inaccurate trajectories due to insufficient feature matching. The evaluation of SLAM systems using our YUTO MMS dataset reveals the robustness of sensor-fusion-based approaches compared to camera-only or LiDAR-only methods, especially when dealing with challenging data collected by an MMS equipped with a panoramic camera and a tilted LiDAR. As a result, our YUTO dataset, with its comprehensive range of sensors, holds great promise for advancing research in the field of SLAM-integrated mobile mapping applications. The dataset’s diverse sensor suite, encompassing panoramic cameras, LiDAR and GPS/IMU system, provides an invaluable resource for the development and evaluation of robust SLAM algorithms. The availability of such a dataset will facilitate in-depth investigations into the challenges of autonomous navigation, enabling researchers to explore novel techniques and methodologies for achieving accurate and reliable mapping, localization, and trajectory estimation in complex environments. Ultimately, these advancements will contribute to the realization of fully autonomous self-driving systems, enhancing their safety, efficiency, and overall performance in real-world scenarios.
9. Conclusions
In conclusion, this study introduces a comprehensive dataset captured using the Maverick MMS, tailed for addressing the intricate demands of mapping in challenging urban environments. This dataset integrates synchronized input from the Ladybug 5 panoramic camera, the tilted Velodyne HDL-32E LiDAR sensor, and the GPS/IMU unit, providing a rich source of information for SLAM and odometry research. The unique configuration of the Maverick system, with its tilted LiDAR sensor enhances the capture of elevated structures and a more comprehensive understanding of the environment. This dataset not only offers researchers an opportunity to explore novel approaches for the integration of SLAM and urban mobile mapping but also extends its utility to a spectrum of applications beyond the core focus. The dataset provides accurate ground truth trajectories through RTK positioning, which is useful for rigorous evaluation and benchmarking. It has a diverse range of environments that enable comprehensive testing and validation across various scenarios, making it ideal for research inquiries. For the future work, the dataset contains rich and synchronized sensor data that can be used for depth estimation, object detection and tracking, place recognition, and computer vision endeavors. The aim for future development of the SLAM-Integrated MMS dataset is to acquire long-term data that encompasses a variety of weather and illumination conditions in areas where GPS and IMU signals are compromised, such as tunnels and densely built-up downtown regions. This expansion will not only address the current dataset’s limitations, focusing mainly on outdoor settings under favorable weather conditions but also enhance its real-world applicability and relevance. By incorporating challenging scenarios, including adverse weather, low-light conditions, and texture-deficient areas, as well as data from indoor and hybrid environments, the dataset can become a more valuable resource for the research community. This work underscores the vital contributions made towards SLAM-Integrated MMS, paving the way for future advancements in autonomous navigation and mapping.
Footnotes
Declaration of conflicting interests
The author(s) declared no potential conflicts of interest with respect to the research, authorship, and/or publication of this article.
Funding
The author(s) disclosed receipt of the following financial support for the research, authorship, and/or publication of this article: This work was supported by the Natural Sciences and Engineering Research Council of Canada; (CRDPJ 537080-18).