
Abstract
Several studies have investigated crossmodal associations involving audiovisual stimuli. To date, however, far fewer studies have explored the relationship between musical timbre and visual features (e.g., soft/harsh timbres with blue/red colours). To fill this gap in the literature, 249 participants were invited to judge the match between different coloured images and musical excerpts. The images depicted seven characters from Saint-Saëns’ “Carnival of the Animals”; the audio stimuli consisted of the music the composer created to represent each character. To test the effect of timbre and culture, the audio stimuli were presented either in the original orchestral version or in the piano transcription, while the participants were recruited from various countries, encompassing both Western and non-Western nationalities. The results demonstrate that timbre influences crossmodal associations between musical excerpts and drawings, while these associations remain consistent across cultures, languages, and levels of musical background.
Introduction
Crossmodal associations, also known as crossmodal correspondences, have been defined as the tendency for a sensory feature, attribute, or dimension in one sensory modality, either physically present, or merely imagined, to be matched (or associated) with a sensory feature, attribute, or dimension in another modality (Motoki et al., 2023; Spence, 2011). Unlike synaesthesia, which is, by definition, idiosyncratic in terms of the inducer-concurrent mapping (see Deroy & Spence, 2013; Grossenbacher & Lovelace, 2001), crossmodal correspondences tend to be consensual (see also Sun et al., 2018). For example, numerous studies have shown that participants consistently associate round shapes with sweetness, and angular shapes with sour-tasting foods (Deroy et al., 2013; Spence, 2023).
As suggested by Daniel Stern (1999), the early constitution of intersubjectivity and a meaningful world in infants relies on vitality contours, which are affective and amodal forms of communication and expression that are present, for instance, in a caregiver's voice and touch. Cross-modality can thus be considered inherent to human communication and emotional experience from the early stages of human life.
In the audiovisual domain, studies have documented the existence of consistent correspondences between simple auditory and visual stimuli, such as pitch and size (e.g., Evans & Treisman, 2010; Gallace & Spence, 2006; Mondloch & Maurer, 2004; Walker, 1987); pitch and timbre/textural features of sound, such as roughness (e.g., Eitan & Timmers, 2010; Hamilton-Fletcher et al., 2018; see Di Stefano & Spence, 2022, for a review on roughness); pitch and lightness/brightness (e.g., Brunel et al., 2015; Hubbard, 1996; Klapetek et al., 2012; Marks, 1974, 1987) or hue (e.g., Di Stefano & Spence, 2022; Melara, 1989, for a review); pitch/sound waveform and shape/angularity (Marks, 1987; Parise & Spence, 2012; see, also, Ortmann, 1922).
While the majority of studies have focused on isolated and simple visual/auditory features, far less research has explored the associations between complex visual and auditory stimuli. Albertazzi and colleagues (2015) demonstrated consistent audiovisual associations between highly-complex stimuli (i.e., paintings) and music excerpts from the classical repertoire for guitar (or transcriptions, e.g., Villa-Lobos, Albeniz). Associations between complex stimuli have been explained using the semantic differential technique based on perceptual and emotional features (e.g., bright and calm, respectively; see also Cowles, 1935; Miller, 2021; Spence, 2020; and Iosifyan et al., 2022).
In a recent study using a set of stimuli based on Prokofiev's symphonic fairy tale Peter and the Wolf, Di Stefano and colleagues (2024) demonstrated that participants made highly consensual connections between musical excerpts and black-and-white images depicting the characters of the fairy tale. Moreover, the results showed that the associations appear to be consensually perceived across cultures and languages, namely English, Italian, Spanish, and Chinese (see also Trainor & Trehub, 1992, for a similar earlier study conducted in a sample of North American children). These findings have been explained through the emotional mediation hypothesis (Spence, 2020), which suggests that stimuli are matched across sensory modalities (especially audiovisual) based on their similar emotional meaning or profile (see the recent studies by Hashim et al., 2023, and Rosi et al., 2023; see also Rigg, 1937, for an early investigation of musical meanings).
Far fewer studies have investigated the relationship between musical timbre and visual features (e.g., colour, shape). For example, participants in an online experiment by Adeli and colleagues (2014) associated soft timbres with blue, green, or light grey rounded shapes, harsh timbres with red, yellow, or dark grey sharp angular shapes, and timbres with elements of softness and harshness along with a mixture of the two previous shapes. Similar results were obtained in a replication study by Gurman et al. (2021; see also Liu et al., 2021; Wallmark et al., 2021, on the effect of timbre in visual perception).
Several studies have demonstrated the emotional impact of timbre. For example, Hailstone and colleagues (2009) found that timbre alone influences the perception of emotions in music, independent of other acoustic, cognitive, or performance factors (see also Eerola et al., 2012). Given the role that emotions play in mediating audiovisual associations between complex stimuli (Di Stefano et al., 2024; Spence, 2020), we hypothesised that timbre also influences cross-modal associations in complex audiovisual stimuli. To test this hypothesis, 249 participants were invited to judge the match between different images and music in terms of piano and orchestral timbre. The images depicted seven of the characters from Saint Saëns’ Carnival of Animals (1886/1922), while the audio stimuli reproduced the music the composer created to represent each character. To test the effect of timbre, the audio stimuli were presented either in the original, orchestral version, or in the piano transcription. To test the effect of cultural background, participants were recruited from different countries and with different Western and non-Western nationalities, including Chinese and Hindi. The results demonstrate that timbre influences crossmodal associations between musical excerpts and drawings, while these associations remain consistent across cultures, languages, and levels of musical expertise.
Materials and Method
Participants
A sample of 249 adult participants (Mage = 30.57 years, SD = 10.4, 59.8% females) was recruited using Prolific Academic (app.prolific.com). 123 participants filled in the questionnaire in English (49.4%), 48 in Italian (19.2%), 38 in Hindi (15.2%), and 40 in Chinese (16.0%).
Participants were grouped in the following two ways:
Non-Western (NW) (N = 146, 58.6%, Mage = 31.10 years, SD = 9.4, 58.2% females) and Western (W) (N = 103, 41.3%, Mage = 29.83 years, SD = 11.6, 62.1% females). The groups didn’t differ in terms of their age (p = .344) or gender distribution (X2 = 0.70, df = 2, p = .703). Nationality (Nat): Chinese: N = 54, 21.6%, Mage = 29.5, SD = 7.5, 72.2% females; Indian: N = 92, 36.9%, Mage = 32.0, SD = 10.3, 50.0% females; Western: N = 103, 41.3%, Mage = 29.8, SD = 11.6, 62.1% females. Once again, the groups did not differ in terms of their age (p = .249); however, a Chi-Squared test revealed that they were unbalanced in their gender distributions (X2 = 14.82, df = 4, p = .005).
Stimuli and Procedure
The stimuli consisted of musical excerpts and coloured images. The audio stimuli consisted of 7 musical excerpts from Saint Saëns's musical suite Carnival of the Animals (Saint Saëns, 1962). All of the excerpts were saved as .wav files (stereo, 16-bit, 44.1 KHz). For the orchestra version, we used the recording by Leonard Bernstein with the New York Philharmonic Orchestra (1962) and for the piano version we used the reduction by Lucien Garban (available here: https://www.youtube.com/watch?v=I0KT4iXmeUs&t=27s). The titles and durations of the orchestral and piano excerpts are as follows: Royal March of the Lion (orchestral: 84 s, piano: 83 s), Hens and Roosters (44 s, 44 s), Tortoises (90 s, 90 s), The Elephant (71 s, 77 s), Characters with Long Ears (35 s, 35 s), The Cuckoo (122 s, 131 s), and The Swan (167 s, 191 s). The average duration of the orchestral version was 83.88 s, while the piano version averaged 87.88 s.
The drawings were extracted from the Multipic dataset, a standardized set of 750 drawings with multilingual norms (Duñabeitia et al., 2018). The correctness rate of associations, as measured by the Multipic's authors in several languages (i.e., British English, Spanish, French, Dutch, Italian, and German), was very high for all the selected drawings: Lion (100%), Chicken (89.76%), Turtle (100%), Elephant (100%), Donkey (98.08%), Swan (99.51%). This guaranteed that participants could easily identify the animals depicted. Given that the same database lacks an image of the cuckoo, we selected an image whose drawing trait was similar to that used in the Multipic dataset.
During the experiment, participants listened to all of the musical excerpts in random order and were invited to indicate the extent to which the audio stimulus matched (i.e., fit) each of the coloured representations of the animals. Participants were exposed to the following instruction: “Listen to the musical excerpt and look at the drawings. To what extent do the excerpt and the drawings match one another?”. The fit was measured using a 100-point slider. Participants could freely adjust the slider to any point without being able to see the corresponding numerical value. There were no time constraints for completing the procedure.
Statistical Analyses
The participants’ musical expertise and their emotional usage of music were measured by means of the Musical Training and Emotions factors of the Goldsmiths Musical Sophistication Index (Gold-MSI: Müllensiefen et al., 2014). Both the Musical Training (α = .90, 95% CI [.88, .92]; ω = .91, 95% CI [.89, .92]) and the Emotion (α = .72, 95% CI [.66, .77]; ω = .72, 95% CI [.64, .78]) scales had satisfactory internal consistency.
The Role of Timbre, Cultural Group, and Musical Sophistication: Model Comparison
The statistical analyses have been carried out in the R environment (RStudio version 2023.12.1, build 402). To model the fit score, we used a Linear Mixed Model approach via the lme4 package (Bates et al., 2015). We used a model comparison technique (Rodgers, 2010) to assess the roles of timbre, cultural group, nationality, and musical sophistication (i.e., musical training and emotion). This procedure was deemed more appropriate than mere significance testing because of the high number of observations (N = 12,201) and involved interacting levels among the variables, due to which significance levels could exhibit statistically significant but not meaningful results. On the contrary, model comparison aims to verify the extent to which the model's predictions improve when adding a given predictor or interaction term, the underlying assumption being that the more accurate the estimates (or the lower the error), the more important the predictors.
As a first step, a baseline model was constructed analysing the interaction between the musical stimuli and drawings. To take into account inter-subject variability and consistently with the repeated-measure design, the participants were modelled as random intercepts, as follows:


Lastly, out-of-sample predicted accuracy (McElreath, 2020) was analysed through a 5-fold cross-validation procedure. Each model was trained and validated across five unique balanced subsets of the dataset. We compared the models based on three performance metrics: Root Mean Squared Error (RMSE), Mean Absolute Error (MAE), and Root Mean Squared Logarithmic Error (RMSLE). These metrics provide a detailed insight into model accuracy, error distribution, and the ability to handle outliers and proportionate errors.
The associations have been inspected through the model's Estimated Marginal Means (EMMs) via the emmeans package (Lenth, 2024). Given the massive number of pairwise comparisons, the significance was assessed by using Bonferroni-corrected deviation contrasts. In greater detail, the fit score assigned to a given drawing with a musical piece was compared against the average fit score assigned to all the drawings when the same musical piece was presented. In this way, a positive contrast estimate indicated that, given a musical stimulus, a specific drawing reported a score higher than the average fit score for that music.
Power Analysis
A sensitivity analysis via simulation approach (N = 3000) was performed using the simr package in R (Green & MacLeod, 2016) to assess the minimum necessary sample size to detect the highest order interaction of interest (i.e., “musical piece × drawing × timbre”) with 80% power. This procedure was preferred over an a priori power analysis since it was practically impossible to hypothesise the effect size for the three-way interaction beforehand, especially due to the massive number of pairwise comparisons involved. The analysis was based on the three-way interaction because higher-order interactions have been found to require a larger amount of participants to achieve power (Heo & Leon, 2010). The results indicated that 43 participants were enough to detect the three-way interaction with power = 82.40%, 95% CI [79.90,84.71]. With 52 participants, the power was 91.20%, 95% CI [89.27,92.88].
Association Profiles: K-Means Clustering
The association profiles (i.e., the way in which the participants clustered the animals together) were inspected through a k-means Cluster Analysis. Due to the repeated-measures structure of the data, we normalised the fit scores within each participant so that all participants had equal weight in the analysis. To select the optimal number of clusters, we resorted to NbClust package (Charrad et al., 2014). NbClust computes 23 different indices for computing the number of clusters (e.g., KL: Krzanowski & Lai, 1988; Hartigan: Hartigan, 1975; Silhouette: Rousseeuw, 1987; Gap statistic: Tibshirani et al., 2001) and indicates the solution with the highest number of preferences across all indices. Both Euclidean and Manhattan distances were used to compute the number of clusters, leading to the same 4-cluster solution. Manhattan distances are preferred for cluster scoring estimation due to their lower sensitivity to outliers (Kumar, 2017) and their better performance in cases of high dimensionality (Aggarwal et al., 2001).
Results
Before proceeding to the first modelling phase, participants familiar with The Carnival of the Animals (N = 34) were excluded from the analysis due to potential bias in their associations. This exclusion was based on their response to the question, “How familiar are you with The Carnival of the Animals (Saint-Saëns)?”, administered at the end of the experimental procedure. Participants who answered “I can recognize it” were excluded from the analysis.
Model Comparison
Compared to the baseline model, the model which included the timbre (Model 1) exhibited a better fit to the data. In particular, the BF indicated clear evidence in favour of Model 1. Conversely, the model which included the cultural group (Model 2) reported a worse fit (see Table 1), thus indicating that the cultural group does not tangibly affect the associations. This result is corroborated by the cross-validation, wherein Model 1 showed decreased Root Mean Squared Error, Mean Absolute Error, and Root Mean Squared Logarithmic Error.
Model comparison.
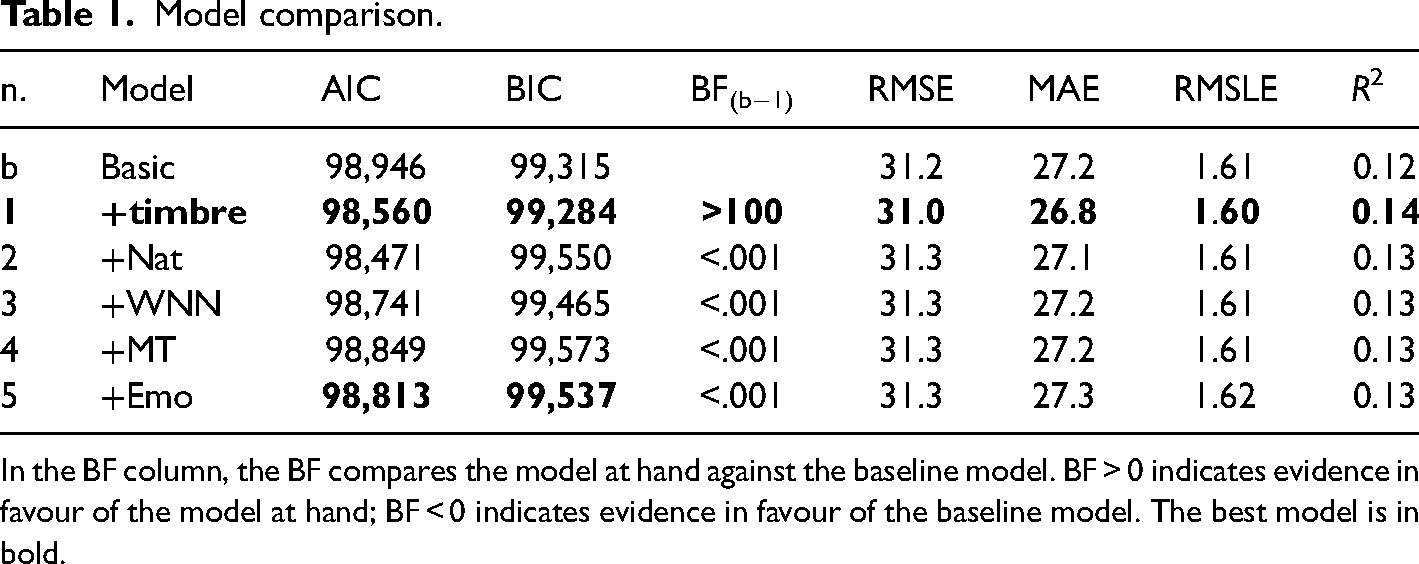
In the BF column, the BF compares the model at hand against the baseline model. BF > 0 indicates evidence in favour of the model at hand; BF < 0 indicates evidence in favour of the baseline model. The best model is in bold.
Music-Drawings Associations
In what follows, we present the details of how each musical stimulus was associated with the visual stimuli. See Figure 1 for the overall results of the associations. For the sake of brevity, we discuss just the Bonferroni-corrected significant contrasts (i.e., p < .05). For the complete list of the post-hoc comparisons, see the Online Supplementary Appendix.
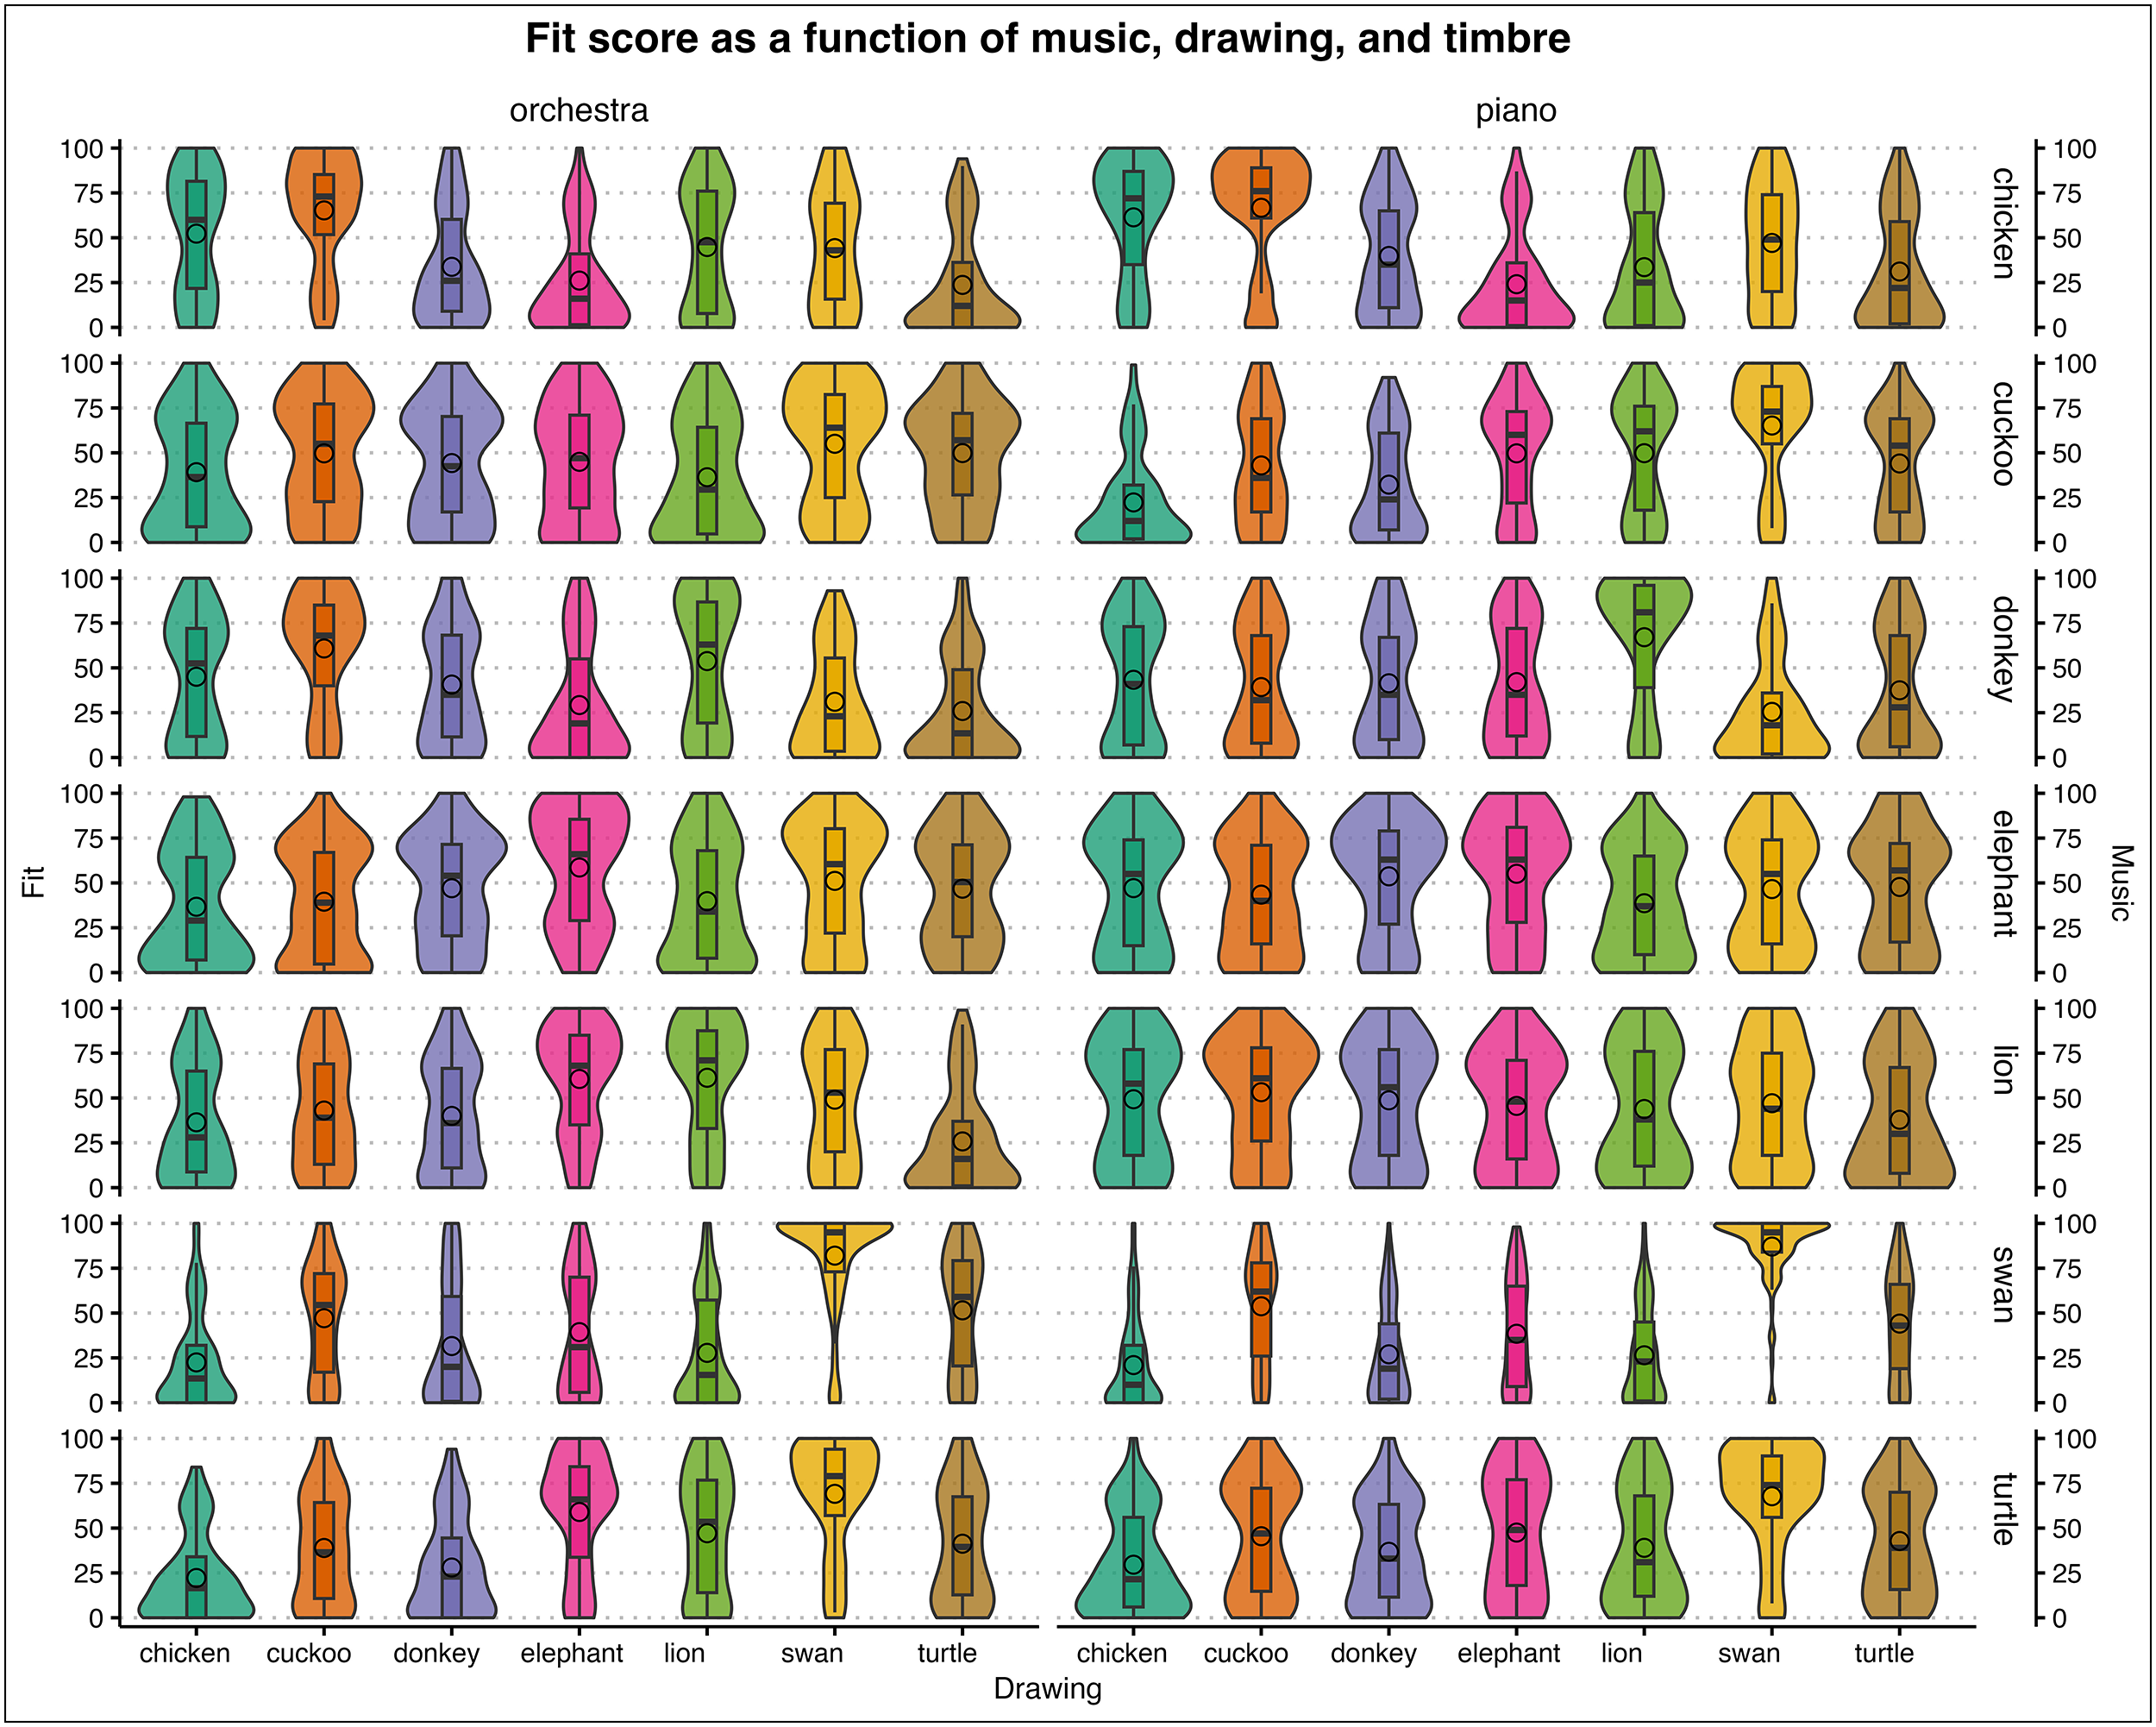
Fit score as a function of music, drawing, and timbre (orchestral vs piano). In the y-axis, for each Music-Drawing coupling, 100 means that participants rated the coupling as ‘very good’, while 0 indicates that the two stimuli ‘do not match’. The form of the violin plots indicates the distribution curve. The boxplots within each violin represent interquartile ranges (IQRs). Black horizontal lines within the boxplots indicate median values. Black circles within the boxplots indicate mean values. Horizontal layers represent the different musical excerpts, while columns correspond to drawings.
Chicken
With the orchestral version of the chicken music, the cuckoo drawing (Est = 20.03, SE = 2.89, p < .001) exhibited the highest fit (compared to the mean fit), whereas Elephant (Est = −16.96, SE = 2.91, p < .001) and Donkey (Est = −8.07, SE = 2.89, p = .011) were significantly below the mean. The chicken drawing just approached statistical significance (Est = 6.03, SE = 2.89, p = .066).
Several differences were found in the piano version. The Cuckoo drawing's fit remained the highest (Est = 22.24, SE = 2.88, p < .001). However, the Chicken drawing was also significantly higher than the mean (Est = 15.94, SE = 2.88, p < .001). Elephant, Lion, and Turtle reported fit scores significantly below the mean (p < .001).
Cuckoo
In the orchestral version, the Swan drawing had the highest fit (Est = 11.63, SE = 2.91, p < .001), followed by the Turtle (Est = 6.51, SE = 2.91, p = .048). The Lion's fit score was the lowest (Est = −7.34, SE = 2.91, p = .024). The Swan maintained its position in the piano version (Est = 19.95, SE = 2.98, p < .001). Donkey (Est = −10.94, SE = 2.98, p < .001) and Chicken (Est = −19.92, SE = 2.88, p < .001) had the lowest associations.
Donkey
The Donkey music was highly associated with the Cuckoo (Est = 18.97, SE = 2.92, p < .001) and Lion (Est = 8.76, SE = 2.92, p = .006) drawings. Strong negative associations were reported with Turtle (Est = −17.81, SE = 2.93, p < .001), Elephant (Est = −14.94, SE = 2.92, p < .001), and Swan (Est = −13.46, SE = 2.92, p < .001). The piano version of the Donkey music was mostly associated with the Lion (Est = 21.53, SE = 2.88, p < .001), whereas Swan (Est = −18.33, SE = 2.88, p < .001) and Cuckoo (Est = −7.02, SE = 2.88, p = .031) had negative associations.
Elephant
In the orchestral version, the Elephant drawing reported the highest score (Est = 11.75, SE = 2.91, p < .001) followed by the Swan (Est = 10.22, SE = 2.89, p = .001). The Elephant drawing had the highest fit in the piano version too (Est = 9.97, SE = 2.88, p = .001), very close to the Donkey (Est = 8.52, SE = 2.88, p = .007).
Lion
Lion (Est = 16.15, SE = 2.91, p < .001) and Elephant (Est = 16.64, SE = 2.91, p < .001) drawings were highly matched with the Lion music. Turtle (Est = −18.45, SE = 2.91, p < .001) and Chicken (Est = −6.80, SE = 2.89, p = .038) had the lowest fit scores. This pattern was very different in the piano version, where the Cuckoo drawing was the only one highly associated with the Lion music (Est = 9.70, SE = 2.88, p = .002).
Swan
The Swan drawing had the highest fit score (Est = 37.28, SE = 2.89, p < .001); whereas Chicken (Est = −20.20, SE = 2.89, p < .001), Lion (Est = −15.64, SE = 2.89, p < .001), and Donkey (Est = −10.40, SE = 2.89, p < .001) had the lowest ratings. The pattern was consistent with the piano version, where the Swan drawing reported the highest fit score (Est = 42.06, SE = 2.88, p < .001). Once again, Chicken (Est = −22.24, SE = 2.88, p < .001), Lion (Est = −18.62, SE = 2.88, p < .001), and Donkey (Est = −16.55, SE = 2.88, p < .001) had negative associations. In contrast to the orchestral version, in the piano version, the Cuckoo drawing had a positive fit (Est = 8.71, SE = 2.88, p = .006); while the Elephant score was negative (Est = −6.58, SE = 2.88, p = .044).
Turtle
In the orchestral version, the Turtle music was highly associated with the Swan (Est = 27.72, SE = 2.89, p < .001) and Elephant drawings (Est = 16.08, SE = 2.89, p < .001). By contrast, the fit scores related to the Chicken (Est = −22.73, SE = 2.92, p < .001) and Donkey (Est = −17.06, SE = 2.91, p < .001) drawings were significantly lower than the mean. Some of these findings remained consistent in the piano version. The Swan drawing was again the one with the highest fit score (Est = 23.54, SE = 2.89, p < .001), and the Chicken (Est = −13.45, SE = 2.89, p < .001) and Donkey drawings (Est = −6.87, SE = 2.89, p = .036) reported the lowest scores.
Association Profiles
Participants’ responses were further investigated by running a k-means cluster analysis to identify consistent patterns in how they rated the fit of the animals. For example, we looked at whether a high fit score for the Elephant drawing co-occurred with a high score for the Lion drawing, regardless of the music piece being played. This analysis allowed us to speculate on the existence of higher-order mental categories that can account for the participants’ responses beyond the animal level. These categories might include animal species (such as birds and mammals), physical properties (such as size and shape), and more abstract attributes/qualities (such as clumsy, elegant, or aggressive).
Given the influence of timbre on participants’ associations, two separate cluster analyses were conducted: one for the orchestra and one for the piano. Both analyses resulted in a four-cluster solution based on the examination of 23 indices (see Table 2 Cluster Piano and Orchestra below).
K-means cluster analysis. Composition of the four clusters for both timbres.
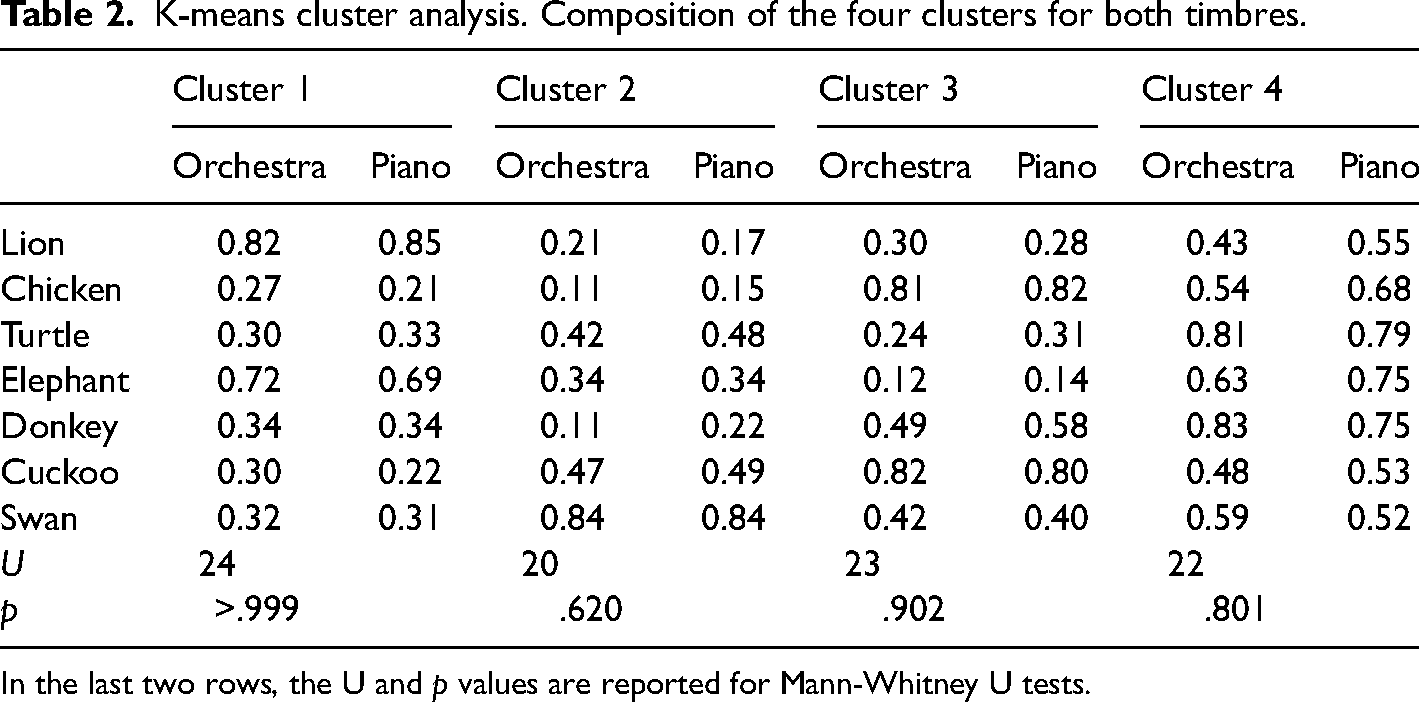
In the last two rows, the U and p values are reported for Mann-Whitney U tests.
A Mann-Whitney U test was then run for each of the four clusters comparing the standardised fit scores of orchestra vs. piano (ps > .620). These tests failed to reveal any significant difference between the considered comparisons, thus indicating that, within the same cluster, similar associative patterns existed across timbres. Therefore, we decided to delve deeper into the association profiles by grouping all observations into the same analysis.
The overall k-means cluster analysis resulted in a four-cluster solution (see Figure 2) as suggested by 10 indices, followed by a 3-cluster solution (N = 6), 5-cluster (N = 4), and 7-cluster (N = 3). Cluster 1 presented very high scores 1 for the Lion (M = 0.85) and Elephant (M = 0.63) and low scores for all other animals (M < 0.32), while Chicken (M = 0.26) and Turtle (M = 0.17) had very low scores. Cluster 2 was characterised by very high scores for the Swan (M = 0.85) and low scores for all other animals (M < 0.53). In Cluster 3, the Chicken (M = 0.84) and Cuckoo (M = 0.76) presented very high scores, whereas the Elephant had a very low score (M = 0.19). Finally, Cluster 4 was characterised by very high scores for the Turtle (M = 0.83) and Elephant (M = 0.79), whereas the Cuckoo had a very low score (M = 0.38), similar to that of the Chicken (M = 0.43).
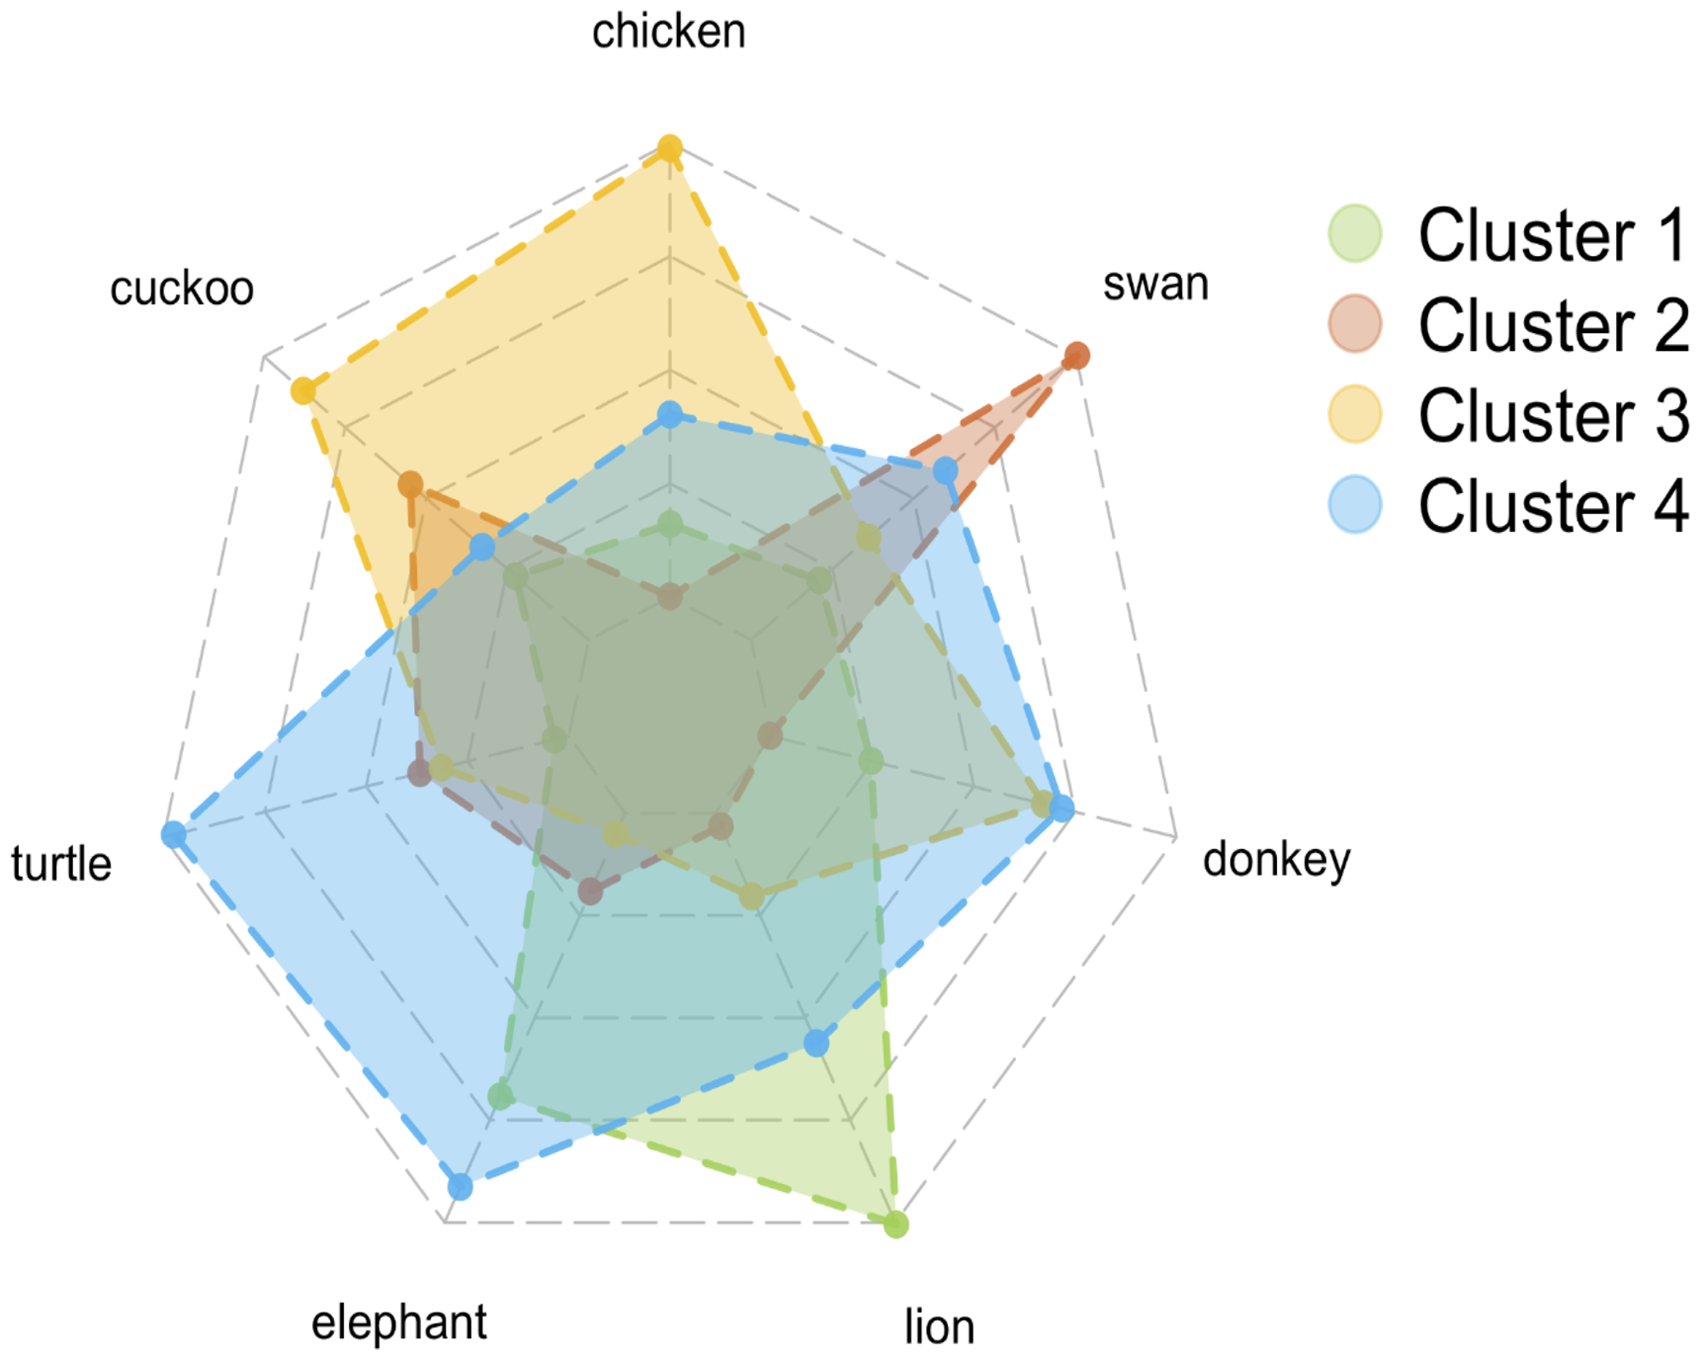
Representation of the four-cluster solution provided by the k-means cluster analysis.
To further explore participants’ association strategies, we assigned each observation to a specific cluster and then analysed the music-drawings association profiles within each cluster. This method enabled us to evaluate how accurately participants matched musical excerpts with the “correct” cluster, defined as the cluster containing the corresponding character (see Figure 3).
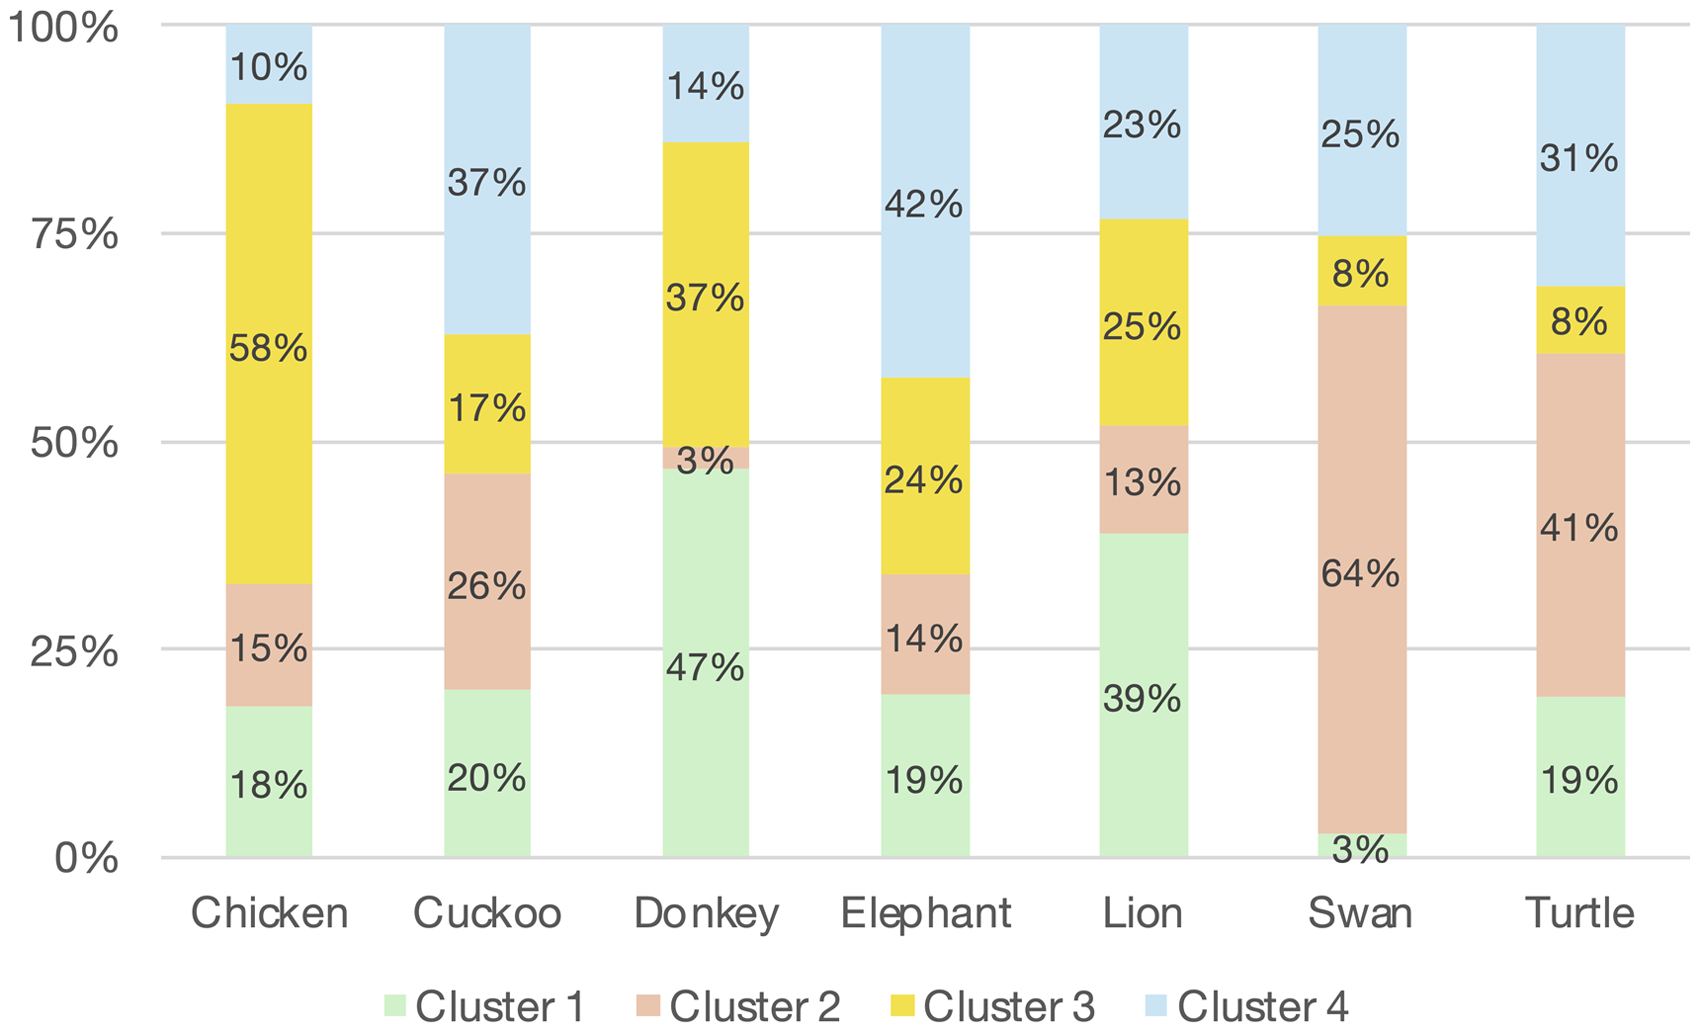
Representation of the distribution of observations within each cluster. For example, the music of the Chicken is matched with Cluster 1 18% of the time, with Cluster 2 15%, with Cluster 3 58%, and with Cluster 4 10%.
This analysis further confirms the distinctiveness of “The Swan,” which was assigned to the correct cluster in 64% of the matchings. The music of the Elephant was also relatively well-matched with the correct cluster (42%) compared to other clusters, similar to the Chicken being matched with Cluster 3 (58%). The Lion was correctly matched more often (39%) with the Big Animals cluster than with any other. However, some associations proved more ambiguous. For instance, the Cuckoo was predominantly linked with Cluster 4 (37%, “Slow Animals”), while the Turtle was more frequently assigned to the “Swan” Cluster (41%) than to the “Slow Animals” Cluster (31%). This observation might be expected, considering the shared calm and unhurried traits between turtles and swans. This analysis underscores the ambiguous nature of the music associated with the Donkey, which was nearly equally linked with the Big Animals cluster (47%) and the Feathered cluster (37%).
Discussion
This study aimed to investigate whether and how timbre affects crossmodal associations across cultures and languages using complex audiovisual stimuli. The findings demonstrated that participants’ matchings of musical excerpts from Saint-Saëns’ Carnival of the Animals with coloured drawings were consistent across cultures, languages, and levels of musical expertise. However, these associations were significantly affected by the timbre of the musical stimuli, namely, orchestral versus piano.
The musical excerpt of the Swan exhibited extraordinarily consistent association profiles, with participants most likely associating it with the drawing of the Swan across all conditions and samples. Similarly, the musical excerpt of the Elephant showed consistent associative profiles, with participants matching it preferentially with the drawing of the Elephant across all conditions and samples. Other characters, such as the Lion and the Donkey, exhibited less consistent, timbre-dependent matchings.
The k-means cluster analysis offers insights into the factors influencing associations. Cluster 1 appears to group animals primarily by size (large) and majesty, specifically the Lion and Elephant (while the Chicken and Turtle receive notably lower scores in this cluster). This aligns with association results showing that the Lion's musical excerpt is significantly more frequently linked to the drawing of the Elephant than to any other drawings, particularly in orchestral timbre.
Cluster 2 consists solely of the Swan, forming a single-item cluster. This can be attributed to the (represented or imagined) Swan's unique elegance, smooth movement, and calm demeanour, as supported by associations where the Swan's musical excerpt consistently correlates with drawings of the Swan in both orchestral and piano timbres.
Cluster 3 includes the Chicken and Cuckoo, characterised by their small size, jerky movements, and feathers. This similarity is reflected in associations where the Chicken's musical excerpt is most frequently associated with the drawing of the Cuckoo across both orchestral and piano timbres.
Finally, Cluster 4 groups the Turtle and Elephant, categorised as slow, calm animals, though less elegant and graceful compared to the Swan. Association results confirm similarities between these animals, showing that the Turtle music is significantly more associated with the Elephant's drawing, particularly in orchestral timbre.
Overall, the cluster analysis revealed that various higher-order semantic categories likely influenced participants’ associations (see also Cohen, 1993, for associations involving audiovisual complex dynamic stimuli, i.e., films). These categories include physical properties such as size (large/small) and features like feathers, dynamic properties such as velocity and fluidity, as well as more abstract features such as elegance and calmness.
Investigating the reasons behind this, one might consider that timbre differences are more ambiguous and elusive than those based on melody and rhythm, making them difficult to account for in cognitivist theories of resemblance. For example, in Davies’ account (e.g., 1994, 2008), music is emotionally expressive as it resembles bodily movements or behaviours that manifest emotional or inner states (see also Hubbard, 2017; Kivy, 1989; Larson, 2012). However, while appearance emotionalism seemingly works well in explaining the expressiveness of musical features associated with movement, primarily melody (Sievers et al., 2013) and rhythm, it fails to account for the expressive quality of timbre, which lacks any phenomenologically evident connection with (human) movement (Reymore et al., 2023). However, timbre may be reflective of the vitality contours that have been proposed to constitute the affective intersubjectivity of infants (Stern, 1999). Alternative explanations to account for timbre expressivity have been provided in the recent debate based, for example, on the notion of ‘atmosphere’ (Di Stefano, 2023; see also Ravasio, 2017).
Finally, gaining insights from the perspective of association profiles and musical compositions reveals some interesting findings. One might assume that incorporating elements in musical compositions that directly evoke the acoustic features (like voice) of characters could aid participants in correctly identifying associations. However, our findings indicate that this assumption does not always hold true. It is noteworthy that although the musical composition for the Donkey includes elements in both its orchestral and piano versions meant to explicitly mimic the animal's distinctive “hee-haw” sound, these elements do not significantly enhance its association with the Donkey over other animals. In contrast, the music linked with the Swan, which is frequently associated with the Swan animal, lacks literal elements that reproduce the animal's characteristic acoustic features. This suggests that higher-order, abstract qualities such as elegance and grace can be conveyed more effectively through music than specific acoustic properties that are associated with animal vocalizations (at least partially in line with the emotional mediation hypothesis, see Spence, 2020, and with findings from Di Stefano et al., 2024; see also the ‘visual imagery’ and ‘musical expectation’ mechanisms of the BRECVEMA framework elaborated by Juslin, 2013).
Supplemental Material
sj-docx-1-art-10.1177_02762374241308810 - Supplemental material for Audiovisual Associations in Saint-Saëns’ Carnival of the Animals: A Cross-Cultural Investigation on the Role of Timbre
Supplemental material, sj-docx-1-art-10.1177_02762374241308810 for Audiovisual Associations in Saint-Saëns’ Carnival of the Animals: A Cross-Cultural Investigation on the Role of Timbre by Nicola Di Stefano, Alessandro Ansani, Andrea Schiavio, Suvi Saarikallio, and Charles Spence in Empirical Studies of the Arts
Footnotes
Author Contribution
Conceptualisation, N.D.S., A.A., A.S., C.S.; Methodology, N.D.S, A.A., A.S., C.S.; Investigation, N.D.S. and A.A.; Formal Analysis, A.A.; Writing – Original Draft, N.D.S. and A.A.; Writing – Review & Editing, A.S., S.S., and C.S.; Funding Acquisition, N.D.S.; S.S.; Supervision, N.D.S. and C.S.
Data Availability
The datasets generated during the current study are available from the corresponding author upon reasonable request.
Declaration of Conflicting Interests
The authors declared no potential conflicts of interest with respect to the research, authorship, and/or publication of this article.
Ethics
The protocol was approved by the Research Ethics and Integrity Committee of the National Research Council of Italy.
Funding
This research received financial support under the National Recovery and Resilience Plan (NRRP), Mission 4, Component 2, Investment 1.1, Call for tender No. 104 published on 2.2.2022 by the Italian Ministry of University and Research (MUR), funded by the European Union - NextGenerationEU- Project Title “The multisensory and interactional nature of music experience. Merging aesthetics with bioengineering to investigate the multidimensional structure of musical sound.” Grant Assignment Decree No. 1079 adopted on 19/07/2023 by the Italian Ministry of Ministry of University and Research (MUR). Financial support for the research carried out in this work was also provided by the Research Council of Finland [grant number 346210].
Supplemental Material
Supplemental material for this article is available online.
Notes
Author Biographies
References
Supplementary Material
Please find the following supplemental material available below.
For Open Access articles published under a Creative Commons License, all supplemental material carries the same license as the article it is associated with.
For non-Open Access articles published, all supplemental material carries a non-exclusive license, and permission requests for re-use of supplemental material or any part of supplemental material shall be sent directly to the copyright owner as specified in the copyright notice associated with the article.