
Abstract
While consumer and marketing research in developed markets is an established field, research on consumers in an Bottom of the Pyramid (BoP) setting is less established and mostly conceptual or qualitative. This paper examines the individual heterogeneity and the local context of BoP consumers with an empirical study on consumption of low cost bottled water on the Kenyan coast and the capitals of Uganda and Rwanda. The empirical analysis builds on existing research exploring consumer behavior, and it studies a database of 713 bottled water consumers in Kenya, Uganda and Rwanda. Consumers with a higher level of education were less likely to be late consumers. Additionally, early consumers were more likely to purchase due to a purposeful search for a bottled drinking water solution. Since we control for location specific effects we highlight the importance of supply driven consumption in the BoP market. Furthermore, the results suggest that the two water companies may not be reaching their targeted low-income consumers but rather middle class consumers. The research contributes to the larger BoP debate by presenting evidence that consumers in a BoP setting may purchase more on the basis of supply of a product rather than other socio-demographic factors such as income.
Introduction
While the last decade of research brought attention to the potential for businesses reaching the large and untapped market of low income consumers, it is debated whether businesses can be both profitable and meet needs for low income consumers (Agnihotri 2012; Karnani 2007; Meagher 2018; Prahalad 2005; Ramani and Mukherjee 2014). In order for businesses offering Bottom-of-the-Pyramid (BoP) innovations to be profitable and self-sustainable their innovations need to be widely adopted and consumed (Hall, Matos, and Martin 2014; Ramani and Mukherjee 2014). Although research examining marketing and consumption habits in developed markets is well established, consumers and their consumption decisions in the BoP is a less studied yet relevant focus as increasingly western firms target BoP markets (Agnihotri 2012; Kotler et al. 2006; Sheth 2011; Silvestre and Neto 2014). The seminal work of Prahalad and others (Montgomery, Peredo, and Carlson 2012; Prahalad 2005) implies that consumers at the BoP are homogenous, however more recent research points towards a more heterogeneous group of BoP consumers (Chikweche, Stanton, and Fletcher 2012; Guarín and Knorringa 2014; Kotler et al. 2006; Marinakis, Walsh Prof dr, and Harms dr 2016). In particular, much of the BoP literature focuses on the Asian context with less work looking at African markets and consumers (Mair and Marti 2009; Prahalad 2012; Ramani, SadreGhazi, and Duysters 2012). However, as a recent African Development Bank report highlighted, GDP growth in sub-Saharan Africa has outpaced other regions in the last 15 years, creating opportunities for market development (AfDB 2016). This paper contributes empirical evidence to the debate on BoP consumer heterogeneity with a focus on the African context, by investigating characteristics of BoP customers who consume fresh drinking water in Kenya, Uganda and Rwanda.
While marketing literature has increasingly looked at new markets in Asia and Africa, focusing on the potential for business, there is still limited understanding of how markets and consumers in these markets differ from developed markets (Kotler et al. 2006; Sheth 2011). Authors have highlighted the issue of poverty changing the way consumers make purchase decisions (Bonsu and Polsa 2011; Chikweche and Fletcher 2011a). Additionally, other authors have criticized businesses seeking to reach poor consumers, arguing that they are often not being reached and may instead be exploited (Hahn 2009; Karnani 2007, 2009; Meagher 2018) . Developing a better understanding of these aspects requires a deeper look into how consumers at the BoP are heterogeneous and how this influences the timing of their consumption decisions. Possible ways to understand consumers’ consumption behavior is to analyze individual characteristics, the local context in which the consumer is embedded and finally, the cultural context that shapes the local understanding (Ramani, SadreGhazi, and Duysters 2012; Zanello et al. 2016). Despite the seeming resemblance, the various factors affecting the decision process of a BoP consumer are considerably different than the traditional consumers. One way to look at consumer heterogeneity is through timing of purchase and how BoP consumers may differ based on their time of purchase. Timing is relevant due to the severe budget and income constraints BoP consumers face that affect timing of purchase (Viswanathan et al. 2014; Yurdakul, Atik, and Dholakia 2017).
The study at hand contributes to the scarce literature on BoP consumer heterogeneity by assessing the characteristics of consumers based on their time of purchase and whether there are systematic differences between groups. Two types of characteristics are analyzed – individual characteristics such as education and income, and features of the local context such as how the consumer received information about a product. The following research question is addressed: What is the effect of BoP consumer characteristics on their timing of consumption?
The research contributes to BoP marketing literature in two ways: 1) it exposes the heterogeneity amongst BoP consumers by focusing on timing of consumption, 2) quantitative study on consumers in three countries. The context under study is the consumption of bottled water – of two different socially oriented companies (Dutch Water Limited and Jibu, LC3) in urban East Africa (Kenya, Rwanda, Uganda). The first is a Dutch founded water company on the Kenyan coast and the second an American founded “social enterprise” in the capitals of Rwanda and Uganda. We study 713 bottled water consumers breaking them apart by their time of purchase. This research aims to address the gap in empirical work at the BoP by focusing on differences between consumers based on their time of purchase and not at differences between consumers versus non-consumers, thus exposing BoP consumer heterogeneity. The study shows that late consumers have a lower level of education whereas earlier consumers are more likely to have purposefully searched for bottled drinking water. A novel feature of our analysis is that we can control for entry into different sales areas/zones. Controlling for location specific effects we demonstrate that consumption at the BoP is highly supply driven. Most importantly, the research suggests that unlike traditional consumers in developed markets, consumption of bottled water for BoP consumers does not seem to be influenced by wealth.
The remainder of this paper is structured as follows: Section 2 provides an overview of existing literature on macromarketing at the BoP, BoP consumer studies and bottled water consumption. Section 3 presents the conceptual model. The study context is set up in section 4 and the variables and empirical model are detailed in Section 5. Results are presented in section 6 and the last two sections provide the discussion and conclusions.
Literature Review
Macromarketing at the BoP
The advent of three changes have brought increasing attention to the importance of business in emerging markets and the BoP. First, besides Prahalad’s initial opening of the possibilities at the large and untapped BoP market, growth in emerging markets has occurred due to economic reforms in these countries. Second, due to the limited demand in advanced economies because of aging populations, BoP markets have been brought to the forefront. Finally, the advent of free trade and a rising new middle class have increased business opportunities at the BoP (Sheth 2011). Therefore, understanding how marketing and consumer behavior is different in BoP markets has become a growing area of research (Bonsu and Polsa 2011; Davies and Torrents 2017; Jagadale, Kadirov, and Chakraborty 2018; Jaiswal and Gupta 2015; Kotler et al. 2006; Yurdakul, Atik, and Dholakia 2017). Besides the business opportunities in these new markets, there is the question of how marketing to these new demographics plays a role in poverty alleviation (Kotler et al. 2006). Therefore marketing literature on the BoP can be divided into two streams: case studies on specific markets (Alur and Schoormans 2013; Banbury, Herkenhoff, and Subrahmanyan 2015; Chikweche and Fletcher 2011a; Davies and Torrents 2017; Jagadale, Kadirov, and Chakraborty 2018; Viswanathan et al. 2014; Viswanathan and Rosa 2010), and how marketing strategies and consumer behavior more generally might differ in these markets (Agnihotri 2012; Bonsu and Polsa 2011; Kotler et al. 2006; Piacentini and Hamilton 2013; Sheth 2011; Subrahmanyan and Tomas Gomez-Arias 2008; Yurdakul, Atik, and Dholakia 2017).
Focusing on the second stream of literature within marketing and consumer studies, highlights a few points about operating within BoP markets. First, authors have illuminated the issue of heterogeneity at the BoP both in terms of markets and consumers (Kotler et al. 2006; Sheth 2011). Prahalad’s work overlooked the heterogeneity of this demographic (Agnihotri 2012; Kotler et al. 2006). Rather than being one homogenous group with similar purchasing power, BoP consumers are driven to purchase products for different reasons and have different socio-demographic characteristics that drive them to make purchase decisions (Jagadale, Kadirov, and Chakraborty 2018; Sheth 2011). In addition to consumer heterogeneity, markets themselves are heterogeneous in the sense that one particular geographically demarcated market can be made up of consumers that have means to purchase and those who do not (Sheth 2011). Second, marketing scholars emphasize that poverty limits consumers from being part of a consumer society (Yurdakul, Atik, and Dholakia 2017). Consumption decisions are made less from the perspective of choices but more from immediate needs which challenges Prahalad’s notion of freedom of choice and individual empowerment through marketplace participation (Bonsu and Polsa 2011; Viswanathan et al. 2014). Related to the issue of participation in a consumer society, other research has exposed that purchase decisions may be driven more by availability of products than specific desires (Chikweche and Fletcher 2011b). Finally, studies that have focused on specific emerging/BoP markets have illustrated the lack of branding in many BoP markets (Sheth 2011) and the problem of distribution and the importance of social networks and local entrepreneurs in overcoming this problem (Alur and Schoormans 2013; Chikweche and Fletcher 2011b; Davies and Torrents 2017).
Existing marketing literature on BoP markets exposes two areas for future research: unpacking consumer heterogeneity in BoP markets from an empirical perspective, and understanding better what drives consumers to purchase particular products, especially products that could be considered basic needs like clean drinking water (Kotler et al. 2006; Sheth 2011; Yurdakul, Atik, and Dholakia 2017). This paper will explore consumer heterogeneity from a marketing perspective.
Consumer Studies at the BoP
BoP literature following Prahalad’s seminal work, emphasized both the need to define the poor and acknowledge their heterogeneity (Agnihotri 2012; Karnani 2007; Kotler et al. 2006). Investigating these two aspects requires a look at consumption at the BoP and what drives BoP consumers to make purchasing decisions. The literature on consumers and purchasing decisions at the BoP is mostly dominated by qualitative work (Chikweche, Stanton, and Fletcher 2012; Nakata and Weidner 2012; Ramani, SadreGhazi, and Duysters 2012; Subrahmanyan and Tomas Gomez-Arias 2008) with fewer quantitative investigations (Ernst et al. 2015). While the focus of this research is on consumption of goods not adoption of innovations, there is some overlap in factors driving these decisions. Adoption implies a time dimension and looking at the overall market, whereas consumption is an instantaneous purchase decision. Therefore, an overview from both types of literature is given. First an overview of qualitative work on adoption of innovations at the BoP, BoP consumers and their purchasing decisions is given and second the limited quantitative work is described.
Zanello et al. (2016) conducted a systematic literature review looking at factors influencing purchase decisions at the BoP. The review highlights the importance of individual characteristics like education and financial means in a consumers’ choice. The characteristics of consumers that allow them to use a particular innovation to their advantage play a key role in creating demand at BoP (Ramani, SadreGhazi, and Duysters 2012). An understanding of the nature and process of demand creation is important to understand the needs of the customers at BoP. The discrepancy in the perception of needs as experienced by the BoP and as perceived by a supplier is one of the main obstacles for purchase at the BoP (Zanello et al. 2016). The needs mismatch can be observed in case of technology design, product design and delivery design (Ramani, SadreGhazi, and Duysters 2012). Chikweche and Fletcher (2012) also stress the lack of contextualized and local knowledge possessed by foreign firms seeking to operate in developing countries.
Nakata and Weidner (2012) developed a conceptual model that looked at adoption of products at the BoP. The model emphasized adoption as a two-stage process: symbolic and material. Symbolic means a new product is “wanted/desired”, while material is the actual purchasing of the product (Sen 2001). 1 According to the model, usually poor consumers desire/want a product, but the product is not purchased due to poverty. Therefore, both stages of adoption do not always occur at the BoP. Nakata and Weidner’s (2012) model for new product adoption considered the effect of social context, poverty, marketing environment, and new product attributes.
Furthermore, a limited number of studies have looked at the specificities of consumers in a BoP context, like the role played by family in the purchase decision making process. Chikweche, Stanton, and Fletcher (2012) highlight how BoP markets have different characteristics through a case study about the role of family decision making in purchasing in Zimbabwe. Unlike developed markets, at the BoP the decision making for consumption of goods is a more of a joint process, with possibly different roles for different family members. Sometimes these roles overlap between individuals but the frequent difference between user and decision maker or even buyer plays a role for marketing and design of products. Another important observation that likely applies in other BoP contexts is the different types of purchasing decisions. Products are either bought instantaneously as they are needed, when the product is actually available, or when the household can afford products (Chikweche, Stanton, and Fletcher 2012; Viswanathan et al. 2014). Education and information available to the consumer play a role in purchase decisions (Adkins and Ozanne 2005; Nakata and Weidner 2012; Prahalad and Hammond 2002; Ramani, SadreGhazi, and Duysters 2012). Those with higher levels of formal education may make earlier purchase decisions. Finally, linking consumption to the discussion of timing of purchase also requires a look at the search process and the role of information that consumers seek out or receive (Chikweche and Fletcher 2012; Lüthje, Herstatt, and Von Hippel 2005; Ramani, SadreGhazi, and Duysters 2012; Subrahmanyan and Tomas Gomez-Arias 2008). Authors such as Kotler et al., (2006) mentioned the importance of marketing to early adopters of innovations at the BoP because this group can further diffuse innovations through word of mouth referral.
Focusing on quantitative work, Ernst et al. (2015) studied the effect of bricolage, local embeddedness and standardization on product purchase. The quantitative findings from Ernst et al. (2015) support the qualitative research: bricolage and local embeddedness are positively related to adoption highlighting the importance of understanding aspects of local context like the product design required by the local population, and the social and cultural aspects of the local setup. Rahman, Hasan, and Floyd (2013) focus on the role played by brand orientation in creating a relative advantage at the BoP market of Bangladesh. Examining consumer data from Grameenphone Community Information Center, the authors show that brand orientation as a strategy has a positive effect on adoption of the innovation.
Consumption and Purchase of Clean Water Technologies
At the BoP, where public access to clean drinking water is often limited, bottled water or other clean water innovations are necessary. From a macro perspective work has looked at the privatization of water resources and the rise of the bottled water industry both in developed and emerging markets (Patsiaouras, Saren, and Fitchett 2015). Specifically, there has been a rise in multinational companies CSR initiatives in emerging markets providing bottled drinking water (Brei and Böhm 2011). These companies claim to be alleviating poverty through provision of clean drinking water, but a more critical view suggests that the companies are also trying to change their image in developed markets (Brei and Böhm 2011).
Cohen et al. (2017) conducted a quantitative study to investigate predictors of boiled water and bottled water consumption in rural China analyzing data from 450 rural households in Guangxi province. The results show that female-headed households were more likely to boil water whereas higher-income households with younger, literate and male heads were more likely to purchase bottled water. Ritter et al. (2017) tested the effect of marketing strategies on consumers and suppliers for the case of household chlorination products employing a randomized controlled trial in rural Haiti. The results of the study suggest that visits from sales agents may increase purchase of chlorination products, however, the rise in sales does not cover the costs of the visit. The authors argue that in developing countries decisions related to promotion and pricing have long lasting health implications.
Focusing only on factors driving bottled water consumption in emerging markets, there are a limited number of bottled water specific studies with mixed results. Research in Guatemala, the Philippines and Ghana showed that generally smaller, higher educated and higher income households were more likely to consume bottled water (Francisco 2014; Quansah, Okoe, and Angenu 2015; Vásquez 2017). However in rural Guatemala, Vásquez (2017) found that income was not a significant driver for smaller purchases of bottled water. Income also had a minimal effect on bottled water consumption in the Philippines (Francisco 2014). A gender effect did not show up in any of the quantitative studies, but qualitative research on bottled water consumers in Brazil hinted that women may be important decision makers in the choice of bottled water (de Queiroz et al. 2013).
Overall, it has been found that the limited uptake of decentralized water solutions like bottled water were due to low affordability of the products, high income variability of consumers, and the companies’ challenges in communicating their value proposition (Dahlberg 2017). In summary, the work looking at bottled water consumption highlights the role of household head gender, education level, and wealth (Francisco 2014; Quansah, Okoe, and Angenu 2015; Vásquez 2017).
Conceptual Model
Building on literature discussed above, we develop a conceptual model and three hypothesis regarding the timing of consumption of bottled drinking water in a BoP context.
Education is considered to be a vital starting point for introducing change in consumption behavior of BoP consumers for basic needs like clean drinking water, health care alternatives, to mention few examples (Prahalad and Hammond 2002; UNDP 2008). Education provided to the consumer can be divided in two main categories: traditional education and customer education. Traditional education comprises of formal education provided at educational institutes, learning programs available on online platforms. Usually, BoP consumers have access to a lower level of education when compared with the main stream consumers (Ramani, SadreGhazi, and Duysters 2012; Nakata and Weidner 2012). One of the reasons for the low level of education could be lack of access to up to date formal educational institutions that provide basic education and skill training (Subrahmanyan and Gomez-Arias 2008). In the presence of lack of basic education skill set, a BoP consumer may not feel equipped with sufficient information to make a consumption choice or lack the required agency to make a decision, in other words a lack of empowerment (Adkins and Ozanne 2005). Education is one of the inputs which raises awareness, helps the poor consumer in understanding different aspects of their decision process like today’s gain in terms of need fulfillment as a compensation for today’s financial loss. Education thereby increases the chances of an informed choice being made by the poor consumer. Hence, we argue that a high level of education leads to a consumption choice being made earlier rather than later.
Receiving information is one of the first steps in gaining awareness about a product, especially at the BoP. To understand the structure of information received it is important to analyze who is bringing the information, to whom the information being transferred to and who is responsible for exchange of the information in a local setup. BoP consumers receive information via two means: personal network and in-person promotions. Consumers at the BoP depend on their personal network comprising of friends, relatives, neighbors while making consumption choices (Nakata and Weidner 2012). Traditional means of product promotion like advertisements via television are less influential in the BoP setup, where consumers prefer in-person promotion (Nakata and Weidner 2012; Chikweche and Fletcher 2012). Information received through the personal network and in-person promotions helps the consumer in understanding their need requirement. Both personal network and in-person promotion give the opportunity to receive information via personal interaction thereby, providing the possibility to see another consumer in their use environment. Understanding of need information and intended use environment help the consumer in building his/her local information (Lüthje, Herstatt, and Von Hippel 2005). One of the inputs affecting accumulation of local information is personal network and chances of early consumer’s personal network knowing about the product is less when compared with the network of late consumer, even if all the consumers had a chance to attend the product demonstration. Furthermore, given the collectivist culture in a BoP setting, the local information about a product possessed by late consumers will be greater compared early consumers. Hence, we argue that receiving local information increases the chances of late consumption.
External information search is one input in the consumer decision process. Smith and Beatty (1987, p. 85) define external information search as “the degree of attention, perception and effort directed toward obtaining environmental data or information related to the specific purchase under consideration.” While gathering information a poor consumer considers three main factors: cost benefit assessment of the purchase choice, factors related to the local context, and household specific factors (Chikweche, Stanton, and Fletcher 2012; Ramani, SadreGhazi, and Duysters 2012; Subrahmanyan and Tomas Gomez-Arias 2008). Local factors could include cultural environment, social capital, family systems and access to distribution systems. Household specific factors could include tastes, needs and willingness to explore different alternatives. Given the presence of collectivist culture at the BoP and the dependence of other consumers on their cultural environment while making choices, consumers who do not engage in a search process follow the choices of the majority BoP consumers or act to fulfill certain aspirational needs (Chikweche and Fletcher 2014; Jaiswal and Gupta 2015). Consequently, consumers who engage in purposeful external information search to understand consumption options might gain exposure to additional sources of information not available in his/her local context. The additional information may result in an earlier purchase when compared with other consumers.
Study Context and Sampling
Context
In this section we describe the local context of the three study countries: Kenya, Rwanda and Uganda.
Like many developing countries, Kenya faces the common problem of delivering fresh water to the entire population. 2 Particularly due to urbanization, supply of quality water is a challenge. Often the quality of piped water is mediocre or unsafe for drinking. Although one of the Millennium Development Goals was improving access to improved water sources and progress was made in this regard it seems unclear whether access to an improved water source also implies access to safe drinking water (WHO et al. 2015). According to available data from 2014, 67% of the Kenyan population (with higher levels in urban areas) have access to an improved water source, where an improved water source is classified as the ‘main source of drinking water [being] a household connection (piped), public tap or standpipe, tube well or borehole, protected dug well, protected spring, rainwater collection, or bottled water’ (Kenya National Bureau of Statistics et al. 2015). Yet, there is evidence that many improved sources do have the bacteria e-coli and other contaminants suggesting that a better definition of improved water source is needed (Grady et al. 2015). Furthermore, a study for rural Kenya demonstrates that coping with poor water quality makes households incur further costs (Cook, Kimuyu, and Whittington 2016). Access to clean water for all is further put under pressure since Kenya’s water supply was privatized in 2002 through reforms that decentralized water provision (Ministry of Water and Irrigation 2017; Water Services Regulatory Board 2014).
Piped water delivery in Kampala, Uganda is slightly different than in Kenya. The National Water and Sewage Corporation (NWSC) is responsible for water delivery in Kampala. NWSC is a parastatal, owned by the government. The costs of the water corporation are only partially covered by revenues from consumers. Larger investments come from the government through donor funds. NWSC is under the jurisdiction of the Ministry of Water and the Environment. 3 The water quality at the source is managed by the Ministry but tapped water quality is managed by NWSC. Unlike at the Kenyan coast, supply is less of a concern in Kampala due to supply from nearby Lake Victoria. While there are some supply and demand issues, it is an infrequent occurrence compared to Kenya. Quality issues in Kampala are mainly due to old piping infrastructure and illegal tapping of pipes. Yet, water quality issues have created a large market for bottled water. This market is not properly regulated leading to cases where branded bottled water containers are filled with unpurified water and resold. Due to regulation problems, knowledge on certification in Kampala seems to be high and consumers desire water that has been certified by the Uganda Bureau of Standards (UNBS). 4
While Kigali, Rwanda faces some of the same water delivery issues as in Kenya and Uganda, the governance of water delivery is again different. Water delivery is regulated by the Rwanda Utilities Regulatory Agency (RURA). Companies must pay for a license for a particular operating area in order to delivery water to that region. Although competition is technically allowed, when a company acquires a license for an area, no other companies can supply water in the same area. In Kigali and the major cities of Rwanda, water is supplied by a government owned, private company called Water and Sanitation Corporation (WASAC), which has a monopoly there. 5 Kigali is attempting to address existing shortages in water supply. Two new purification plants are nearly complete that are expected to fulfill the remaining supply needs of Kigali. Like in the Kampala and Mombasa area, Kigali’s piping infrastructure is old and illegal tapping of water is widespread. Moreover, like Mombasa, Kigali has experienced rapid population growth in particular in the period directly following the genocide of 1994. The existing infrastructure is insufficient for the current population. 6
In all three locations, the combination of insufficient supply, and unsafe quality has created a market for bottled water. While the underlying factors that have constituted markets for innovations in bottled water are similar, location specific factors are likely to have influenced how these products are consumed.
Case Descriptions
Data for this study was collected from two bottled water companies: Dutch Water Limited (DWL) and Jibu, LC3. While there is a large market for bottled drinking water in East Africa (Dahlberg, 2017), the two companies were specifically selected for their unique business models and explicit social oriented missions. The two selected companies highlight the ethical complexities of fresh drinking water provision in an emerging market setting. Bottled water is traditionally an expensive product and companies like Coca Cola’s Dasani brand, have often been criticized for creating markets for bottled drinking water in areas plagued with water quality and supply issues (Brei and Böhm 2011). DWL and Jibu are both socially oriented in their mission yet take a different delivery approach. Unlike traditional bottled water companies, Jibu and DWL seek to only use reusable bottles to minimize plastic waste.
DWL is a water company based in Mtwapa, Kenya founded in 2006 through a partnership and investment from two Dutch firms: Hatenboer and Reikon. DWL provides bottled drinking water to three Kenyan counties (Kilifi, Kwale, and Mombasa) in the region surrounding Mombasa. DWL’s core low cost product is a 10L reusable jerry can. DWL’s distribution model is to sell to small shops in the area through water delivery on tuk-tuks.
Jibu, LC3 (Low profit liability company) is an American founded “benefit corporation” selling low cost bottled drinking water in Uganda, Rwanda and Kenya. Jibu was founded in 2012. It started with simultaneous pilots in Uganda, Rwanda and the Democratic Republic of Congo in 2013. Jibu’s declared goal was to find a suitable model to provide low cost drinking water and shift consumers from boiling to bottled water. In 2014, Jibu began with a franchise model in Kigali and Kampala. Water purification is decentralized at each franchise location. Purification is done with ultra-filtration technology designed specifically for the conditions in each city. Franchises purify city water and package it into various sizes of reusable bottles.
While DWL has the social mission of providing affordable drinking water, it also has the dual goal of running a financially sustainable business. In the beginning of 2016, due to changes in tax law, DWL had to adjust its business activities to accommodate a sharp increase in excise taxes on water. Although all competitor manufacturers of bottled water were initially affected by the excise tax increase, DWL is the only company that fully complied, meaning that water prices for a 10L jerry nearly doubled and DWL now offers a much higher priced product than competitors.
Jibu provides a contrasting case study in the consumption of bottled water. Due to Jibu’s social benefit corporation status, the company aims to provide the lowest cost refill prices for bottled water in their areas of operation. A social benefit corporation is a relatively new business designation that allows businesses to incorporate a social mission explicitly into their strategy, allowing them to accept different types of investments and zero margins 7 . Jibu consumers pay a relatively high bottle deposit fee, then a low refill price. In some cases, because profit is not the only motive of Jibu, they accept zero margin on their refill prices to maintain the lowest cost water.
Sampling
Sampling for the two companies was done using stratified random sampling to account for demographic differences in the geographic areas of operation for the two companies. In both cases randomization occurred at the sales area (DWL) or zone level (Jibu) where demographic characteristics would be similar rather than randomly selecting consumers from the entire population. This insured that the overall sample was representative of DWL and Jibu consumers.
Jibu conducted phone interviews with their consumers based on lists of loyal customers collected from each franchise. Jibu divides their cities into zones, which are based on population density. Consumers were randomly selected from the given lists according to the percentage of sales in each zone. Jibu conducted data collection in December 2016 (Rwanda) and March 2017 (Uganda). The DWL questionnaire was based on Jibu’s questionnaire for consistency between the three countries. There were 19 and 20 zones in Rwanda and Uganda respectively. The majority of sampling occurred in Jibu zones within Kigali and Kampala, but some consumers were sampled from franchises in Busenyi (North western Rwanda), and Entebbe (near Kampala-Uganda). These areas are also mostly urban like Kigali and Kampala. In addition to Jibu’s consumer survey, we collected similar data on Jibu non-consumers in May 2017. Non-consumers were randomly interviewed at Jibu micro-franchise locations.
Data collection in Kenya was done in March 2017. DWL’s main factory is in Mtwapa in Kilifi county. From there water is distributed to six distribution points located in the three counties of operation. At each of the six-distribution points and the main factory there are sales areas. Sales areas represent the routes the water is distributed along using auto rickshaws. In each sales area there are DWL vendors, usually small kiosks that sell DWL and other water brands, along with general products. According to DWL, there are roughly 5,000 vendors in Mombasa, Kilifi, and Kwale counties. Out of the 5,000 vendors, 112 were randomly selected for our study. At each vendor three consumers and four non-consumers were interviewed. During test surveys it was discovered that it can be challenging to locate consumers, therefore selection was based on proximity to the vendor.
Consumers were determined by their response to the question: “When did you last purchase DWL/Jibu water?” Respondents who purchased DWL/Jibu water in the last year were considered consumers. Figure 1 gives an overview of the survey respondents and selection criteria. In Kenya, we have a sample of 326 consumers, the Rwanda sample consists of 292 consumers, and the Uganda sample of 188 consumers.
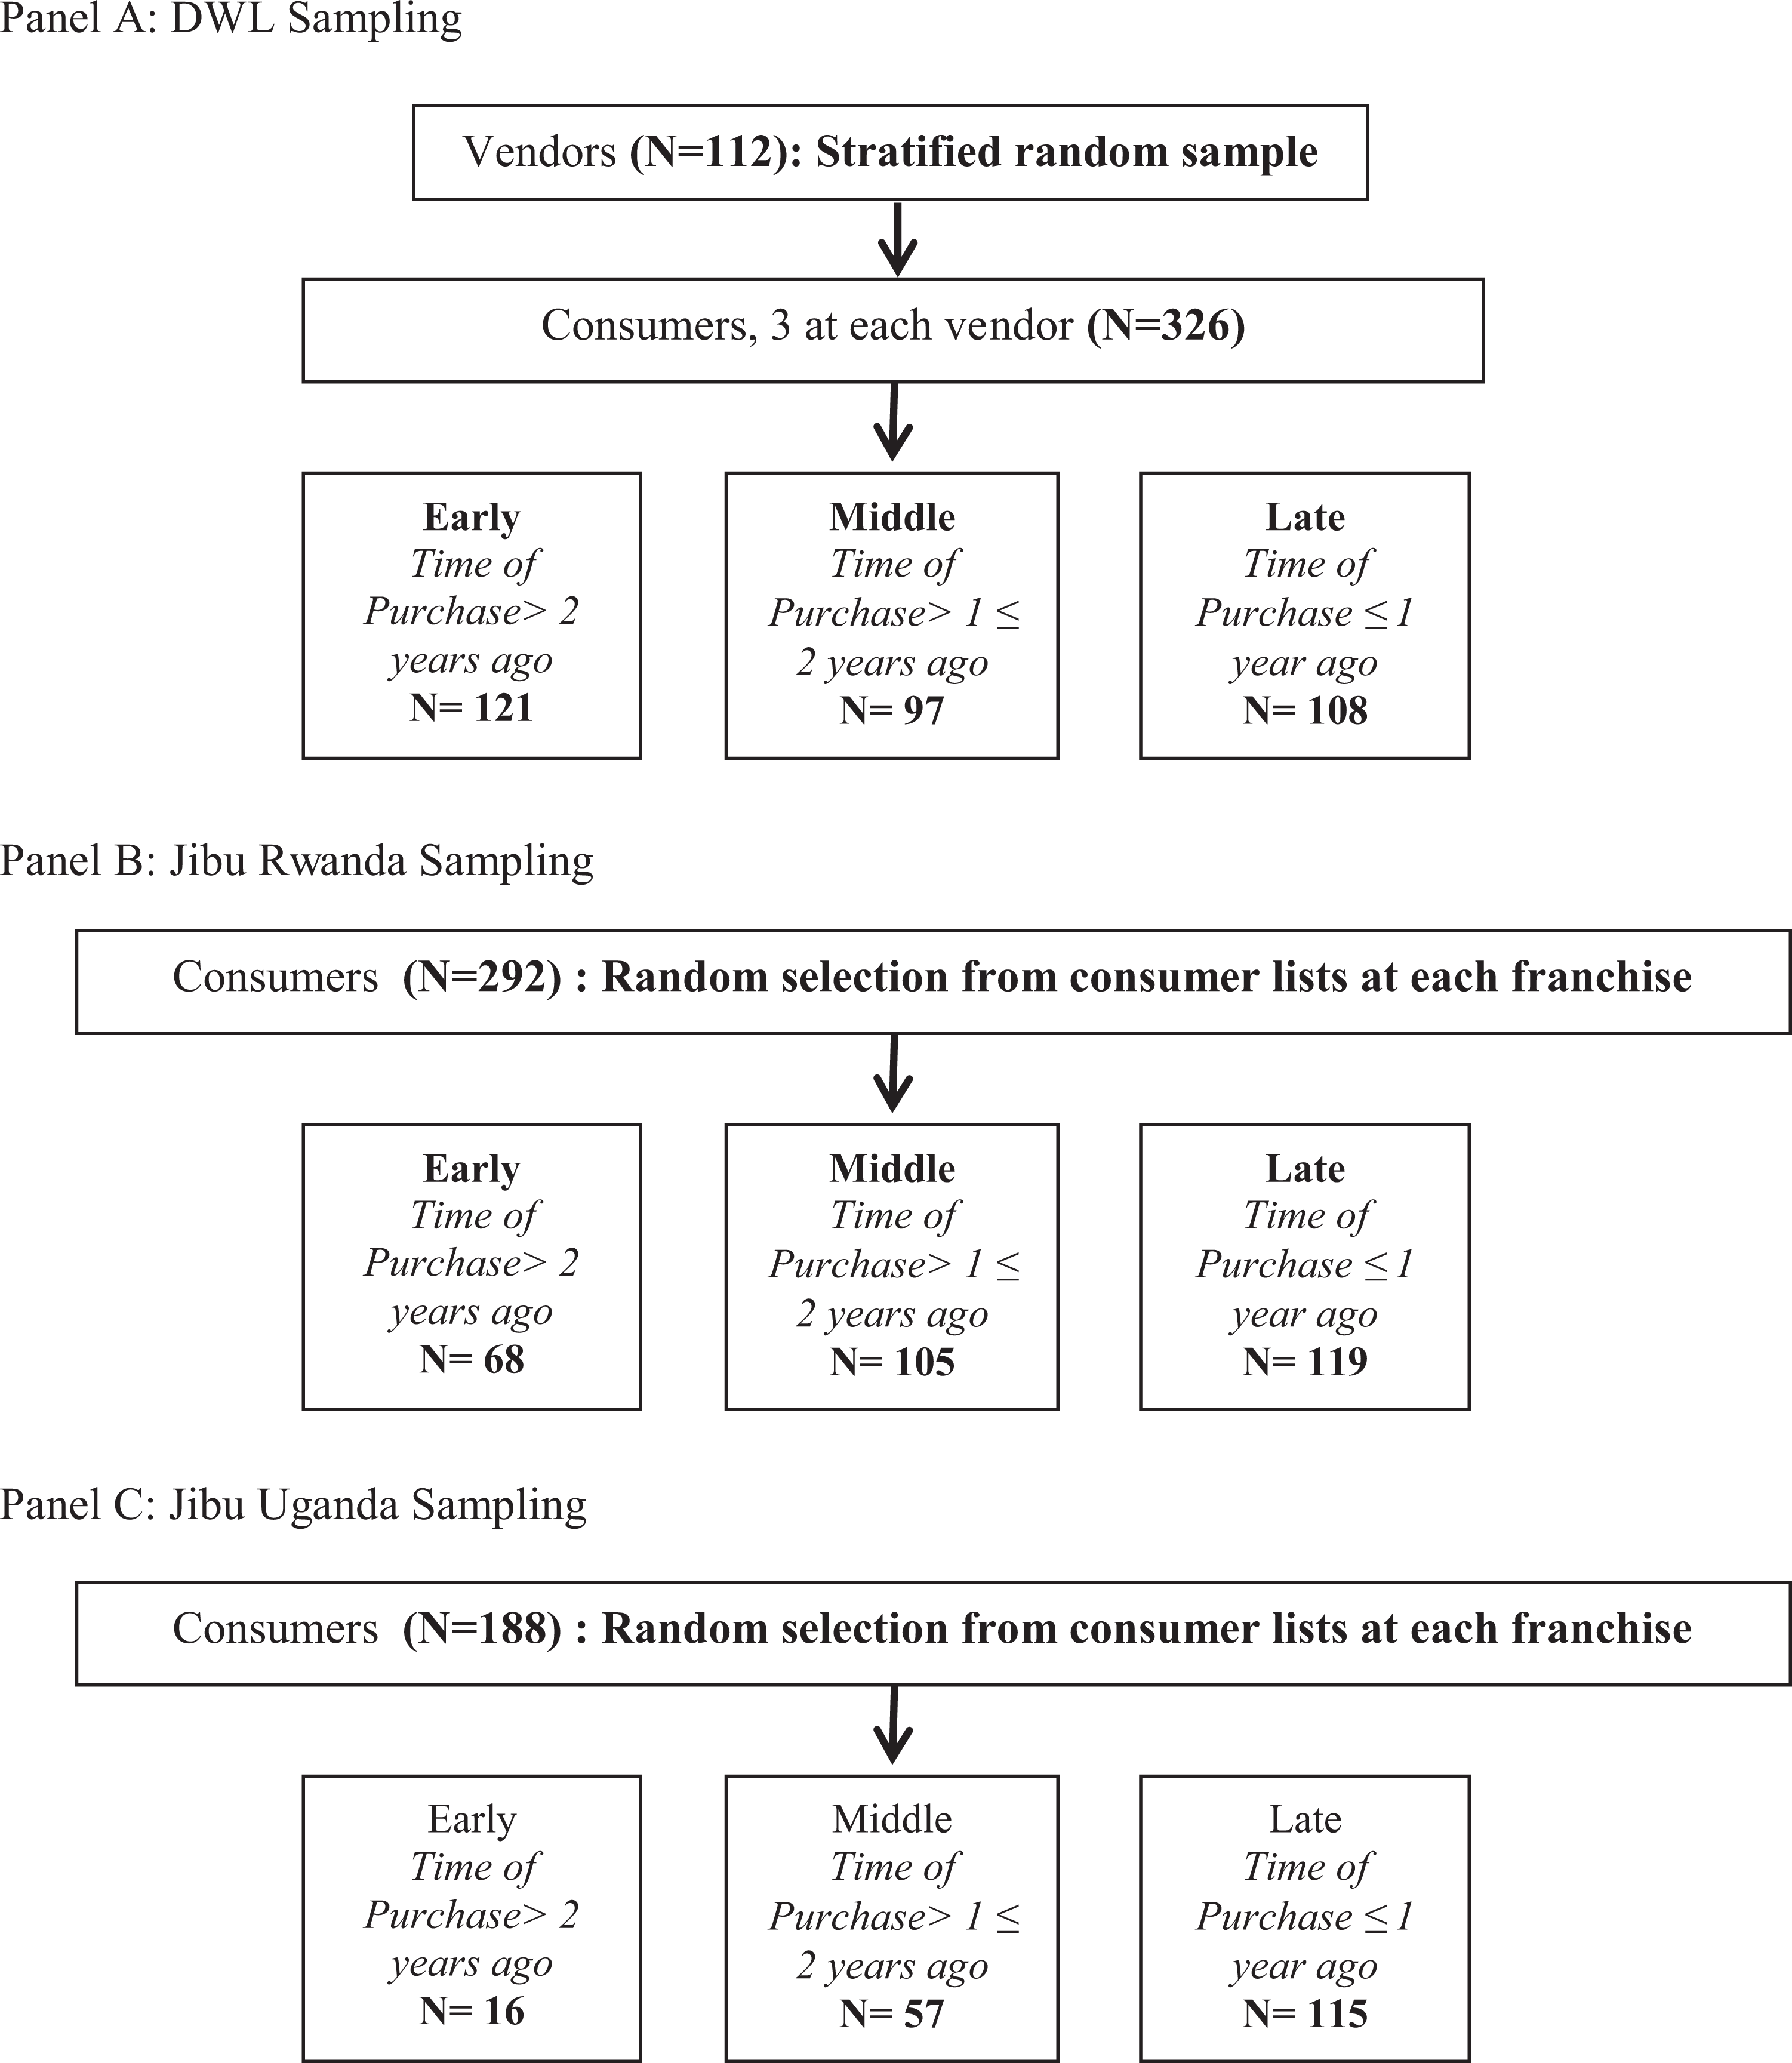
Sampling in the three countries.
Data and Empirical Model
Variable Description
The focus of the study is exposing consumer heterogeneity, therefore consumers were divided into three categories based on their time of first purchasing DWL or Jibu water. The dependent variable is the consumer category. Jibu data was based on a company survey and the questionnaire used for DWL was based on Jibu’s survey. The categories of consumers are as follows: (i) Early consumers (first purchase greater than 2 years) (ii) Middle consumers (first purchase between 1 and 2 years) and (iii) Late consumers (first purchase from 1 year to present).
To ensure comparability across the empirical analyses of the three datasets only variables that were measured in all three datasets were included. In the first specification, only control variables were included: the gender of household head which is a binary variable that is equal to 1 for male and zero otherwise, and the Progress out of Poverty Index (PPI). Chikweche, Stanton, and Fletcher (2012) discuss the role of decision maker and purchaser gender in African households. The PPI score does not measure wealth directly but can be viewed as an asset index. A score is assigned to every respondent based on his or her response to a set of ten questions related to assets and household demographics. 8 The PPI allows us to empirically represent the local context of each country since the questionnaire differs from country to country. It should be noted that the PPI score is updated regularly based on new household surveys conducted in each country. For Uganda the 2012 survey was used, for Kenya 2005, and for Rwanda 2005.
The next three specifications add the independent variables: education, local information and external information. education which consists of two binary variables, one for secondary education and one for higher education. The excluded category is made up of individuals with primary or no education. Local information measures whether the individual had received personal information about the bottled water under study either through a company representative or personal recommendation from a friend or relative. The fourth specification adds the independent variable of a purposeful search for clean water which represents the external information search. A table detailing the different variables, what they proxy, and their literature motivation is presented in the appendix (Table A1).
All specifications contain controls for the location of the sales points to capture differences in infrastructure and market settings across the different sales points that are likely to affect the decision and timing of uptake of bottled water. Note that both companies entered different sales areas/zones at different points in time. Therefore, it is necessary to control for these regional differences. The location specific effects control for differences in local infrastructure, local embeddedness, and local context within each sub-market is represented by the different sales areas/zones. This takes the work of Ernst et al. (2015) on local embeddedness a step further. Table A2 in the appendix shows the relative frequencies for consumer categories per sales area/zone, demonstrating that there is significant variation across sales areas by consumer category. For example, there is a higher relative frequency of respondents in the late category for Kilifi as compared to early consumers because Kilifi is an older market area for DWL. Similar relative frequencies can be found for the Jibu zones depending on the entry of the company into the respective zone.
Empirical Model
With the empirical analysis we want to assess the heterogeneity across consumers by analyzing the determinants of the timing of initial consumption across our three consumer groups.
Before studying within consumer heterogeneity, we start out with a comparison between consumers and non-consumers to set the stage. Standard innovation diffusion literature compares consumers with non-consumers through a probit or logit model (Geroski, 2000). We employ the logistic function to model a binary dependent variable, i.e. the decision to consume bottled water. For every individual i in location l we estimate the following model:

where Yil is equal to 1 for consumers and Xil contains the control variables of interest, i.e. gender of the household head, the education level, an asset index, and location specific effects. We limit the analysis to this small set of predictors since we are mainly interested in purchase decisions related to education, economic wellbeing and easy access to the water, i.e. being near to the bottled water supply. Standard errors are clustered at the location level. Imposing the logistic transformation, we obtain a model that is linear in its predictors. The model is fit by maximum likelihood.

The outcome of interest (dependent variable) is the category in which the consumers fall based on their timing of initial consumption: (i) early consumers, (ii) middle consumers, (iii) late consumers.
Technically our outcome of interest can be viewed as an ordinal variable. At the same time, the distance between categories is not a measure of actual distance. We cannot “rank” the categories such that we could say late consumers are more important than early ones. The different consumer groups merely represent the different points in time when the consumers started purchasing bottled water. Therefore, we decided to employ a multinomial logistic regression model, which extends the logit model to a multiclass analysis without taking the ordering into account. For every class we estimate the effect of the predictors on the probability of success in that class compared to the reference class. Each class has its own intercept and regression coefficients meaning that the predictors can affect each category differently. 9 We predict the probability that individual i from location l falls into consumer class k with k = 1,2,3. Since we have 3 possible outcome classes, we run two binary logistic regression models and treat the third class as reference against which we regress the other classes. We can write the probability for every consumer i in location l falling into one of the k consumer categories as a set of two independent probabilities:
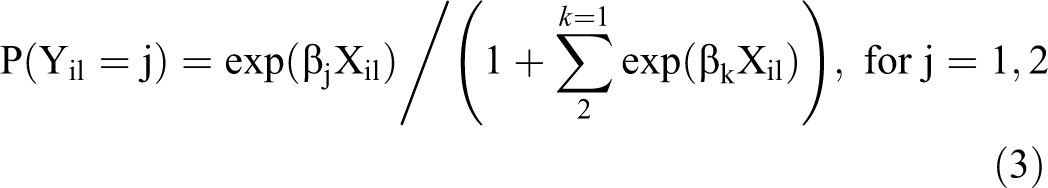
Similarly to the basic logit model the above probability employs a linear predictor function for every consumer i in location l falling into consumer category k we can specify it as follows:
where the vector βk
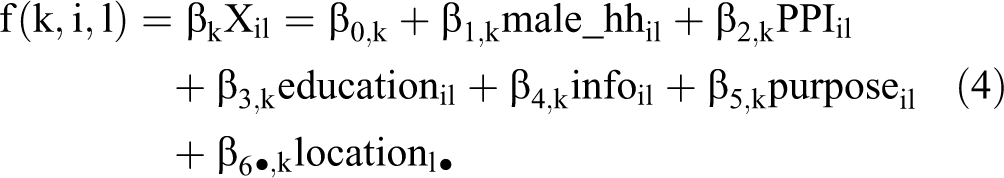
collects all regression coefficients associated with the kth outcome; Xil
contains the control variables. We control for gender of the household head (male_hhhil
), an asset index (PPIil
), the education level (educationil
), receipt of local information about bottled water (infoil
), an external information search for it (purposeil
) and location specific effects (locationl
Since the coefficient estimates of a multinomial logit model cannot be directly interpreted, the marginal effects were computed and are presented (Cameron and Trivedi 2009; Wooldridge 2016).
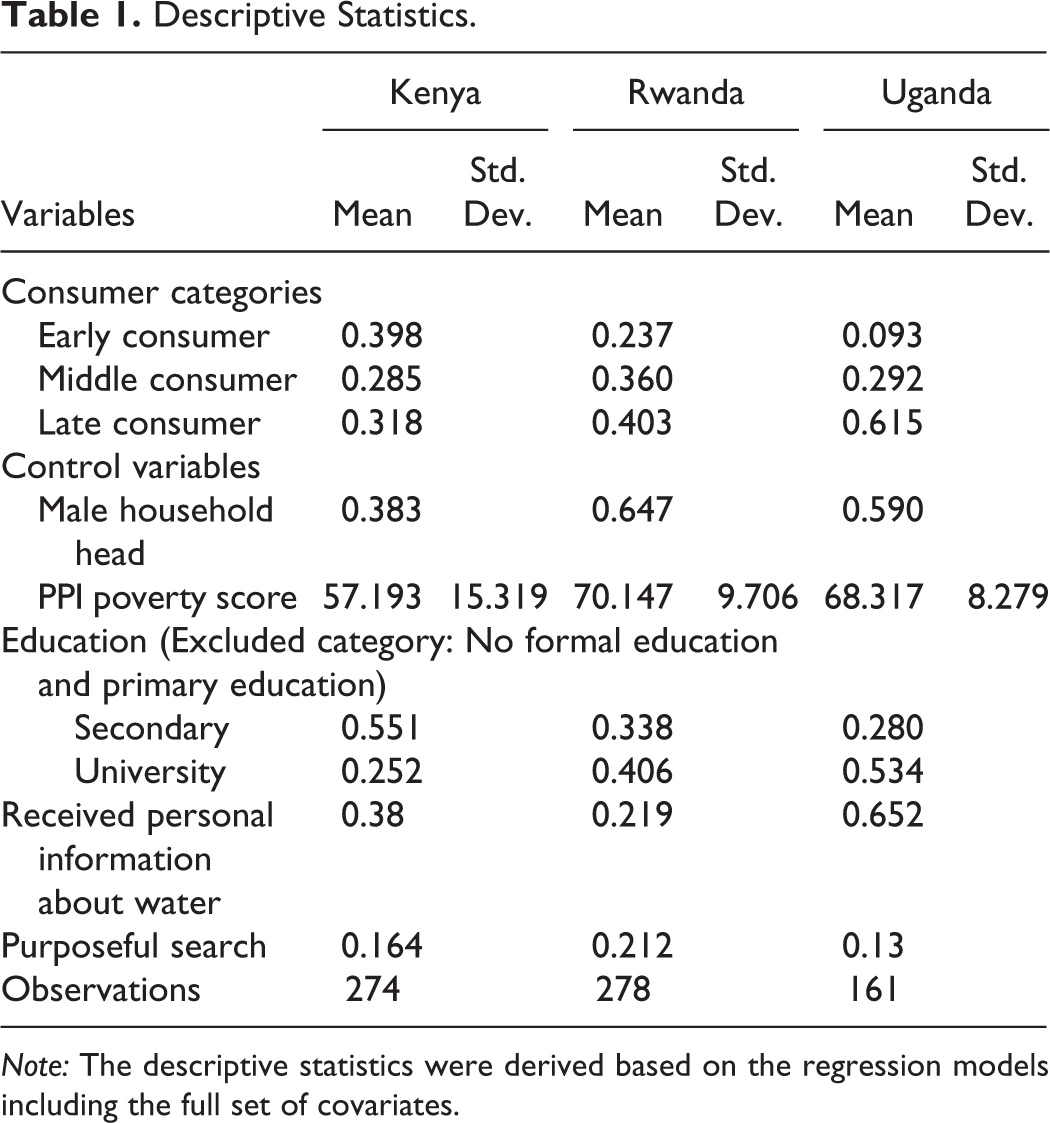
Descriptive Statistics
Descriptive statistics for all three countries are presented in Table 1. DWL entered the market in 2006 so the early consumer category makes up a larger percentage than for Jibu Uganda and Rwanda. Almost 40% of DWL consumers are early consumers with a fairly even split in the middle and late categories. The opposite is true for Jibu due to their market entry in 2014. For Jibu Rwanda 40% of consumers fall in the late category, and for Jibu Uganda 61%. Jibu Uganda only has 9% of consumers in the early category whereas there’s a more even split for Jibu Rwanda between the early and middle categories (24% and 36%). There is stiff bottled water competition in Uganda, so it is possible that the customer lists in Uganda represent more recent Jibu consumers.
Descriptive Statistics.
Note: The descriptive statistics were derived based on the regression models including the full set of covariates.
Concerning the characteristics of the consumers there are some demographic differences between the three countries. The majority of DWL consumers have an education level of secondary (55%). One quarter of the DWL sample is university educated. Education levels are even higher for Jibu consumers, with 40% (Rwanda) and 55% (Uganda) of consumers being university educated. This finding indicates already that both companies are not reaching the intended BoP consumers, which are more likely to be those with no or limited education. Turning to gender, a lower number of DWL consumers were both male and the household head (38%) than Jibu (65%-Rwanda, and 59%-Uganda). Looking at how consumers received information about DWL and Jibu shows that most (38%) consumers received information about DWL through personal interactions (i.e. a friend or a DWL sales representative) with the remaining consumers either purchasing because of a purposeful search for clean drinking water or an impersonal source like an advertisement. For Jibu the source of information varied between countries. In Rwanda 23% of respondents received personal information about Jibu versus 65% for Uganda. A purposeful search for a new affordable clean drinking water brand was highest for Rwanda consumers (19%) compared to Kenya and Uganda (16% and 13% respectively). Finally, looking at the asset index as a proxy for wealth of the consumers across the three countries using the PPI score shows that the average PPI score is at least ten points higher for Rwandan and Ugandan consumers (70 and 68 respectively) compared to Kenya (57). Note that higher PPI scores can be used to indicate higher levels of wealth. The difference in average PPI score could be due to the sampling differences (for Jibu mostly loyal customers were interviewed) but also due to geographic differences since Jibu is located in the capital cities of Uganda and Rwanda where wealth is likely higher than on the Kenyan coast.
The distribution of the PPI score is fairly spread for Kenya and more skewed to the right for Uganda and Rwanda, i.e. the scores fall toward the higher side of the scale and there are very few low scores (Figure 2). Figure 2 shows that DWL has a larger spread of income levels in spite of having the highest water prices in the coastal region. Using a cut off of $2.50/day (Prahalad 2005), 42.6% of DWL’s consumers could be classified as low income. However, a greater percentage would be considered middle class ($2.50-$8.44/day) and above. In contrast to DWL consumers, both Jibu Uganda and Rwanda consumers make up a higher income demographic. The majority of both country’s consumers would be considered middle class or higher. The wealth and education related findings are interesting since Jibu is a social business that has an explicit mission statement targeted at the BoP. The descriptive statistics already suggest that they might not reach their targeted audience.
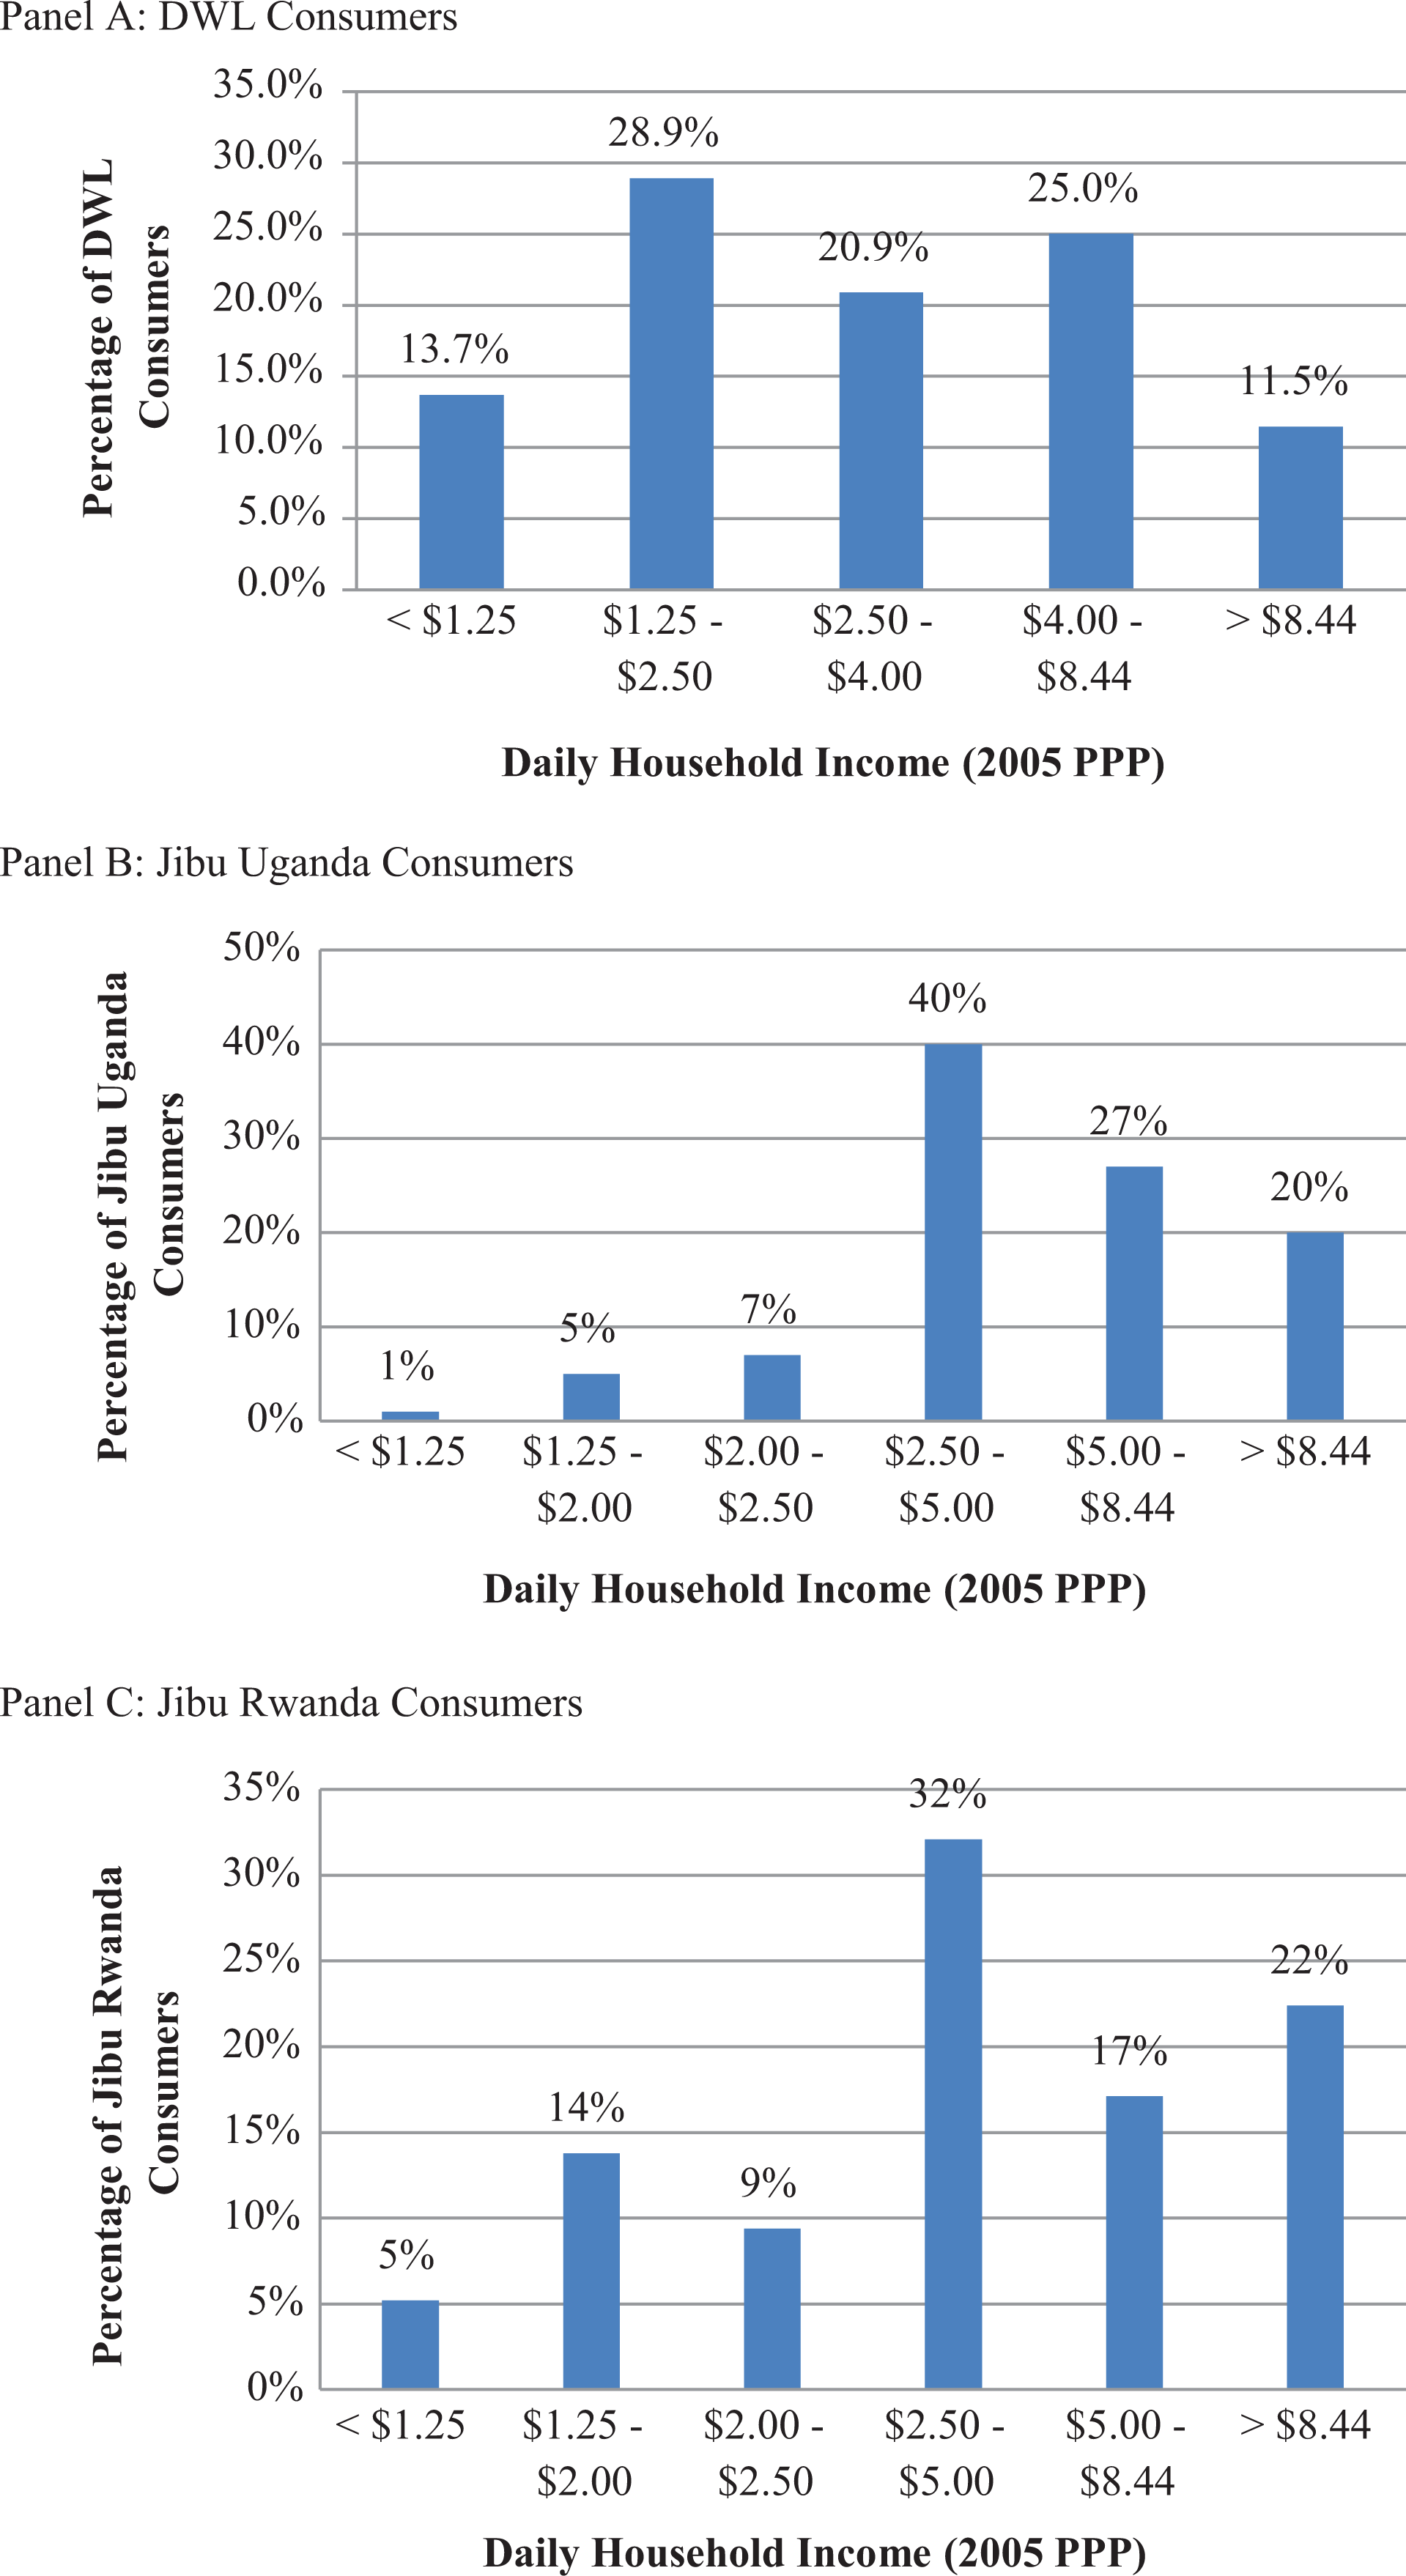
Income distribution of consumers.
Results
The first analysis is the estimation of a logit model of consumers versus non-consumers of the two companies. The logit model of consumers only is given in the Appendix (Table A3) and highlights the reason for only focusing on consumers of the two companies. Because not all non-consumer data was available for Uganda the logit was only conducted for Kenya and Rwanda. Additionally, there was no data available for the household role for Rwanda, so instead of the male household head variable simply respondent gender was used.
The logit results presented in Table A3 in the appendix show two findings that help strengthen the argument to further break apart the consumers of the two companies. First, the results differ between the two countries. In Rwanda, male respondents are more likely to purchase water, and those with a university education are more likely to be Jibu consumers. Additionally, for Jibu consumers, using the asset index, wealthier consumers are more likely to purchase Jibu water. The results are different for Kenya. Gender and wealth have no influence, rather DWL consumers are merely more likely to have a higher level of education (secondary or university). Therefore, understanding the heterogeneity within consumers and between countries is the focus.
The results of the main multivariate analysis are presented in Table 2 for each category of consumer. The middle category was used as the base category but the full regression results are presented to highlight the differences between the three consumers categories. Four specifications are presented for every country. They all contain location fixed effects to account for the fact that DWL and Jibu entered different areas at different points in time.
Empirical Results of Determinants of Consumption of Bottled Water in Kenya, Rwanda and Uganda: Multinomial Logit Estimates.
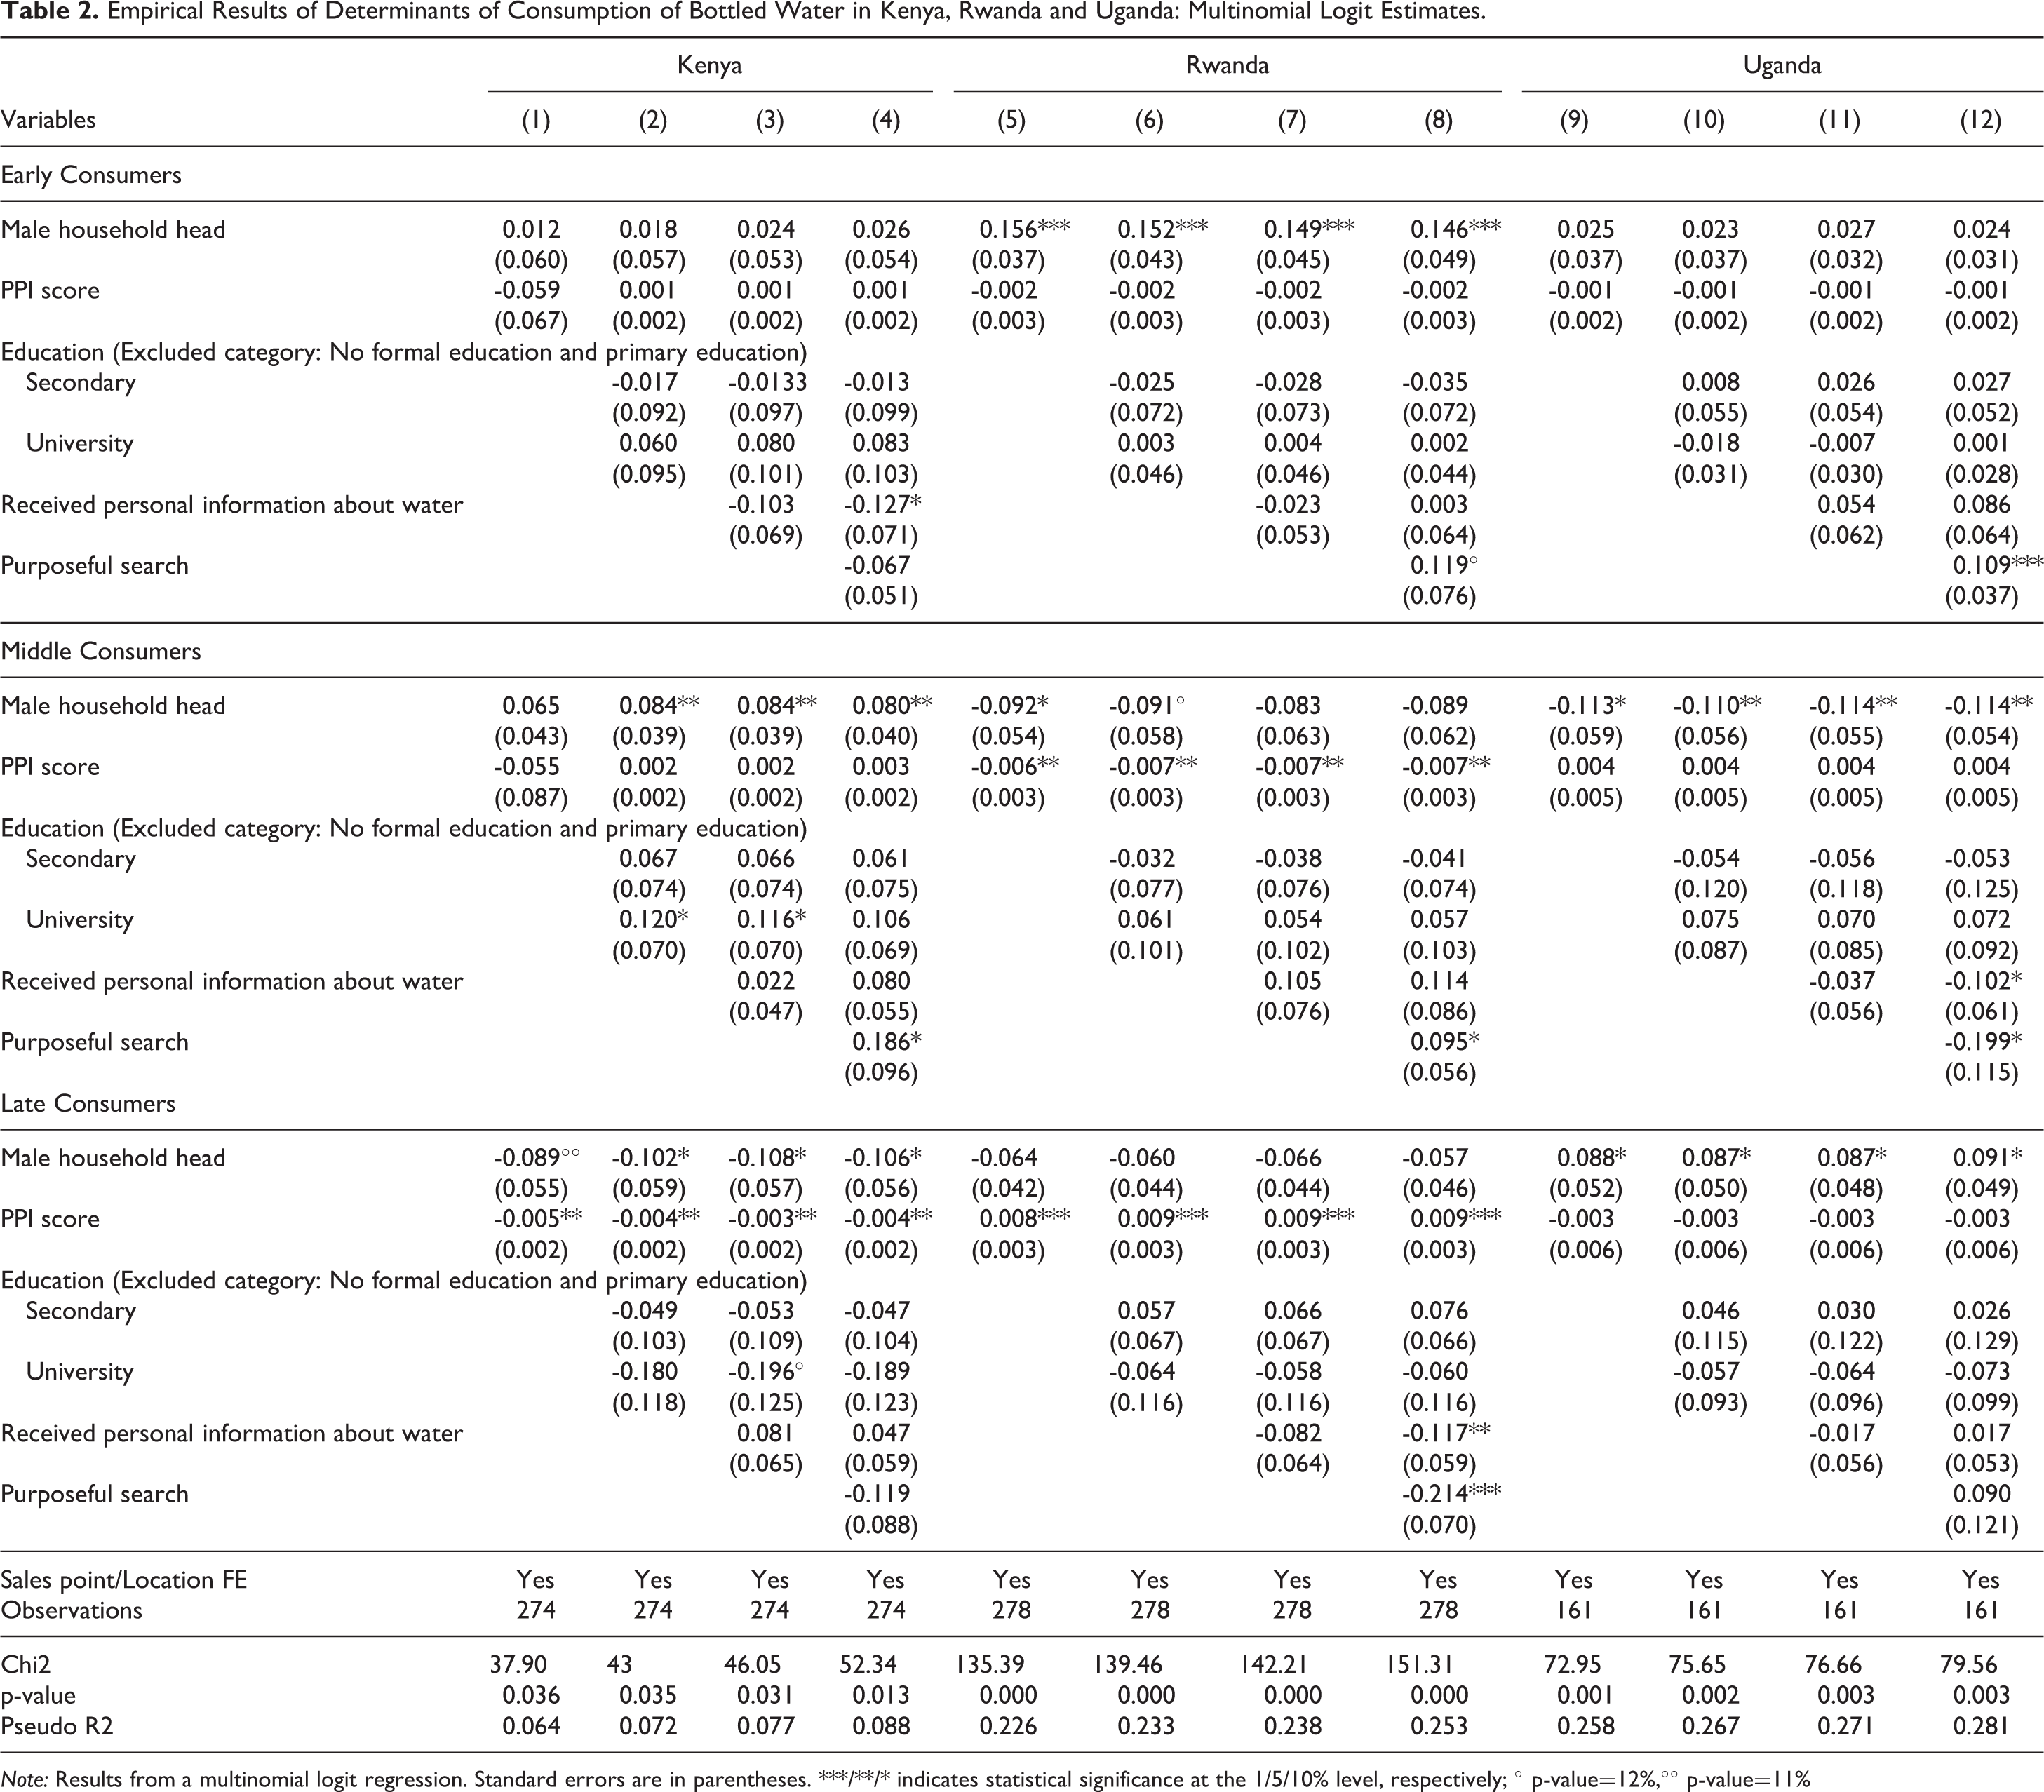
Note: Results from a multinomial logit regression. Standard errors are in parentheses. ***/**/* indicates statistical significance at the 1/5/10% level, respectively; ° p-value=12%,°° p-value=11%
Specification 1 focuses on the socio-demographic determinants, ie: wealth and gender. For Jibu Rwanda consumers, early consumers are about 15 percentage points more likely to be male household heads. In Uganda, an opposite effect is shown with middle consumers being less likely to be male by 11 percentage points and late consumers being more likely to be male by about 9 percentage points. The result does not show up for Kenya, which could be due to cultural differences between the three countries. Additionally, note that overall Kenya had a lower percentage of male household heads (38%) than Rwanda and Uganda. However, the existing literature also suggests that women household heads may be less likely to be risk taking in consumption decisions (Byrnes, Miller, and Schafer 1999). Finally, it is important to note that the Rwanda dataset had the highest percentage of male household heads (65%).
Looking at wealth as measured by the asset index PPI score, overall wealth does not determine consumption decisions in all countries. For Kenya and Rwanda there is an economically small wealth effect for late consumers. For both countries wealthier respondents are less than 1 percentage point less likely to be late consumers. Since the wealth effect, if identified at all, is very small, these results suggest that wealth cannot be considered an important driver in timing of purchase. Considering that DWL nearly doubled their water prices during the period of time for late consumers, the individuals who we identify as late consumers do not have income as a binding factor to consumption. Overall specification 1 neither supports nor disproves that DWL or Jibu reaches poor households. But taken with the descriptive statistics, the findings suggest that neither company are reaching BoP consumers. This result is particularly relevant for Jibu since Jibu income data suggests that Jibu consumers are at a higher end of the income spectrum.
In the next step (Specification 2), the effect of education is assessed. There is a small education effect for the middle and late consumer categories of DWL. For two of the specifications in the middle category of DWL consumers, having a university education increases the chance of being a middle consumer by almost 12 percentage points. However, the education effect does not show up for Jibu consumers. But it should be noted that Jibu consumers are on average even higher educated compared to the DWL consumers. Due to a relative lack of variation in education among Jibu consumers we are unable to identify an education channel for Rwanda and Uganda. This could be due to sampling issues and demographic differences between Jibu being located in capital cities and DWL in a less educated and less urban region.
In specification 4 we added information related variables, namely whether the consumer received local information about DWL/Jibu and whether the consumer searched for bottled water on purpose. Rwandan consumers receiving local information are less likely to be late consumers . In Kenya early consumers were about 13 percentage points less likely to have received local information. Finally in Uganda, consumers in the middle category were less likely to have received local information. This result fits with the market situation in Rwanda. Jibu entered the market when there was already a well-established market for bottled water, suggesting that early consumers would have purchased due to curiosity and not through local information.
Looking at the consumption decision being made as a result of a purposeful search for drinking water alternatives shows a few interesting results. For Uganda, early consumers were 10 percentage points more likely to have conducted a purposeful search. A nearly significant (p = 12%) similar result is shown in Rwanda with early consumers being 11 percentage points more likely to conduct a purposeful search. For the middle category of consumers in Uganda and Rwanda, opposite effects are shown. Uganda middle consumers are less likely to have been purposefully searching for water (20 percentage points) and in Rwanda the middle consumers are slightly more likely to conduct a purposeful search. Finally, Rwandan late consumers were more than 20 percentage points less likely to have been purposefully searching for water. In Kenya, purposeful search only showed up significant for consumers in the middle group with those purchasing due to a purposeful search being 19 percentage points more likely to be middle consumers. For DWL consumers, in the last year before data collection water prices doubled, which means particularly for late consumers the reasons to purchase DWL water may have changed.
The most important finding is related to the supply side dimension of consumption and is disguised in the tables presented. Across all empirical models we include location fixed effects. The coefficients associated with the location fixed effects tend to be large in absolute terms and are jointly statistically significant (p-value < 0.000) suggesting that it is location characteristics that are the most important determinants of the consumption of bottled water. Since, the two companies entered the different sales areas at different moments in time, the location fixed effects also include market entry and suggest that the strongest determinant of uptake is the timing of market entry. This finding shows that at the BoP, due to the many constraints the individuals and households are facing, the likelihood of demand driven consumption is limited.
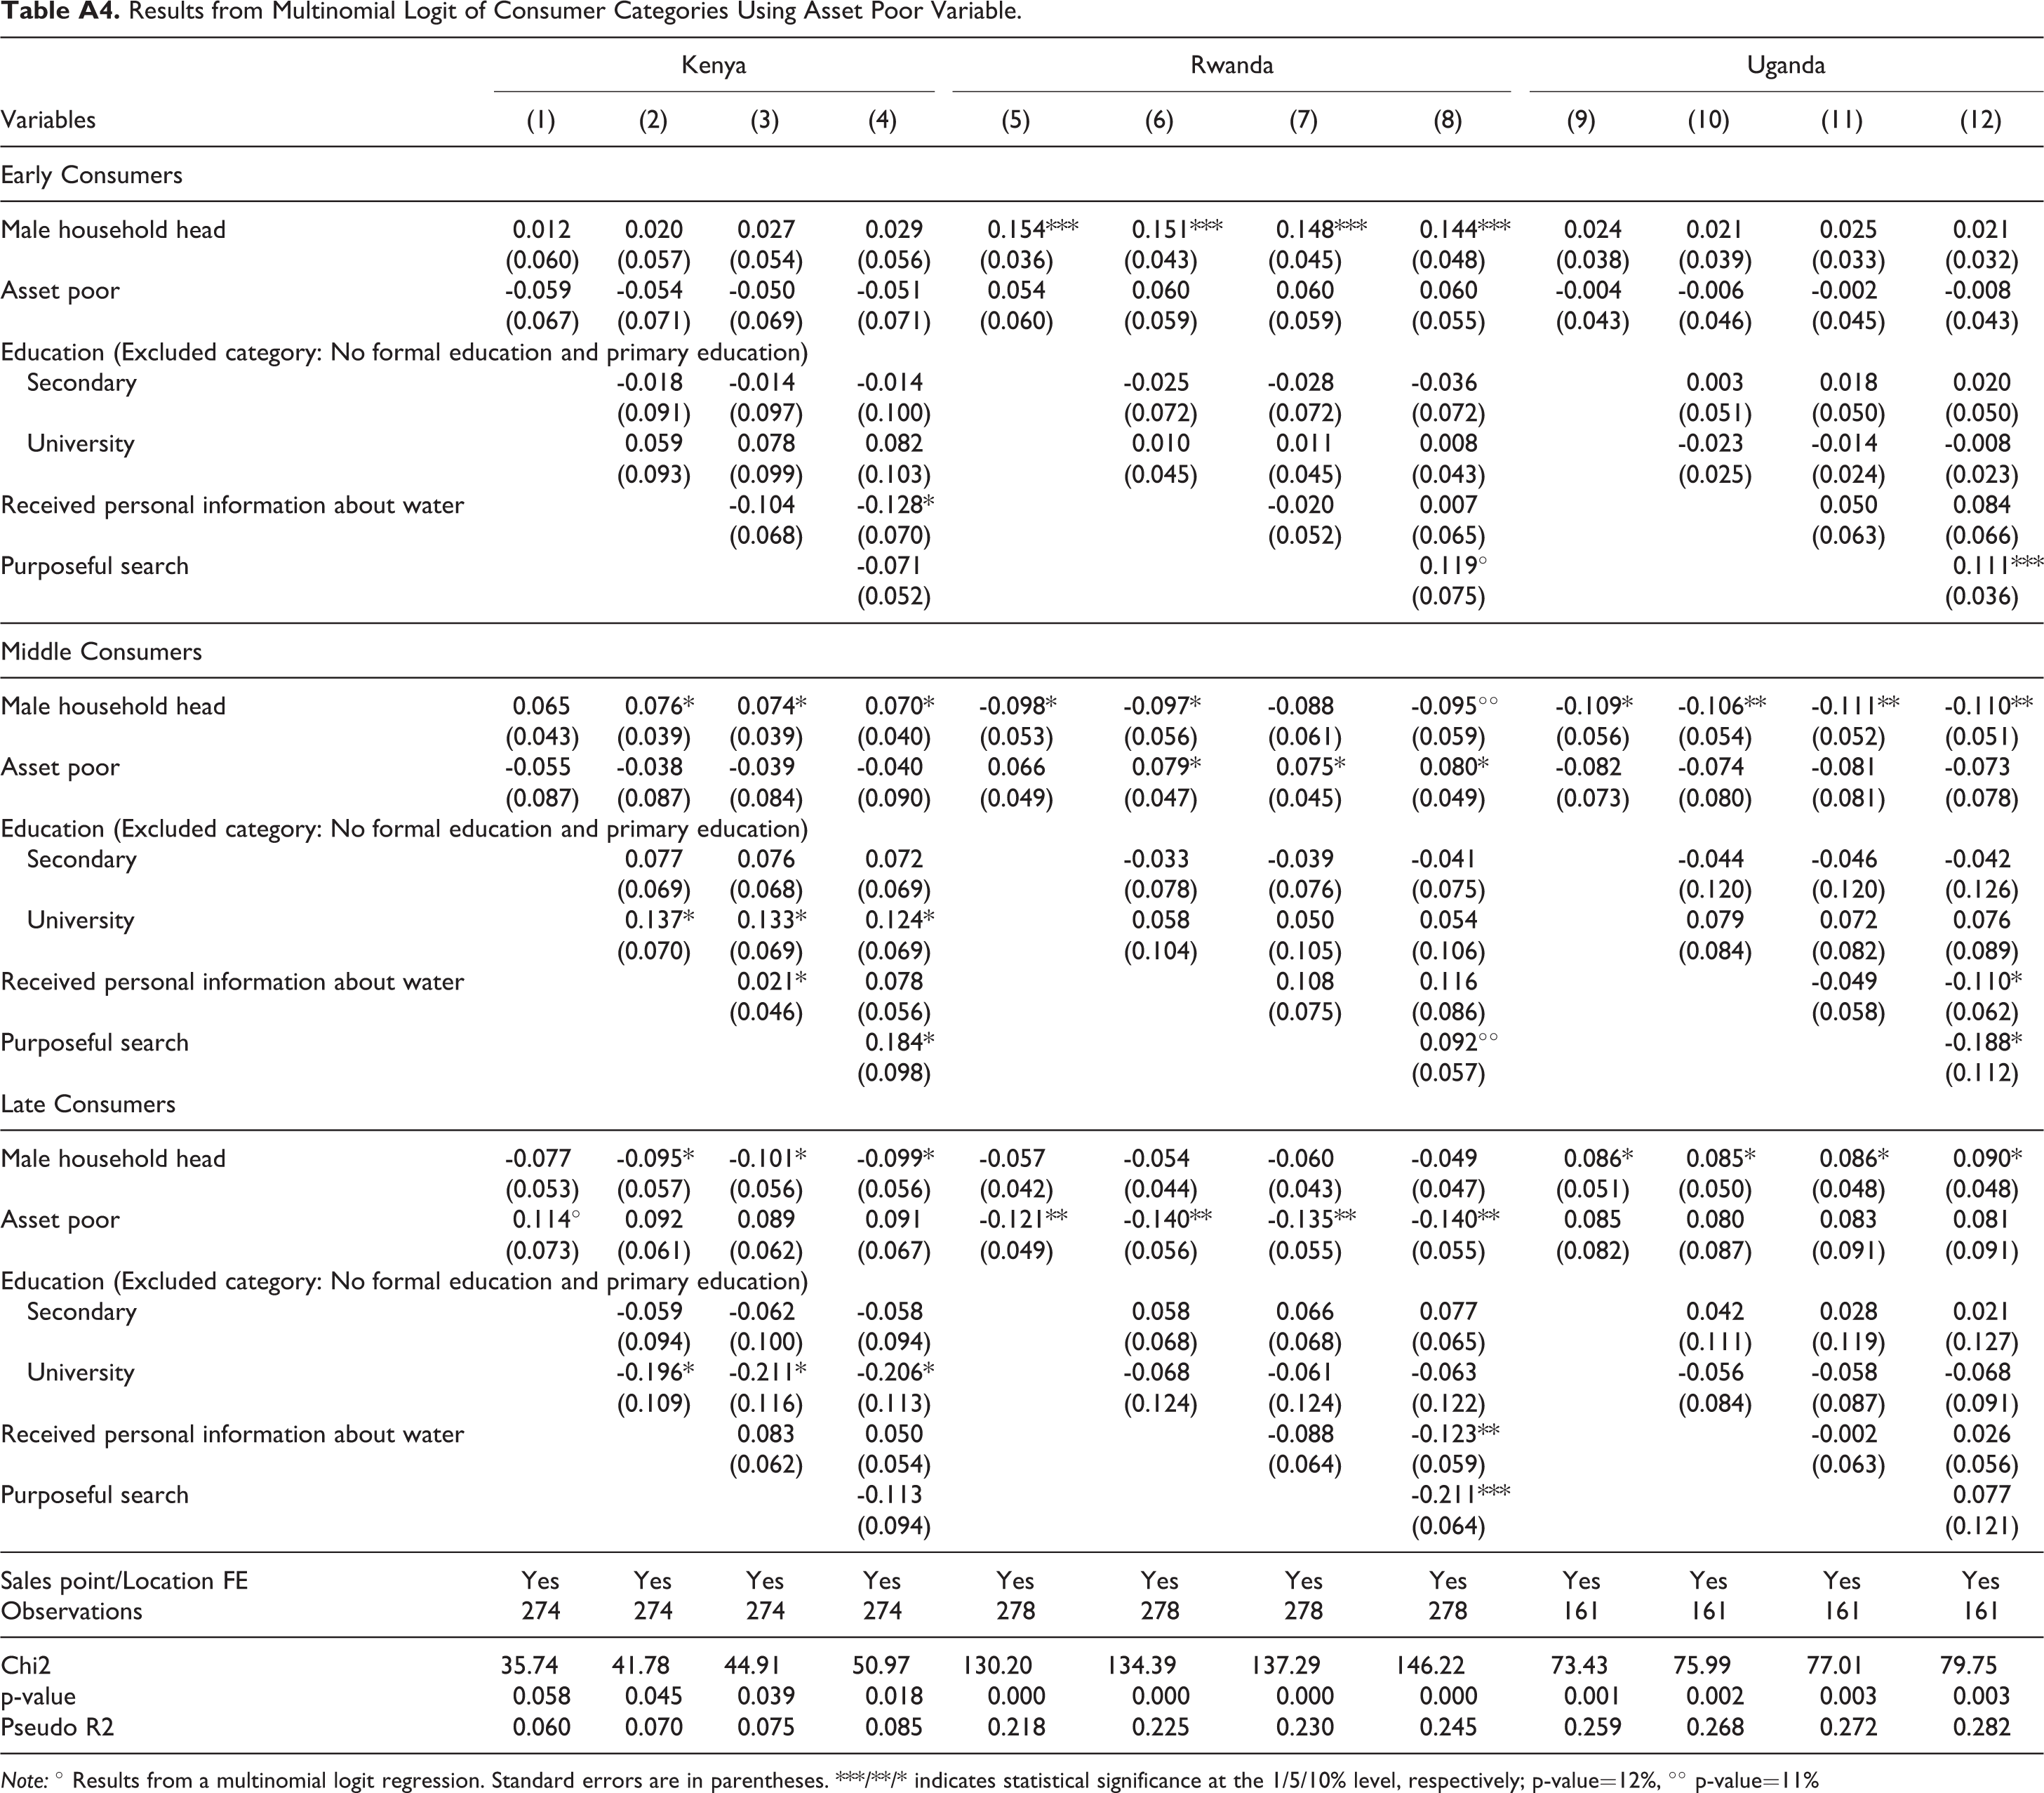
Concerning the reliability of our results across specifications, Table 2 shows that there is stability of the coefficient estimates across models. The stability of the coefficients suggests that the identified pathways are meaningful and not driven by omitted variables that might appear in the specifications with a limited number of control variables. Secondly, as a further robustness check the PPI score was divided into two categories by using the median PPI score for each country dataset to construct a binary variable “asset poor” (1 = poorer group, 0 = higher group). These results are presented in the Appendix and show consistency with the main results in terms of coefficient signs and values.
Discussion
The regression results presented several insights regarding consumer heterogeneity and some differences from the initial hypotheses. The first hypothesis regarded the role of education in the timing of purchase. It was hypothesized that those with a higher level of education would be more likely to be earlier consumers. Those with a higher level of education will have higher knowledge of the health impacts of unsafe drinking water. Because of the already high levels of education of Jibu consumers there was no education effect for Jibu consumers in Rwanda and Uganda. However, the consumer logit model did show that higher educated individuals were more likely to purchase Jibu water. Considering that in Rwanda and Uganda in particular most individuals were already using either treated or bottled water, this result suggests that Jibu water might be considered higher quality by “higher” status individuals. In Kenya, there was an education effect for middle and later consumers. University education decreased the chance of being a late consumer, suggesting that earlier consumers could be considered “higher” status individuals (in terms of education and knowledge about clean drinking water). University education also increased the chances of being a middle consumer compared to earlier or later. Ramani, SadreGhazi, and Duysters (2012) also found the importance of education purchase of innovations related to health. Previous studies on bottled water consumption also showed higher education levels increasing the likelihood of purchasing bottled water (Francisco 2014; Quansah, Okoe, and Angenu 2015; Vásquez 2017). Therefore, the education hypothesis was partially corroborated through the Kenya results.
The second hypothesis looked at the role of local information in the timing of consumption. Local information comprised of two components: recommendation from friends and family and being approached by a company representative. Overall local information had minimal effect on the timing of purchase. While prior literature suggests that particularly at the BoP word of mouth information about a product can influence purchase decision (Kotler et al. 2006; Nakata and Weidner 2012), our results show minimal effects from local information. This could be possible because of two reasons. Firstly, for consumer to receive information through word of mouth enough consumers need to be aware of the product, which will not be the case if it is a new product. So, word of mouth may not lead to early purchase but rather to late purchase when sufficient number of consumers know about it and can spread the word. Secondly, the minimal and mixed effects may be due to the features of the markets under study. The last category of consumers for Kenya were those who first purchased when DWL water was increased sharply and was the one of the highest priced in the market. Therefore it is expected that these consumers would be purchasing for different reasons than earlier consumers. For Jibu consumers, most of them were already using treated or bottled water indicating that they were already aware of the health benefits of clean drinking water.
The last hypothesis looked at the role of external information search. It was expected that consumers who engaged in a purposeful search for a clean drinking water alternative would be earlier consumers. We were able to partially corroborate this hypothesis. In both Uganda and Rwanda, early consumers were more likely to have engaged in a purposeful search. For the consumers who purchased later the results were mixed. Because Jibu is new to the market in both Uganda and Rwanda and therefore consumers in these markets are already familiar with bottled water, it fits that earlier consumers are those who are curious about drinking water alternatives and are seeking out another water source. In Rwanda, we also saw that late consumers were less likely to be purposefully searching for water.
While wealth was not included in our conceptual model and merely used as a control variable, the results also suggested that both companies are not reaching their target demographic. The results fit with literature criticizing western firms who seek to achieve social missions like reaching low income consumers and suggest that firms like DWL/Jibu are often reaching consumers at the higher end of the BoP or middle class (Karnani 2007; Meagher 2018).
Finally, the results emphasized the supply driven side of consumption as backed up by prior literature (Chikweche and Fletcher 2011b; Sheth 2011; Viswanathan et al. 2014). The strongest determinant of purchase was from the location effects, indicating that consumers may purchase based primarily on availability.
Conclusions
To provide clean water is one of the sustainable development goals (SDGs) set out by the United Nations in 2015. Particularly in the African context where infrastructure is still lacking, clean drinking water is often an unfulfilled need that is now creating markets for bottled water companies like DWL and Jibu (Brei and Böhm 2011; Patsiaouras, Saren, and Fitchett 2015). A first step in reaching this goal is to understand the characteristics of consumers living at BoP and the local context they inhabit. Consumers are usually studied as a homogenous source of demand (Kotler et al. 2006; Prahalad 2005; Sheth 2011). In this paper, we shed light on the heterogeneity amongst BoP consumers and highlight features of their local context by comparing three countries and two firms, with the help of a multivariate analysis.
The study contributes to the larger picture of marketing at the BoP by empirically assessing whether the characteristics of early consumers are systematically different from consumers who purchase at a later time. First, the role of formal education on timing of consumption was explored. We have identified that a higher level of education made it less likely to be a late consumer. Higher education levels also likely play a role in purchase of a product like clean drinking water, where education would imply a higher level of knowledge about the health impacts of poor drinking water quality (Ramani, SadreGhazi, and Duysters 2012). By looking at consumers versus non consumers we also saw that higher educated were more likely to consume bottled water which fit with previous bottled water studies. Furthermore, we identified that the information search process plays a role in the decision to purchase.
In contrast, wealth related factors had little to no influence on time of purchase. The consumers under study tended to be wealthier than the average poor person in the countries under study. BoP innovation literature often focuses on low price points as a means to reach low income consumers, yet the results from the DWL and Jibu study suggest that the price might not be low enough for poor consumers to purchase. Prior marketing literature also emphasized that poverty is an inhibitor in participation in a market society (Bonsu and Polsa 2011; Yurdakul, Atik, and Dholakia 2017) which is also suggested by DWL and Jibu’s inability to reach poor consumers. More importantly the sales area effects are strongest in our model, which implies that purchase of bottled water is driven more by supply of bottled water rather than demand. This result also fits with marketing and consumer literature that highlighted how BoP consumers tend to make instantaneous purchase decisions based more on availability of a product than on demand (Chikweche and Fletcher 2011b; Sheth 2011; Viswanathan et al. 2014).
The BoP literature can be divided in two camps. One camp focuses on market development and emphasizes the need to reach the poor consumers (Prahalad 2005; Ramani and Mukherjee 2014; Sheth 2011). The emphasis on poor consumers is in line with our finding that consumption is driven by supply. The other camp criticizes businesses seeking to reach this demographic since they fear the poorest might not be reached or if targeted successfully might be exploited (Karnani 2007, 2009; Meagher 2018). The results of our study highlight a third overlooked aspect in the BoP literature. Companies like DWL and Jibu are reaching more the middle-income category of consumers, not necessarily the very poorest despite the stated mission of reaching poor consumers. Moreover, as exhibited by the differences between consumer categories, consumers at the BoP are not as homogenous as assumed in some of the earlier BoP literature (Guarín and Knorringa 2014). DWL and Jibu are providing a much-needed good to an underserved market, even though they are likely not reaching their original target group.
Future research should continue the quantitative angle on BoP consumers and further explore the rising “new middle class” and the role for western companies in reaching this new demographic. Additionally, to gain a grounded understanding of the heterogeneity amongst the “new middle class” it is critical to understand the behavioral aspects that might trigger consumption and thereby foster the diffusion of clean water at the BoP. An in depth understanding of consumers’ heterogeneous needs is vital for companies marketing to not only the “new middle class” but also the original target – poor consumers at the BoP.
Footnotes
Appendix
Results from Multinomial Logit of Consumer Categories Using Asset Poor Variable.
| Variables | Kenya | Rwanda | Uganda | |||||||||
|---|---|---|---|---|---|---|---|---|---|---|---|---|
| (1) | (2) | (3) | (4) | (5) | (6) | (7) | (8) | (9) | (10) | (11) | (12) | |
| Early Consumers | ||||||||||||
| Male household head | 0.012 | 0.020 | 0.027 | 0.029 | 0.154*** | 0.151*** | 0.148*** | 0.144*** | 0.024 | 0.021 | 0.025 | 0.021 |
| (0.060) | (0.057) | (0.054) | (0.056) | (0.036) | (0.043) | (0.045) | (0.048) | (0.038) | (0.039) | (0.033) | (0.032) | |
| Asset poor | -0.059 | -0.054 | -0.050 | -0.051 | 0.054 | 0.060 | 0.060 | 0.060 | -0.004 | -0.006 | -0.002 | -0.008 |
| (0.067) | (0.071) | (0.069) | (0.071) | (0.060) | (0.059) | (0.059) | (0.055) | (0.043) | (0.046) | (0.045) | (0.043) | |
| Education (Excluded category: No formal education and primary education) | ||||||||||||
| Secondary | -0.018 | -0.014 | -0.014 | -0.025 | -0.028 | -0.036 | 0.003 | 0.018 | 0.020 | |||
| (0.091) | (0.097) | (0.100) | (0.072) | (0.072) | (0.072) | (0.051) | (0.050) | (0.050) | ||||
| University | 0.059 | 0.078 | 0.082 | 0.010 | 0.011 | 0.008 | -0.023 | -0.014 | -0.008 | |||
| (0.093) | (0.099) | (0.103) | (0.045) | (0.045) | (0.043) | (0.025) | (0.024) | (0.023) | ||||
| Received personal information about water | -0.104 | -0.128* | -0.020 | 0.007 | 0.050 | 0.084 | ||||||
| (0.068) | (0.070) | (0.052) | (0.065) | (0.063) | (0.066) | |||||||
| Purposeful search | -0.071 | 0.119° | 0.111*** | |||||||||
| (0.052) | (0.075) | (0.036) | ||||||||||
| Middle Consumers | ||||||||||||
| Male household head | 0.065 | 0.076* | 0.074* | 0.070* | -0.098* | -0.097* | -0.088 | -0.095°° | -0.109* | -0.106** | -0.111** | -0.110** |
| (0.043) | (0.039) | (0.039) | (0.040) | (0.053) | (0.056) | (0.061) | (0.059) | (0.056) | (0.054) | (0.052) | (0.051) | |
| Asset poor | -0.055 | -0.038 | -0.039 | -0.040 | 0.066 | 0.079* | 0.075* | 0.080* | -0.082 | -0.074 | -0.081 | -0.073 |
| (0.087) | (0.087) | (0.084) | (0.090) | (0.049) | (0.047) | (0.045) | (0.049) | (0.073) | (0.080) | (0.081) | (0.078) | |
| Education (Excluded category: No formal education and primary education) | ||||||||||||
| Secondary | 0.077 | 0.076 | 0.072 | -0.033 | -0.039 | -0.041 | -0.044 | -0.046 | -0.042 | |||
| (0.069) | (0.068) | (0.069) | (0.078) | (0.076) | (0.075) | (0.120) | (0.120) | (0.126) | ||||
| University | 0.137* | 0.133* | 0.124* | 0.058 | 0.050 | 0.054 | 0.079 | 0.072 | 0.076 | |||
| (0.070) | (0.069) | (0.069) | (0.104) | (0.105) | (0.106) | (0.084) | (0.082) | (0.089) | ||||
| Received personal information about water | 0.021* | 0.078 | 0.108 | 0.116 | -0.049 | -0.110* | ||||||
| (0.046) | (0.056) | (0.075) | (0.086) | (0.058) | (0.062) | |||||||
| Purposeful search | 0.184* | 0.092°° | -0.188* | |||||||||
| (0.098) | (0.057) | (0.112) | ||||||||||
| Late Consumers | ||||||||||||
| Male household head | -0.077 | -0.095* | -0.101* | -0.099* | -0.057 | -0.054 | -0.060 | -0.049 | 0.086* | 0.085* | 0.086* | 0.090* |
| (0.053) | (0.057) | (0.056) | (0.056) | (0.042) | (0.044) | (0.043) | (0.047) | (0.051) | (0.050) | (0.048) | (0.048) | |
| Asset poor | 0.114° | 0.092 | 0.089 | 0.091 | -0.121** | -0.140** | -0.135** | -0.140** | 0.085 | 0.080 | 0.083 | 0.081 |
| (0.073) | (0.061) | (0.062) | (0.067) | (0.049) | (0.056) | (0.055) | (0.055) | (0.082) | (0.087) | (0.091) | (0.091) | |
| Education (Excluded category: No formal education and primary education) | ||||||||||||
| Secondary | -0.059 | -0.062 | -0.058 | 0.058 | 0.066 | 0.077 | 0.042 | 0.028 | 0.021 | |||
| (0.094) | (0.100) | (0.094) | (0.068) | (0.068) | (0.065) | (0.111) | (0.119) | (0.127) | ||||
| University | -0.196* | -0.211* | -0.206* | -0.068 | -0.061 | -0.063 | -0.056 | -0.058 | -0.068 | |||
| (0.109) | (0.116) | (0.113) | (0.124) | (0.124) | (0.122) | (0.084) | (0.087) | (0.091) | ||||
| Received personal information about water | 0.083 | 0.050 | -0.088 | -0.123** | -0.002 | 0.026 | ||||||
| (0.062) | (0.054) | (0.064) | (0.059) | (0.063) | (0.056) | |||||||
| Purposeful search | -0.113 | -0.211*** | 0.077 | |||||||||
| (0.094) | (0.064) | (0.121) | ||||||||||
| Sales point/Location FE | Yes | Yes | Yes | Yes | Yes | Yes | Yes | Yes | Yes | Yes | Yes | Yes |
| Observations | 274 | 274 | 274 | 274 | 278 | 278 | 278 | 278 | 161 | 161 | 161 | 161 |
| Chi2 | 35.74 | 41.78 | 44.91 | 50.97 | 130.20 | 134.39 | 137.29 | 146.22 | 73.43 | 75.99 | 77.01 | 79.75 |
| p-value | 0.058 | 0.045 | 0.039 | 0.018 | 0.000 | 0.000 | 0.000 | 0.000 | 0.001 | 0.002 | 0.003 | 0.003 |
| Pseudo R2 | 0.060 | 0.070 | 0.075 | 0.085 | 0.218 | 0.225 | 0.230 | 0.245 | 0.259 | 0.268 | 0.272 | 0.282 |
Note: ° Results from a multinomial logit regression. Standard errors are in parentheses. ***/**/* indicates statistical significance at the 1/5/10% level, respectively; p-value=12%, °° p-value=11%
Declaration of Conflicting Interests
The author(s) declared no potential conflicts of interest with respect to the research, authorship, and/or publication of this article.
Funding
The author(s) disclosed receipt of the following financial support for the research, authorship, and/or publication of this article: The research of this study was funded by NWO grant 313-99-314 by the Netherlands Organization for Scientific Research.