
Abstract
Property taxes serve as the largest own-source revenue source for local governments in the United States. Unlike property values, which fluctuate with the economy, assessed values—the foundation of property taxes—are not routinely updated and reassessments often occur infrequently. The timing of these reassessments holds significant implications, particularly during economic fluctuations. For instance, reassessing during periods of depressed property values can result in reduced revenues, necessitating rate hikes or service cutbacks. Therefore, counties may strategically time reassessments to mitigate adverse financial effects. This study investigates whether property reassessment delays served as strategic financial management tools in North Carolina counties from 2000 to 2019. The findings indicate that counties did employ reassessment timing strategically, particularly in the periods immediately following recessions. Moreover, counties that delayed reassessments exhibited marginally higher property valuation compared to those that did not delay.
Introduction
Property taxes are the largest source of own-source revenue for local governments in the United States, the most stable and resilient tax revenue, and one of the reasons that local governments weather recessions better than other levels of government (Mikesell & Mullins 2010; Mikesell & Ross 2025). The stability of property taxes is due to their inelasticity and the subsequent stability of the assessed and actual property tax base. However, while property values are stable, they are not unmoving. As local property values rise (or fall) with the economy, governments reappraise parcels to reflect their current market value. While scholars and the media have been highlighting inequities in assessment ratios and perceived bias permeating assessments (Berry 2021; Benjamin & Books 2022; Fields et al. 2023) there are also important equity considerations around the frequency of assessments. The assessed value of parcels are the basis of property taxes, and over time, as they drift farther from market values, taxpayers can face inequitable burdens. Therefore, the frequency of reassessments may have notable consequences, and policymakers may want to require more regular reassessments. For example, in 2018 several advocacy groups filed a lawsuit against the state of Delaware regarding school financing inequities brought on by inconsistent and infrequent property tax reassessments. The judge ruled in favor of the plaintiffs and required three counties to conduct their first reassessments in decades. For Sussex County, DE it will be the first reassessment since 1974 (Nagengast 2023). Updating these assessments is critical because out of date assessments can lead to both horizontal and vertical inequity. While this is well understood, there may be additional impacts related to the frequency and discretion over timing of assessments.
Many scholars and practitioners are calling for changing state laws to require more frequent assessments (Deng & Skidmore 2024; Korte 2018). However, there may be consequences to dictating rigid schedules for reassessments that often accompany state laws. For example, it is estimated that there is a three-year lag between change in housing prices and assessed values (Alm et al. 2011; Deng & Skidmore 2024; Lutz 2008) and that the “observed lag between changing property values and property tax revenues provides some time for governments to adjust to looming fiscal pressures brought on by real estate downturns” (Deng & Skidmore 2024, p. 360). Given the likelihood that this lag aids the resilience of county governments to economic downturns and recessions and their fiscal health, it is critical to not just treat this lag as exogenous. One mechanism for this lag may be that counties strategically delay their property reassessments. In fact, Mikesell and Liu (2013) identify that the housing crisis during the Great Recession did not impact property tax revenues during the recession years because, in part, of the time lag between when property values changed and when they were reassessed. Therefore, it is important to consider how revenues and rates may be impacted when properties are reassessed during a downturn.
There are states like Colorado, Iowa, and Montana, where the state dictates the reassessment schedule and there is no local discretion and autonomy. However, in many states, there is discretion around the timing of reassessment and this discretion, when available, may be an important tool for administrators who may be concerned about reassessing property values during an economic downturn. This is because county governments may elect to delay reassessment so that they can maintain the property tax base and generate sufficient revenue without increasing the millage rate. This analysis examines these concerns and studies whether the delay of property reassessment was used as a strategic financial management tool by North Carolina counties in 2000–2019 and the impacts of those delays on financial health.
North Carolina counties are legally required to reassess all real property at least every eight years, though counties have discretion to adopt shorter reassessment schedules. Counties must publish their intended reassessment year, but they are able to adjust the timing until the 8-year mark has been met. Examining the specific timing of county reassessments indicates 1) whether reassessment is used as a financial management tool to cope with recessions, 2) whether this deferring it leads to greater financial health, and 3) whether or not counties are modifying their behavior to take advantage of flexible reassessment schedules in post-recession years. This manuscript makes several important contributions to the literature and for public officials. First, it examines assessment practices as a financial management tool amongst diverse counties that are subject to the same state laws. This is in contrast to the majority of the literature which focuses on large cities (Chernick et al. 2011; Krupa & Kriz 2021; Mikesell & Liu 2013). Second, it analyzes the impact of economic contractions on the timing of assessments and whether they are used as a strategic tool (Ross & Yan 2012; Ross & Mughan 2018). Third, it considers whether the decision to delay reassessment impacts financial health and whether increased autonomy leads to greater effectiveness (Rainey & Steinbauer 1999). Lastly, whether counties adapt their behaviors to allow them more flexibility in future downturns as organizational adaptation would suggest (Hendrick 2011; Hendrick & Crawford 2014; Jimenez & Afonso 2022).
The results suggest that counties are using flexibility to delay reassessment as a financial management tool in the years immediately following recessions when property values were the most negatively affected. Relatedly, there is some evidence that 8-year reassessment cycles with no flexibility negatively impacts financial health and that counties that delay reassessment have slightly better financial health. Lastly, there is no evidence that counties that have a mandatory reassessment during a recessionary period choose to adopt shorter reassessment periods at a greater rate than other counties that have mandatory reassessments during non-recessionary periods.
Literature Review and Theory
The literature around property tax, equity, and the critical process of reassessments has been called one of the “most neglected” areas in public administration (Harris & Lehman 2001). While there have been several recent analyses taking on property taxes and reassessment (Atuahene & Berry 2018; Berry 2021; Gilderbloom et al. 2012; Rakow 2023; Schleicher 2024), there is still much more that needs to be explored. Despite the growing interest in property tax (in)equity, there remains minimal academic literature on the timing or flexibility of reassessments. These are critical considerations when understanding and analyzing the accuracy and equity of assessments. In fact, a recent study carefully analyzed an earlier analysis that identified regressive assessments that failed to consider factors like the timing of reassessments and found that while the assessed values remained regressive, the estimated magnitudes were considerably lower (Berry 2021; Rakow 2023), highlighting the important role of timing. In one of the few studies that considers timing, Stine (2010) finds that jurisdictions are more likely to reassess in the later portion of a required reassessment cycle and that economic changes and local fiscal conditions have the greatest impact on timing. Higher-income counties and those with greater population growth have longer durations between reassessments and counties with high business-sector growth have shorter durations. Similarly, Stine (2005) also finds that as Pennsylvania counties reach their tax rate cap, they are more likely to reassess the property tax. Additionally, more recent evidence suggests that regional policy diffusion can positively impact the timing of reassessments and that institutional features of counties may impact the frequency of reassessments (Eom et al. 2017).
An important question that this literature contends with is whether the timing of property tax reassessment is used strategically by county governments. While the timing has not previously been explored, there is evidence that counties do use reassessments strategically. For example, there is evidence that reassessments are used to increase property tax revenues so that tax rates do not have to be raised. Research has shown that counties take advantage of the fiscal illusion created during reassessment by the increase in values and the ability to raise more revenues without increasing (and often while decreasing) property tax rates (Ross & Yan 2012; Ross & Mughan 2018). This suggests that counties do capitalize on the reassessment process as a means of increasing property tax revenues.
1
Thus, the selection of the “correct” time to go through reappraisal may be critical for county governments. This leads to the first hypothesis, that counties will be likely to defer reassessment during a recessionary period (which includes the recession and the recession effect years) if they can, since they 1) may be concerned that property values have been negatively affected in the short term and 2) they want to defer the cost of a reassessment. Furthermore, it is hypothesized that the impact of a recession on the decision to defer will be greater in the years immediately following a recession, when property values are most likely to be negatively impacted.
H1a: Counties with the ability to defer reassessment will be more likely to do so during a period impacted by a recession. H1b: Counties with the ability to defer reassessment will be more likely to do so in the period immediately following a recession, referred to as a recession effect period.
Additionally, the use of the timing of property tax reassessment as a financial management tool during recessions will be considered through two theoretical lenses. The first lens examines how government organizations increase their effectiveness through increased autonomy. The second lens is from organizational adaptation literature and focuses on how the flexibility and discretion of North Carolina's reassessment process may improve fiscal health.
Autonomy-Effectiveness Theory
Effectiveness is one of the four pillars of public administration. County governments strive to provide effective services with scarce resources, which raises questions about how they can increase their effectiveness and performance. Rainey and Steinbauer (1999) suggest that one mechanism to improve effectiveness and performance is greater autonomy, which will be referred to as the autonomy-effectiveness theory from here on out. They advocate that agencies be granted increased autonomy and greater discretion in the pursuit of their mission and tasks. However, the authors caution that the relationship between autonomy and effectiveness is curvilinear and that too much autonomy and discretion will lead to a reduction in effectiveness. Thus, they stress the importance of oversight and accountability along with increased autonomy.
North Carolina's reassessment structure offers one way to test this theory. This is because the state provides a good amount of discretion and autonomy in setting the reassessment years, but there is also a limit to ensure that reassessments are conducted at least every eight years. This research examines the connection between autonomy and effectiveness by analyzing whether the counties that take advantage of their reassessment flexibility have increased effectiveness. In the context of this analysis, “effectiveness” is having sufficient resources to smooth the provision of services from year to year, which is operationalized using financial health measures. 2
Using Rainey and Steinbauer's autonomy-effectiveness theory (1999), it is hypothesized that a county choosing to adopt a cycle that allows for flexibility and therefore autonomy in delaying the timing of reassessments will have higher levels of fiscal health, all else being equal. Fiscal health is operationalized two ways: measured by the operating ratio and the log of property valuation.
H2: Counties that adopt reassessment schedules that allow for flexibility will have higher levels of fiscal health.
Additionally, this research examines whether counties that choose to delay their reassessments have greater financial health than those that do not. If delaying the reassessment is a financial management tool, those counties that take advantage of the ability to delay reassessment are expected to have greater levels of financial health in (at least) the short term, all else being equal.
H3: Counties that delay their reassessment will be financially healthier than those that do not.
This is because there are two types of counties that do not delay reassessments. First, there are those counties that have adopted the maximum cycle of reassessment (8 years) and have no ability to delay their reassessment. Second, there are counties that have adopted shorter reassessment cycles but choose not to delay their reassessment. The counties that have the option to delay but choose not to likely believe their property values are not deflated due to the economic impacts of the recessionary period. Therefore, when comparing counties that elected to delay with those that elected not to delay, the expectation is that they will have comparable levels of financial health.
H3a: Counties that delay their reassessment will have higher levels of financial health than those that went through a mandatory reassessment. H3b: Counties that delay their reassessment will have more comparable levels of financial health than those that proceeded with optional reassessments.
Organizational Adaptation Theory
Similarly, organizational adaptation theory would suggest that building in flexibility and discretion with regard to reassessment timing may increase fiscal health. 3 In fact, the trend toward shortening the planned assessment cycle periods may be a form of organizational adaptation. Much like diversifying revenue streams, a flexible assessment cycle may help a county handle fiscal shocks and ultimately improve their fiscal health (Hendrick 2011; Jimenez & Afonso 2022). Organizational adaptation strategies are especially critical to counties trying to withstand challenging economic and environmental conditions (Ladd & Yinger 1989). Flexibility in the reassessment cycle may help local officials minimize the impact that economic downturns can have on property taxes—a county's primary revenue source. 4
Ultimately, the flexible timing of property tax reassessments allows counties to delay reassessments if there is concern that property values are temporarily low. For example, when property values fell by 33 percent during the Great Recession (Lerner 2018), delayed reassessments may have helped prevent draconian cutback strategies like raising tax rates. Governments can minimize the risk that accompanies recessions by scheduling more frequent reassessments. This kind of risk mitigation appears in the revenue diversification literature (Carroll & Stater 2009; Jimenez & Afonso 2022; Jordan et al. 2017), and it likely leads to greater stability of revenues, which likely leads to increased stability in expenditures (Hendrick & Crawford 2014).
The fourth and final hypothesis examines whether counties that went through mandatory reassessments during recessionary periods were more likely to schedule subsequent reassessments in less than eight years than counties that performed mandatory reassessments in non-recessionary periods. If negatively impacted counties appear to be shortening their reassessment windows, it provides evidence supporting the organizational adaptation theory.
H4: Counties that went through mandatory reassessment during the recessionary period will be more likely to schedule the subsequent reassessment in less than eight years compared to counties that went through mandatory reassessment in non-recessionary periods.
Data and Methodology
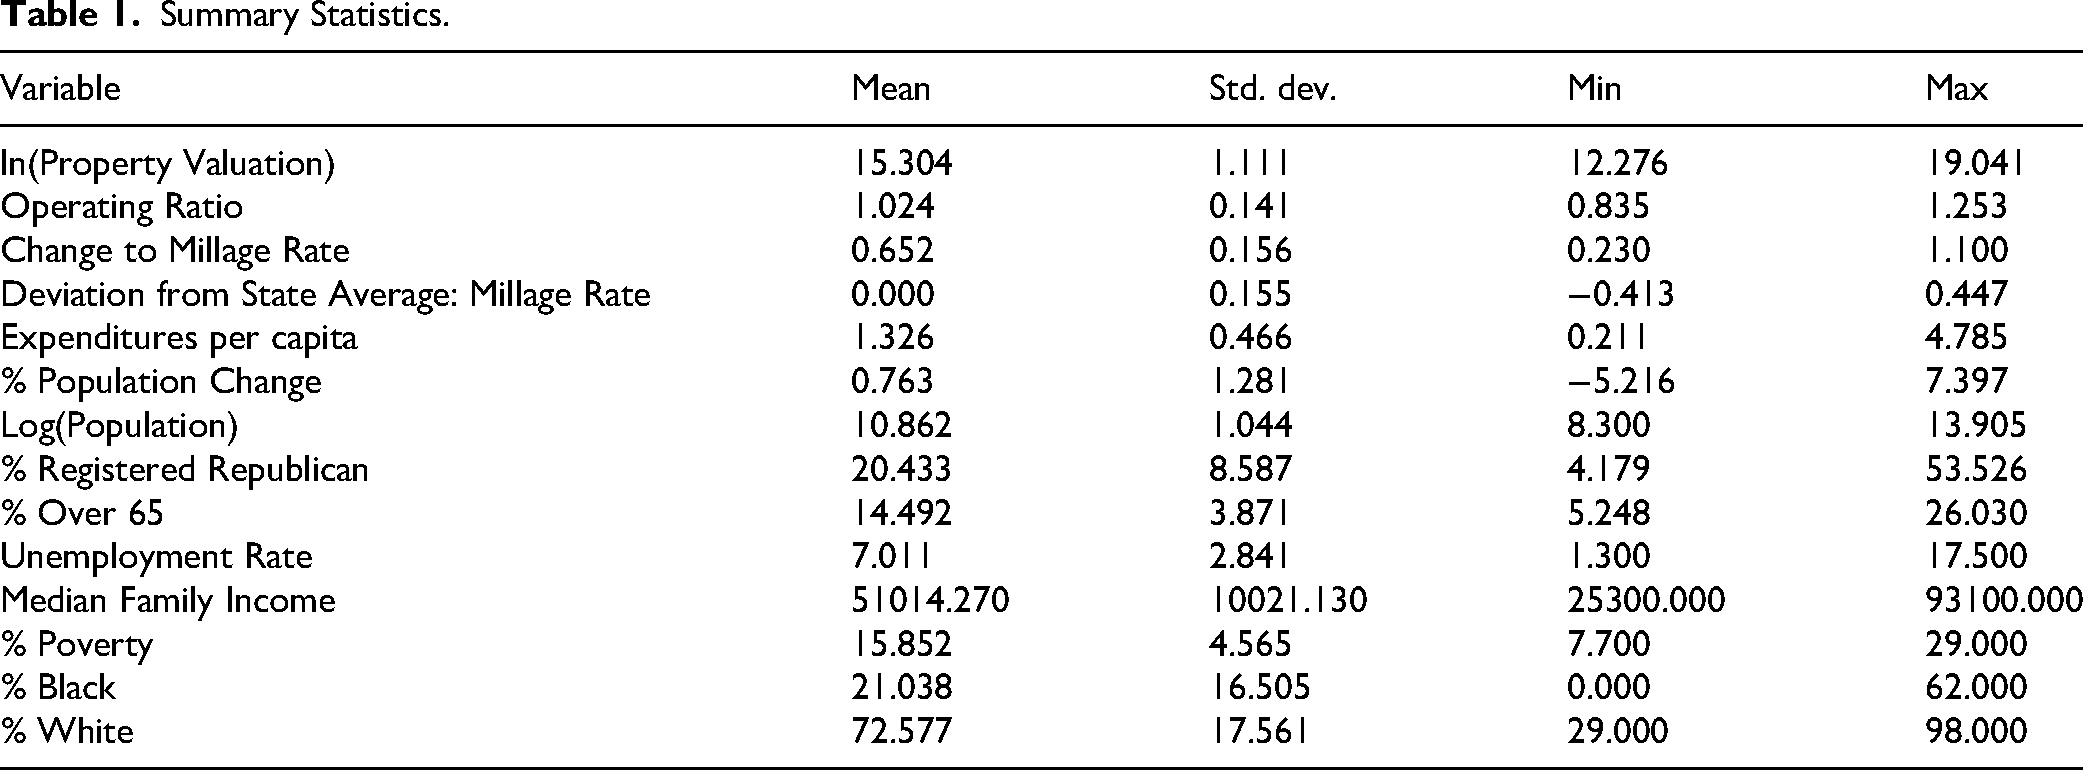
This research focuses on the relationship of the timing of property tax reassessments and fiscal health during and after recessions through the examination of descriptive data and empirical analyses. Several methods, including a logit, propensity score matching, and regression adjustment using propensity scores, are applied to data from all 100 North Carolina counties over a twenty-year period (2000 to 2019). The summary statistics for the data are in Table 1. The property tax reassessment data is from the North Carolina Department of Revenue (2021) and the other variables are from the North Carolina Office of State Budget and Management (2021).
Summary Statistics.
North Carolina Context
On average, North Carolina counties are financed fairly evenly between intergovernmental revenues and own-source revenues. Approximately 52 percent of revenues are own source revenues, with property taxes making up 25 percent, charges and fees making up 18 percent, and local sales taxes constituting 7 percent of total funding (NACo 2022), making property taxes a critical source of funding for counites. 5 North Carolina law requires counties to reappraise all real property (land and structures) once every eight years with the option to do so more frequently (see Chapter 105, Section 286 of the North Carolina General Statutes, hereinafter G.S.). Only Rhode Island has a cycle that is longer than North Carolina's eight years. In fact, nine states require annual reassessments and additional 18 states require counties to go through reassessment at least every four years. 6 The “generous” window in which North Carolina counties can choose to assess property makes it an ideal choice for this analysis because the policy aligns with the autonomy-effectiveness theory. However, many states have similar state laws. Twenty-four states have upper bounds for counties but permit discretion on the timing. These include Florida, Idaho, Ohio, Utah, and Wisconsin which also have relatively long windows of 5 or 6 years for counties to go through reassessment.
In addition, G.S. 105–283 requires that real property be valued at its “true” or market value. The reappraisal value in North Carolina, as in many states, is the value of the property as of January 1 of the reappraisal year, and buildings or other improvements currently under construction are appraised according to their degree of completion on January 1. It is also important to note that assessors are appointed by the Board of County Commissioners in North Carolina and the decision on the timing of the reassessment may not simply be made by the assessor, but by the assessor, the Board, and/or the county manager.
In North Carolina, there is a mix of reassessment schedules with some counties that have elected to have shorter planned reassessment cycles which allows them to defer reassessment and other counties that have elected to have eight-year cycles with no flexibility to delay. Figure 1 presents the average scheduled time between reassessments and the number of counties that have chosen to have an eight-year reassessment window. It reflects the final, or most up to date, periods between reassessments.
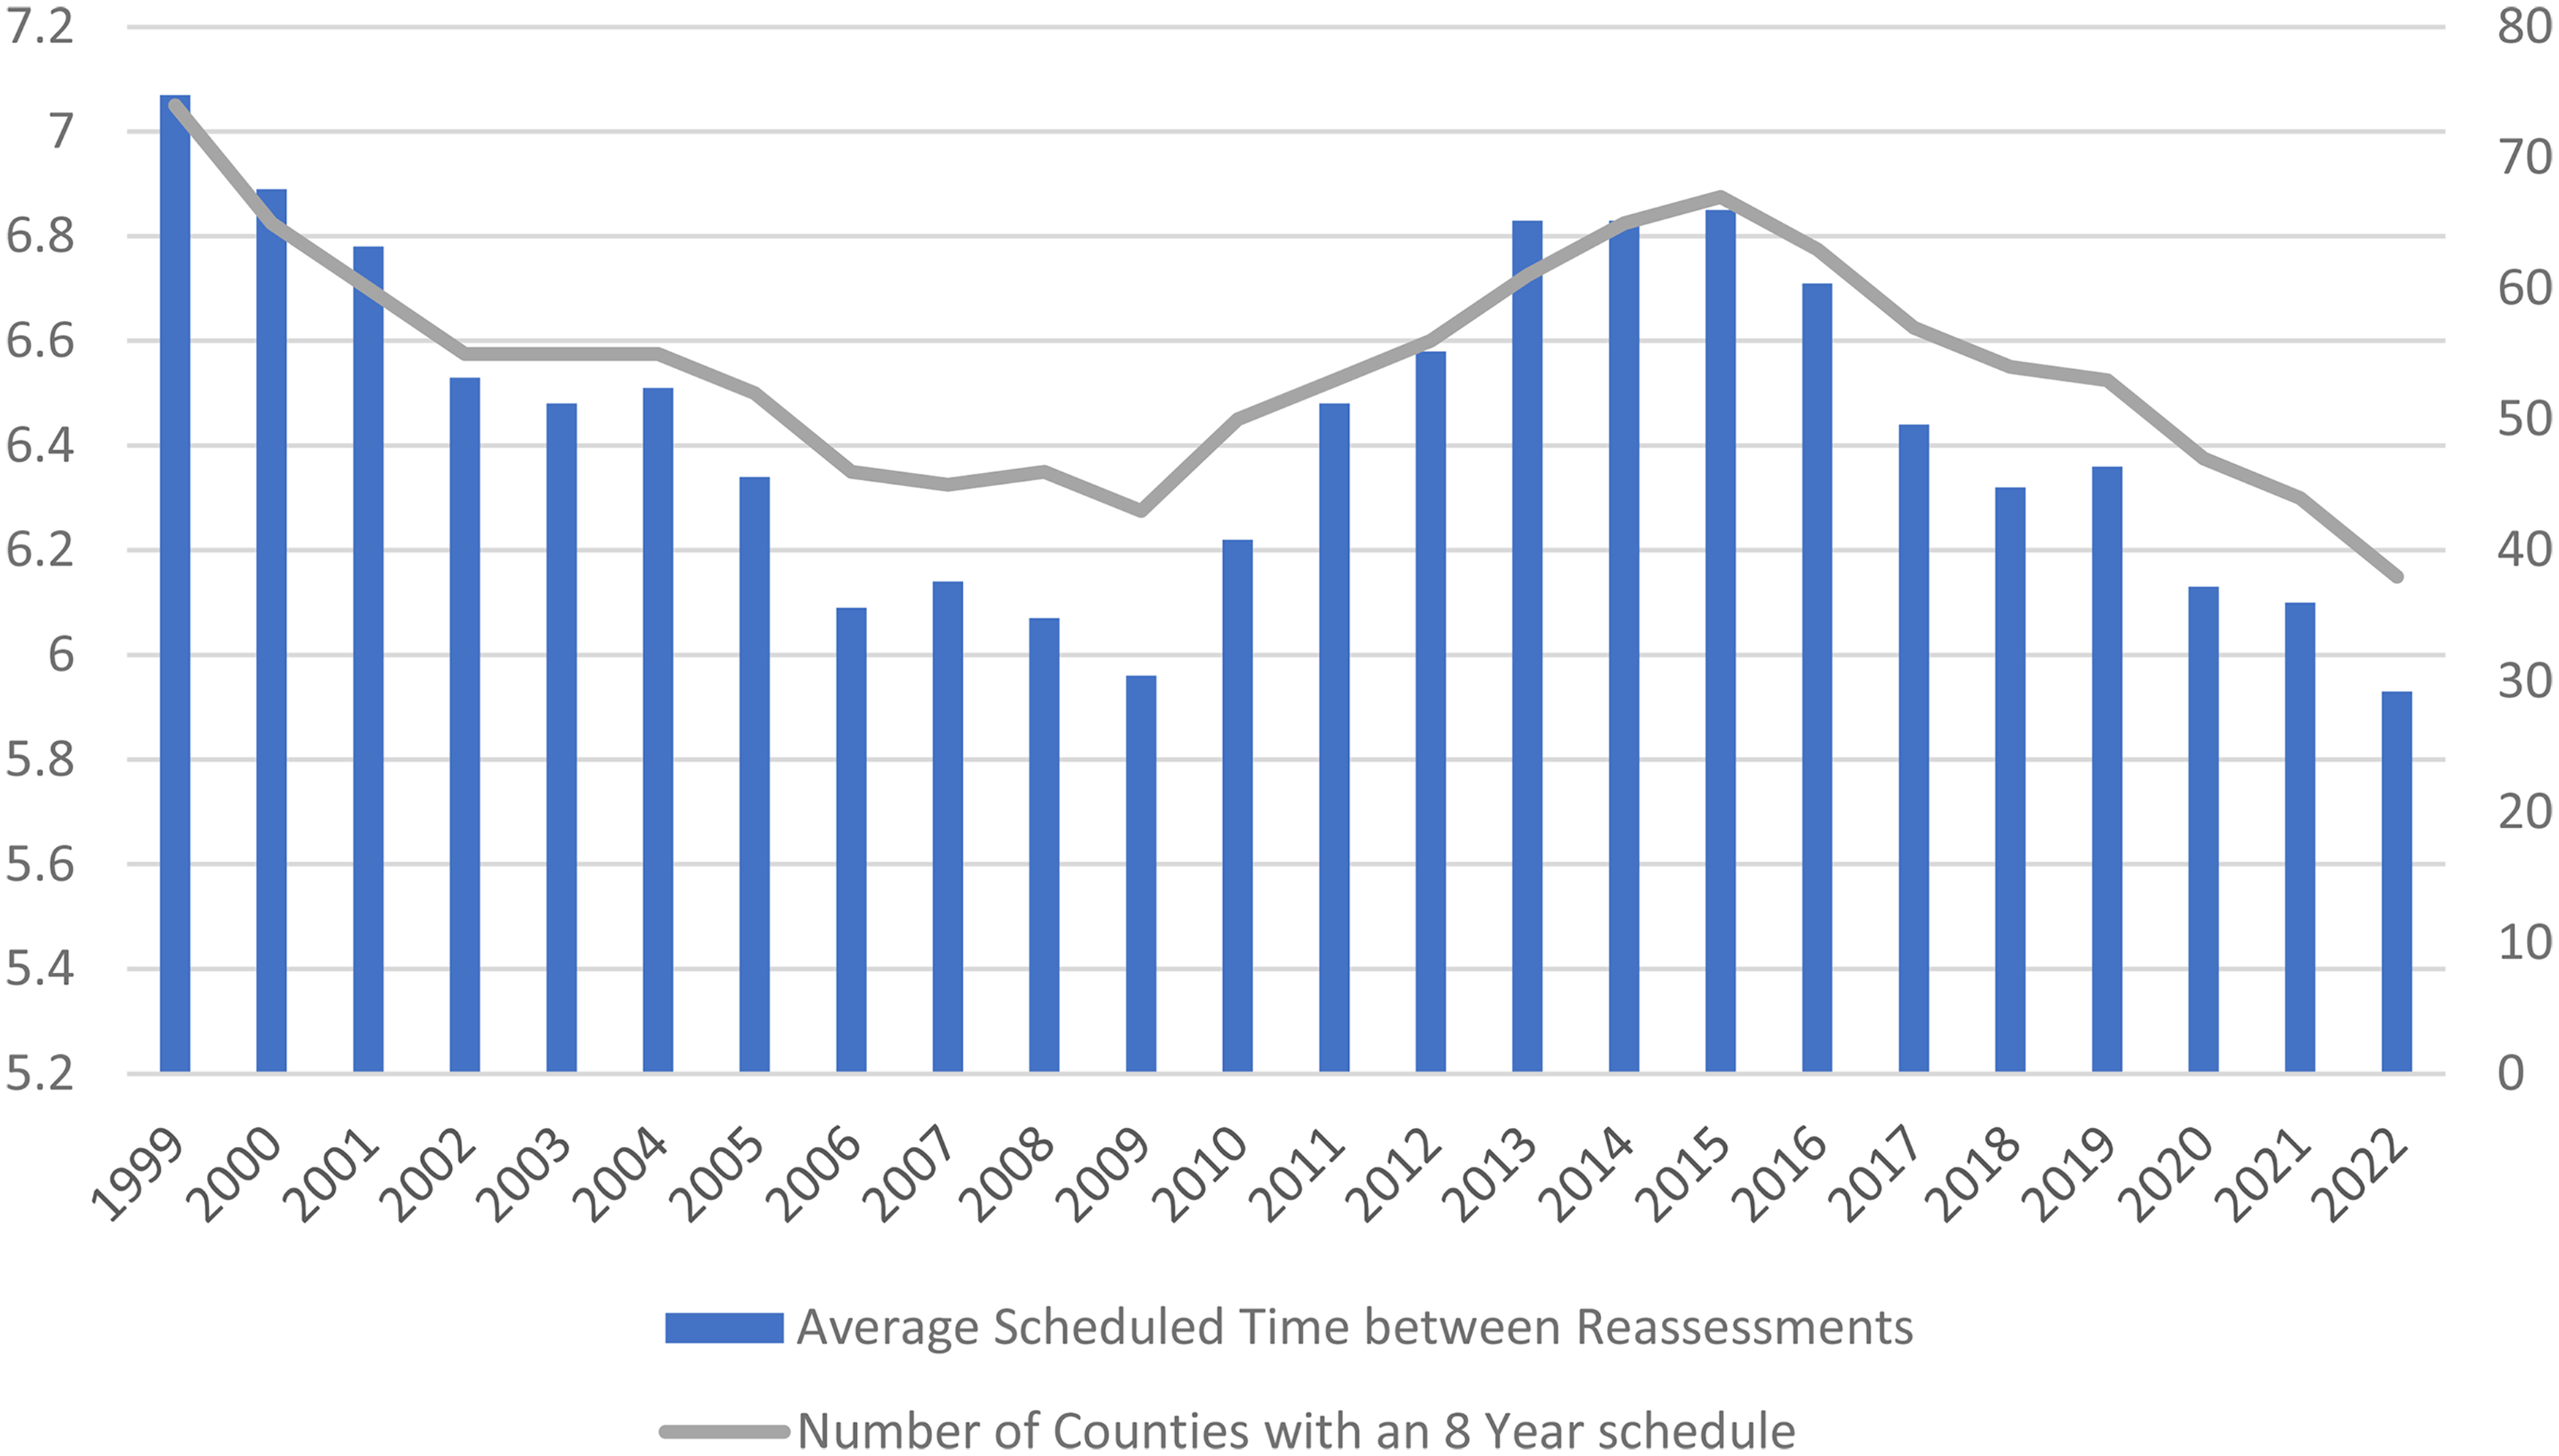
Property Reassessment Schedules in North Carolina Counties from 1999 to 2022.
Moving forward, it is critical to note that if a county had a scheduled reassessment in fiscal year 2008 (FY2008), the revaluation was completed and in place by January 1, 2008, which means that the revaluation process occurred in the prior calendar year or even the two prior calendar years. For this reason, the analysis forward lags the reassessment years. Therefore, the scheduled reassessment in FY2008 will be referred to as “the 2007 reassessment” because of the timing of the decision to go ahead with reassessment and when the actual work is completed. 7
Step 1: Reassessment During Recessions and Post-Recessionary Periods
The first step in determining whether autonomy leads to greater effectiveness—and whether the timing of reassessments is a tool for organizational adaptation—is to consider whether or not county governments use the timing of reassessments as a financial management tool.
Descriptive Data
A careful examination of the underlying data helps to see if there is a pattern of counties delaying their reassessments (when possible) during recessions. This analysis looks at both the formal recession years as defined by the National Bureau of Economic Research (NBER) and the post-recession years since changes to property tax values lag behind changes to the economy. In the twenty-year period under analysis, 2000 to 2019, there were two economic recessions: the dot-com recession (March to November 2001) and the Great Recession (December 2007 to June 2009). In 2001 and from 2007 to 2009 (the actual recession calendar years), there were sixty-five reassessments performed by North Carolina counties (this number may include the same county twice, if the county went through reassessment during both recessions). 8 Each reassessment had to be concluded by January 1, when property values are set for the following fiscal year, 9 which means that the ability to respond to the official start of a recession was limited to 2008 and 2009. 10 Nonetheless, of the sixty-five reassessments that took place in recession years, thirty-six were optional—those counties had not reached the eight-year limit that would require them to go through a reassessment. In the recession years only two counties with discretion to delay their reassessment opted to do so. Thus, in light of the recession years, it does not appear that delaying reassessment was used as a financial management tool.
However, as noted, this research also considers the post-recession years, which are important because they reflect the potential effect of recessions on property values and the ability of counties to adjust their reassessment schedules. As research and evidence suggests, property taxes lag behind changes to the economy (Alm et al. 2011; Deng & Skidmore 2024; Lutz 2008), and we can see evidence of this lag in North Carolina counties over the twenty-year period. For example, Figure 2 presents average home values by quartile (the 25th, 50th, and 75th) using data from Zillow (2022), which reports the average home values of single-family units, condos, and other types of residential properties. Unfortunately, Zillow does not report data for all twenty years for all 100 counties, so its data skews to the most populous counties. However, the figure reveals that home values, if they decline, decline more in the post-recession period than in the actual recession years. The Zillow data is particularly useful because it estimates dynamic market values without waiting for county reassessments to occur. The lag pattern in property values is present in all three quartiles, though it is most pronounced for the highest-cost homes, which have the biggest impact on property taxes. This is in keeping with prior work showing that property tax revenues and assessed values did not meaningfully decline during recessions and actually grew in many cases (Alm 2013; Mikesell & Liu 2013; Mikesell & Mullins 2010), but there was also concern that because of the lag in assessed values that revenues could meaningfully decline in the post-recession period (Mikesell & Liu 2013).
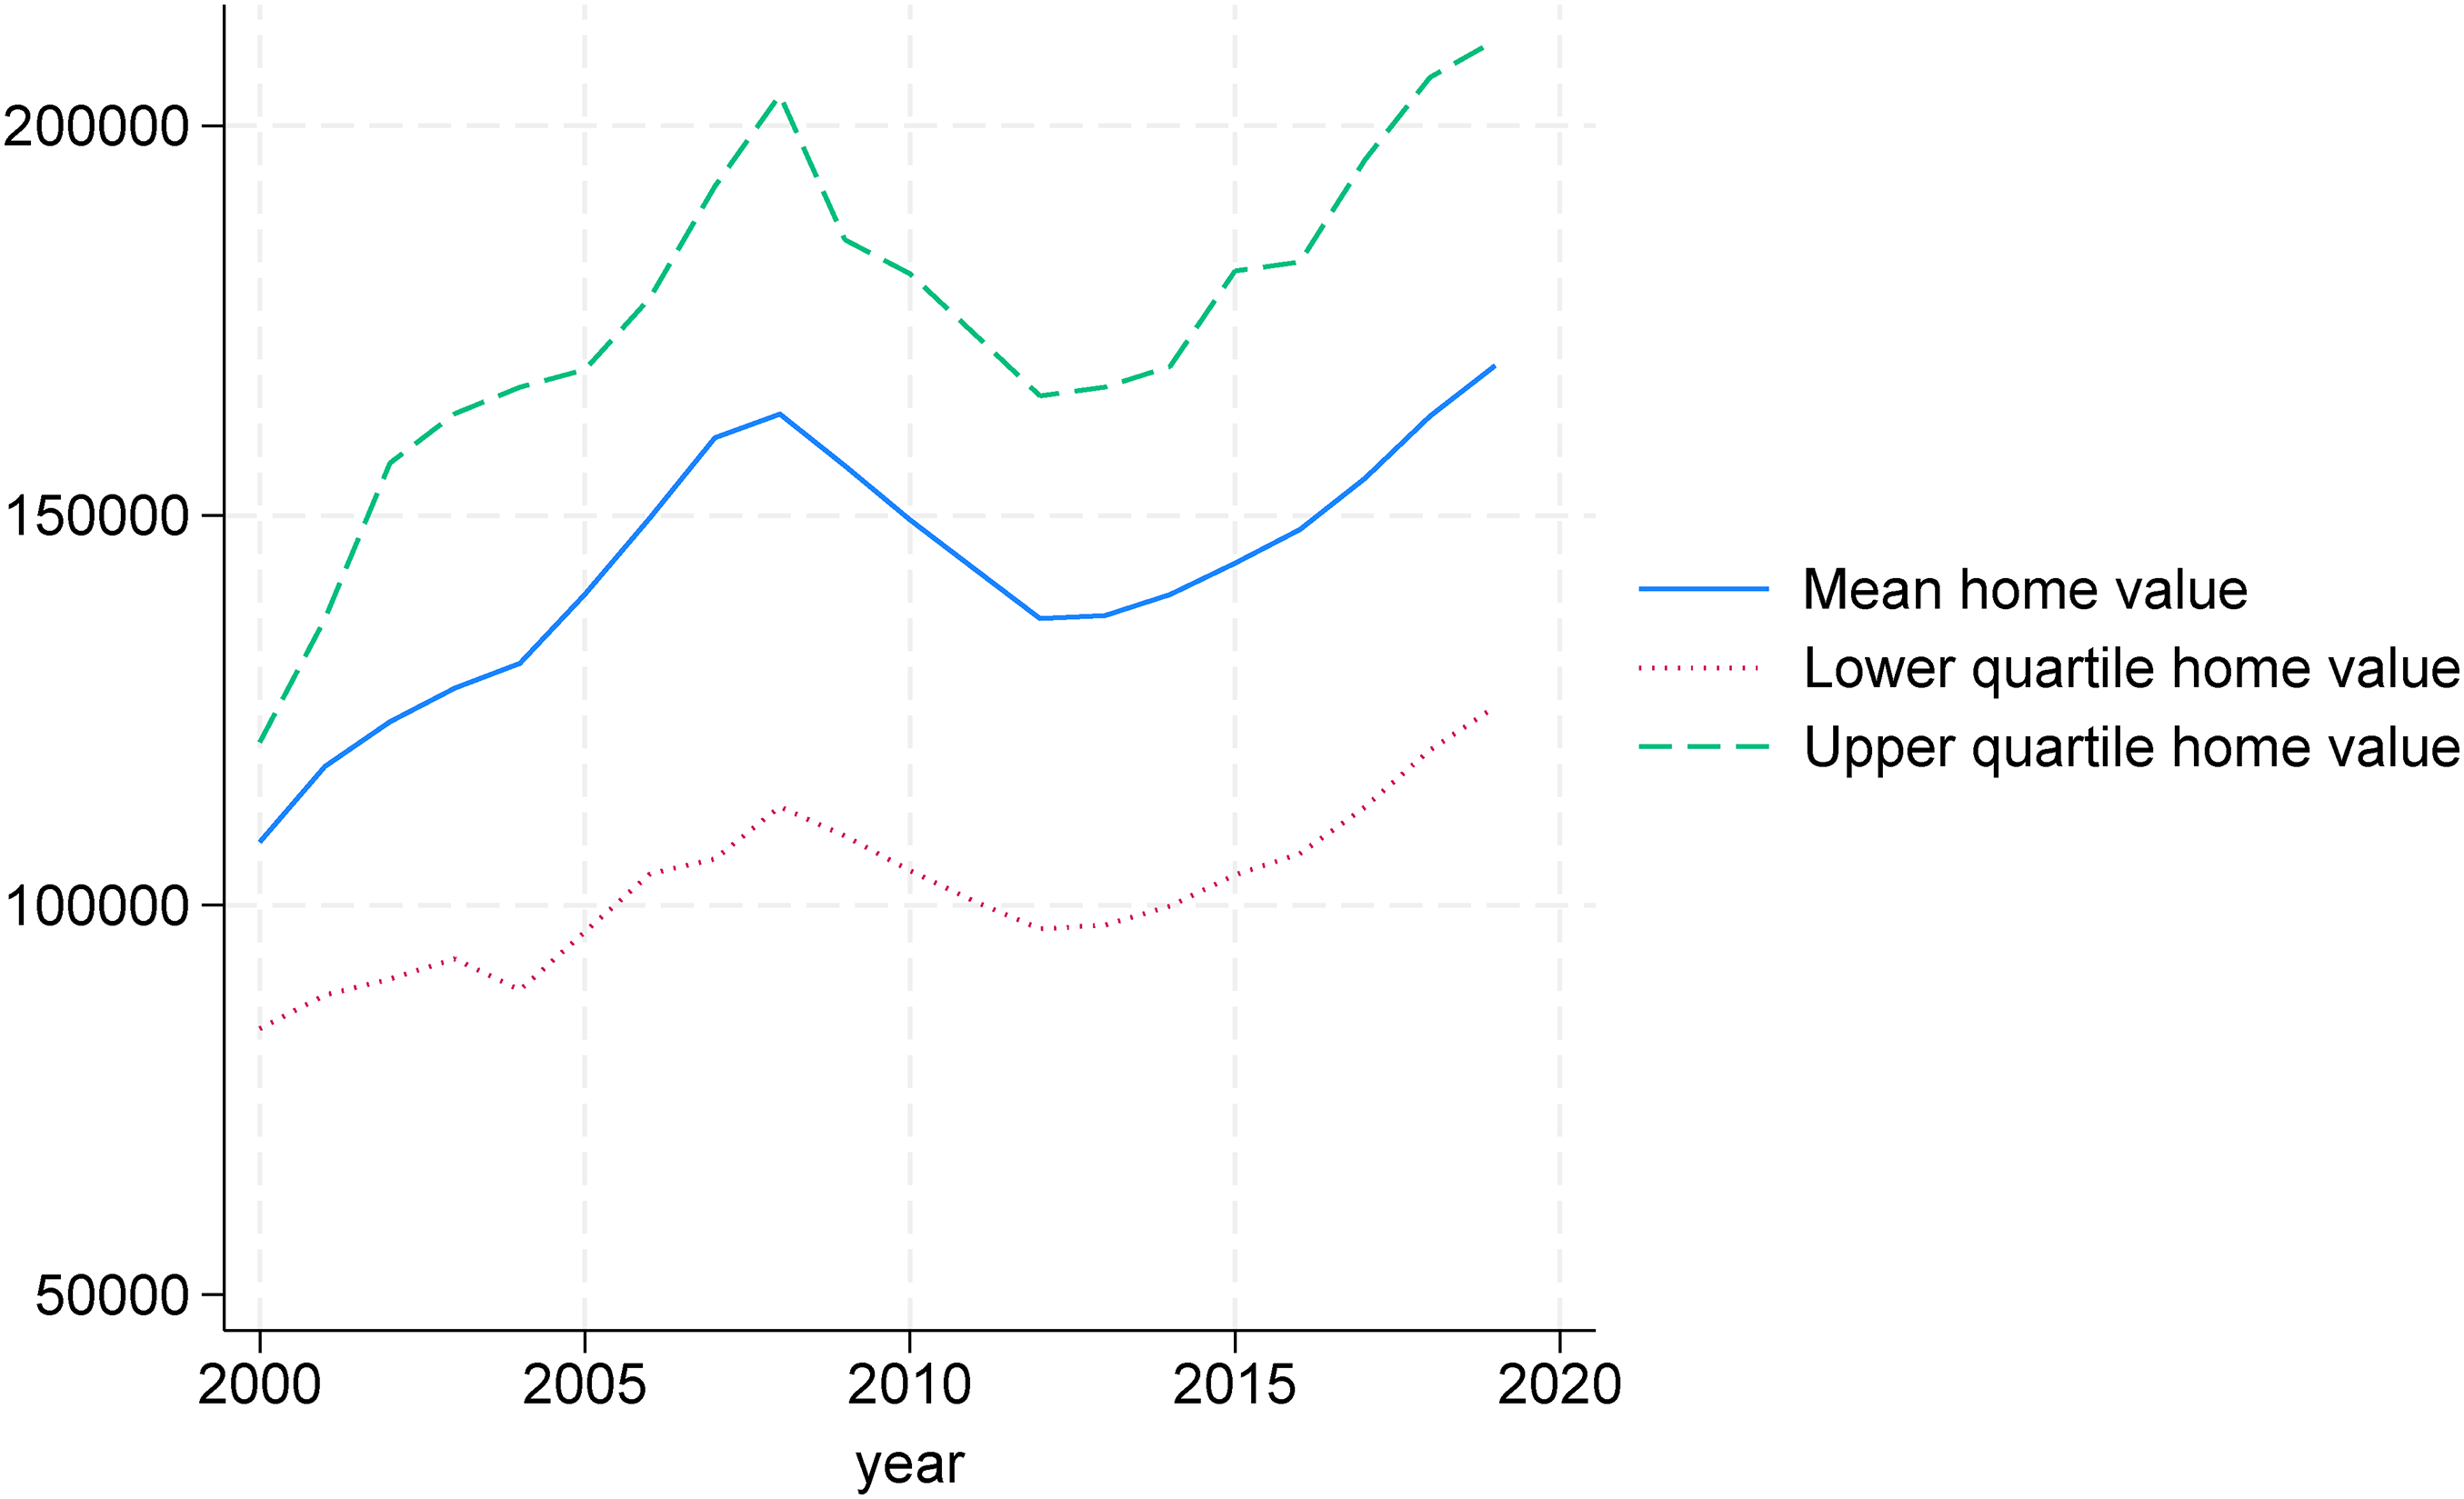
Average Home Values by Quartile in North Carolina Counties.
In this analysis, the post-recession years (“the recession effect years”) are from 2002 to 2004 and 2010 to 2013. During these years, there were 115 reassessments, and 62 of them were optional. In addition, there were 57 counties that chose to delay their scheduled reassessments, so almost half that had the option to delay did so. Of those 57 counties, 44 of them were in the recession effect years following the Great Recession, compared to 13 in the dot-com recession effect years. Interestingly, for the recession effect years, two-thirds of the reassessments that took place in 2010 were not optional, and close to two-thirds were not optional in 2002. Figure 3 presents the scheduled reassessments for the official recession years and the recession effect years. It shows that more reassessments were scheduled for the recession effect years (which is unsurprising given that those periods are longer) and that many more counties chose to delay, particularly during the Great Recession, when property values were most negatively impacted. Lastly, it is worth noting another trend that occurred during this period indicating that counties in North Carolina were selecting shorter reassessment cycles. (See Figure 1.)
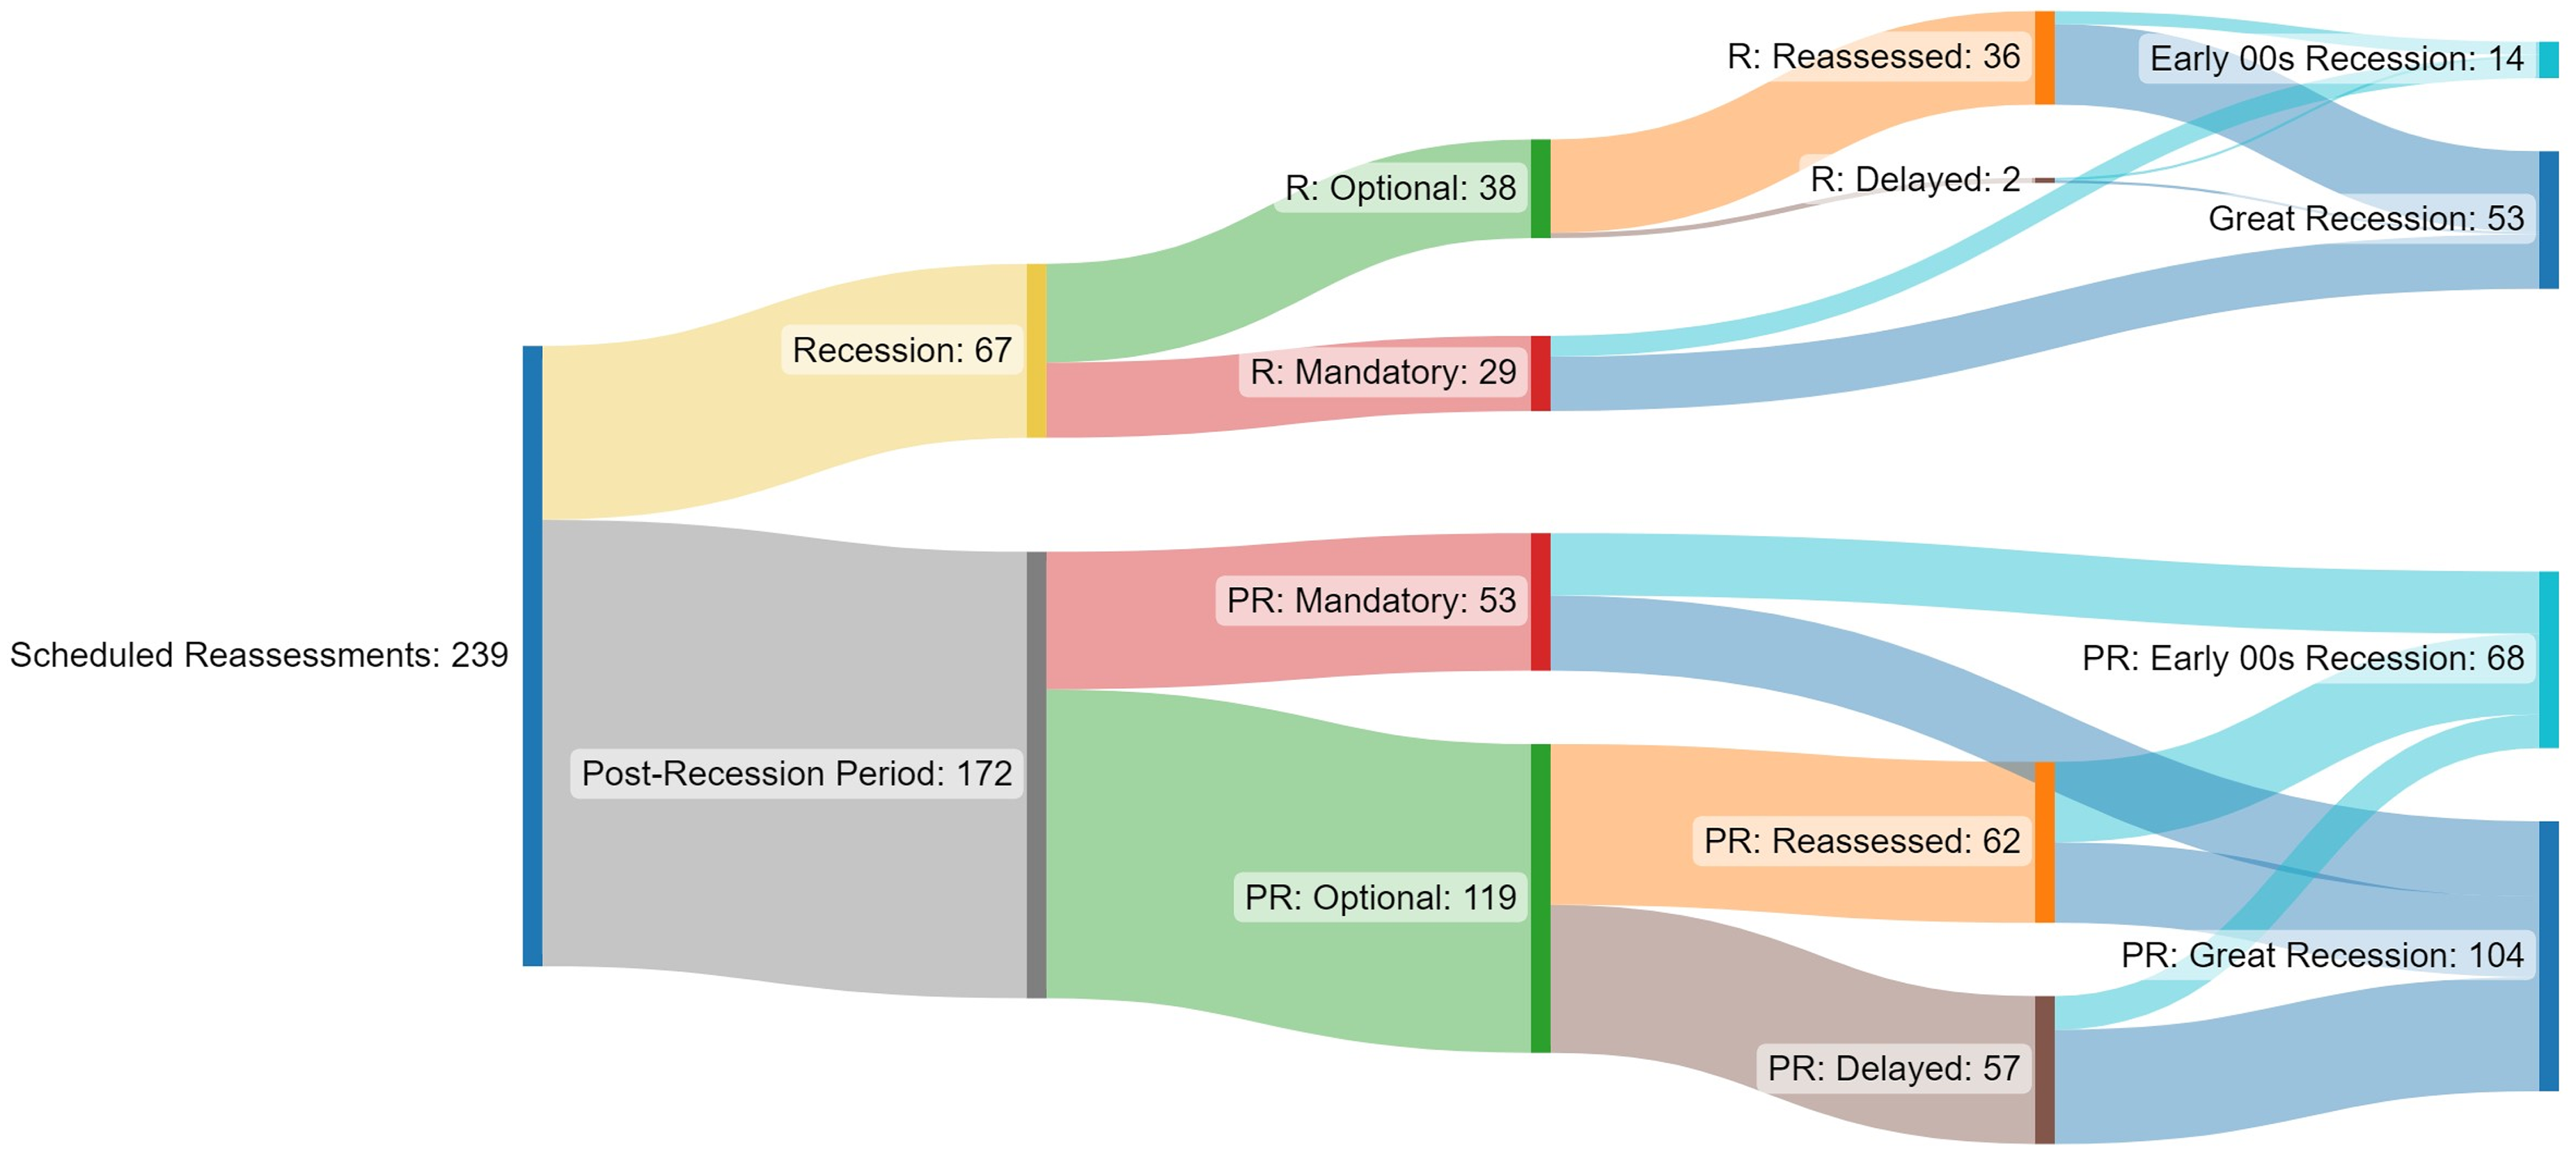
Scheduled Reassessments for the Recession and the Post-Recession Periods.
Regression Strategy
To test hypotheses H1a and H1b, that a county with the ability to delay reassessment (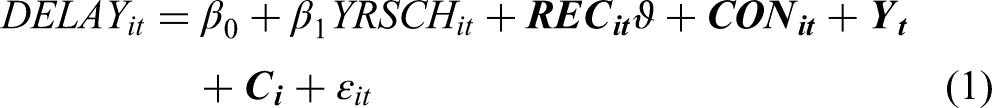
Initially, the model is run with a binary variable indicating whether it was a recessionary period (recession years and recession effect years) and then with two binary variables indicating whether the year was during a recession as defined by NBER and whether the year was during a recession effect period
The models only include the 69 counties (861 observations) that are scheduled to go through reassessment during these two periods and that have the ability to delay reassessment. Therefore, if a county is already on a planned eight-year reassessment cycle or if it is not scheduled to go through a reassessment in either of these periods, it is not included in the analysis, and once a county goes through reassessment it is no longer included in the sample.
Step 2: Impact of Shorter Assessment Cycles and Delayed Reassessment on Fiscal Health
The second step of the analysis tests H2 and H3. Namely, 1) whether counties that adopt shorter cycles have better fiscal health because of their increased autonomy and ability to defer and 2) whether the decision to delay positively impacts a county's fiscal health.
Descriptive Data
To measure a county's fiscal health, two different measures are used. The first is the operating ratio, which is the general fund total revenues divided by the general fund total expenditures. 12 Operating (or operation) ratio is one of the most common measures of financial condition and captures whether a government's revenues are sufficient to pay for operations (Rivenbark et al. 2009). Operating ratio is a popular measure because it captures fiscal balance, it focuses on core operations for service delivery, and it highlights structural imbalances. If the operating ratio is 1, then the county spends the same amount that it receives in revenues. If the operating ratio is less than 1, the county is not in balance and is using reserves or transfers from other funds to balance the budget. Similarly, if the operating ratio is greater than 1, the county is collecting more revenues than it is spending and is thus solvent and is considered to have greater fiscal health. 13 In this period, the interquartile range of operating ratios was 0.96 and 1.06. The interquartile range for a change in the operating ratio from one year to the next in this period is between −0.079 and 0.055. These numbers reflect the strong financial health of sampled counties, which is not surprising since North Carolina local governments are known for their strong financial health (Coe 2007). 14
The second measure used is the total property valuation. If counties are delaying property tax reassessment due to the recession, it is likely for one of two reasons. 15 The first may be to delay the cost of the reassessment itself. For example, Chatham County, N.C., recently contracted with an outside firm to reassess the approximately 45,000 parcels in the county for $1.3 million (Wilson 2021). The ability to delay such a costly service during a recession may be attractive. The second reason may be to prevent a reassessment in which the valuation either decreases from the prior revaluation or goes below what administrators perceive actual values will be after the economy rebounds. A reduction in valuation could lead to the county's need to increase the property tax rate and/or reduce expenditures. Therefore, looking at the impact on total property valuation for those counties that chose to delay versus those that did not may help illuminate both the motivation behind the delay and the impact of the delay. Additionally, there is strong evidence that when decisions makers, i.e., public and elected officials, consider their jurisdiction's fiscal condition that they do not lean heavily on traditional financial indicators, but instead look at fiscal stressors like property tax base and change in valuation (e.g., Goldberg & Neiman 2014; Leiser et al. 2021; Leiser & Mills 2019; Marlowe 2015). 16 Thus, they may be particularly proactive about keeping property valuations from declining or artificially low if they have a tool that they can use to avoid their decline, like delaying reassessment.
Regression Strategy
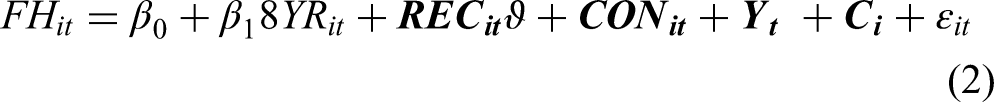
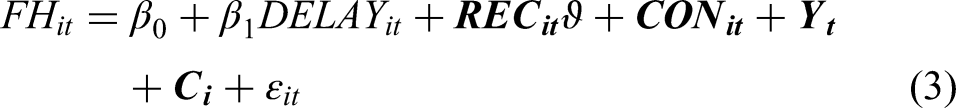
To test H2 and H3, a series of two way fixed effects model are employed (equations 2 and 3, respectively). The dependent variables (
Additionally, propensity score matching models and regression adjustment using propensity scores models are used as an alternative specification. The discussion of the propensity score methodologies and the results are presented in Appendix 2. The covariates used in Step 1 (e.g., property tax rates, population growth and change, percentage of the population that is registered as a Republican, deviation from state average property tax rate, per capita expenditures) are also independent variables used in the two-way fixed effects analysis along with the recession binary variables.
Step 3: Reassessments During Recession Periods: Impact on Future Cycle Lengths
The final step in this research is a test of H4, that examines whether counties that had mandatory reassessments during the recessionary period, which may have been a suboptimal time, modified their behavior and shortened their reassessment window for the next cycle. This shortening of the subsequent cycle would potentially be beneficial for two reasons: 1) If county officials believe that the property values captured were artificially low due to the recession, then a shorter window would allow them to adjust and more accurately capture property values and 2) it would provide more flexibility in the future and the county could delay reassessment as needed. If the earlier hypotheses are supported, creating flexibility in the timing of reassessments would demonstrate organizational adaptation.
Descriptive Data
Eighty-two counties had mandatory reassessments during the two recessionary periods. This means that each of these counties scheduled 8-year reassessment periods. As Figure 1 suggests, the number of counties that set an 8-year reassessment window tends to ebb and flow over the years but is generally trending down.
Regression Strategy
Step 3 examines whether counties that went through mandatory reassessments during recessionary periods were more likely to schedule subsequent reassessments for less than eight years, building in flexibility, than counties that performed mandatory reassessments in non-recessionary periods.
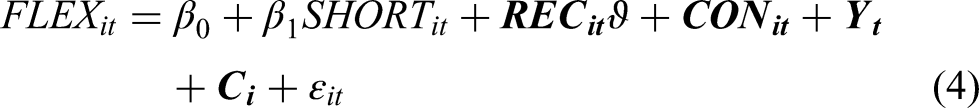
To analyze this relationship, the same process used in Step 2 is followed, using a logit for the initial specification and propensity score matching and regression adjustment using propensity scores, equation 4 (which are reported in Appendix 2). The independent variable of interest is a binary variable indicating if the previous reassessment was during a recessionary period (coded as a 1) or not (coded as a 0),
Discussion of Results
Step 1: Reassessment During Recessions and Post-Recessionary Periods
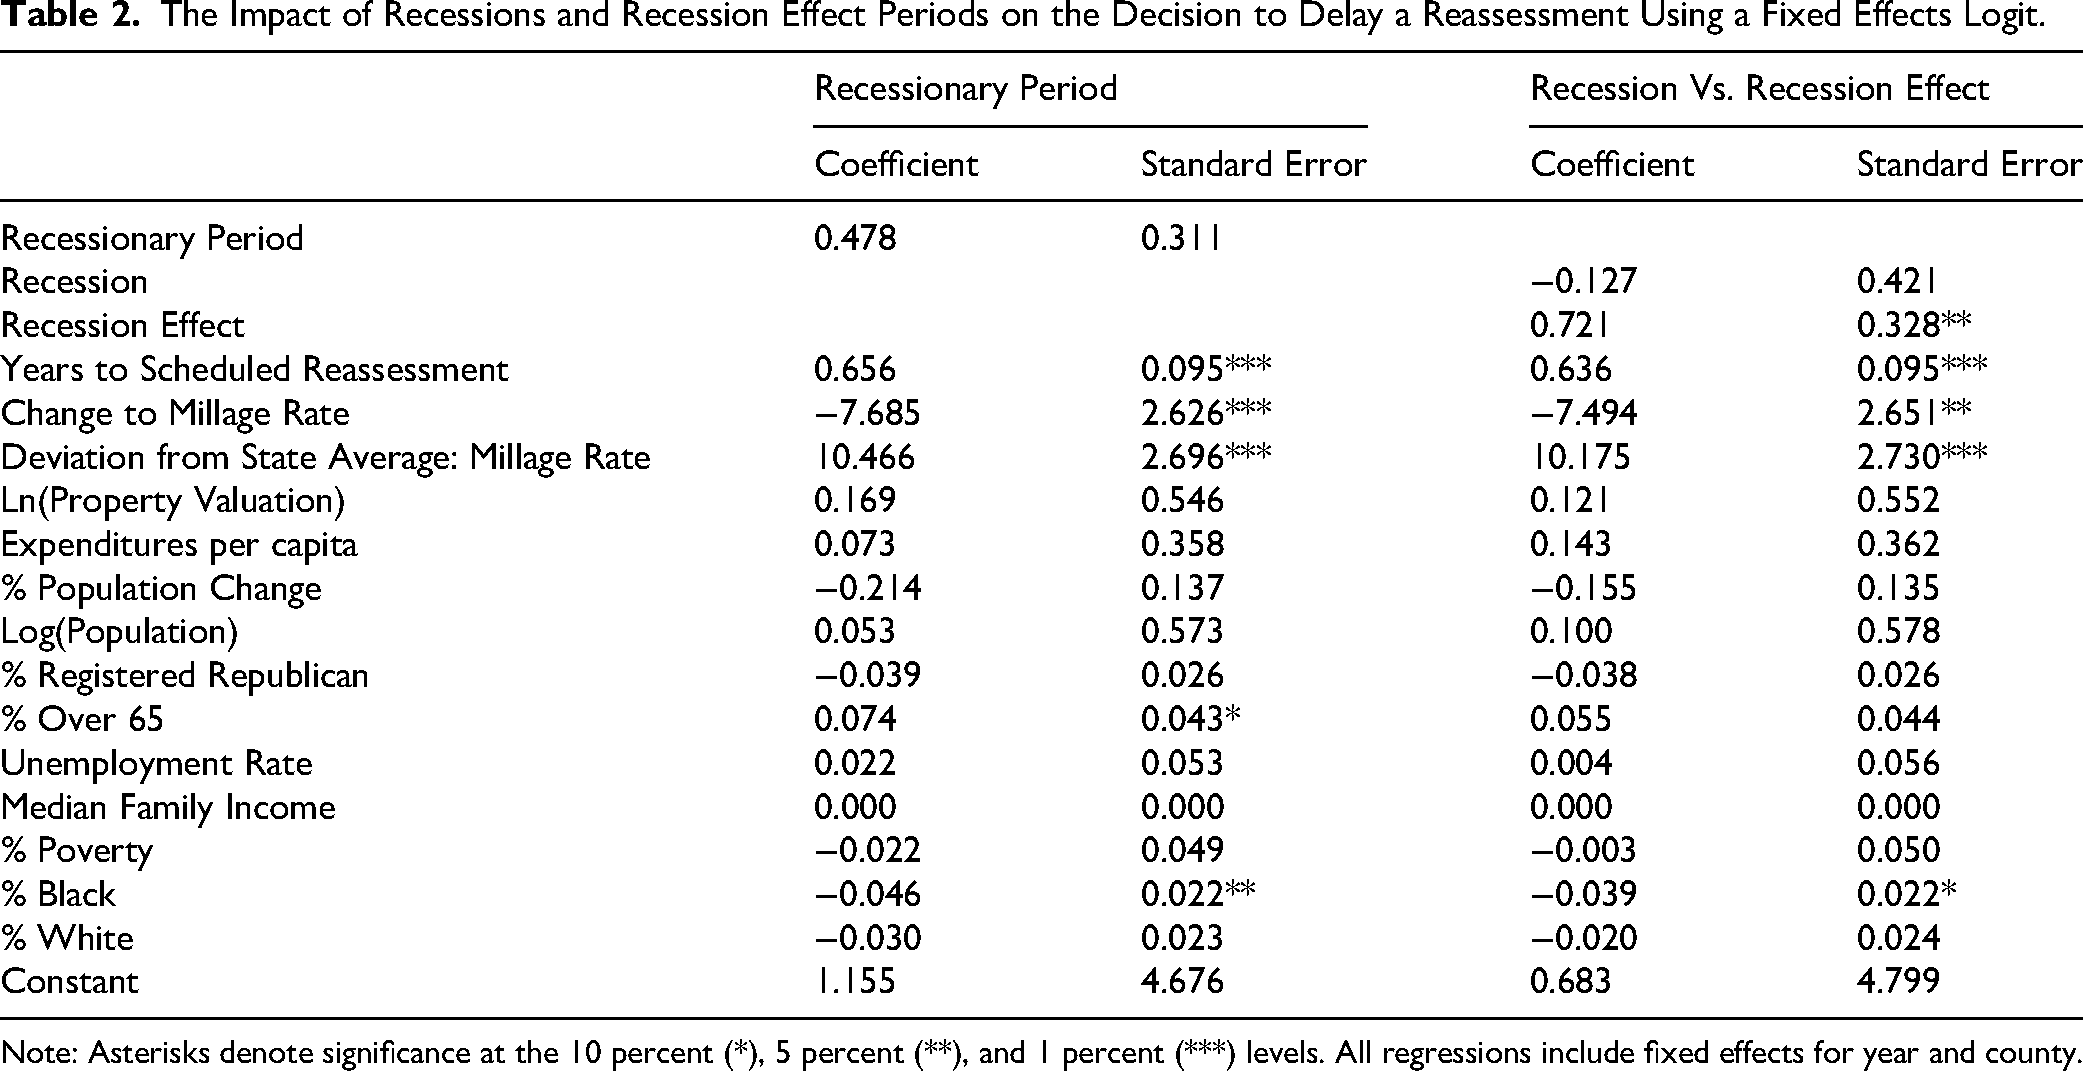
Table 2 presents the results of the fixed effects logit models that consider whether counties with the ability to delay are more likely to do so during a recession or a recession effect period than in a non-recessionary period. The first set of results only indicates whether the reassessment was scheduled during a recessionary period. There is no evidence suggesting that counties with the ability to delay are more likely to do so during that time. The second set of results uses binary variables for recession and recession effect. These results suggest that counties are less likely to delay reassessment during a recession, though are not statistically significant, and more likely to delay reassessment during a recession effect period than a non-recessionary period (p<0.05). The odds ratio for the decision to delay reassessment during the recession effect period is 2.06 meaning that a recession effect period (or the years immediately following a recession) multiplies the probability of delaying reassessment by 2.06 compared to other periods. This is not just a statistically significant impact, it is meaningful and offers strong support for H1b.
The Impact of Recessions and Recession Effect Periods on the Decision to Delay a Reassessment Using a Fixed Effects Logit.
Note: Asterisks denote significance at the 10 percent (*), 5 percent (**), and 1 percent (***) levels. All regressions include fixed effects for year and county.
These results are not surprising. As noted earlier, the reassessments must be complete and in place by January 1, so in many of the recession years counties would not have known there was going to be a recession as they were preparing or going through the administrative process. This is even true with the forward lag of the reassessment year that is in place for this analysis. Also, since property values tend to lag behind changes to the economy, it makes sense that the period of greatest concern about deflated property values would be immediately after a recession (see figure 2). The results do suggest that counties use the flexibility of delaying reassessment as a strategic financial management tool during major economic downturns.
This research posits that there are two likely reasons for delaying reassessment: the cost savings of performing the reassessment and the concern that property values are temporarily deflated because of the recession. If the reason for counties delaying reassessment is for cost savings, then we would expect to see an impact on the choice to delay in both recessionary periods, however we only see the relationship when the property values were most impacted negatively impacted during the recessionary effect period, suggesting that cost savings were not the primary purpose for the delay.
Other variables in the model are worth highlighting. First, the independent variable years to the scheduled reassessment is statistically significant (p<0.01), which suggests that as a scheduled reassessment approaches, a county is more likely to delay it. Since counties are able to delay at any point in the eight years between reassessments, it is reasonable to expect that they would wait to have complete information and are closer to a scheduled reassessment. Second, increasing the millage rate makes it less likely that a county will delay reassessment (p<0.05). While not the primary question of interest, this is a valuable finding and worth more attention in future work. This is in keeping with previous analysis that finds that increases in millage rate increases the probability of reassessment in a context where there is autonomy over the timing of reassessment (Stine 2005). Third, counties with millage rates above the state average are more likely to delay reassessment (p<0.01). This is likely due to political constraints as counties with higher tax rates have less ability to increase millage rates and cannot afford the shock of decreasing or deflated property values. This indicator may also point to a county's managerial or financial condition.
Step 2: Impact of Shorter Assessment Cycles and Delayed Reassessment on Fiscal Health
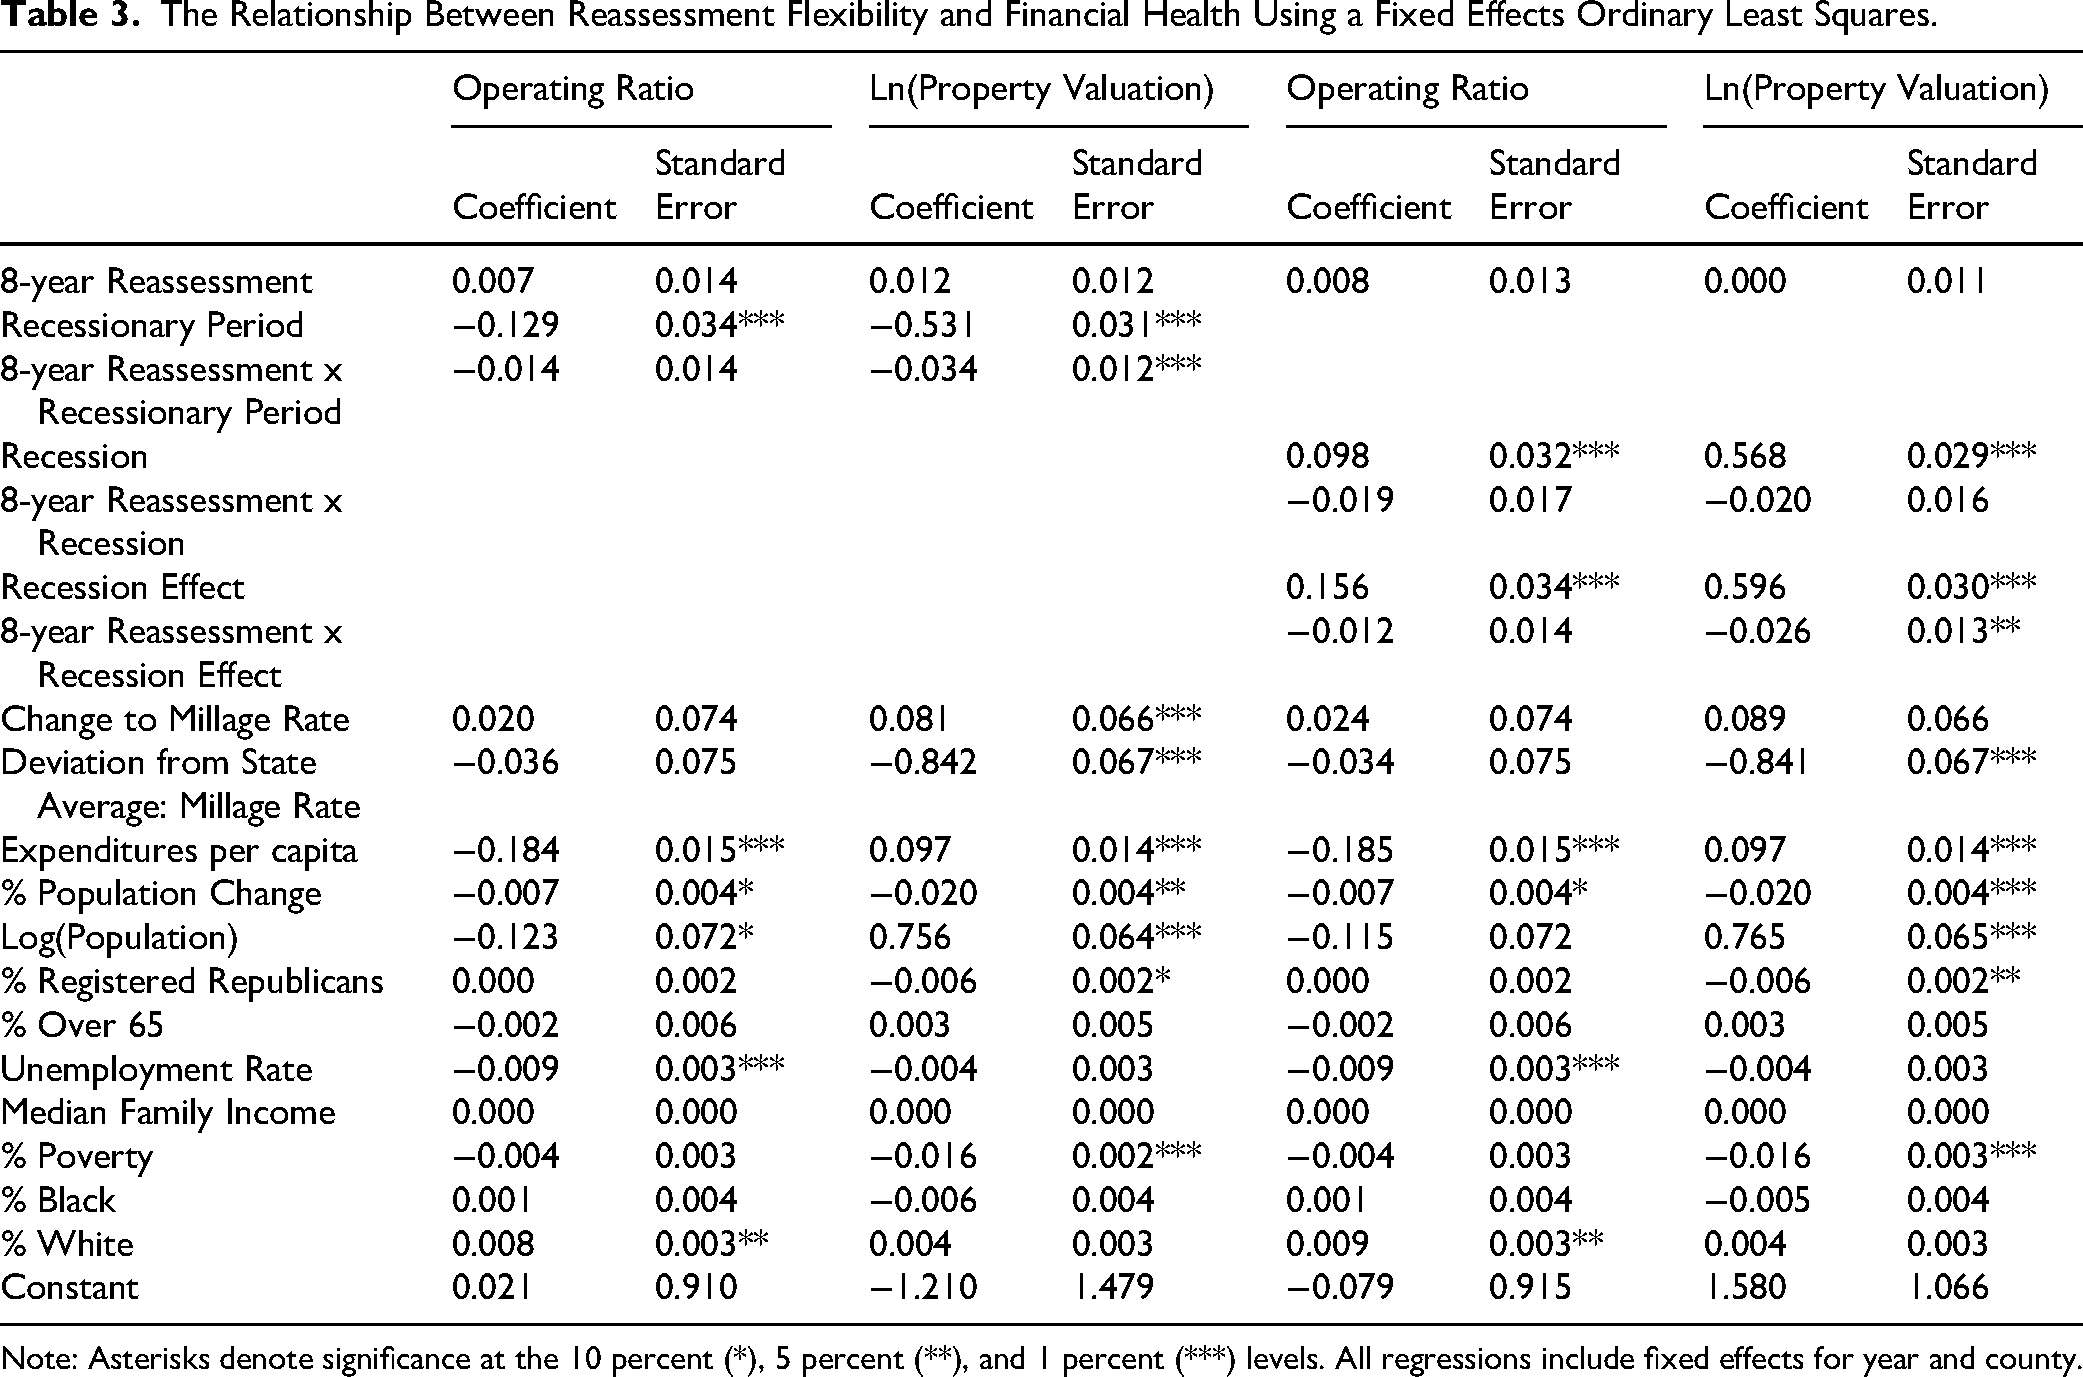
Hypothesis 2 posits that counties that have allowed themselves greater managerial flexibility by adopting shorter than required reassessment periods will have greater levels of financial health. This hypothesis is tested using three different methodologies: ordinary least squares and two propensity score methods. Table 3 presents the results of the fixed-effects OLS regressions with the dependent variables of operating ratio and log of property valuation, which will be referred to simply as property valuation. The primary independent variable of interest is a binary variable indicating whether the county has the maximum length of the reassessment window in that year and the interaction of recessions and recession effect periods with the eight-year reassessment. Mandatory reassessment is not statistically significant for either the operating ratio or property valuation. The binary period controlling for whether the reassessment occurred during a recessionary period (recession and recession effect period) is statistically significant (p<0.01) for both financial condition variables. The interaction term for mandatory reassessment and recessionary period is statistically significant (p<0.01) and estimated to decrease property valuation. The second set of results also includes the interaction of mandatory reassessments with recession and recession effect separated out. The binary variable for mandatory reassessment and the interaction terms between it and the recession and recession effect periods are not statistically significant for operating ratio. Interestingly, both the recession and recession effect period variables are statistically significant (p<0.01) and estimated to have a positive effect on operating ratio and property valuation. Unlike for operating ratio though, the interaction of the mandatory reassessment and recession effect period is statistically significant and negative for property valuation (p<0.05). This suggests that property values are lower on average when counties go through mandatory reassessments during recessionary effect period than those with shorter cycles that chose to reassess.
The Relationship Between Reassessment Flexibility and Financial Health Using a Fixed Effects Ordinary Least Squares.
Note: Asterisks denote significance at the 10 percent (*), 5 percent (**), and 1 percent (***) levels. All regressions include fixed effects for year and county.
Other variables are also estimated to have a statistically significant impact. Both millage rate variables are estimated to impact property valuation. Population change and unemployment rate are estimated to negatively impact the financial condition variables and population and expenditures per capita are estimated to increase property valuation but decrease operating ratio. Lastly, larger white populations are estimated to increase the operating ratio. As reported in appendix 2, the propensity score methods do not provide strong evidence for these hypotheses.
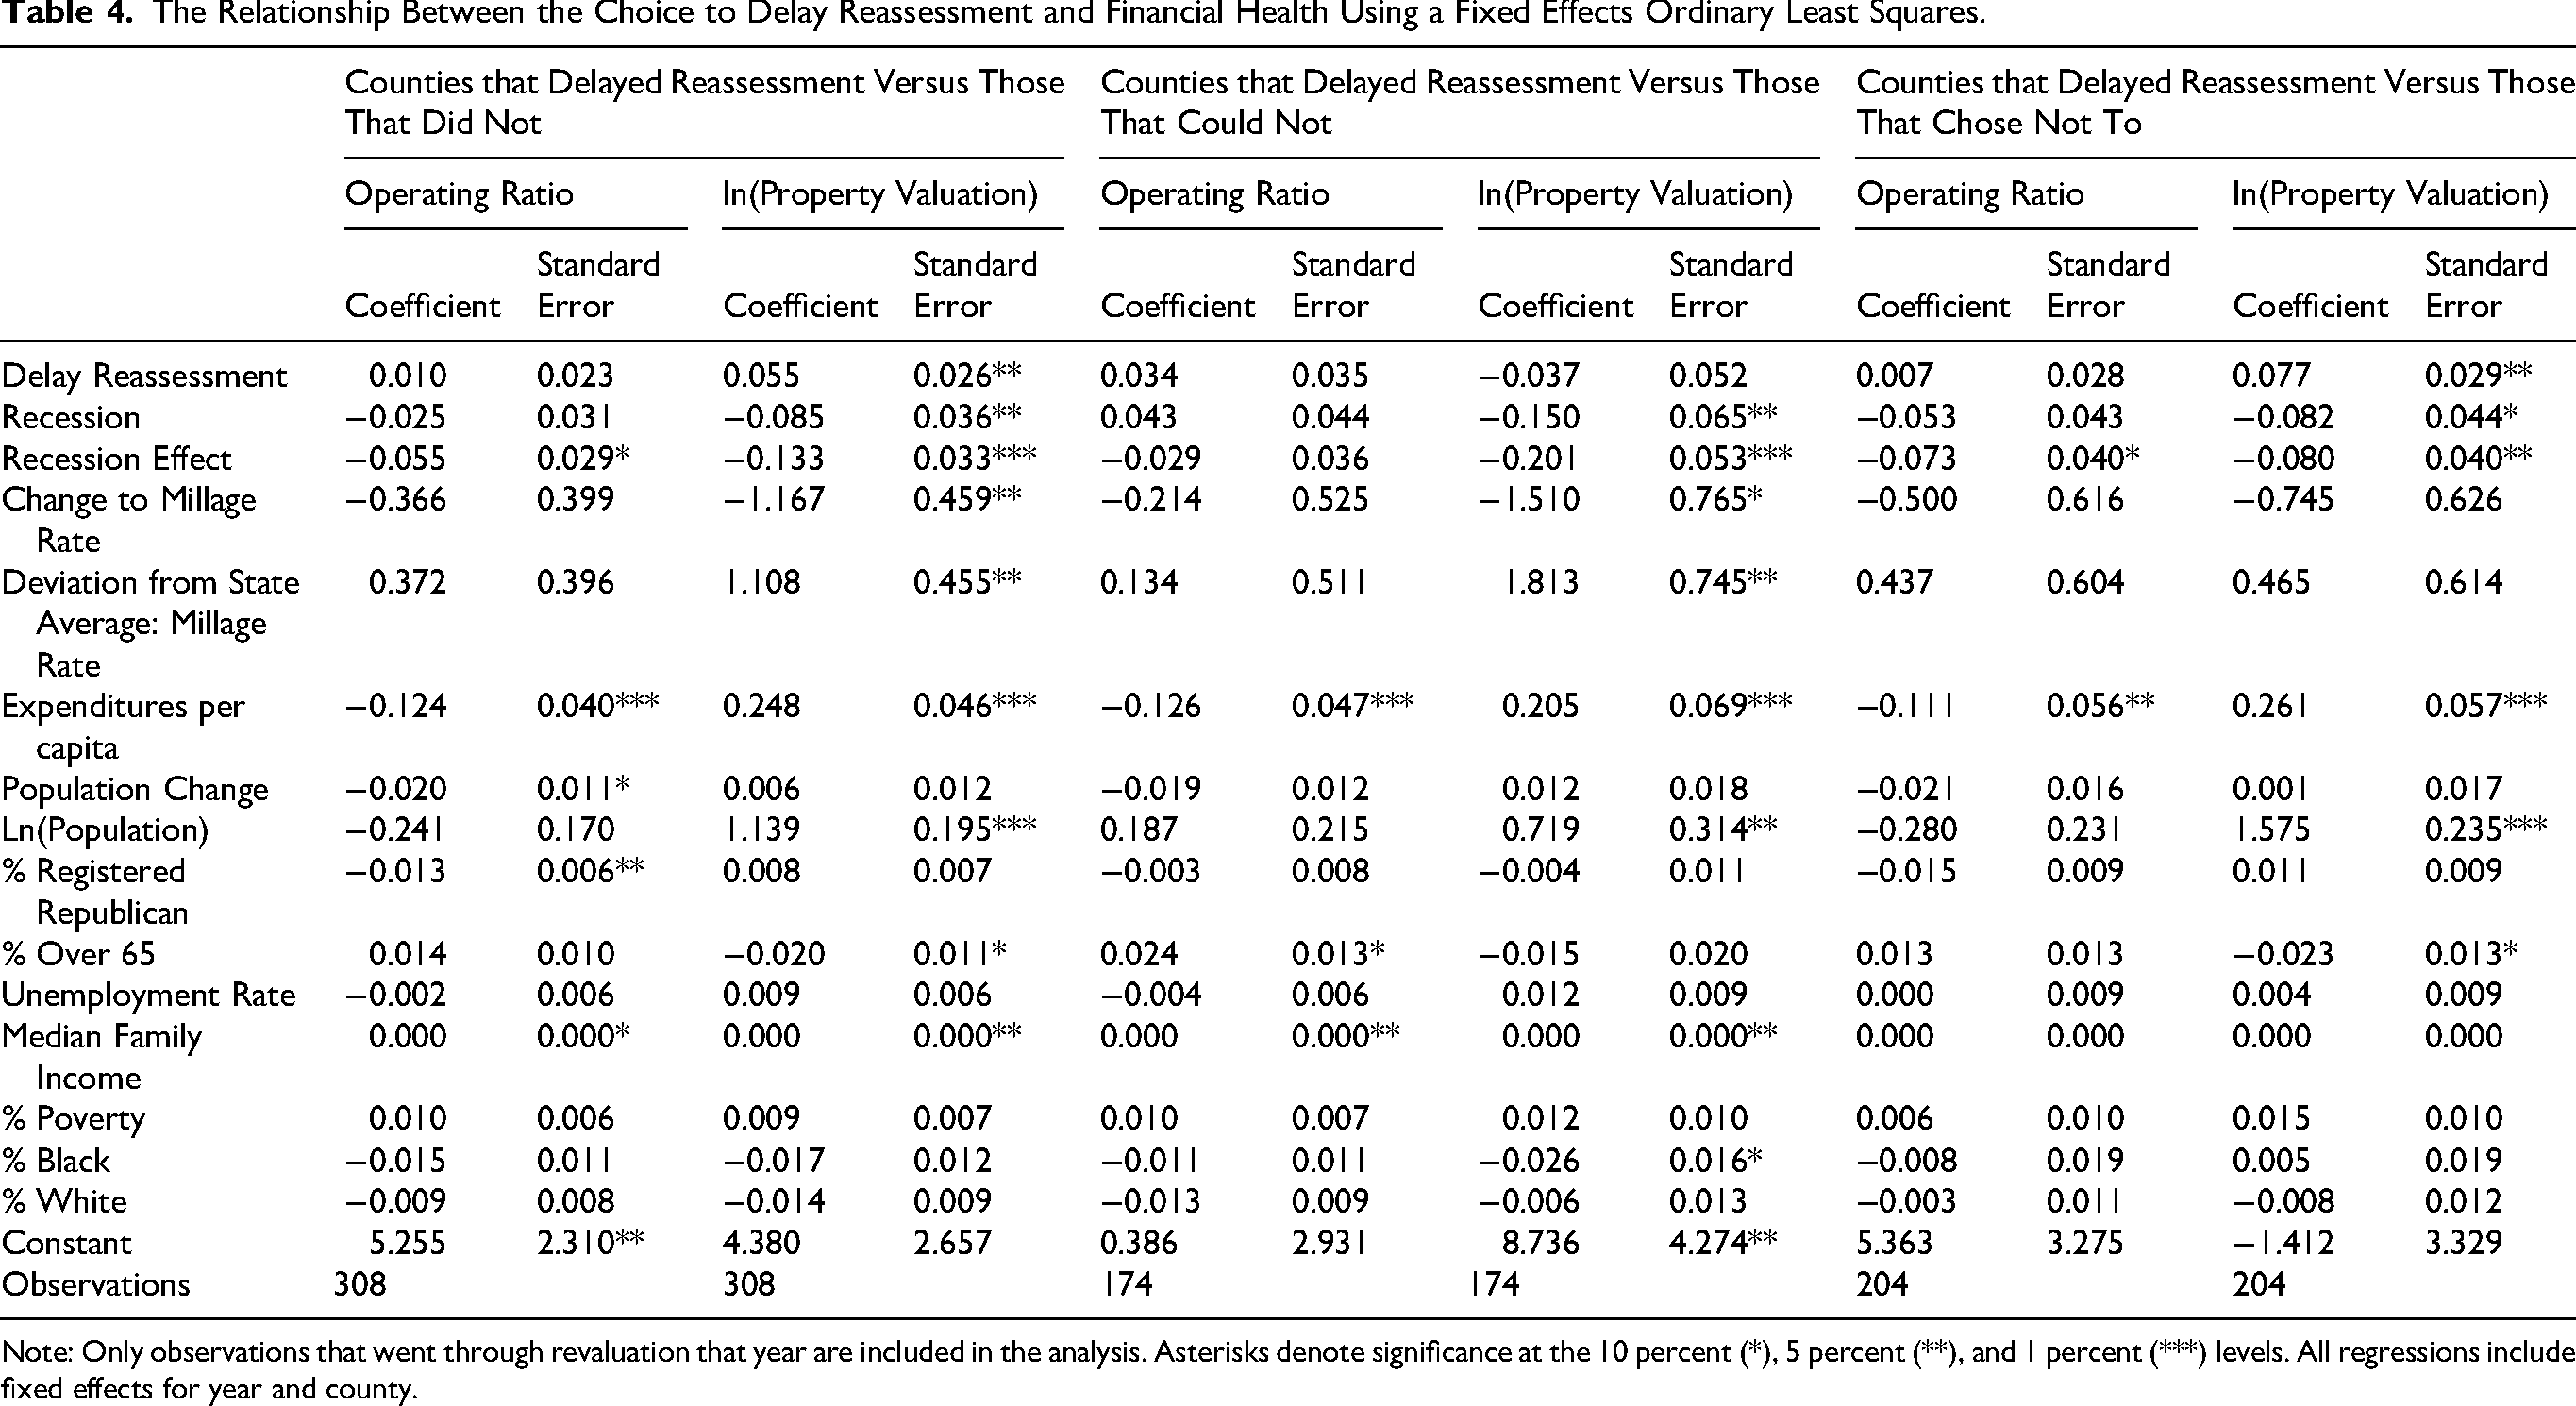
Hypothesis 2 considers whether counties that have mandatory reassessments have lower levels of financial health than counties that have chosen shorter reassessment cycles. Hypothesis 3 posits that counties that delay their reassessments will have higher levels of financial health than those that do not. Table 4 presents the OLS results. 17 The first set of results uses a subset of the data that only includes counties that delayed reassessment and those that did not (either because they had reached the eight-year maximum or they elected not to do so). These results do not suggest an impact on operating ratio. In contrast, property valuation 18 is increased by the decision to delay (p<0.05) and decreased by reassessing during recessions (p<0.05) and recession effect periods (p<0.01). This provides modest support for H3, that the choice to delay will lead to greater financial health. The second set of results replicates that analysis with only counties that delayed reassessment and those that had no discretion to delay because they had reached their eight-year limit. None of the variables of interest are estimated to have had a statistically significant impact on operating ratio, but once again it appears that going through reassessment during recessions (p<0.05) and recession effect periods (p<0.01) may decrease property valuations. The choice to delay is not estimated to have a statistically significant impact. Surprisingly, the final set of results compares counties that chose to delay versus those that chose not to delay and suggests that property valuation is higher for counties that chose to delay (p<0.05). These results do not align with H3a and H3b and deserve more analysis in the future. Once again, the propensity score models offer modest support for the impact of delays on fiscal health. The strongest evidence is in support of a positive impact for property valuation. The results of the propensity score models also offer modest support for H3a and H3b, further suggesting that this is an area deserving of future analysis.
The Relationship Between the Choice to Delay Reassessment and Financial Health Using a Fixed Effects Ordinary Least Squares.
Note: Only observations that went through revaluation that year are included in the analysis. Asterisks denote significance at the 10 percent (*), 5 percent (**), and 1 percent (***) levels. All regressions include fixed effects for year and county.
Step 3: Reassessments During Recession Periods: Impact on Future Cycle Lengths
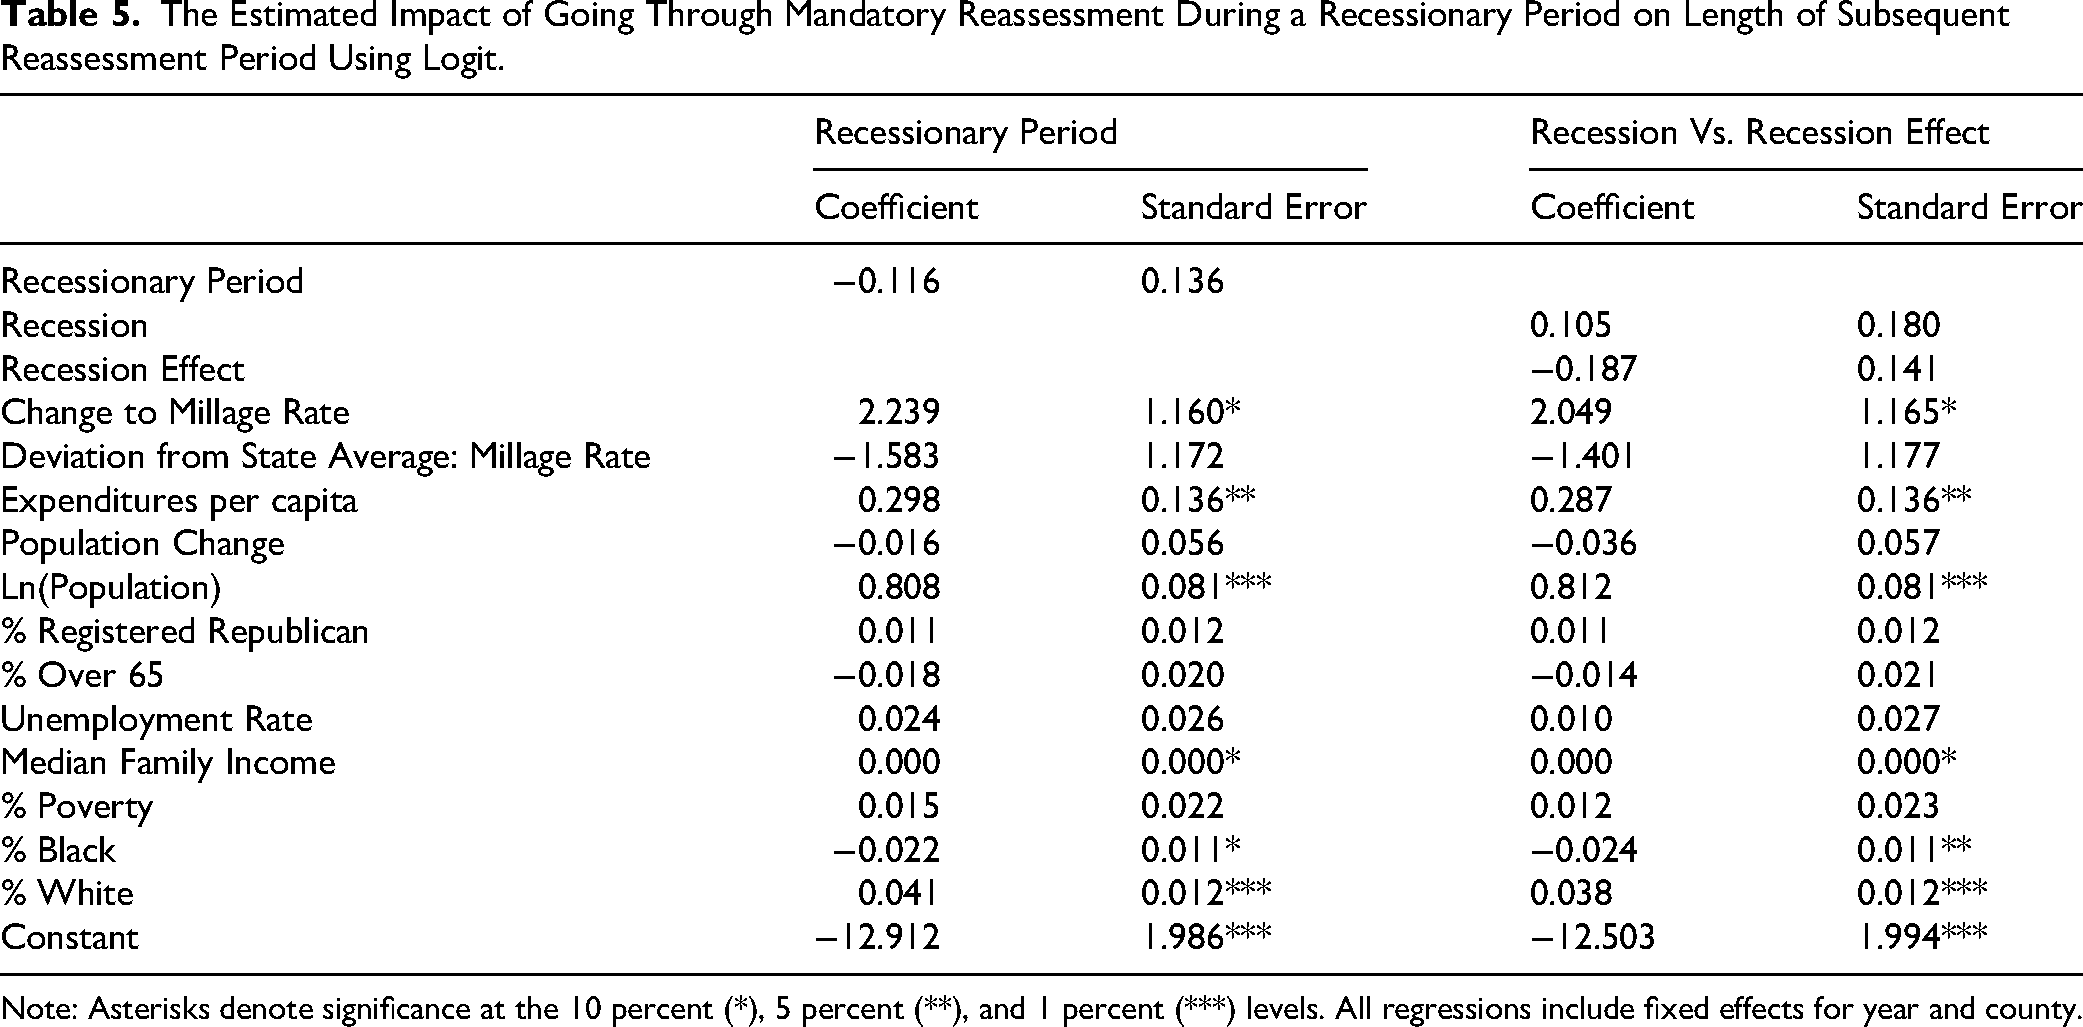
Hypothesis 4, the organizational adaptation hypothesis, posits that counties that had mandatory reassessments during recessionary periods will be more likely to adopt a shorter timeline for their next scheduled reassessment. Table 5 presents the results of the logit analysis. In the left column, the impact of the recessionary period is measured by a binary variable of 1 if the year of the reassessment is in a recession or a recession effect period. In the right columns, the recessionary period is broken out into recession years and recession effect years. The dependent variable is whether the county has adopted a shorter reassessment cycle post-revaluation (coded as 1) or kept the maximum length for reassessment, i.e., 8 years (coded as 0). Contrary to expectations, there are no statistically significant relationships between mandatory reassessment during a recessionary periods and the length of future reassessment cycles. Similar to previous analysis, counties with higher populations (p<0.01) and per capita expenditures (p<0.05) are also more likely to shorten their reassessment schedule. Interestingly, the propensity score models, presented in the appendix, provide evidence that counties that went through mandatory reassessment during non-recessionary periods are more likely to have shorter reassessment cycles than those who went through mandatory reassessment during recessionary periods.
The Estimated Impact of Going Through Mandatory Reassessment During a Recessionary Period on Length of Subsequent Reassessment Period Using Logit.
Note: Asterisks denote significance at the 10 percent (*), 5 percent (**), and 1 percent (***) levels. All regressions include fixed effects for year and county.
Discussion
The analysis in Step 1 demonstrates strong evidence that delaying a reassessment is used as a strategic financial management tool during the years just following an official recession. It suggests that counties with discretion to delay reassessment are much more likely to delay it during a recession effect period than in non-recessionary years. This is unsurprising given that we know that there is a lag between official recession years and when property values are impacted (Alm et al. 2011; Deng & Skidmore 2024; Lutz 2008).
Furthermore, Step 2 offers evidence that counties that can delay reassessments have better financial health as measured by property valuation. These findings support the autonomy-effectiveness theory, that greater autonomy leads to higher performance. North Carolina, by allowing counties to dictate their own reassessment schedules, within bounds, provide an important tool for financial management. Rainey and Steinbauer's (1999) autonomy-effectiveness theory is difficult to examine, but this context provides concrete evidence in support of it. It also demonstrates that not all managers will take advantage of the autonomy, suggesting that there may need to be additional work done to educate and inform public officials—not simply have policies in place.
Additionally, Step 2 shows that there is an impact on financial health not just through the ability to delay reassessment but the decision to do so. This supports an earlier finding in a different context that less frequent reassessments increase revenues (Strumpf 1999). The results are contrary to expectations when comparing counties that chose to delay reassessment and those who went through mandatory reassessment and those that chose not to delay reassessment. The hypothesis was that the impact would be especially strong for those who delayed and went through mandatory reassessment and that there would be a negligible difference between those that chose to delay and counties that chose not to. However, the results of the models suggest the opposite. There was not a statistically significant difference between those who delayed and those that went through mandatory reassessment, but those who chose not to delay were, on average, left with lower property values. It is unclear why this is the case, however it is worth exploring in future work and highlights the need for continued careful evaluation. It is also worth noting for the counties that had discretion, the negative impacts of the recession and the recession effect period were muted compared to those with mandatory reassessment periods and those who chose to delay—suggesting that their overall financial landscape may have been more positive.
Lastly, Step 3 examines how conducting mandatory reassessments during a recessionary period impacts the future selection of reassessment-cycle length. The organizational adaptation literature would suggest that counties that go through reassessments during suboptimal periods will learn and reduce their reassessment cycles moving forward more frequently than counties that mandatorily reassess during non-recessionary periods. However, the evidence presented here suggests the opposite. Counties with mandatory reassessments during recession effect periods (when property values are most likely to be deflated) are most likely to readopt the 8-year schedule. This may, once again, point to the importance of strategic financial management or the lack there of and is worth further analysis, especially as shorter reassessment periods become increasingly common to help answer the question “which counties continue to adopt 8-year reassessment schedules and what are the consequences of those choices?”
These results contribute to an understanding of how increased autonomy may impact performance and the extent to which organizations learn and adapt to new organizational strategies. The most important lesson, however, relates to practice. Shorter reassessment cycles are associated with higher levels of property valuation, all else being equal. Similarly, the decision to delay reassessment is also associated with higher levels of property valuation. Since almost half of states in the U.S. permit counties some discretion over the timing and frequency of their reassessments, this evidence is meaningful. Counties need balanced budgets but often have limited revenue options during economic contractions and this research provides evidence that the timing of property reassessment is being used as a strategic financial management tool and is effective at helping counties keep financial health, as measured by property valuation, high.
Conclusion
This study delves into the strategic financial management practices of North Carolina counties regarding the timing of property reassessments during recessionary periods. The results reveal that counties often delay reassessments in the aftermath of recessions to mitigate potential revenue declines or the need for unpopular tax rate increases. This strategic maneuvering suggests that counties leverage the use of flexible reassessment schedules to navigate economic uncertainties and maintain fiscal stability. Another contribution of this study is that it examines both large and small jurisdictions, whereas much of the previous literature that considers the impacts of recessions on property taxes use samples of large cities or occasionally large counties.
The results also indicate that no autonomy or flexibility in reassessment cycles, as measured by electing to schedule the maximum permitted period, may negatively impact fiscal health. Counties with flexibility who opt to delay reassessment demonstrate slightly higher levels of fiscal health. This highlights the importance of considering reassessment frequency within a broader context of financial management. In addition, the findings challenge the expectation from the organizational adaptation literature, that mandatory reassessments during recessionary periods will prompt counties to adjust their behavior and adopt shorter reassessment cycles.
In practice, these insights underscore the need for policymakers and administrators to consider the timing and frequency of property reassessments as integral components of financial planning. The majority of states cap the period of time between reassessments, like in North Carolina. In fact, most states require localities to go through reassessment more frequently than in North Carolina, but many offer discretion in the timing like North Carolina. While shorter reassessment cycles are shown to increase property values when reassessed during recessionary periods and existing literature highlights the importance of frequent reassessment on equity concerns, the lesson from this analysis is not simply that shorter reassessment cycles are better. The takeaway should be that counties that adopt shorter reassessment cycles and allow themselves the discretion to either continue on that schedule or to delay are better positioned. This is a lesson for counties that are situated in states with discretion and for states that do not currently allow their counties discretion in their reassessment schedules. This finding is in keeping with Rainey and Steinbauer's (1999) autonomy-effectiveness theory. Additionally, these results must also be balanced around political realities and taxpayer concerns regarding shorter assessment cycles such as unpredictability and higher tax burdens, gentrification, and administrative burdens on both government and households.
By understanding the implications of reassessment timing and frequency for revenue stability, equity, and financial health, counties can adopt informed and adaptive strategies to navigate economic challenges while maintaining fiscal integrity. Ultimately, this study contributes valuable insights to the ongoing discourse on property tax policy and its implications for local governance and financial management practices and highlights the importance of sound financial management. As counties face increasingly complex tasks with legal, political, and economic constraints, managers must be proactive in ensuring that their jurisdictions are financially healthy and able to provide efficient, effective, and equitable services. Creating flexibility and discretion in the timing of property tax reassessments is one practice that may help achieve these goals.
Do these results point to a policy solution? Not necessarily. It is a complex issue. These results suggest bounded autonomy, as suggested by Rainey and Steinbauer (1999), may provide greater resilience and short-term fiscal health during periods of economic contraction. However, there are other concerns that must be considered, like those around equity. Evidence on the equitable timing of assessments is complicated. As time goes on, whether in an economic contraction or not, the assessment ratios become more inconsistent leading to inequities. This is why, for example, the International Association of Assessing Officers (2020) generally recommends that reassessments be conducted every 3 to 5 years. However, there is evidence that property tax assessments during the Great Recession did not fully capture the reduction in property values in the updated assessments, likely because of the financial repercussions for the government if values decreased meaningfully (Hodge et al. 2018). Assessors are more likely to respond to increases in property values than decreases (Doerner & Ilhlanfeldt 2011), which reinforces the need for autonomy within bounds. It may be a reasonable short-term solution to delay reassessment, but it should not be used as a longer-term solution, especially in areas with persistent declines in property values. This work compliments other research on the impact of state constraints on local autonomy surrounding property taxes and provides additional insights into the impact of state policies (e.g., Bradbury et al. 2001; Wei & Butler 2021).
Lastly, these results support the Rainey and Steinbauer (1999) autonomy-effectiveness theory which should prompt additional scholarship into where increased autonomy within the public sector may lead to increased effectiveness. Similarly, scholars should also consider where the limits of that autonomy are, since unconstrained autonomy may lead to suboptimal outcomes and too little accountability. Increased autonomy leading to greater efficiency is especially likely in policy areas where local knowledge and expertise are critical (like property tax assessments and local zoning policies) and where the nimbleness and faster responses are critical (like public health and emergency management initiatives). The timing of property tax assessment and its use as a financial management tool in North Carolina is just one test of this theory and work done in other policy and management spaces is warranted.
Footnotes
Ethical Approval
Not applicable
Funding
The author received no financial support for the research, authorship, and/or publication of this article.
Declaration of Conflicting Interests
The author declared no potential conflicts of interest with respect to the research, authorship, and/or publication of this article.
Notes
Author Biography
Appendix 1: Operating Ratios
Figure A1 shows the interquartile range of operating ratios in this period and the trends across the two recessions. The operating ratios seem to track the same basic patterns across the median, the upper quartile, and the lower quartile. Notably, the operating ratios tend to decrease right before the Great Recession and then recover during the recession effect years. While outside the scope of this research, that may be due to local governments tightening their belts during recessions in combination with aid from federal and state governments. As expected, there is an additional decline in operating ratios in 2012, when federal assistance ended.