
Abstract
Purpose
To summarize the degree to which evidence from our recent Making Numbers Meaningful (MNM) systematic review of the effects of data presentation format on communication of health numbers supports recommendations from the 2021 International Patient Decision Aids Standards (IPDAS) Collaboration papers on presenting probabilities.
Methods
The MNM review generated 1,119 distinct findings (derived from 316 papers) related to communication of probabilities to patients or other lay audiences, classifying each finding by its relation to audience task, type of stimulus (data and data presentation format), and up to 10 distinct sets of outcomes: identification and/or recall, contrast, categorization, computation, probability perceptions and/or feelings, effectiveness perceptions and/or feelings, behavioral intentions or behavior, trust, preference, and discrimination. Here, we summarize the findings related to each of the 35 IPDAS paper recommendations.
Results
Strong evidence exists to support several IPDAS recommendations, including those related to the use of part-to-whole graphical formats (e.g., icon arrays) and avoidance of verbal probability terms, 1-in-X formats, and relative risk formats to prevent amplification of probability perceptions, effectiveness perceptions, and/or behavioral intentions as well as the use of consistent denominators to improve computation outcomes. However, the evidence base appears weaker and less complete for other IPDAS recommendations (e.g., recommendations regarding numerical estimates in context and evaluative labels). The IPDAS papers and the MNM review agree that both communication of uncertainty and use of interactive formats need further research.
Conclusions
The idea that no one visual or numerical format is optimal for every probability communication situation is both an IPDAS panel recommendation and foundational to the MNM project’s design. Although no MNM evidence contradicts IPDAS recommendations, the evidence base needed to support many common probability communication recommendations remains incomplete.
Highlights
The Making Numbers Meaningful (MNM) systematic review of the literature on communicating health numbers provides mixed support for the recommendations of the 2021 International Patient Decision Aids Standards (IPDAS) evidence papers on presenting probabilities in patient decision aids.
Both the IPDAS papers and the MNM project agree that no single visual or numerical format is optimal for every probability communication situation.
The MNM review provides strong evidentiary support for IPDAS recommendations in favor of using part-to-whole graphical formats (e.g., icon arrays) and consistent denominators.
The MNM review also supports the IPDAS cautions against verbal probability terms and 1-in-X formats as well as its concerns about the potential biasing effects of relative risk formats and framing.
MNM evidence is weaker related to IPDAS recommendations about placing numerical estimates in context and use of evaluative labels.
There are many situations in which health-related probability information needs to be communicated clearly and effectively to patients. Such data are at the heart of efforts to inform and involve patients in medical decision making. For example, decision aids often include risk estimates to guide screening decisions, effectiveness rates to inform cancer treatment decisions, side effect rates to allow for preference-sensitive choices among medications, or other probability data. 1
In acknowledgment of this fact, the International Patient Decision Aids Standards (IPDAS) Collaboration solicited an expert panel (which included current author B.J.Z. from 2011 onward) to review the research regarding communicating probabilities in each of its 3 rounds of evidence reviews: an initial chapter in the 2005 IPDAS Collaboration Background Document, 2 an updated chapter in the 2012 update of that document that was also published as a separate journal article in 2013,3,4 and 2 papers published together in the 2021 IPDAS evidence review update.5,6 The 2021 papers presented 35 specific recommendations to decision aid developers intending “to present probabilities in a way that facilitates an informed choice.” 5 They are grouped under 11 themes, which discuss presenting the chance than an event will occur, numerical estimates in context and evaluative labels, time-based risk formats, presenting the effect sizes of treatment and screening options, and how and when visual formats should be used.
Both the 2013 and 2021 papers were explicitly narrative reviews, not systematic reviews. As suggested by the themes noted above, many different information design issues are relevant to presenting different types of probability information to different types of patients in different situations. Furthermore, literally hundreds of relevant experimental research studies have been published in the past 20 y on these topics. It was hence impossible for the unfunded expert panel to cover the entire range of relevant literature in their review papers.
The Making Numbers Meaningful (MNM) systematic review project (Prospero registration number CRD42018086270), funded by the US National Library of Medicine (R01 LM012964), was designed to at least partially address this problem. As described in more detail in our methods paper, 7 the MNM review systematically searched for studies containing head-to-head comparisons of 2 or more stimuli containing quantitative health-related probabilities in different data presentation formats, including numbers, graphics, and verbal descriptions. Studies were eligible if the sample was patients or other lay audiences. We identified 316 eligible experimental and quasi-experimental research articles published prior to September 2020 that compared 2 or more formats for presenting probabilities.
We organized this literature according to a conceptual model of communication in which a reader performs a cognitive task upon some stimulus that contains data in some data presentation format, prompting a cognitive, affective, perceptual, or behavioral response that is measured with an outcome measure. 7 These outcomes (identification and/or recall, contrast, categorization, computation, probability perceptions and/or feelings, effectiveness perceptions and/or feelings, behavioral intentions and/or behavior, preference, trust, and discrimination) have turned out to be critical to making sense of the literature review. When we organize research studies by the outcomes they measured, important patterns are revealed. Broadly, these patterns demonstrate that a format that optimizes one outcome may perform poorly for another. 8
The detailed findings of the MNM review regarding probability communication are published in multiple papers: 2 papers focusing on point cognitive tasks (which we reference as point 1 and point 2), in which users assess information about single probabilities such as the chance of disease9,10; 2 papers focusing on difference cognitive tasks (referenced as difference 1 and difference 2), which involve probability differences such as the effect of a therapy or a risk factor, whether these differences are precalculated or available to be calculated;11,12 1 paper focusing on synthesis cognitive tasks (synthesis), 13 which involve integrating multiple probabilities such as chances of harm and chances of benefit for a therapy; 1 paper focusing on time-trend tasks (time-trend) 14 ; and 1 forthcoming paper on tasks involving Bayesian reasoning (e.g., calculating or estimating the posttest probability of disease).
This paper seeks to answer the obvious question: To what degree do the findings from the MNM systematic review papers (which summarize studies available as of September 2020) provide evidence in favor of or against the expert recommendations from the 2021 IPDAS evidence review papers on probability communication written at about the same time? While a full accounting of every relevant study is beyond the scope of this single paper, our intent here is to provide a guidebook-like reference tool. We list the 35 specific IPDAS recommendations, grouped by theme, each with a summary of the relevant evidence statements from the MNM review papers. Each evidence statement includes a reference to the paper sections that contain the associated detailed evidence syntheses and individual research paper citations. For example, we use “(point 2 §5D)” 10 to reference section 5D of the MNM paper on point tasks, part 2. 12 When the IPDAS recommendation addressed a question that was outside the scope of our review or when the MNM review found no relevant studies, we note this outcome in the relevant table but do not discuss those recommendations further.
Each piece of MNM evidence is labeled with its strength of evidence, which was a function of the number of relevant findings, the consistency of those findings, and their credibility. For evidence to be described as
Recommendations 1 to 20 from Bonner et al. (2021): “Current Best Practice for Presenting Probabilities in Patient Decision Aids: Fundamental Principles”
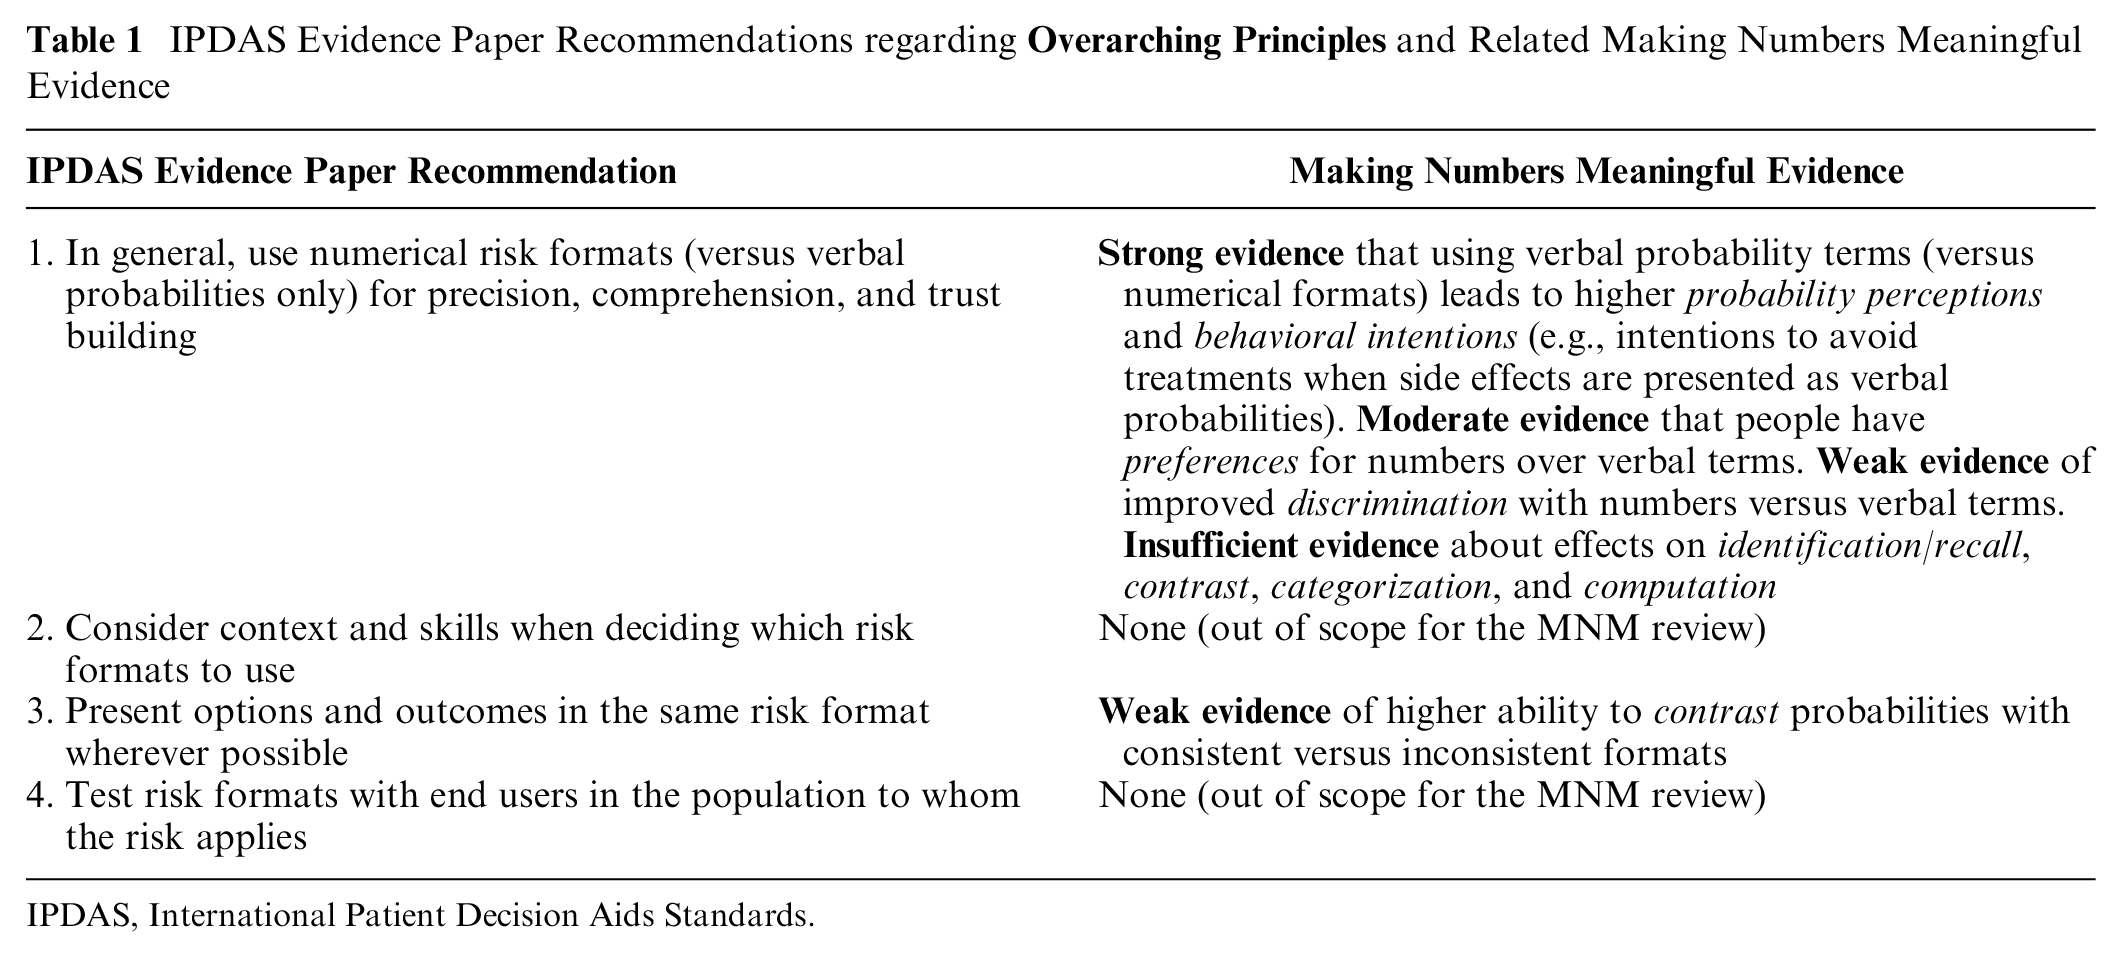
Overarching Principles
The MNM review’s findings generally support IPDAS recommendation 1 to avoid using verbal terms alone (without accompanying numbers) in health data communications (Table 1). However, it is important to note that the MNM project included verbal comparators only if they were verbal probabilities (such as “rare,” “common,” or “unlikely”); other verbal descriptions were excluded as nonnumeric comparator arms. Note also that terms such as “high risk” were often used as evaluative labels, which we classified as a context manipulation. We can thus comment on the comparison of verbal probabilities and numeric probabilities but not on the use of textual descriptions that contain no numbers (e.g., descriptions of the disease or hazard, or personal testimonials about it, without any indication of the likelihood of the event).
IPDAS Evidence Paper Recommendations regarding
IPDAS, International Patient Decision Aids Standards.
Most of the available studies we identified considered the effect of using verbal probabilities versus numbers on people’s abilities to do a variety of point tasks (i.e., cognitive tasks that focus on single probabilities). We identified strong evidence that probability perceptions tended to be higher when side effect chances were communicated using the European Commission–sanctioned set of verbal probability terms versus the numbers designated to match each probability term (point 2 §5D). 10 More broadly, the evidence was strong that probability perceptions differed significantly between numerical and verbal probability formats (point 2 §5D) 12 but that the direction of the effect may depend on the terms used. There was strong evidence that behavioral intention to take an action is more strongly affected by verbal probabilities than numeric information (point 2 §7D) 10 ; for example, the intention to take a drug causing side effects is lower when the chance of side effects is presented in verbal probabilities than when it is presented as a number. However, it should be noted that we found weak evidence that screening intentions (behavioral intentions) were not affected by whether risks and benefit probabilities were presented as rates per 10n versus verbal terms such as “low chance” (synthesis §7D). 13 In addition, we identified moderate evidence that people have higher preferences for numbers over verbal probabilities only (point 2 §9D), 10 and there was weak evidence that people had greater discrimination between probabilities (in terms of their probability perceptions) when numbers were added to verbal probability terms versus when verbal terms were presented alone (point 2 §10D). 10 Evidence was insufficient to make any recommendations about many “comprehension” outcomes such as identification/recall (point 1 §1D), 9 contrast (point 1 §2D), 9 categorization (point 1 §3D), 9 or computation (point 1 §4D). 9 It is also worth noting that we found only 1 study directly addressing the issue of whether verbal descriptions or numeric estimates were better for patient trust. 15 However, the study did not meet our inclusion criteria because the verbal terms were nonnumeric descriptors rather than verbal probabilities. We thus were unable to generate evidence relevant to the IPDAS point on patient trust.
The MNM project found limited evidence in favor of IPDAS recommendation 3 to present options and outcomes in the same format. Specifically, we found weak evidence that people were better able to contrast probabilities presented in consistent versus inconsistent formats (point 1 §2A), 9 but evidence was lacking about the effects on other outcomes.
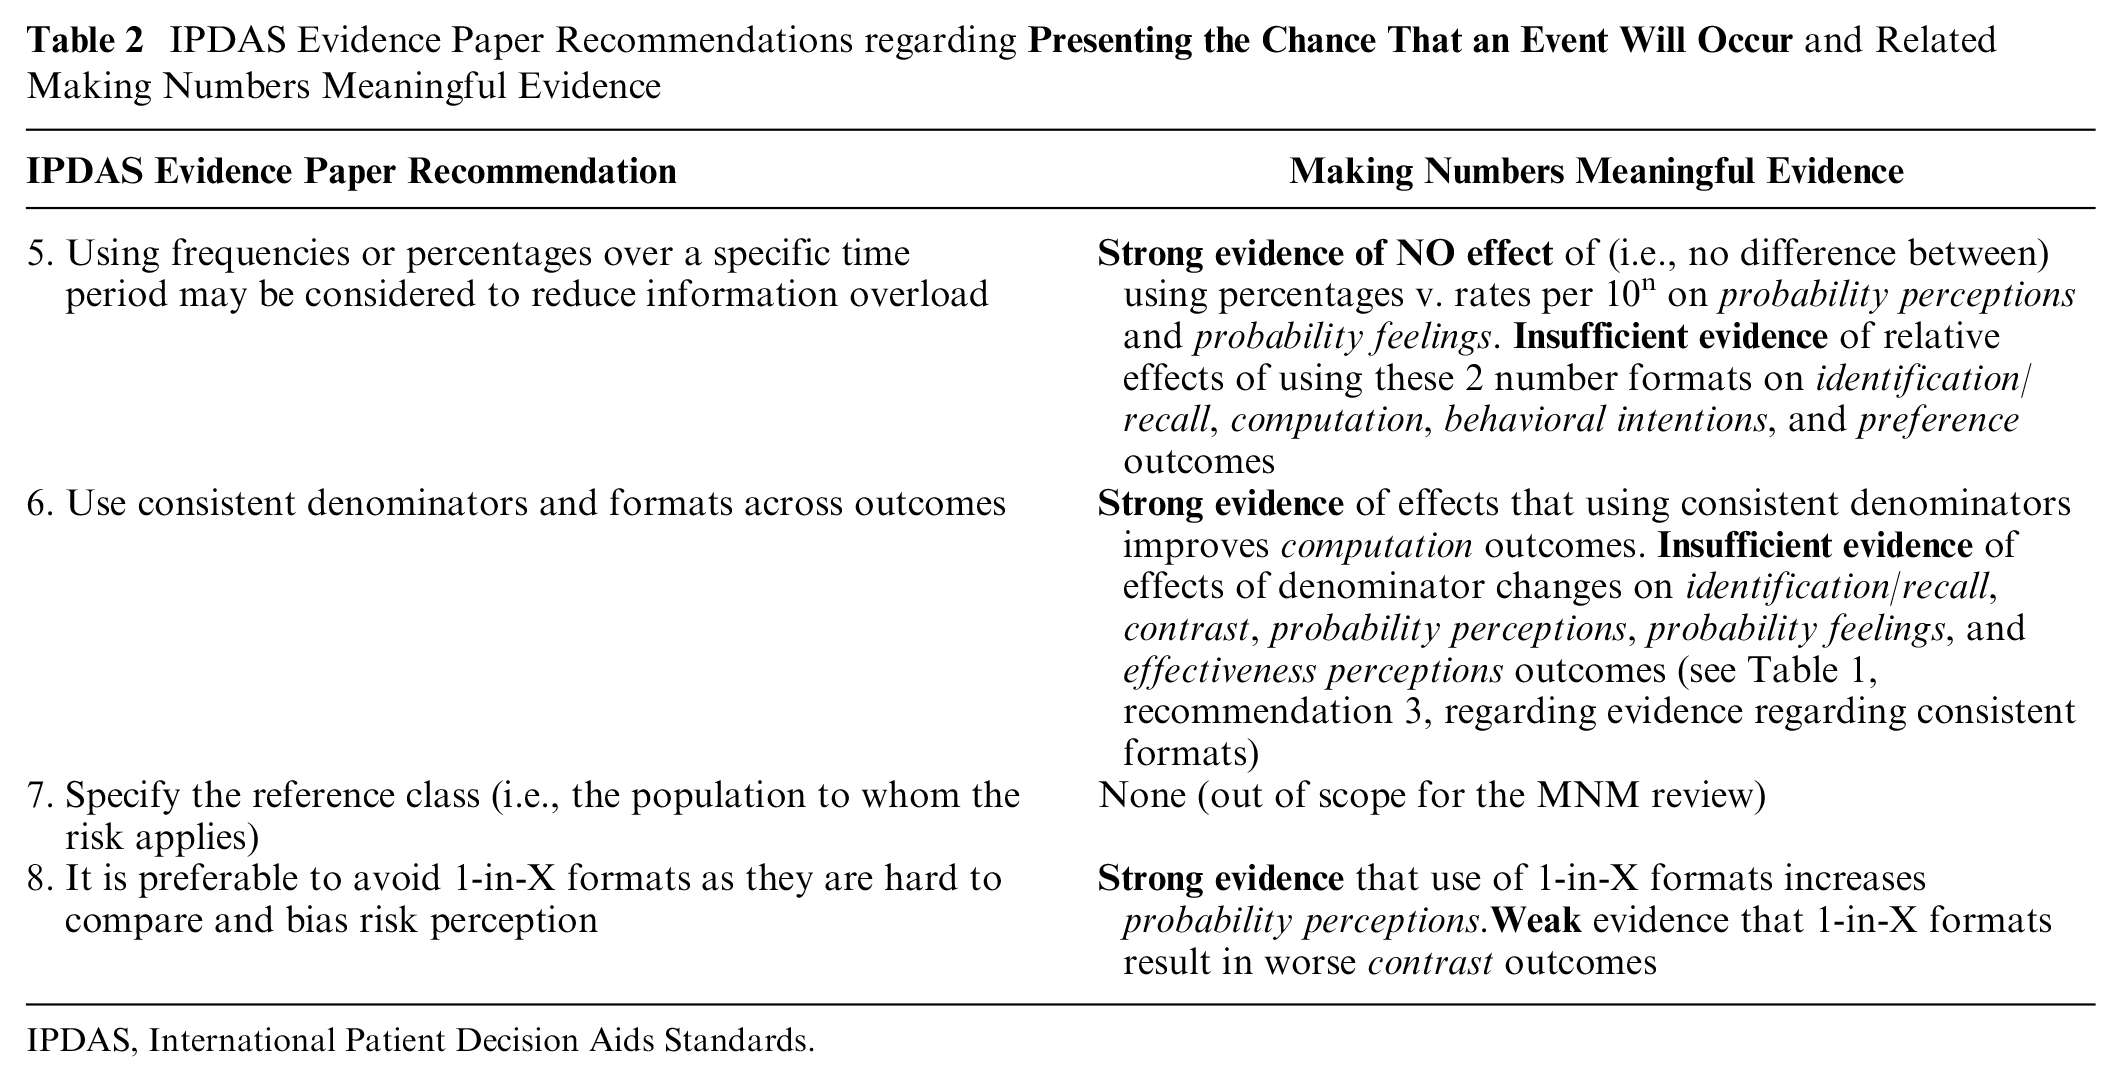
Presenting the Chance an Event Will Occur
IPDAS recommendation 5 (to use frequencies [which we describe as rates per 10n] or percentages to present the chance of a single event occurring over a specified time period to reduce information overload) was out of scope for the MNM project because we did not consider outcomes that could be interpreted as measuring information overload (Table 2).
IPDAS Evidence Paper Recommendations regarding
IPDAS, International Patient Decision Aids Standards.
On a related note, however, the MNM review did compile evidence from direct comparisons of number communications that used rates per 10n versus those that used percentages. We found strong evidence that probability perceptions and probability feelings did not differ when the same probability was presented as a rate per 10n or as a percentage (point 2 §5A), 10 which is somewhat congruent with the recommendation. The MNM evidence was insufficient to provide any guidance about the relative effects of these 2 number formats on identification/recall (point 1 §1A), 9 computation (point 1 §4A), 9 behavioral intentions (point 2 §7A), 10 and preference (point 2 §9A) 10 outcomes. We also found substantial evidence (summarized below for recommendation 8) comparing different types of frequencies (rates per 10n v. the 1-in-X format) and comparing frequency formats to percentage formats.
With regard to IPDAS recommendation 6 encouraging the use of consistent denominators and formats, the MNM project found strong evidence that people’s ability to perform computations was better with consistent versus inconsistent denominators (point 1 §4H). 9 However, there was inconsistent evidence regarding whether denominator changes (numerical or graphical) affect probability perceptions or probability feelings (point 2 §5H). 10 The MNM review found insufficient evidence that denominator changes have effects on identification/recall (point 1 §1H), 9 contrast (point 1 §2H), 9 or effectiveness perceptions (difference 2 §6H) 12 outcomes. (See Table 1, recommendation 3, for the MNM review’s evidence regarding consistent formats.)
We found support for IPDAS recommendation 8, which urges communicators to avoid using the 1-in-X format to communicate probabilities because they are hard to compare and bias risk perception. “Hard to compare” maps to our contrast outcome (the ability to select the larger or smaller of a set of numbers), and there was weak evidence that 1-in-X formats are worse for this outcome than rates per 10n are (point 1 §2A). 9 “Bias risk perception” maps to our probability perceptions outcome, and there was strong evidence that the 1-in-X format increases probability perceptions (point 2 §5A). 10 (It is worth noting that, for some public health topics, communicators might want to increase probability perceptions and might therefore find 1-in-X optimal for this purpose. Even in these cases, however, 1-in-X remains a poor choice when the communicator wants to ensure that readers can perform contrast or categorization tasks. Also relevant to the discussion of 1-in-X is the strong evidence noted above regarding recommendation 6 that using inconsistent denominators such as the 1-in-X format leads to worse computation performance.)
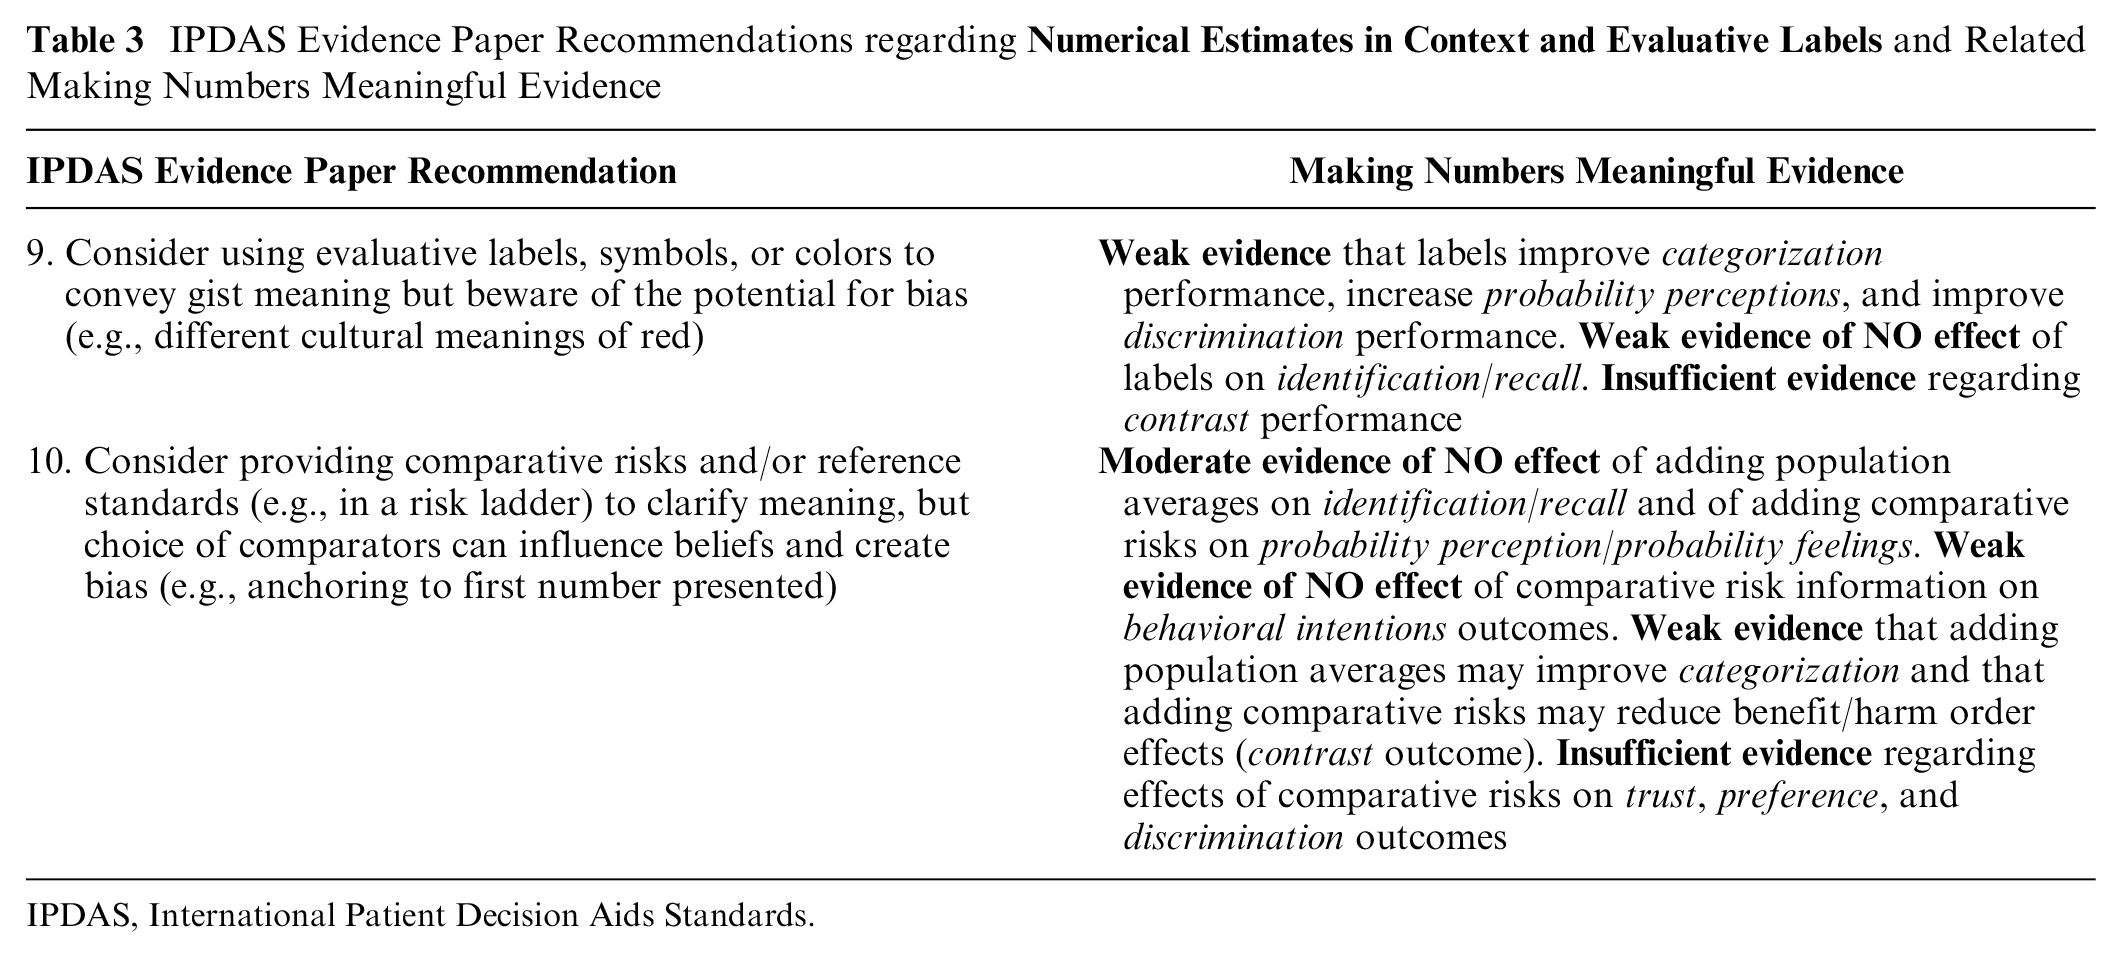
Numerical Estimates in Context and Evaluative Labels
IPDAS recommendation 9 is to use evaluative labels, symbols, or colors to convey gist meaning (Table 3). The MNM review found only weak evidence that adding these elements to numerical and/or graphical probability communications results in improvements in categorization performance (point 1 §3E), 9 changes in probability perceptions (point 2 §5E), 10 and improved discrimination (point 2 §10E). 10 We also found weak evidence that the use of such labels does not influence probability identification outcomes (point 1 §1E). 9 There was insufficient evidence regarding the effect of interpretive labels on contrast performance (point 1 §2E). 9
IPDAS Evidence Paper Recommendations regarding
IPDAS, International Patient Decision Aids Standards.
IPDAS recommendation 10 is to provide comparative risks and/or reference standards in communications. In the MNM review, we gathered evidence separately on providing population average risk information (a type of reference standard) and providing the probability of other comparator risks, with mixed findings. We found weak evidence that providing population averages can improve categorization outcomes, but evidence regarding providing comparative risk information was insufficient (point 1 §3E). 9 We also found weak evidence that providing risks of comparison events can reduce benefit/harm order effects (which we classified as a contrast outcome; point 1 §2E). 9 These limited findings are offset, however, by the MNM project’s findings of moderate evidence that providing population averages does not result in changes to people’s identification/recall performance (point 1 §1E). 9 We also found moderate evidence that providing comparison risks does not influence people’s probability perceptions &/or feelings (point 2 §5E), 10 with additional weak evidence of no effects on their behavioral intentions (point 2 §7E). 10 There was also insufficient evidence regarding whether comparative risks or reference standards had effects on individuals’ trust (point 2 §8E), 10 preferences (Point 2 §9E), 10 or their sensitivity to variations in the probabilities presented (discrimination outcome; point 2 §10E). 10
The inconsistency of the MNM findings, both across outcomes and in comparison with the IPDAS recommendations, is likely a result of the fact that it matters which comparison risks or reference standards are provided, which evaluative labels or symbols are used, and how these types of information are presented vis-à-vis the probability data of interest. Perhaps in recognition of the mixed state of the research evidence, the IPDAS recommendations contain equivocating language, encouraging communicators only to “consider” such approaches. For example, recommendation 9 states that “the benefits of evaluative coding, however, can be unclear or mixed, so they [sic] should be used carefully,” while recommendation 10 notes that “the choice of comparison risks has the potential to influence risk perceptions.”
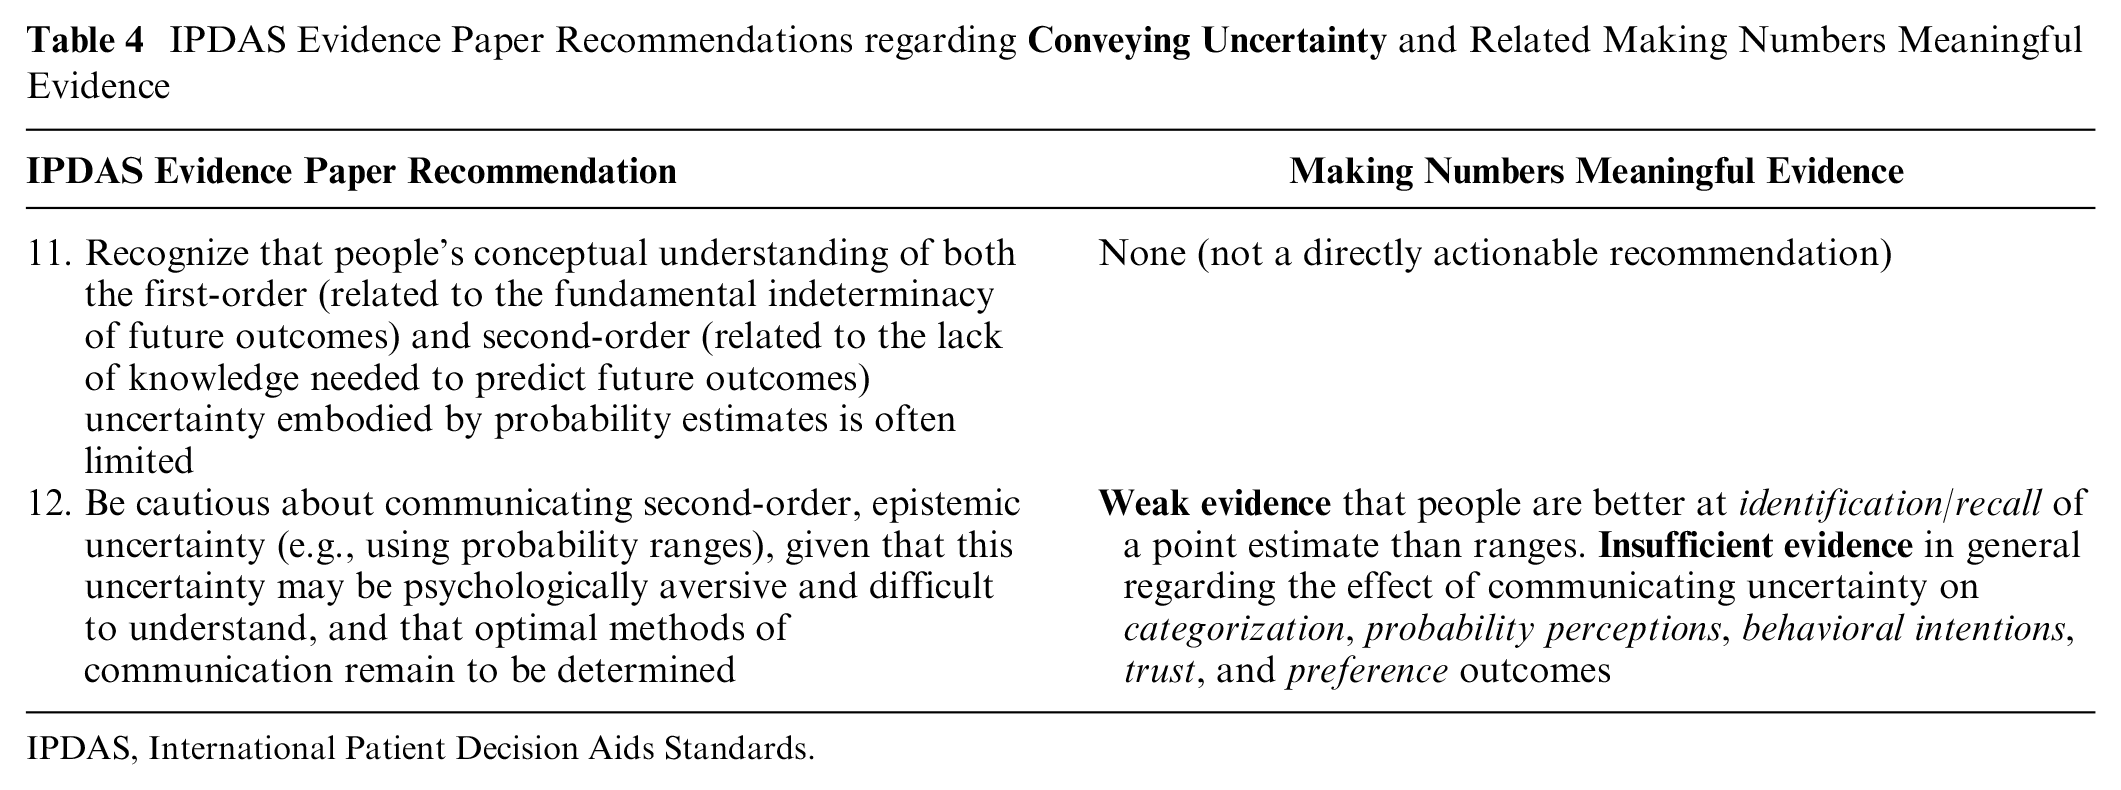
Conveying Uncertainty
IPDAS recommendation 11 encouraged communicators to recognize that understanding of uncertainty is limited, while IPDAS recommendation 12 stated that “optimal methods for communication [of uncertainty] remain to be determined” (Table 4). The limited evidence available in the MNM review supports the idea that communication of probabilistic uncertainty is challenging. We tracked communication of uncertainty/ambiguity as a specific type of data presentation format comparison, finding that the most relevant studies considered point estimates versus ranges or wide versus narrow ranges. However, the MNM’s review’s only evidence finding is that there is weak evidence to support better identification/recall of point estimates over ranges (point 1 §1G), 9 consistent with the IPDAS statement that uncertainty communications may be difficult to understand. This finding is not surprising given that remembering 1 point estimate is inherently easier than remembering the 2 endpoints of a range. We found insufficient evidence regarding the effects of different methods of communicating uncertainty on categorization outcomes (point 1 §3G) 9 as well as trust (point 2 §8G) 10 and preference (point 2 §9G) 10 outcomes (which relates to uncertainty being “psychologically aversive”). In addition, we note that the MNM review found insufficient evidence regarding the effects of formats for communicating uncertainty on probability perceptions (point 2 §5G) 10 and behavioral intentions (point 2 §7G). 10 The lack of clear evidence regarding uncertainty communications was due to both limited numbers of studies and inconsistent findings within the existing research.
IPDAS Evidence Paper Recommendations regarding
IPDAS, International Patient Decision Aids Standards.
Time-Based Risk Formats
IPDAS recommendation 13 acknowledges the limited research on time-based formats and thus simply recommends considering audience needs when deciding among formats (Table 5). We also found that the literature on conveying risk over time is quite sparse.
IPDAS Evidence Paper Recommendations regarding
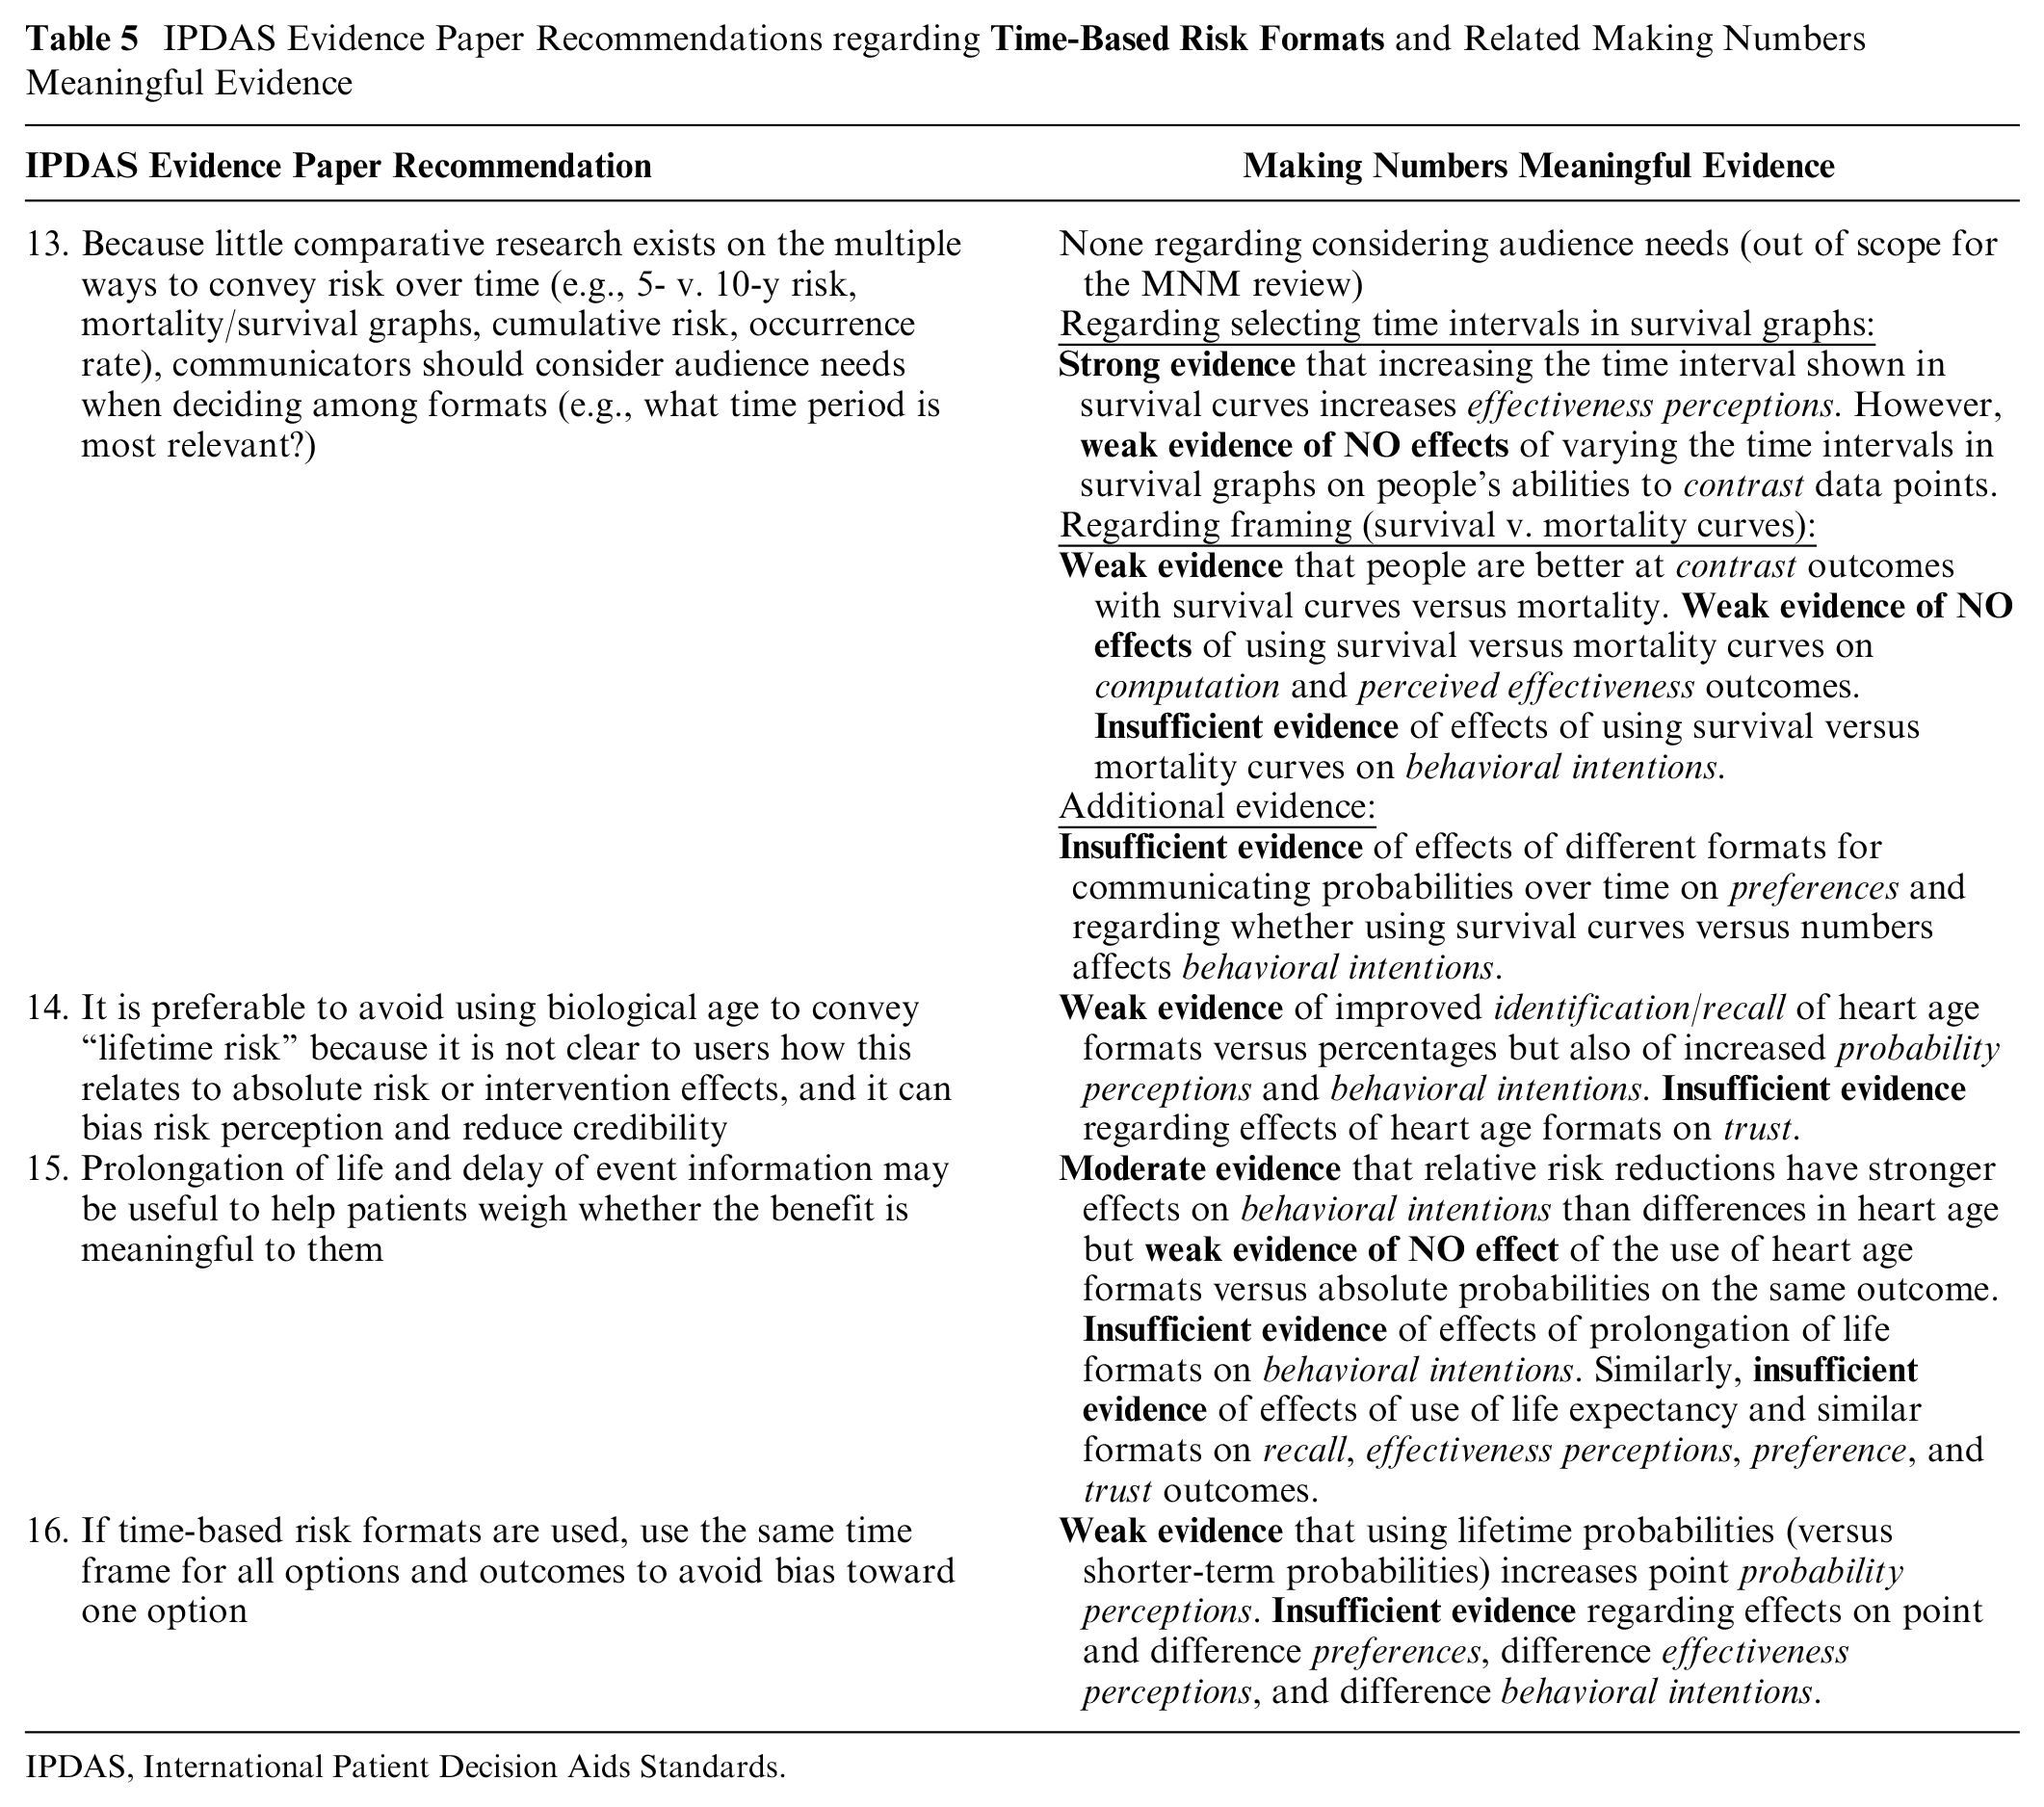
IPDAS, International Patient Decision Aids Standards.
However, the MNM review did identify several sets of evidence pertinent to the design of time-based probability communications. There was insufficient evidence about whether behavioral intention was affected by using survival versus mortality curves (time-trend §7F) 14 or by using survival curves versus numerical formats (time-trend §7C). 14 When comparing survival curves versus mortality curves for presenting outcomes over time, there was weak evidence that survival curves resulted in improved ability to identify the highest survival (contrast outcome; Time-trend §2F) 14 but also weak evidence that using survival versus mortality curves did not affect either computations (time-trend §4F) 14 or perceived effectiveness (time-trend §6F). 14 There was also insufficient evidence regarding people’s preferences among formats for presenting time-based probability data (time-trend §9B). 14 Regarding the choice of time intervals, we found strong evidence that using a longer time interval when presenting probabilities over time in survival curves increases effectiveness perceptions (time-trend §6J). 14 However, it is worth noting that varying time intervals did not appear to affect people’s abilities to contrast survival curves (weak evidence; time-trend §2J)). 14
IPDAS recommendation 14 is to avoid biological age or lifetime risk formats because they are not easily mapped to absolute risks, can bias risk perceptions, and may have reduced credibility. We did not find evidence about whether readers can deduce absolute or relative risks from biological age and therefore cannot address this aspect of the recommendation. The limited number of comparative studies identified in the MNM review focused on the use of heart age formats (a variant of the biological age or lifetime risk format), finding weak evidence that these formats increased both probability perceptions (point 2 §5A) 10 and behavioral intentions (point 2 §7A). 10 We also found weak evidence that this format improved identification/recall performance over percentages (point 1 §1A). 9 There was insufficient evidence regarding whether trust (i.e., credibility) was affected by the use of the heart age format versus other numerical formats (point 2 §9A). 10
Although IPDAS recommendation 15 suggests that prolongation of life and/or delay of event formats may be useful to communicate probability differences/effect sizes, the MNM review found moderate evidence that communicating differences in heart age has weaker effects on behavioral intentions than differences in relative risk reductions do (difference 2 §7A). 12 Furthermore, there was weak evidence of no effect on behavioral intentions between using heart age formats versus absolute probabilities to communicate probability differences (difference 2 §7A). 12 There was insufficient evidence (due to inconsistent findings) regarding whether prolongation of life formats affects behavioral intentions (difference 2 §7A), 12 although there was weak evidence that presenting options in life expectancy terms instead of percentages may affect behavioral intentions (synthesis §7A). 13 Similarly, our review found insufficient evidence about whether life expectancy and similar formats had effects on recall (difference 1 §1A), 11 effectiveness perceptions (difference 2 §6A), 12 preference (difference 2 §9A), 12 and trust (difference 2 §8A) 12 outcomes.
Regarding IPDAS recommendation 16 to use a single, consistent time period in communications about the cumulative risk over a period of time, the MNM project did not find evidence about consistent versus inconsistent time periods. However, it did identify weak evidence that presenting lifetime probabilities rather than shorter time interval probabilities increases point probability perceptions (point 2 §5J). 10 There was insufficient evidence regarding effects of time period changes on point and difference preferences (point 2 §9G 10 ; difference 2 §9J), 12 difference effectiveness perceptions (difference 2 §6J), 12 and difference behavioral intentions (difference 2 §7J). 12 Nonetheless, we generally agree with the communication principle of format consistency to facilitate comprehension and comparison, which was discussed above as related to IPDAS recommendations 3, 6, and 8).
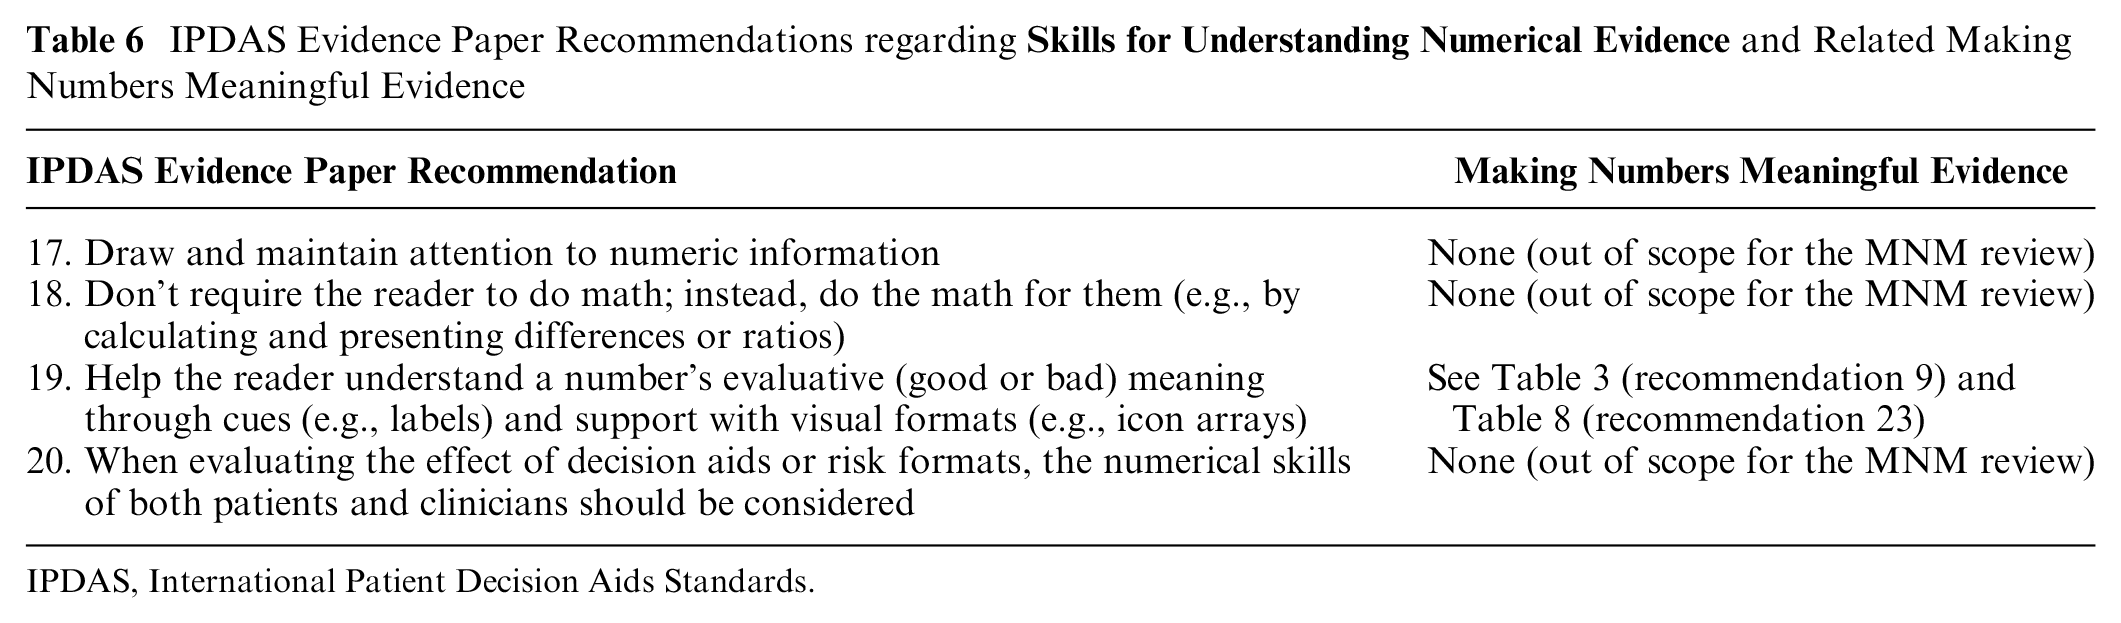
Skills for Understanding Numerical Estimates
While we generally agree with IPDAS recommendation 18 to avoiding asking readers to do math, the MNM project intentionally separated evidence related to identification/recall outcomes from computation outcomes (Table 6). As a result, we did not directly compare studies that asked participants to compute differences between absolute rates (e.g., percentages) versus those that asked participants to identify or recall precalculated differences. Hence, we cannot provide any direct evidence regarding this recommendation. Our review did find that the ability to perform computations was far from perfect even when communications used the best-performing presentation formats, which is consistent with the general advice to avoid having readers do such tasks. In addition, see Table 7 (below) for evidence comparing precalculated difference statistics (e.g., relative risk reduction or absolute risk reduction) versus pre/post rates or percentages.
IPDAS Evidence Paper Recommendations regarding
IPDAS, International Patient Decision Aids Standards.
IPDAS Evidence Paper Recommendations regarding
IPDAS, International Patient Decision Aids Standards.
With regard to IPDAS recommendation 19 regarding using cues such as labels and/or visual formats to help clarify a probability communication’s evaluative meaning, please see Table 3 for a summary of the MNM review’s relatively limited evidence on the effects of labels and Table 8 for the extensive amount of available evidence regarding the effects of using visual formats.
IPDAS Evidence Paper Recommendations regarding
IPDAS, International Patient Decision Aids Standards.
Recommendations 21 to 35 from Trevena et al. (2021): “Current Challenges when Using Numbers in Patient Decision Aids: Advanced Concepts”
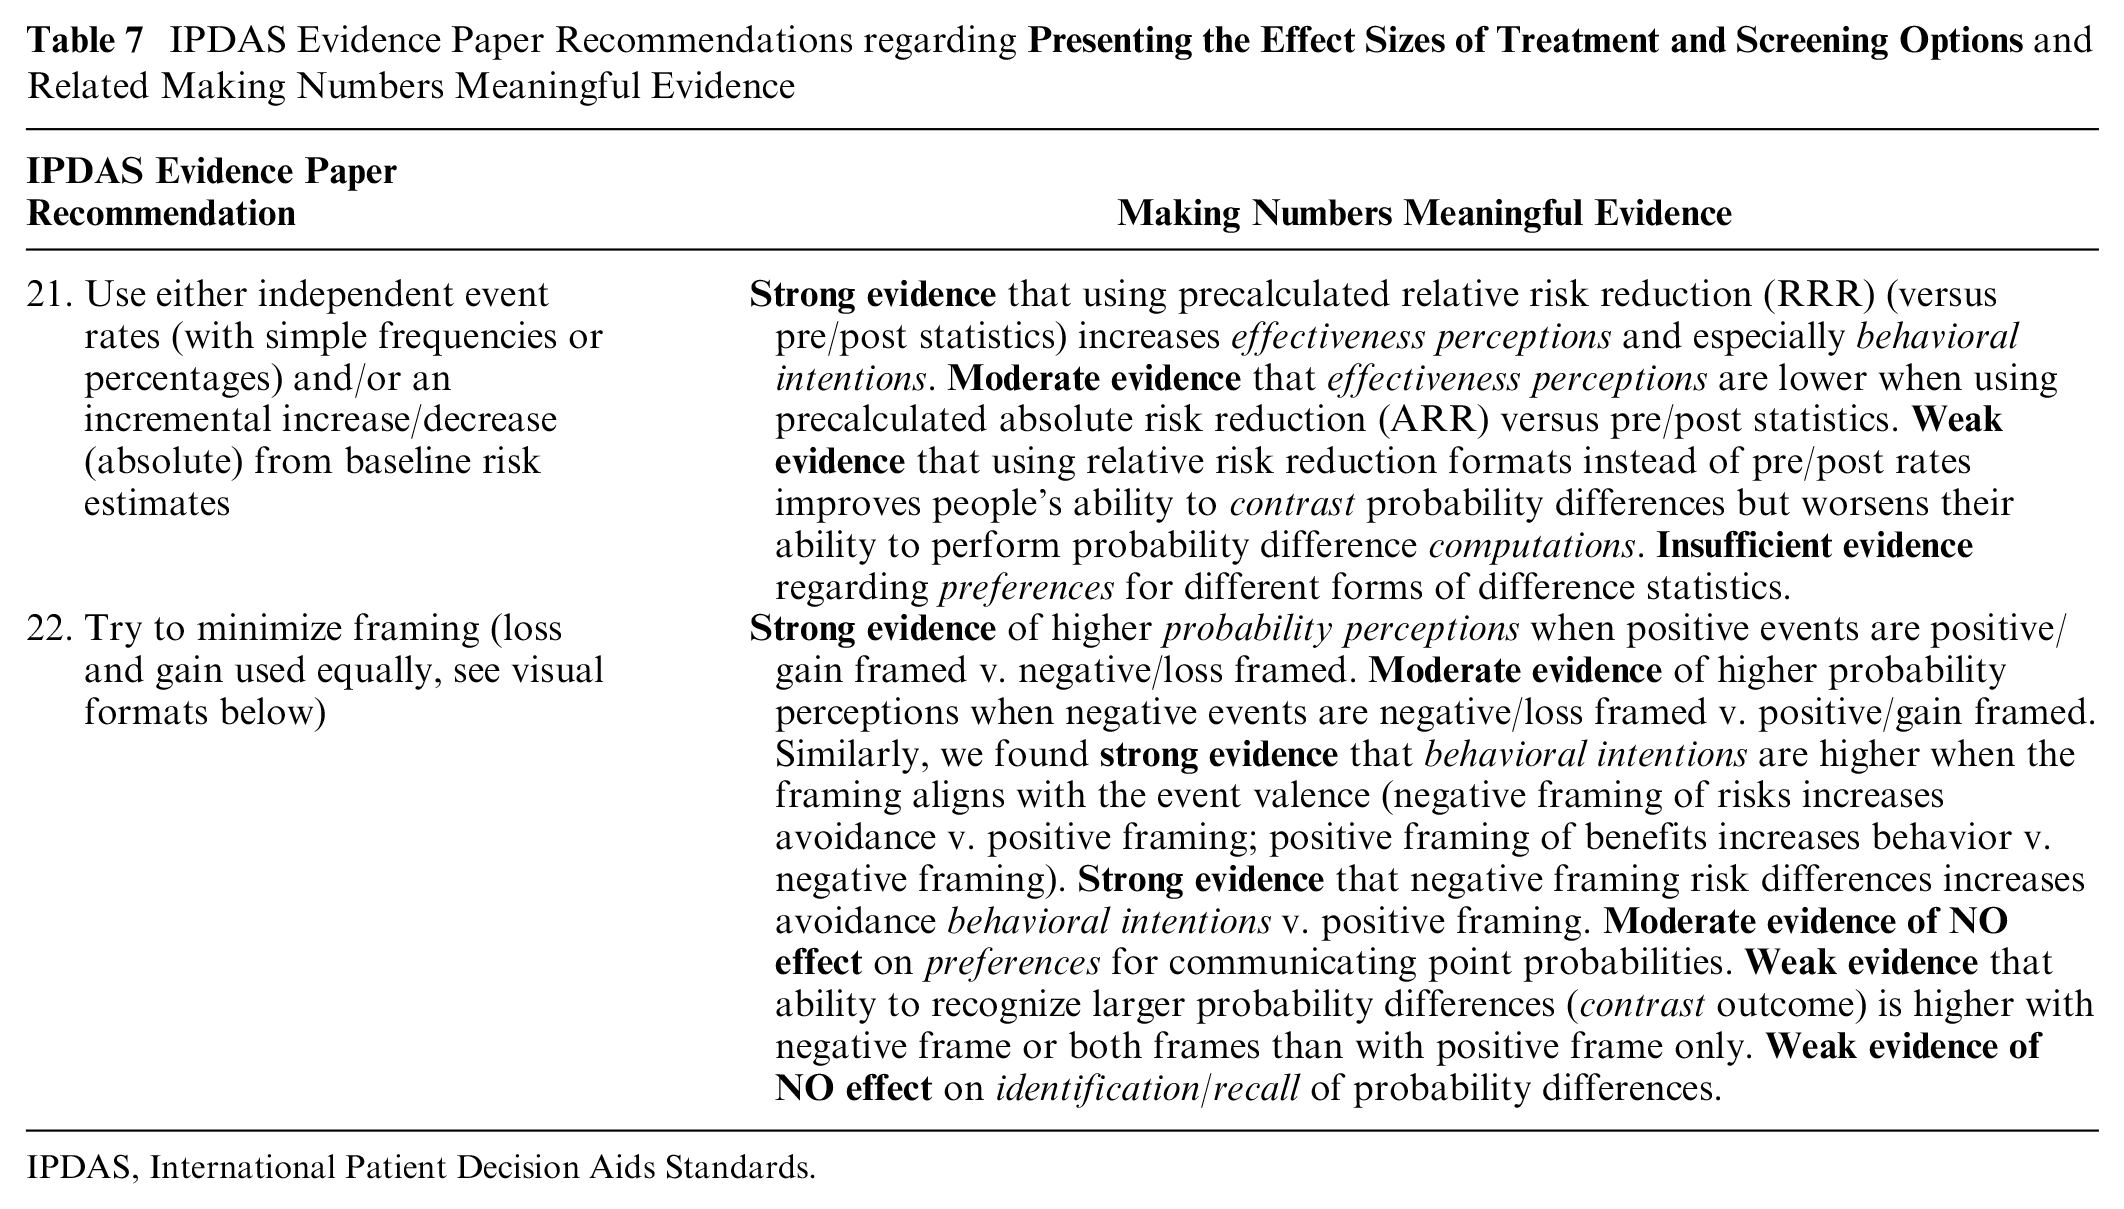
Presenting the Effect Sizes of Treatment and Screening Options
The MNM review found substantial evidence to support IPDAS recommendation 21 to present effect sizes (i.e., probability differences attributable to interventions such as screening tests or treatments) using either independent event rates (shown as either frequencies or percentages) or precalculated absolute differences from baseline levels (Table 7). We found strong evidence that the use of relative risk reduction has amplifying effects on both effectiveness perceptions (difference 2 §6A) 12 and especially behavioral intentions (difference 2 §7A) 12 in comparison with communications of the same probability differences using pre/post pairs of event rates. However, there was moderate evidence that providing baseline risk plus absolute risk differences (versus pre/post rates) reduced effectiveness feelings (difference 2 §6A). 12 We also found weak evidence that using pairs of pre/post rates (instead of relative risk reduction) to communicate effect sizes resulted in an improved ability to perform computation (difference 1 §4A), 11 although there was also weak evidence that pre/post rates resulted in worse ability to perform contrast tasks versus relative risk reduction (difference 1 §2A). 11 Evidence was insufficient regarding people’s preferences among formats for communicating probability differences (difference 2 §9A). 12
Regarding IPDAS recommendation 22 to minimize framing in presentations of probabilities in decision aids, our review found strong evidence that framing can alter both probability perceptions (point 2 §5F) 10 and behavioral intentions (point 2 §7F 10 ; see also synthesis §7F 13 ). The specific effects of framing depend on whether what is being presented is the chance of a negative event (e.g., a side effect or a cancer diagnosis) versus the chance of a positive event (e.g., treatment success). Put simply, the amplification effect to probability perceptions appears for when the valence of an event aligns with its framing: negative events are perceived as more likely with negative versus positive framing, while positive events are perceived as more likely with positive versus negative framing. These effects also map over to the behavioral intentions outcome, as we find strong evidence that people are more likely to intend to avoid negative risks when they are negatively framed and more likely to intend to pursue positive behaviors when benefits are positively versus negatively framed. It is important to note that these effects occurred not only with point tasks (where users focused on a single probability statistic) but also with difference tasks: framing risk differences as increasing the chance of a negative outcome increases people’s intention to avoid that risk versus the same information as a decrease in the chance of avoiding the negative outcome (i.e., positive framing) (difference 2 §7F). 12
It is worth noting that these strong effects of framing on probability perceptions and behavioral intentions do not consistently carry over into other outcomes. The MNM review found moderate evidence that preferences are not affected by framing of point communications (point 2 §9F), 10 but there was weak evidence of preferences for single-outcome/gain-framed icon arrays versus multioutcome/combination-framed icon arrays in synthesis tasks (synthesis §9D). 13 We also found weak evidence of no effects of framing on identification &/or recall of probability differences (difference 1 §1F). 11 The only other finding from our review is weak evidence that the ability to contrast probability differences (i.e., the ability to recognize larger versus smaller differences) may be higher when these differences are presented either as negative frame (i.e., the change in the chance of the bad event) or combined framed versus positive framed only (difference 1 §2F). 11
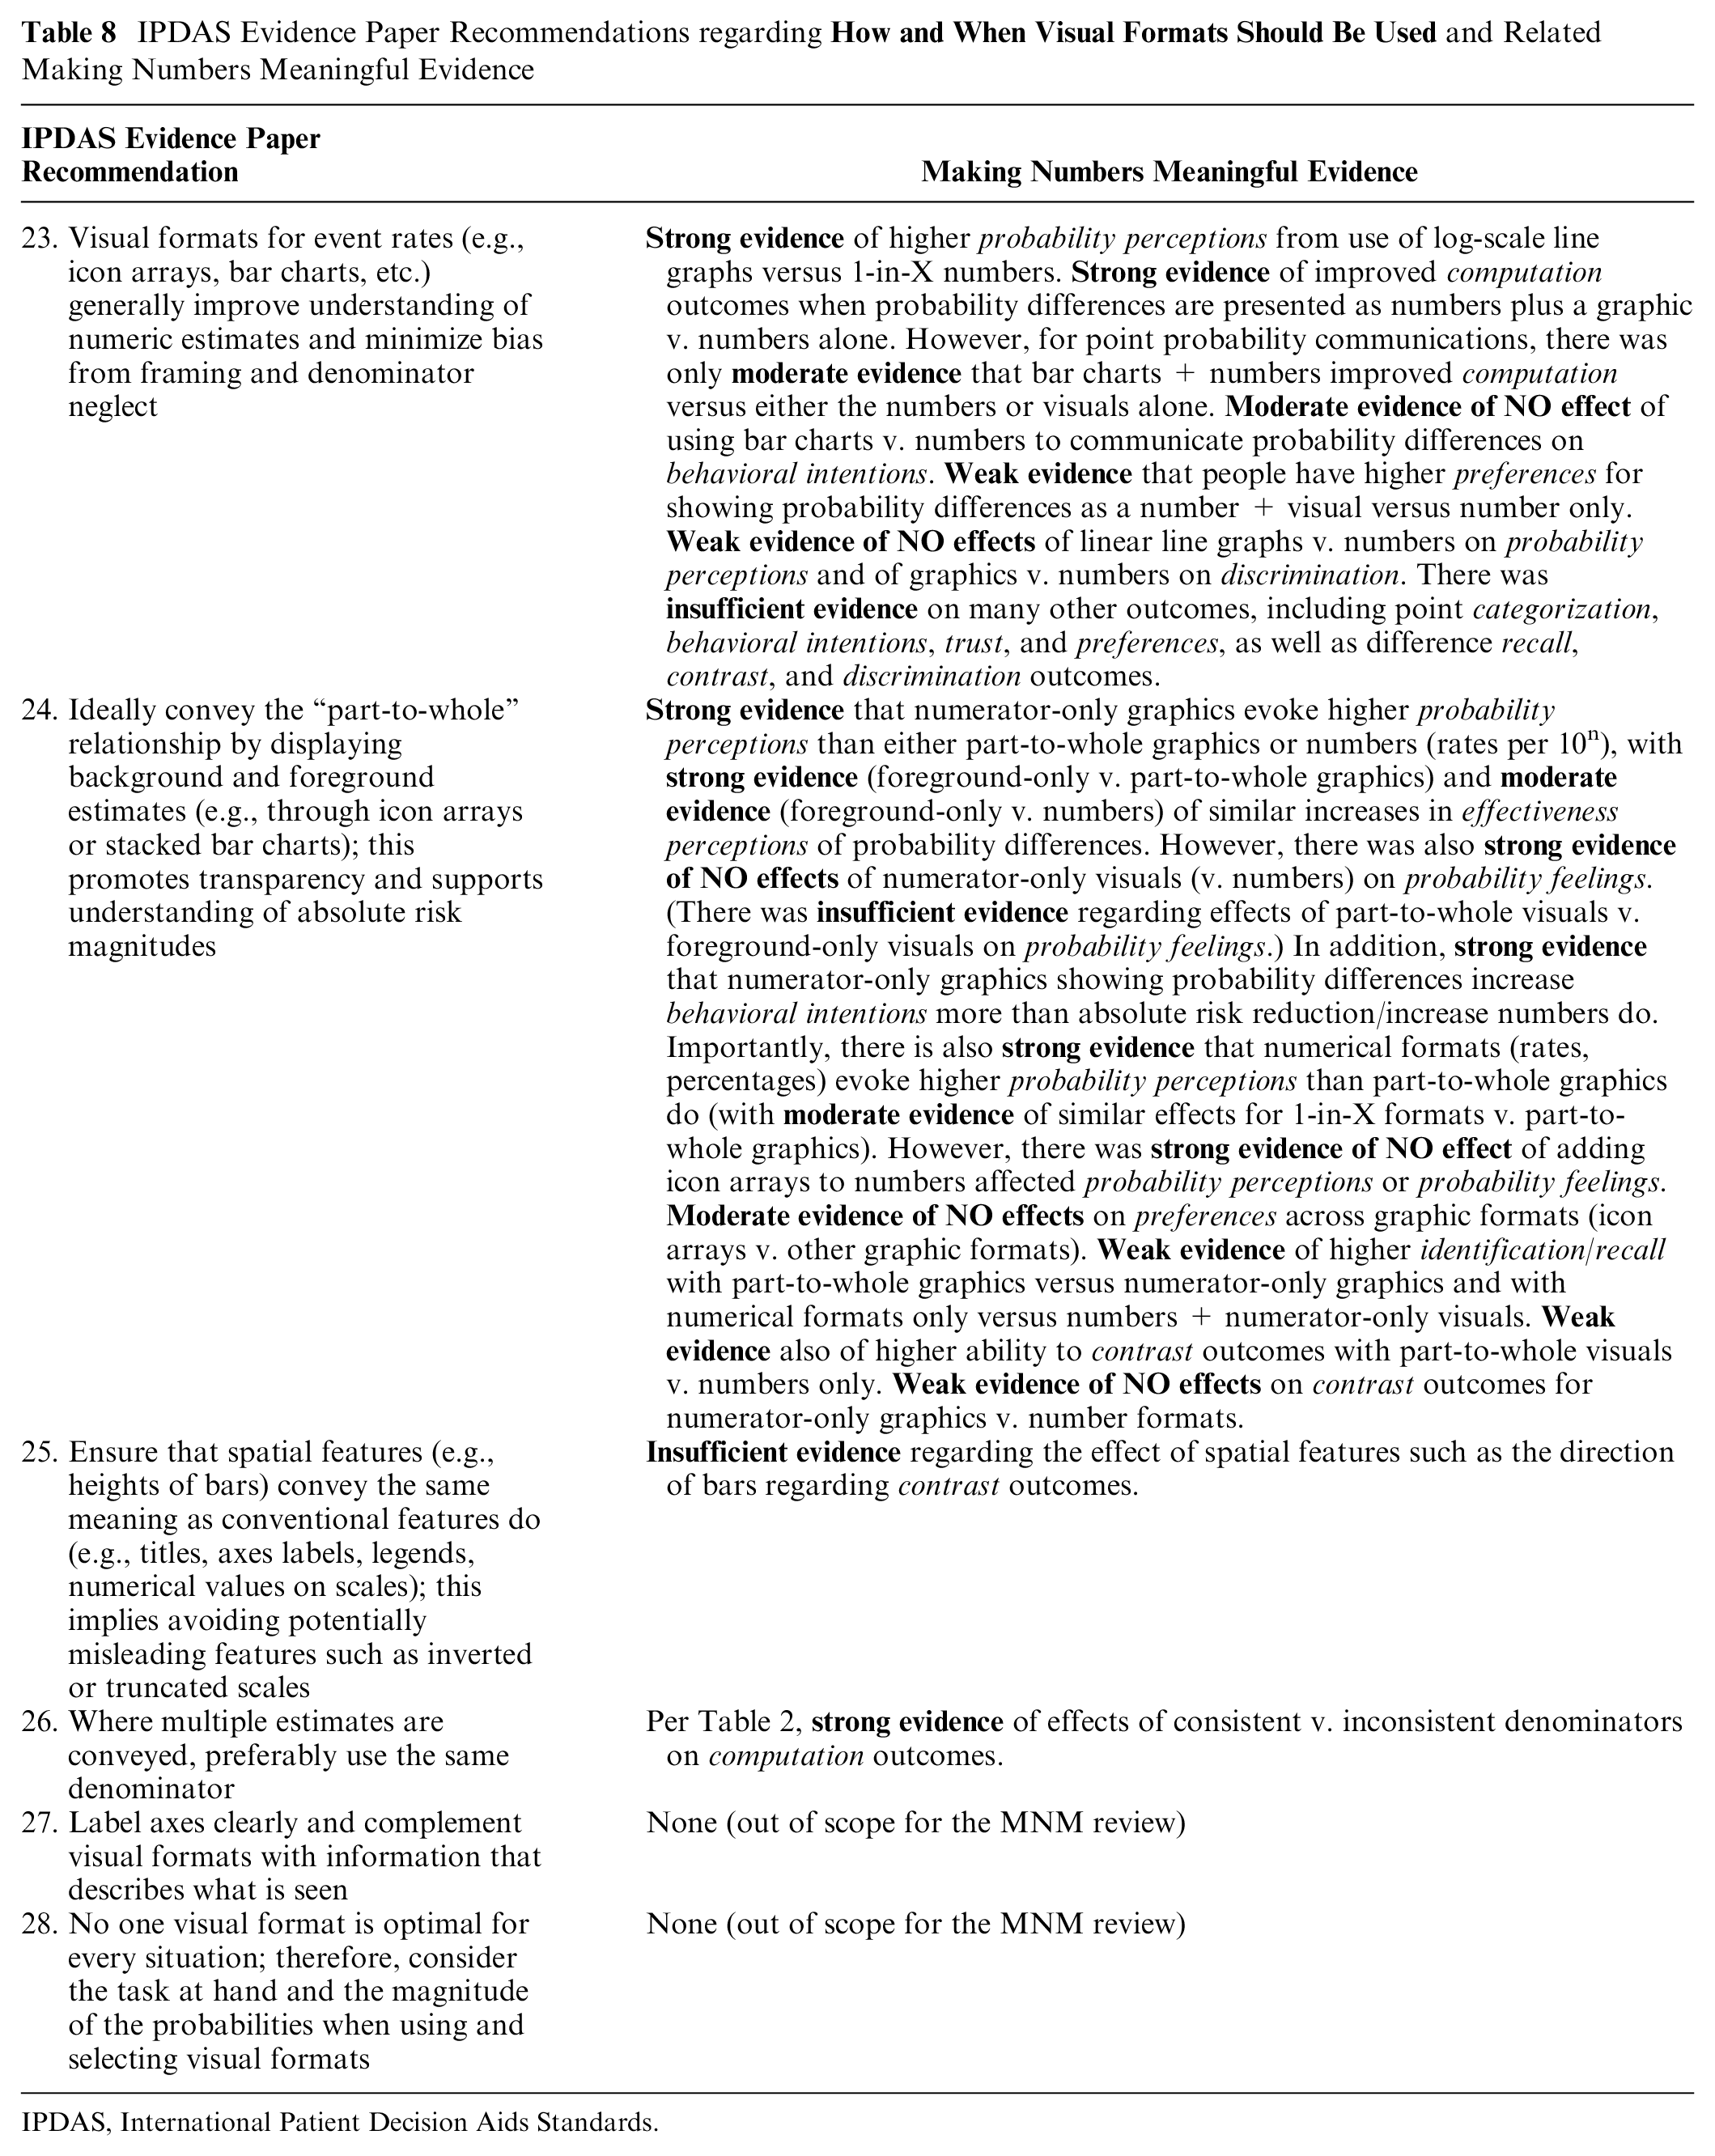
How and When Visual Formats Should Be Used
The MNM review found extensive evidence to support IPDAS recommendation 24 encouraging the use of visual formats that represent the part-to-whole relationship inherent to the definition of a probability (i.e., the ratio of numerator events to a larger population denominator) rather than only visually showing the numerator (i.e., the number of events) (Table 8). Specifically, we found strong evidence that numerator-only visual formats result in higher probability perceptions than when the same ratio is shown in part-to-whole graphic formats (e.g., icon arrays or stacked bar formats) or numbers (rates per 10n) (point 2 §5B 10 ; point 2 §5C 10 ). In addition, our review found strong-to-moderate evidence of the same effects on effectiveness perceptions of probability differences (difference 2 §6B 12 ; difference 2 §6C 12 ). Consistent with the perceptions findings, we also found strong evidence that numerator-only graphics showing probability differences influence behavioral intentions more than the same differences presented as part-to-whole graphics or absolute risk reduction or increase numbers (difference 2 §7B 12 ; difference 2 §7C 12 ). In addition, we found weak evidence part-to-whole visuals resulted in better identification/recall than numerator-only visuals did (point 1 §1B) 9 and that number-only probability communications were better than numbers plus numerator-only visuals for that outcome (point 1 §1C). 9 However, there was also weak evidence that contrast outcomes were not different when people saw numerator-only graphics versus number formats (point 1 §2C). 9 Nonetheless, taken together, these findings cast doubt on the wisdom of using numerator-only visual formats to communicate probabilities unless the communicator intends to be persuasive (which is explicitly not a goal of most patient decision aids).
A number of studies included in the MNM review compared part-to-whole visual formats to number-only presentations. Based on these studies, we found strong evidence that numerical formats (rates, percentages) evoke higher probability perceptions than part-to-whole graphics do (point 2 §5C). 10 We also found moderate evidence of similar effects when comparing use of 1-in-X number formats (which are not recommended per IPDAS recommendation 8 above) versus part-to-whole graphical formats (point 2 §5C). 10 These findings are consistent with the idea that part-to-whole visual formats make the denominator of a probability more salient, and doing so should emphasize the relative scarcity of risk events when the probability being communicated is small (which is commonly true for health-related risk communications). Regarding other outcomes, however, we did find weak evidence that part-to-whole visuals improved people’s ability to contrast probabilities compared with number-only formats (point 1 §2C). 9
However, our review’s findings regarding probability feelings and preferences outcomes were quite different. There was strong evidence that using numerator-only visuals versus numbers did not in fact change readers’ probability feelings (point 2 §5C). 10 In addition, the MNM review found strong evidence that adding icon arrays (a part-to-whole format) to probability numbers did not change either probability perceptions or probability feelings (point 2 §5C). 10
The MNM review found strong evidence of preferences for bar charts over icon arrays for presenting probability differences, with weak evidence of preferences for pie charts over bar charts for the same task (difference 2 §9B). 12 The evidence was insufficient regarding other formats for presenting probability differences and for point tasks within probability communications (point 2 §9B). 10
With regard to IPDAS recommendation 23’s broader encouragement of the use of visual formats to communicate probabilities, the findings of the MNM review (beyond the numerator-only v. part-to-whole format findings above) are more mixed. Consistent with the IPDAS recommendation, we found strong evidence of improved computation outcomes when probability differences were presented as numbers plus a graphic versus numbers alone (difference 1 §4C). 11 We also found moderate evidence that the use of bar graphs improved contrast abilities over numbers alone when comparing sets of probabilities (synthesis §2C). 13 However, for point probability communications, there was only moderate evidence that bar charts plus numbers improved computation versus either the numbers or visuals alone (point 1 §4C). 9 A small number of studies examined a particular type of combination number line graphic that was both logarithmically scaled and included comparison probabilities. There was strong evidence that this format led to higher probability perceptions than 1-in-X format numbers did (point 2 §5C), 10 although it is not clear whether the effect is due to the graphic or the comparison risk information. In addition, several MNM review findings suggest no differences in certain outcomes between probability visuals and numbers: we found moderate evidence that the use of bar chart visuals to show probability differences did not change behavioral intentions versus numbers alone (difference 2 §7C), 12 weak evidence that linear line graphs did not change probability perceptions versus the equivalent numbers (point 2 §5C), 10 and weak evidence that point discrimination did not change between certain probability graphics and numbers (point 2 §10C). 10 There was weak evidence that people had preferences for having visuals + numbers versus numbers alone for difference communications (difference 2 §9C), 12 but there was insufficient evidence regarding many other outcomes, including point categorization (point 1 §3C), 9 behavioral intentions (point 2 §7C), 10 trust (point 2 §8C), 10 and preferences (point 2 §9C), 10 as well as difference identification/recall (difference 1 §1C), 11 contrast (difference 1 §2C), 11 and discrimination (difference 2 §10C) 12 outcomes.
There were some studies in the MNM review relevant to IPDAS recommendation #25 regarding the design of spatial features of probability visuals but too few similar studies to conclude whether there was moderate or strong evidence. While we agree that consistency of spatial and verbal/numerical features of visual displays should be important to support multiple outcomes, there was only insufficient evidence in our review regarding the effects of compressing y-axis scaling on contrast outcomes (point 1 §2B). 9
IPDAS recommendation 26 regarding using the same denominator from the Trevena et al. paper is quite similar to IPDAS recommendation 6 from the Bonner et al. paper. As noted above in Table 2, the MNM review found strong evidence of effects of consistent versus inconsistent denominators on computation outcomes. These effects appear likely to be consistent in both visual and numerical formats.
The Role of Graph Literacy in Decision Aid Development
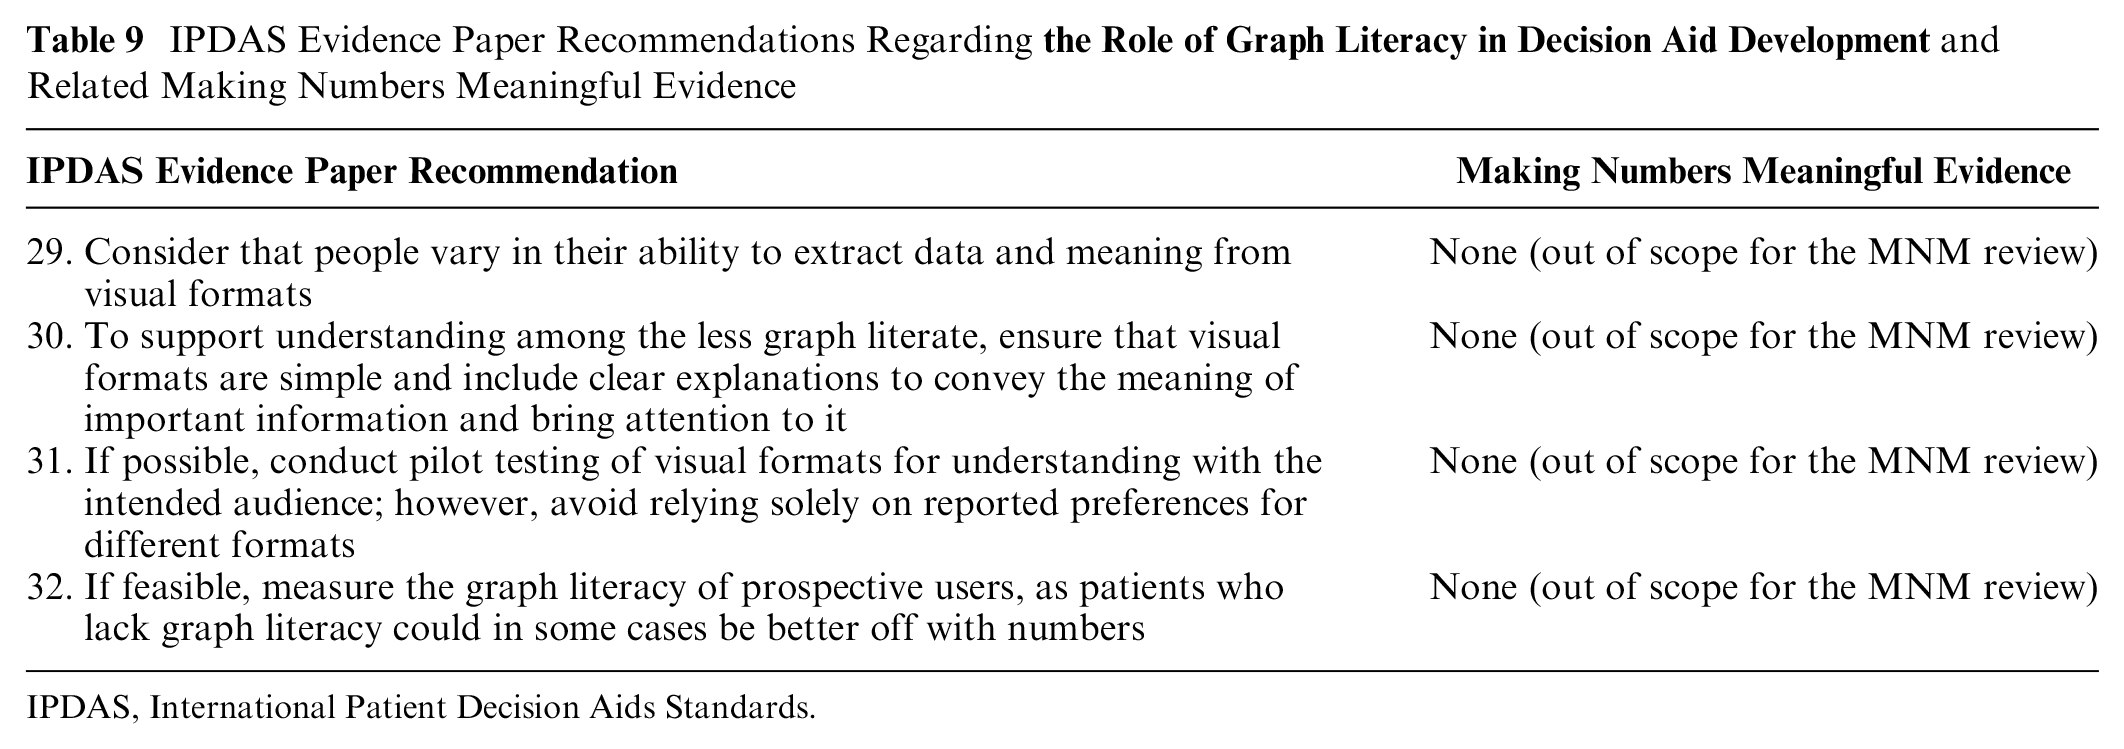
IPDAS recommendation 29 to consider interpersonal variation in graph literacy, IPDAS recommendation 30 for simplicity and clarity, IPDAS recommendation 31 to conduct pilot testing, and IPDAS recommendation 32 to measure the users’ graph literacy were all out of scope for the MNM review (Table 9).
IPDAS Evidence Paper Recommendations Regarding
IPDAS, International Patient Decision Aids Standards.
How and When Risks Should Be Personalized
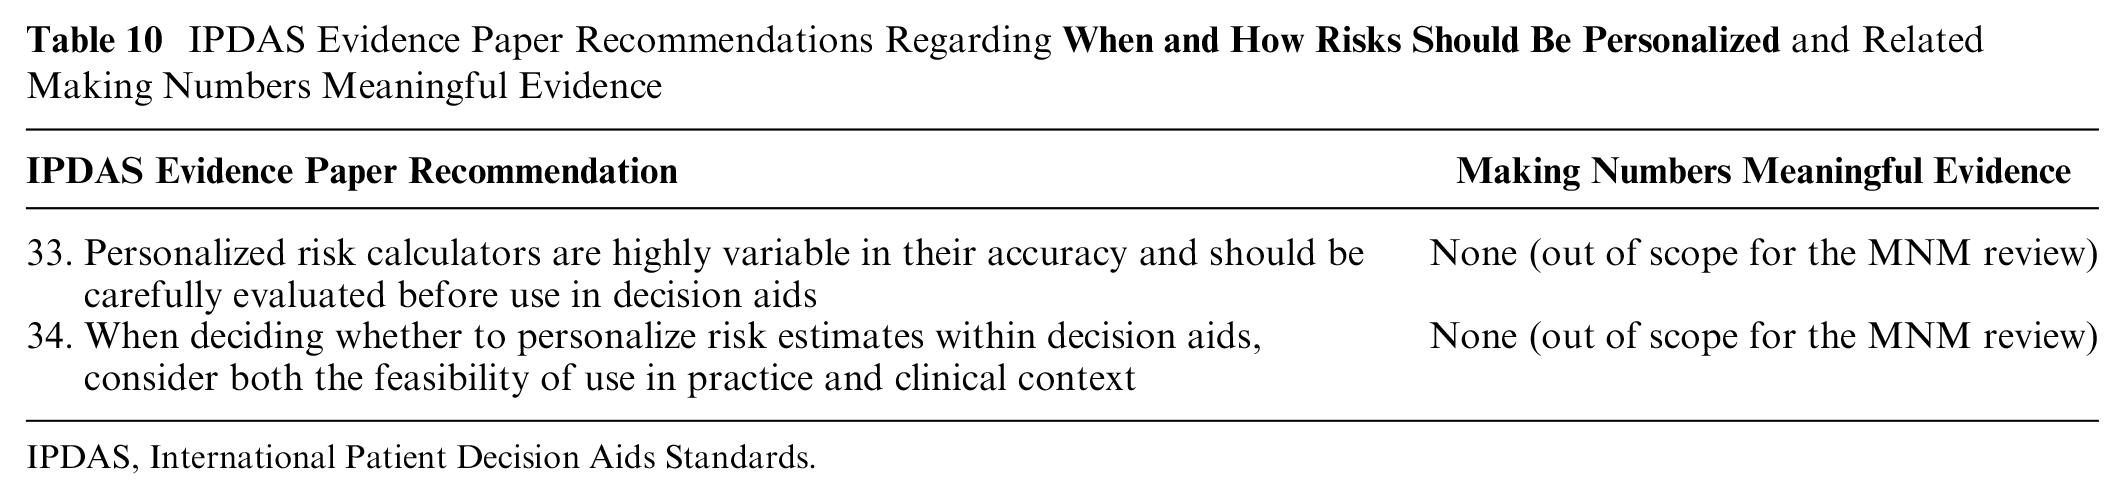
IPDAS recommendations 33 and 34 regarding consideration of personalized risk estimates were out of scope for the MNM review (Table 10).
IPDAS Evidence Paper Recommendations Regarding
IPDAS, International Patient Decision Aids Standards.
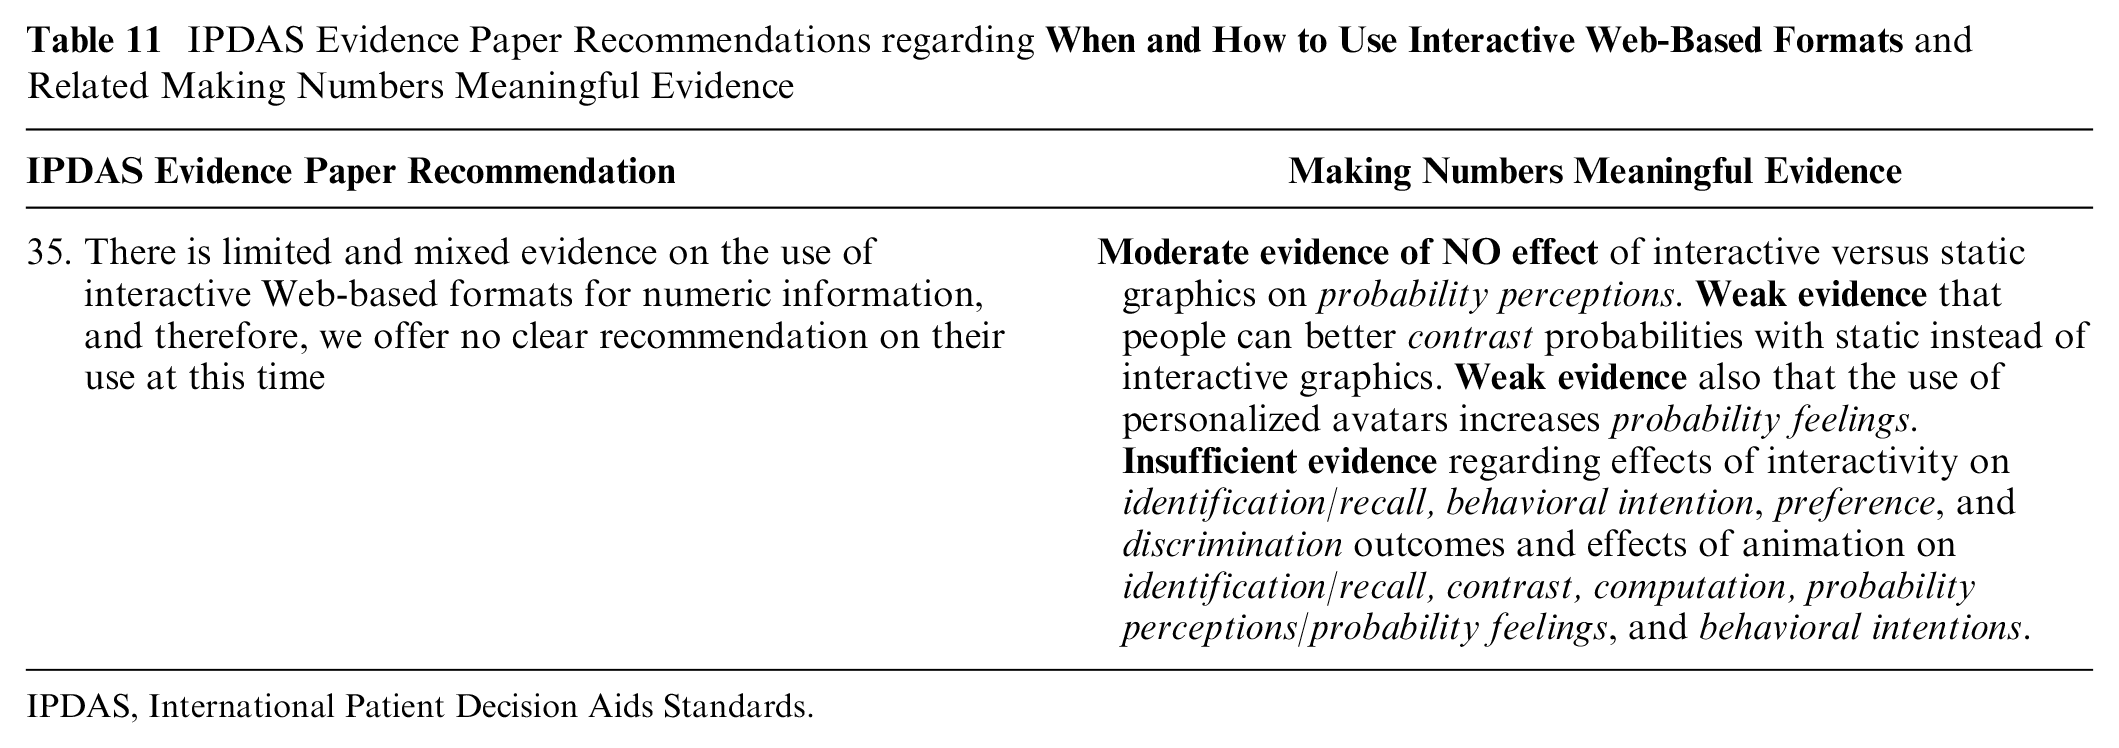
When and How to Use Interactive Web-Based Formats
Broadly speaking, the MNM review’s findings are consistent with IPDAS recommendation 35’s statement that the literature on animation and/or interactivity in health number communication is quite limited and hence no practice recommendations can be made (Table 11). Our specific findings were as follows: We found moderate evidence that probability perceptions were NOT affected by the use of interactive versus static graphics to communicate probabilities (point 2 §5I). 10 However, our review provides weak evidence that contrast outcomes are made worse when probabilities are presented in nonstatic formats (point 1 §2I). 9 A single study provided weak evidence that personalized avatars may influence probability feelings outcomes (point 2 §5I), 10 while another single study provided weak evidence of preferences for icon arrays that are static or, if animated, that group event icons together versus those that use animation to shuffle the event icons (synthesis §9I). 13 There was insufficient evidence available regarding the effects of interactive formats for communicating point probabilities on identification/recall (point 1 §1I), 9 behavioral intention (point 2 §7I), 10 preference (point 2 §9I), 10 and discrimination (point 2 §10I) outcomes. 10 There was also insufficient evidence regarding the effects of animation in probability communication graphics on people’s performance on identification/recall (point 1 §1I), 9 contrast (point 1 §2I), 9 and computation (point 1 §4I) 9 outcomes, as well as on people’s probability perceptions/probability feelings (point 2 §5I) 10 and behavioral intentions (point 2 §7I). 10
IPDAS Evidence Paper Recommendations regarding
IPDAS, International Patient Decision Aids Standards.
Discussion
The MNM review identified substantial, high-quality, and consistent evidence to support several of the 2021 IPDAS recommendations regarding probability communications. In particular, we identified strong evidence to support the use of numerical risk formats over verbal probabilities only (recommendation 1) due to verbal terms leading to increased probability perceptions and behavioral intentions, use of consistent denominators (recommendations 6 and 26) as improving computation outcomes, use of independent event rates or precalculated absolute difference statistics to communicate effects of treatment or screening options (recommendation 21) due to the amplification effect of relative difference statistics on effectiveness perceptions and behavioral intentions, and use of visual formats that show part-to-whole relationships to communicate probabilities (recommendation 24) due to the increased probability perceptions associated with numerator-only visual formats. We also found strong evidence of potentially detrimental effects that support the IPDAS recommendations to avoid 1-in-X formats (recommendation 8) and minimize changes to framing (recommendation 22), both due to consistent biases on probability perceptions.
However, the MNM review identified only weaker or equivocal evidence relating to certain other IPDAS recommendations. In particular, we identified only weak evidence that evaluative labels #9) significantly affect 3 outcomes (categorization, probability perceptions, and discrimination), with weak evidence of no effect on a fourth outcome (contrast). Similarly, when considering the effects of providing comparative risks and/or reference standards (recommendation 10), we also found only weak evidence of positive effects regarding 2 outcomes (categorization, contrast), with moderate evidence of no effects on 3 other outcomes (identification/recall, probability perceptions/feelings, and behavioral intentions) and insufficient evidence on 3 more.
Other recommendations appeared conceptually supported by MNM findings but with lesser volume or consistency of evidence. For example, IPDAS recommendation 5 suggests the use of frequency or percentage formats for communicating single probabilities. The MNM review found strong evidence of no effects on probability perceptions and feelings between these 2 formats, but evidence was insufficient for other outcomes. The MNM review also identified numerous studies that examined the use of various visual formats for displaying probabilities (recommendation 23), but the resulting evidence varied widely both in terms of whether effects were found and in its strength.
Perhaps unsurprisingly, the MNM review found only a limited number of studies that examined questions related to certain IPDAS recommendations. For example, the IPDAS papers cited limited evidence as the reason that they avoided making specific recommendations regarding communication of uncertainty (recommendation 12) and use of interactive formats (recommendation 35), and our review’s findings were consistent with that guidance. In addition, we found only weak or insufficient evidence in general related to use of consistent formats (recommendation 3), consistent time frames (recommendation 16), consistent spatial features of visuals (recommendation 25), avoiding presenting lifetime risk (recommendation 14), or use of prolongation of life/delay of event statistics (recommendation 15). While we conceptually agree with all of these recommendations, in general too few studies have directly tested these recommendations to provide strong support for them.
A final group of IPDAS recommendations fell outside the scope of the MNM review. Most notably, the MNM review did not focus on effects of adjusting the time frame presented to audience needs (recommendation 13), audience characteristics (recommendations 2 and 4), individual differences such as numeracy or graph literacy (recommendations 20, 29, and 31), personalization of probability information (recommendation 33), or situational factors (recommendation 34). We also did not examine recommendations that align with general communication best practices, such as drawing attention to numeric information (recommendation 17), avoiding forcing readers to do math (recommendation 18), specifying the reference class for statistics about a population (recommendation 7), recognizing that uncertainty is difficult to understand (recommendation 11), conducting pilot testing (recommendation 31), and including simple and clear labels and explanations (recommendations 27 and 30).
Beyond the issues of the scope of our review, the main limitations of our current findings reflect the broader challenges of synthesizing the vast and growing literature on number communications. First, the MNM project intentionally considered only studies that examined communication of health-related numbers, and certainly there exists conceptually relevant research on the communication of probabilities in other domains. Second, deriving generalizable guidance is challenging due to the amount of inconsistency that exists in data presentation formats. While number formats (e.g., percentages) are essentially standardized, there is a range of verbal probability terms used in English (not to mention variability across languages) and even more variability in the many different visual formats, evaluative labels, and types of comparison data used across research studies. Third, our exclusion criteria resulted in the exclusion of some evidence that could be relevant to the IPDAS recommendations, such as comparisons of numeric information against conditions with no numerical information and our limitation of verbal terms to verbal probabilities only. Fourth, although we attempted as best as possible to compare like with like, the MNM findings reflect only the effects or noneffects found regarding the specific formats that were tested in the literature, and other designs could well lead to different results. Lastly, because it has taken several years to organize, review, categorize, and synthesize this large literature, the MNM review papers represent the extant literature only as of 2020 and omit more recent work. We are currently working toward transitioning this snapshot review into an ongoing living evidence review system, which hopefully will enable integration of new findings with our current evidence base on an ongoing basis.
One of the most important points of agreement between the IPDAS probability communication papers and the MNM review is our common perspective that communication methods cannot simply be described as good or bad. Instead, both the authors of the IPDAS papers and we believe that different situations require different approaches to communicating probabilities to be successful. In fact, the Trevena et al. 6 paper explicitly notes in recommendation 28 that “no one visual format is optimal for every situation” and hence urges communicators to “consider the task at hand and the magnitude of the probabilities when using and selecting visual formats.”
The Making Numbers Meaningful project’s entire design takes this idea one step further. As noted above, we carefully elaborated a list of distinct communication outcomes, which we have elsewhere called a taxonomy. 16 Our overarching finding that a single communication strategy can have different impacts on different communication outcomes should prompt all decision aid developers to intentionally select use-relevant, granular outcomes that align to their communication goals before designing any risk communication. 8 Put another way, when we teach health risk communication, we encourage communicators to always ask themselves, “What do I want my audience to think, feel, or do immediately after viewing this number or visual?” 8 This kind of forethought is necessary because the findings from the MNM review make clear that no probability communication format is best for every objective.
Conclusion
Our comparison of the IPDAS recommendations with the MNM evidence suggests a field in transition. Some questions, such as those encouraging the use of part-to-whole graphics and avoidance of 1-in-X formats, appear to be relatively settled science, and we encourage all decision aid developers and risk communicators to follow these recommendations with confidence. Other questions, such as those on evaluative labels and comparative standards, are clearly in need of further investigation to either support or clarify current practice recommendations. However, the challenges we faced not only in creating the MNM evidence but also in attempting to match our findings with the language used in the IPDAS recommendations reinforces the need for consistency in the terminology and measures used in this field. We therefore urge future researchers to use our outcome and data format taxonomies to provide clarity to the design of their experiments, ensuring that like is compared with like. We also encourage future researchers to follow the ReCoN (Research on Communicating Numbers) reporting guidelines based on this work both to encourage full and transparent reporting of number communication formats and outcomes and to facilitate cross-study comparability. 17
Footnotes
The authors declared no potential conflicts of interest with respect to the research, authorship, and/or publication of this article. The authors disclosed receipt of the following financial support for the research, authorship, and/or publication of this article: Funding for this article was provided by a grant from the National Library of Medicine (R01 LM012964). The funding agreement ensured the authors’ independence in designing the study, interpreting the data, writing, and publishing the report.
Ethical Considerations
Not applicable.
Consent to Participate
Not applicable.
Consent for Publication
Not applicable.