
Abstract
Background
Research with lay audiences (e.g., patients, the public) can inform the communication of health-related numerical information. However, a recent systematic review (Making Numbers Meaningful) highlighted several common issues in the literature that impair readers’ ability to evaluate and replicate these studies.
Purpose
To create a set of guidelines for reporting research regarding the research on communicating numbers to lay audiences for health-related purposes.
Reporting Recommendations
We present 6 common reporting issues from research on communicating numbers that pertain to the background motivating the study, experimental design and analysis reporting, description of the outcomes, and reporting of the data presentation formats. To address these issues, we propose a set of 7 reporting guidelines including 1) specifying how study objectives address a gap in evidence on research on communicating numbers, 2) clearly reporting all combinations of data presentation formats (experimental conditions) compared, 3) providing verbatim examples of the data that were presented to the audience, 4) describing whether or not participants had access to the data presentation formats while outcomes were assessed, 5) reporting the wording of all outcome measures, 6) using standardized terms for both outcomes and data presentation formats, and 7) ensuring that broad outcome concepts such as gist, comprehension, or knowledge are concretely defined.
Conclusions
Future studies involving research on communicating health-related numbers should use these guidelines to improve the quality of reporting and ease of evidence synthesis in future efforts.
Highlights
Our systematic review allowed us to exhaustively identify and enumerate several common reporting issues from research on communicating numbers that make it challenging to synthesize evidence.
Reporting issues involved not including the background motivating the gap the study addresses, insufficiently describing experimental designs and analyses, and failing to report information regarding the outcomes measured.
We propose 7 reporting guidelines for future research on communicating numbers to address the issues detected: 1. Specification of how study objectives address a gap in evidence on research communicating numbers 2. Clearly reporting all combinations of data presentation format elements compared 3. Providing verbatim examples of the data presentation formats 4. Describing whether participants had access to the data presentation formats while outcomes were assessed 5. Reporting the wording of all outcome measures 6. Using standardized terms for both outcomes and data presentation formats 7. Ensuring that broad outcome concepts such as gist, comprehension, or knowledge are concretely defined
Implementation of these guidelines will facilitate knowledge synthesis of research on communicating numbers and support creating evidence-based guidelines of best practices for communicating health-related numbers to lay audiences.
Keywords
Many critical health-related decisions may be aided by quantitative information such as disease prevalence, treatment efficacy, risk of side effects, and test result quantities. Conveying this information to lay audiences (e.g., patients or the public), however, presents challenges, as nearly 30% of United States–based adults have low numeracy and struggle to work with fractions or decimals. 1 Those with higher numeracy may also struggle to interpret numbers due to the stressors that can be introduced in health care settings. 2 A large and varied research literature going back to the early 1980s has evaluated different methods for presenting quantitative health information to lay audiences who do not have specific training in the health professions. 3 These studies have been published in diverse outlets that speak to different academic and practice-oriented audiences. As a result, it remains challenging to draw conclusions related to which data presentation formats may best support a communicator’s goal (e.g., reduce worry, improve ability to contrast options, or induce a behavior) when conveying quantitative health information to a lay audience.4,5
To address this need, we undertook a large, federally funded systematic review on the way numbers are communicated in health: the Making Numbers Meaningful (MNM) review.6,7 The experience with the MNM review demonstrated weaknesses in reporting that are specific to this domain. The MNM review included original research articles that 1) presented quantitative health information, 2) compared 2 or more data presentation formats, 3) included patients or laypeople as participants, and 4) quantitatively measured 1 or more outcomes related to decisions, perceptions, behaviors, or cognitive interpretation. A systematic search (PROSPERO registration No. CRD42018086270) through 2020 returned 391 relevant papers. 7 Given the lack of standardized terminologies found in the review, we developed a taxonomy to categorize and synthesize the evidence, which we refer to in this article as the MNM taxonomy. 6 Our previous articles describing the methods used for the MNM review and the MNM taxonomy recommend terminologies for describing the data presentation formats studied, the cognitive task(s) participants were asked to complete with the data, and outcomes used to measure task completion in ReCoN articles.6,7 In completing the MNM review and creating the MNM taxonomy, we identified multiple common failures of reporting that made synthesizing this diverse literature far more difficult than it needed to be, specifically:
Study reports that provided little to no justification for the data presentation formats (that is, the graphical, numerical, or verbal format used to convey the quantitative data) being compared
Study designs and/or analysis plans that grouped multiple data elements (such as graphics or numbers) into single stimuli, confounding the evaluation of individual data presentation format elements
Study reports that failed to provide concrete details and examples of the data presentation formats assessed
Study reports that used different terms to describe similar formats and similar terms to describe structurally different formats
Study reports that were insufficiently specific in their description of the outcomes measured by the researchers and the cognitive tasks required of the study participants
Study reports that combined multiple types of outcome measures into aggregate measures (e.g., “knowledge” tests), preventing clear assessment of which formats affect which outcomes
Based on our experience with the full MNM review, we propose a new set of recommendations, in the Research on Communicating Numbers (ReCoN) reporting guidance checklist. These reporting guidelines do not specify what should be studied but rather support standardization and completeness in future publications that research different means for conveying health-related numbers to lay audiences. The use of these guidelines will facilitate both evidence synthesis and ultimately improvements in numerical communication practice.
Recommended Guidelines for Improved Reporting
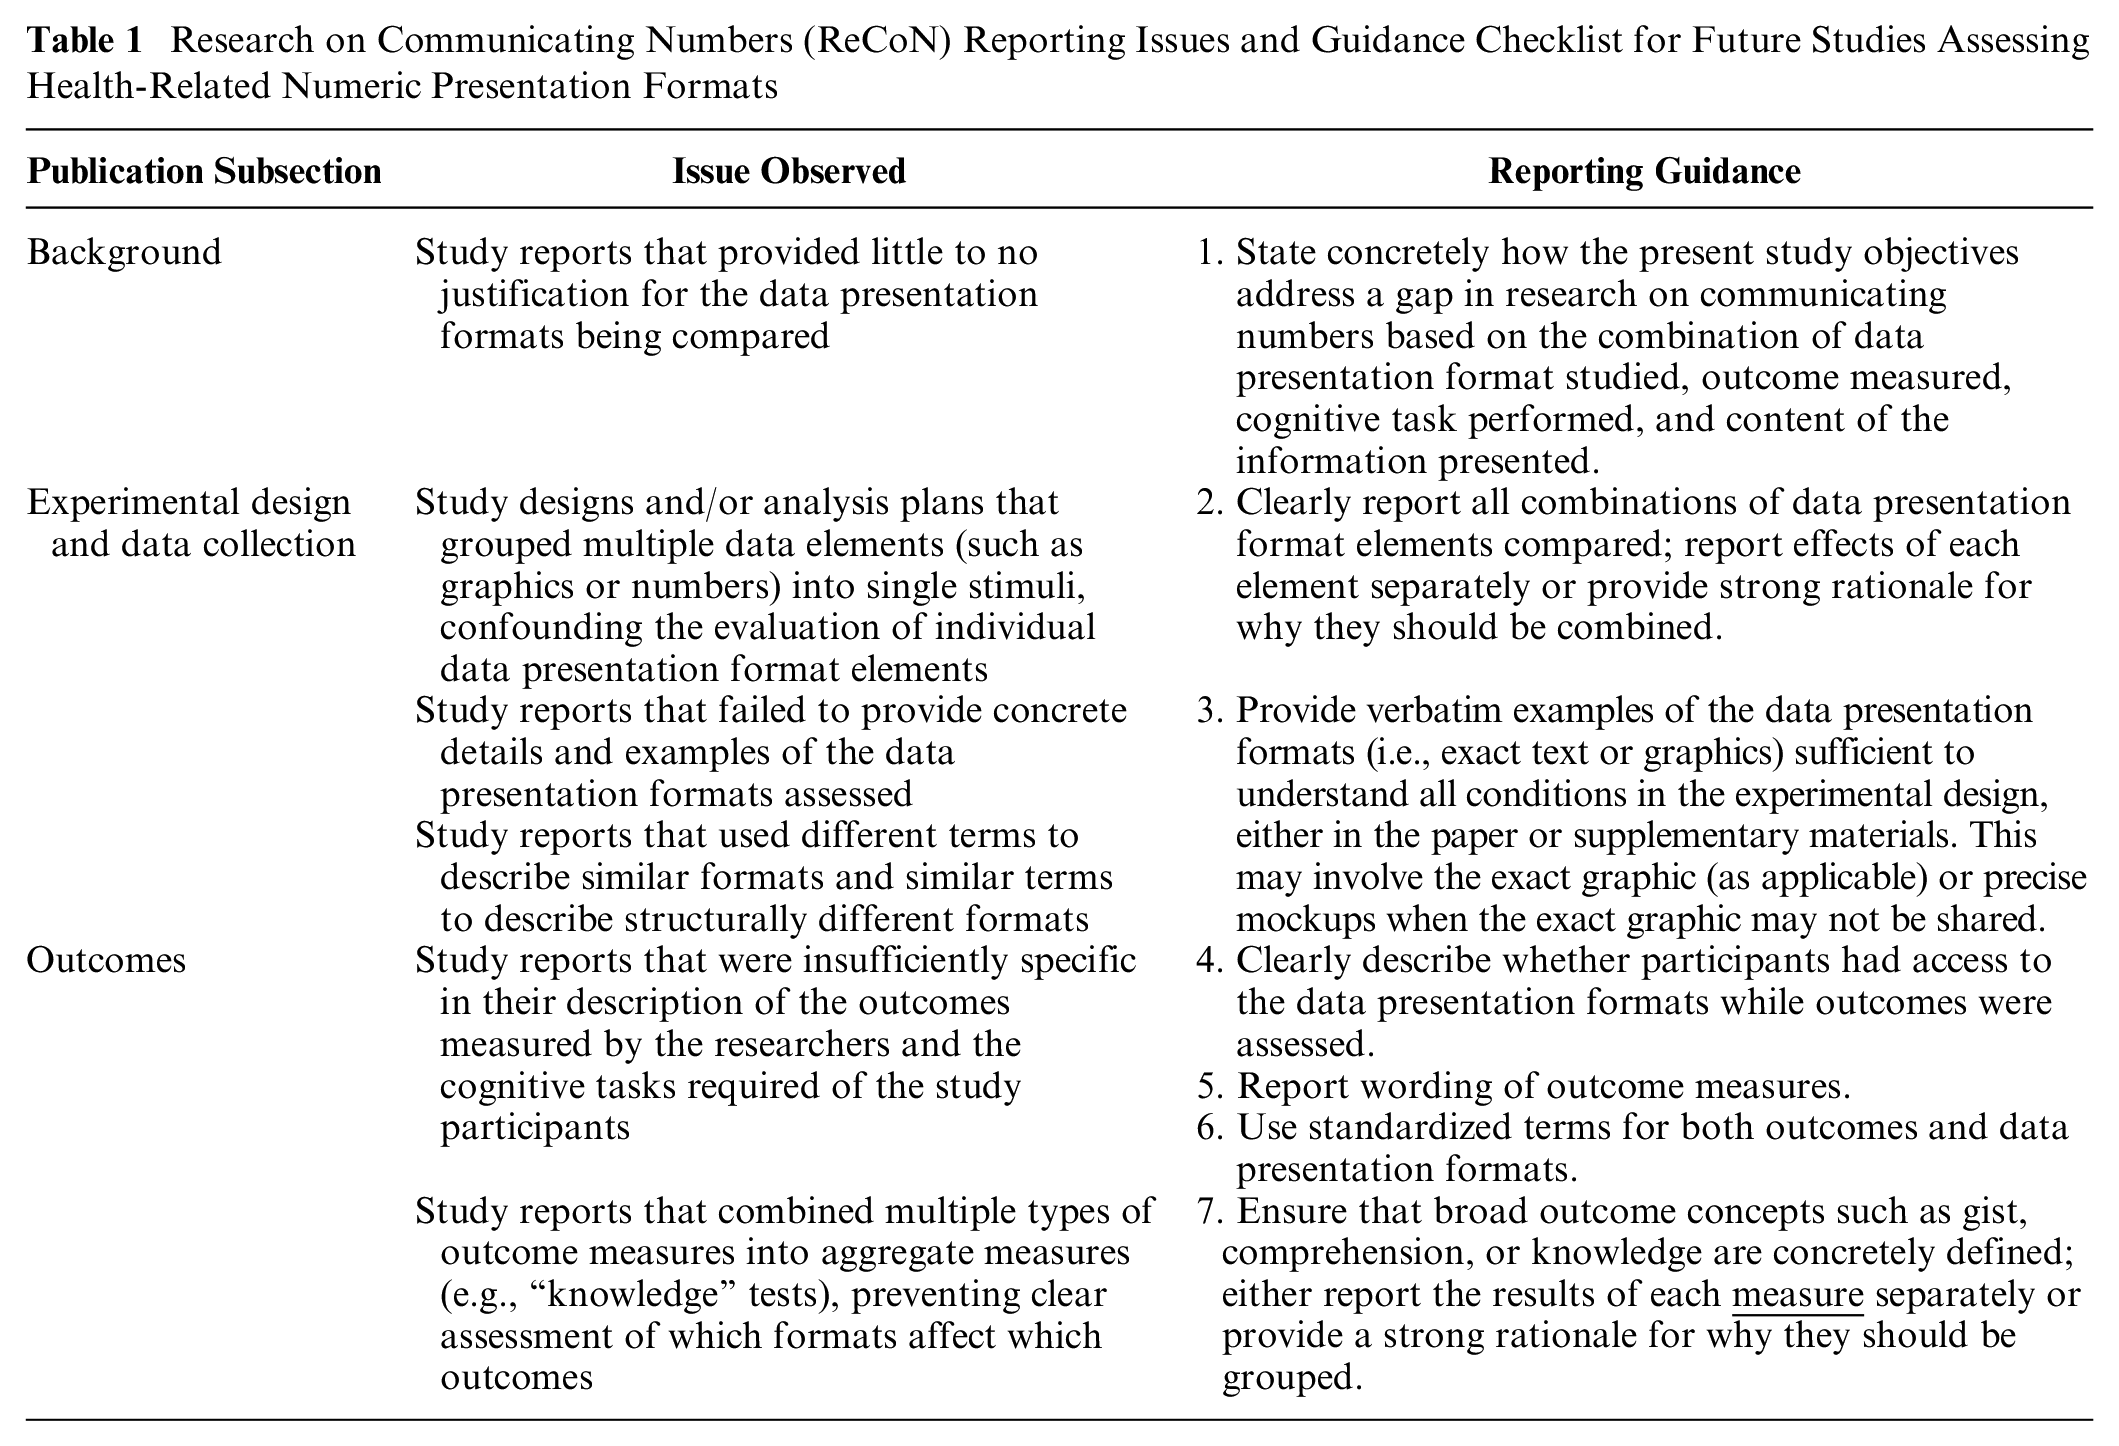
Table 1 provides the proposed ReCoN reporting guidance checklist paired with the underlying study design or reporting issues that informed each guideline. We have organized recommendations by the section of the publication in which the information typically appears, although we acknowledge this may vary from publication to publication. Appendix A includes a more detailed version of Table 1 with illustrative examples.
Research on Communicating Numbers (ReCoN) Reporting Issues and Guidance Checklist for Future Studies Assessing Health-Related Numeric Presentation Formats
Concretely State How Study Objectives Address a Gap in ReCoN (1)
State concretely how the present study objectives address a gap in research on communicating numbers based on the combination of data presentation format, outcome measured, task performed, and content of the information presented. Too often, we identified studies that provided little or no justification for the different data presentation formats being tested or why they might be hypothesized to influence the outcomes assessed. Providing clear study objectives can help accurately determine how the current study fits into previous work, for example, as an area that has not yet been studied or a replication study of previous works. We recommend that the authors clearly state the combination of data presentation format(s) studied, outcomes measured, and content area(s). Furthermore, we have argued that it is important to specify what cognitive task was expected of the participants as they evaluated the stimuli.1,3 In the MNM taxonomy, when participants evaluate a single probability to come to a judgment (for example, looking at the probability of disease to form a perception of the risk), this is called a “point task.”1,3 By contrast, when participants evaluate the difference between 2 probabilities to form a perception of the size of a treatment effect, this is a “difference task.” As a result, an objective statement may read, In this study, we compared the impact of two numeric (percent, risk multiplier) and two graphical (icon array, bar chart)
Clearly Report All Combinations of Data Presentation Format Elements Compared (2)
Clearly report all combinations of data presentation format elements compared; report effects of each element separately or provide a strong rationale for why they should be combined. Many studies reported study designs that combined multiple different data presentation elements within the same study condition, which made measuring separable effects impossible. For example, a bar chart that depicts someone’s risk of developing a disease may be combined with a statement of the person’s percentage-based risk for contracting the disease. We recommend reporting effects of the 2 elements, numeric and graphic, individually to demonstrate their unique effects. Alternatively, in cases in which individual elements have already been tested sufficiently to provide informed estimates of effect size for this particular experiment, we recommend referring to this previous literature. This literature can also be used to assess the face validity of the size of the combined effect.
In addition, we found that some studies would group similar presentation formats, such as all numeric conditions (e.g., percentages and rates per 10n), all graphic conditions (e.g., bar charts and icon arrays), or conditions involving different kinds of animation/interactivity, into a single treatment group during the analysis rather than during the design. While we generally advise against doing this, it may be appropriate in situations with a strong rationale, such as an initial, appropriately powered statistical comparison noting no statistical differences between the combined data presentation format groups.
Provide Verbatim Examples of Data Presentation Formats (3)
Provide verbatim examples of the data presentation formats (i.e., exact text or graphics) sufficient to understand all conditions in the experimental design, either in the paper or supplementary materials. This may involve the exact graphic (as applicable) or precise mockups when the exact graphic may not be shared. Study reports sometimes contained insufficient detail regarding the data presentation formats assessed. For example, authors may have simply stated, “we compared bar charts, pictographs, and numbers,” without providing figures or examples of the stimuli. This presents multiple issues. For example, with bar charts, there may be multiple elements that affect interpretation, including horizontal versus vertical orientation, scale (raw data versus scaling to 100%), axis labels, stacking or grouping bars, coloring, or data labels. We also found multiple different words for how some graphics were described. “Pictograph,” for example, was 1 of 28 terms we encountered that were used to refer to icon arrays, but it was also sometimes used to refer to symbols (such as an image of a syringe), instructional graphics (such as a cartoon depiction of how to use a syringe, broken down into several steps), or other visuals. 6 Without a picture of the presentation or very detailed description, it was challenging to determine whether a term such as “pictograph” was used the same way in 2 different studies. We found a similar lack of precision in terminology about “numbers.” Simply describing something as “a number” might conflate frequencies (such as “5 in 100”), 1-in-X formats (such as “1 in 20”), and percentages (such as 5%), each of which has been studied individually and has different effects on communication outcomes. To mitigate these issues, authors should provide actual data presentation formats used or precise mockups if there are copyright or other issues that prevent presenting the verbatim format. For multifactorial studies, authors do not need to present all data presentation formats, but we advise presenting enough to allow readers to understand all experimental conditions, such as presenting 1 format with no manipulations and 1 format highlighting all possible manipulations.
Lack of clarity in reporting the stimulus also sometimes made it difficult to determine which outcome was being measured. For example, if participants were asked about the percentage difference associated with the effect of a risk factor, and the computation had been performed for them, then the outcome being assessed was
Clearly Describe Whether Participants Had Access to the Data Presentation Formats (4)
Clearly describe whether participants had access to the data presentation formats while outcomes were assessed. Many studies failed to report whether or not the participant was able to view the data presentation format while they were completing assessment questions, and this led to important ambiguities in what the participant was actually required to do. If the stimulus was available, then a participant could answer questions about the chance of a side effect due to a medication by locating and
Report Wording of Outcome Measures (5)
Report wording of outcome measures
To ensure outcomes are clearly specified and may be compared with other relevant literature, we strongly recommend reporting the exact wording of the outcome questions
This approach of clearly defining the outcomes as well as the stimuli (point 3 above) leads to another benefit, which is clarifying what cognitive task the participants need to do to answer the outcome questions. For example, if participants are asked to indicate how effective a therapy is on the basis of a pretreatment and a posttreatment probability (an effectiveness perception outcome), they must perform what we have termed a difference task, that is, assessing the stimulus for a difference between probabilities. However, if participants are asked about how likely they are to contract an infection (probability perception) on the basis of a stimulus describing the likelihood of disease, they must perform a point task, or an assessment of a single probability. Although an in-depth enumeration of cognitive tasks and their relationships to outcomes and data presentation formats is out of scope for the current article, we have elsewhere argued that the cognitive task performed by readers upon different sorts of stimuli is an important component of numbers communication research and practice.6,7
Use Standardized Terms for Both Outcomes and Data Presentation Formats (6)
Use standardized terms for both outcomes and data presentation formats. In addition, we recommend using a standardized taxonomy to describe components of the stimuli and of the outcome measures.5–7 We have described above some of the ambiguities associated with the term “pictograph,” and there are similar ambiguities with terms used to describe numerical formats, such as “frequencies.” According to our standard taxonomy, an array of 100 stick figures indicating the number of individuals likely to experience an outcome would be called an “icon array.” A number such as “20 in 100” would be termed a “rate per 10n frequency,” and a number such as “1 in 5” would be a “1-in-X frequency.” Standardized terms for formats ensure effective scientific communication and establish whether different studies are comparable. Similarly, the section above outlines some of the difficulties with outcome measure terminology, such as 2 different meanings for the term “risk perception.” Our taxonomy distinguishes between “probability perception,” a perception measured on a scale indicating size, and “probability feelings,” a perception measured on an affective scale. Furthermore, the term “risk” itself has some ambiguities, with some disciplines using it to mean the probability of an event and others using it to mean a function of the probability of the event together with
Ensure Broad Concepts (e.g., Gist, Comprehension, Knowledge) Are Concretely Defined (7)
Ensure that broad outcome concepts such as
Discussion and Conclusions
This report provides 7 concrete, ReCoN reporting guidelines for health-related studies, derived from a large systematic review of 391 ReCoN articles. The issues discussed in this report highlight the inherent link between rigorous research design and reporting. The studies in our review with the strongest credibility involved designs with clear communication goals; clean, separable format group comparisons; a priori planned comparisons; and distinct outcome measures that matched the communication goals they planned to study. These high-credibility studies also had excellent reporting with clear objectives situated within current literature; well-described data presentation formats with unconfounded treatment groups; clearly specified outcomes that allowed for identification of the outcome/task assessed; and results reporting of distinct treatment groups for unique outcomes. While this report focuses on reporting guidelines, we recognize that working backward from reporting guidelines may also provide insight for study design considerations.
Our larger MNM review, which served as the basis for the guidelines presented here, further demonstrated that there is no single best data presentation format for research on communicating numbers across the board, although there might be a best format for a given task, outcome, and context combination. 5 Clear reporting involves explication of all factors that may affect the generalizability of findings from one study to another. Previous studies have inaccurately declared that certain presentation formats are worse than others and should categorically be avoided without considering different communication goals and contexts.
The present state of the ReCoN guidance has strengths and limitations. The guidance was developed from our pragmatic experience in a large systematic review including 391 ReCoN articles (the MNM review). Because of this, however, our guidance is limited to the inclusion criteria in the MNM review. This guidance checklist may still be helpful for similar studies, for example, involving health professionals (i.e., not lay audiences) or studies outside of the health domain, such as in the human–computer interaction or human factors communities, that may involve comparative evaluations of different stimuli. However, this requires further practical exploration. Our guidance focused specifically on reporting research on communicating numbers (ReCoN) studies and did not include general best practices for research reporting. For example, ReCoN and other studies should also report any demographic characteristics and individual difference measures assessed, including the exact wording of questions and potential answer options. Analytic approaches should then consider conducting subgroup analyses to understand if certain data presentation formats had better outcomes for certain groups, such as those with lower education or numeracy. Future studies should use the proposed guidance checklist to provide the health communication community with more clarity to understand what we have and have not learned from a given ReCoN study. This may also generate evidence regarding how the ReCoN guidance may be improved.
Other entities, such as the Enhancing the QUAlity and Transparency Of health Research (EQUATOR) network, have been dedicated to presenting resources on reporting guidelines for various study designs. 9 The EQUATOR network provides guidelines based on the study design (e.g., case-control, cross-sectional, qualitative), and our ReCoN guidelines serve as additional recommendations for the specific domain of studying how to report health-related numbers to lay audiences. Many health-related journal articles require documentation of how guidelines such as EQUATOR were followed to promote the ease of peer review and standardization of presentation, the latter of which also facilitates future systematic review and evidence synthesis. The American Psychological Association also has Journal Article Reporting Standards for quantitative, qualitative, and mixed-methods designs. 10 These guidelines offer helpful starting points, but our review highlighted areas where further nuance is needed for ReCoN studies, particularly since ReCoN studies may use different study designs to answer comparable questions.
Utilization of reporting guidelines will be essential to keep up with the ever-increasing speed of evidence generation. Standardized reporting will facilitate synthesis, allowing for the generation of evidence-based guidance that will also avoid studies continuing to address questions that have already been answered. Synthesis and guidance generation may be greatly aided by advances in machine learning and the use of large language models. Despite the ability of these tools to derive some semantic relationships, without the use of common terminologies, relevant information will be missed, likely without our knowledge. Providing clear, concrete, and standardized reporting of ReCoN studies will in turn support the strategic plans of entities such as the National Library of Medicine to maintain a sustainable digital ecosystem to keep pace with the data demands of the research enterprise.
Supplemental Material
sj-docx-1-mdm-10.1177_0272989X251346799 – Supplemental material for How to Report Research on the Communication of Health-Related Numbers: The Research on Communicating Numbers (ReCoN) Guidelines
Supplemental material, sj-docx-1-mdm-10.1177_0272989X251346799 for How to Report Research on the Communication of Health-Related Numbers: The Research on Communicating Numbers (ReCoN) Guidelines by Natalie C. Benda, Brian J. Zikmund-Fisher and Jessica S. Ancker in Medical Decision Making
Footnotes
The authors declared no potential conflicts of interest with respect to the research, authorship, and/or publication of this article. The authors disclosed receipt of the following financial support for the research, authorship, and/or publication of this article: Funding for this article was provided by a grant from the National Library of Medicine (R01 LM012964). The funding agreement ensured the authors’ independence in designing the study, interpreting the data, writing, and publishing the report.
Ethical Considerations
Not applicable.
Consent to Participate
Not applicable.
Consent for Publication
Not applicable.
References
Supplementary Material
Please find the following supplemental material available below.
For Open Access articles published under a Creative Commons License, all supplemental material carries the same license as the article it is associated with.
For non-Open Access articles published, all supplemental material carries a non-exclusive license, and permission requests for re-use of supplemental material or any part of supplemental material shall be sent directly to the copyright owner as specified in the copyright notice associated with the article.