
Abstract
Background
Economic evaluations for life-extending treatments frequently require clinical trial data to be extrapolated beyond the trial duration to estimate changes in life expectancy. Conventional survival models often display hazard profiles that do not rise as expected in an aging population and require the incorporation of external data to ensure plausibility. Relative survival (RS) models can enable the incorporation of external data at model fitting. A comparison was performed between RS and “standard” all-cause survival (ACS) in modeling outcomes from the tafamidis for the treatment of transthyretin amyloid cardiomyopathy (ATTR-ACT) trial.
Methods
Patient-level data from the 30-mo ATTR-ACT trial were used to develop survival models based on parametric ACS and RS models. The latter was composed of an expected hazard and an independent excess hazard. Models were selected according to statistical goodness of fit and clinical plausibility, with extrapolation up to 72 mo validated against ATTR-ACT long-term extension (LTE) data.
Results
Information criteria were too similar to discriminate between RS or ACS models. Several ACS models were affected by capping with general population mortality rates and considered implausible. Selected RS models matched the empirical hazard function, could not fall below general population hazards, and predicted well compared with the LTE data. The preferred RS model predicted the restricted mean survival (RMST) to 72 mo of 51.0 mo (95% confidence interval [CI]: 46.1, 55.3); this compared favorably to the LTE RMST of 50.9 mo (95% CI: 47.7, 53.9).
Discussion
RS models can improve the accuracy for modeling populations with high background mortality rates (e.g., the ATTR-CM trial). RS modeling enforces a plausible long-term hazard profile, enables flexibility in medium-term hazard profiles, and increases the robustness of medical decision making.
Highlights
To inform survival extrapolations for health technology assessment, a relative survival model incorporating external data per the recommendations of the National Institute for Health and Care Excellence (NICE) Decision Support Unit was used in support of the NICE evaluation of tafamidis for treatment of transthyretin amyloid cardiomyopathy (ATTR-CM).
Relative survival modeling allowed selection of a broader range of hazard profiles compared with all-cause survival modeling by ensuring plausible long-term predictions.
Predictions from plausible relative survival models of overall survival in patients with ATTR-CM, extrapolated from the ATTR-ACT trial, validated very well to outcomes after a doubling of follow-up and demonstrated improved precision and accuracy versus parametric all-cause survival models.
Keywords
Introduction
Extrapolation of Survival Outcomes for Cost-Effectiveness Analysis
Economic evaluations for life-extending treatments frequently require clinical trial data to be extrapolated beyond the trial duration to assess the benefits of an intervention over a lifetime horizon. Conventional extrapolation methods can result in predicted hazards lower than an acceptable reference, such as the hazard among the matched general population, at which point the model predictions may be dismissed as implausible. This situation occurs when observed hazards during the trial either decrease or increase at a slower rate than the expected (reference) hazard and are more likely to occur within the model time horizon when observed hazards are similar in magnitude to the expected value.
The consequence of estimating implausible hazards is that 1 of 2 actions will be taken:
The model will be post hoc modified with a “cap” of the expected mortality rate, implying the extrapolative model’s breakdown prior to this point and conditional survival equal to the expected from this point onward.
Removal of the model from consideration to inform all or part of the hazard profile.
Consideration is usually made of the time of intercept and the proportion of the population surviving at intercept, as well as clinical expectation of excess hazard. If models are removed from consideration, this reduces the range of hazard profiles available to the analyst to describe and extrapolate the data, particularly where there are turning points in the observed hazard. 1
Alternative methods for survival model fitting that incorporate external data and so prevent estimated hazards lower than that of the time-varying expected hazard profile, such as relative survival (RS) modeling, are available and were recommended for use in guidelines for model selection prepared by the Decision Support Unit (DSU) of England’s National Institute for Health and Care Excellence (NICE) in technical support document (TSD) 21. 2 In a review of NICE Health Technology Assessment (HTA) submissions for oncology at that time, no cost-effectiveness analyses used such methods. This article describes, to the author’s knowledge, the first use of RS modeling in support of a NICE HTA.
Tafamidis for Transthyretin Amyloidosis with Cardiomyopathy
An example of hazards after treatment being commensurate with the general population mortality hazard occurred in the tafamidis in transthyretin cardiomyopathy clinical trial (ATTR-ACT) trial (NCT01994889). 3 This phase 3 trial investigated the treatment of transthyretin amyloid cardiomyopathy (ATTR-CM), a disease that occurs in an elderly population. ATTR-CM is a rare, fatal disease resulting from the accumulation of amyloid fibrils within cardiac tissue, leading to progressive heart failure. 4 Prior to tafamidis becoming available, treatment was limited to supportive care and, in a small number of patients, a mechanical cardiac assist device (CMAD) or heart transplant. 5 Patients completing ATTR-ACT could enroll in a long-term extension (LTE) study to receive up to an additional 60 mo of tafamidis treatment (NCT02791230). Tafamidis is an oral treatment that inhibits fibril formation and was approved for the treatment of ATTR-CM on the basis of the ATTR-ACT trial, which demonstrated significantly lower rates of all-cause mortality, cardiovascular hospitalization, and functional decline versus placebo at 30 mo.3,6
When disease progression is slowed by treatment with tafamidis, the overall hazard of mortality remains greater than that in an age- and sex-matched population, but over the course of the ATTR-ACT trial, this excess hazard decreased as the general population hazard increased, demonstrating the profile described above, which can result in the intercept of the hazard functions.
Models derived using an RS technique were used to inform NICE technology appraisal (TA) 696, Tafamidis for Treating Transthyretin Amyloidosis with Cardiomyopathy. 7 The survival modeling method was accepted in the original submission in 2021, which was contemporary to the publication of TSD 21. The final decision for reimbursement in England was made in June 2024, having incorporated data from ATTR-ACT LTE to reduce uncertainty and following changes to the assumptions regarding outcomes after treatment cessation and price negotiation. Extrapolating survival from ATTR-ACT is an example of a complex hazard situation, due to high background mortality in the mainly elderly patient population (average age in ATTR-ACT at baseline was 74 y), uncertainty over attribution of cause of death in a disease that mimics the symptoms of more common causes of heart failure, and the gains in overall survival (OS) seen in tafamidis-treated patients over placebo.
All-Cause Survival Modeling and Post Hoc Adjustment
Extrapolation is commonly performed by parametric models of standard distribution families, with the optimal model chosen based on penalized fit statistics (Akaike information criteria [AIC] and Bayesian information criteria [BIC]) and clinical plausibility of the hazard function and survival estimations.8,9
An algorithm for model selection was proposed in TSD 14 published by the DSU of NICE. 10 The initial recommendation is fitting to the data a minimum of 6 key distributions: exponential, Weibull, Gompertz, log-logistic, lognormal, and generalized gamma distributions. This methodology to describe the full distribution of event times may be termed parametric all-cause survival (ACS) modeling. Alternative modeling approaches were recommended only if these models failed to adequately describe the data. However, the distribution functions have limited flexibility, which may be insufficient to accurately model the event times over the full population. As a particular example, these simple distributions are unable to model a classic bathtub curve of early and late deaths. The limited range of hazard functions expressible by these models is shown in Collett. 11
More flexible methods of survival modeling that are capable of representing complex hazard functions are suggested in TSD 14 for use when these first-stop models are judged to be inadequate, 10 in particular, piecewise models, in which the hazard function is divided into nonoverlapping periods, 12 and cubic spline–based models, which are capable of predicting multimodal distributions.13,14 Other alternatives, suggested within an updated TSD (TSD 21, described below) include mixture or mixture-cure models, which explicitly include subpopulations with differing survival distributions. 2
Post Hoc ACS Adjustment
Parametric ACS modeling relies on the clinical trial data to determine the complete hazard function. Where data are mature, flexible parametric models for extrapolation to a restricted mean are suitable (e.g., 10 y in advanced cancer patients in Gray et al. 15 ), and empirical evidence continues to develop supporting their accuracy in extrapolation. 16 The plausibility of model predictions should be considered in the context of external data; as a constraint, the matched general population hazard is used as a minimum value. If predicted hazards are below this, the extrapolative model will generally be considered implausible and must be modified to give the survival estimations face validity. A common approach is the use of curtailment of the survival time distribution (or “capping” of the parametric hazard function) by the expected hazard; this takes the predicted hazard from the parametric model, compares it to the expected hazard, and takes the maximum of the two, resulting in a model discontinuity (i.e., a kink in the curve) when this curtailment first occurs (Figure 1a). This is very common in modeling of treatments for cancers; a recent example appears in NICE TA 963. 17
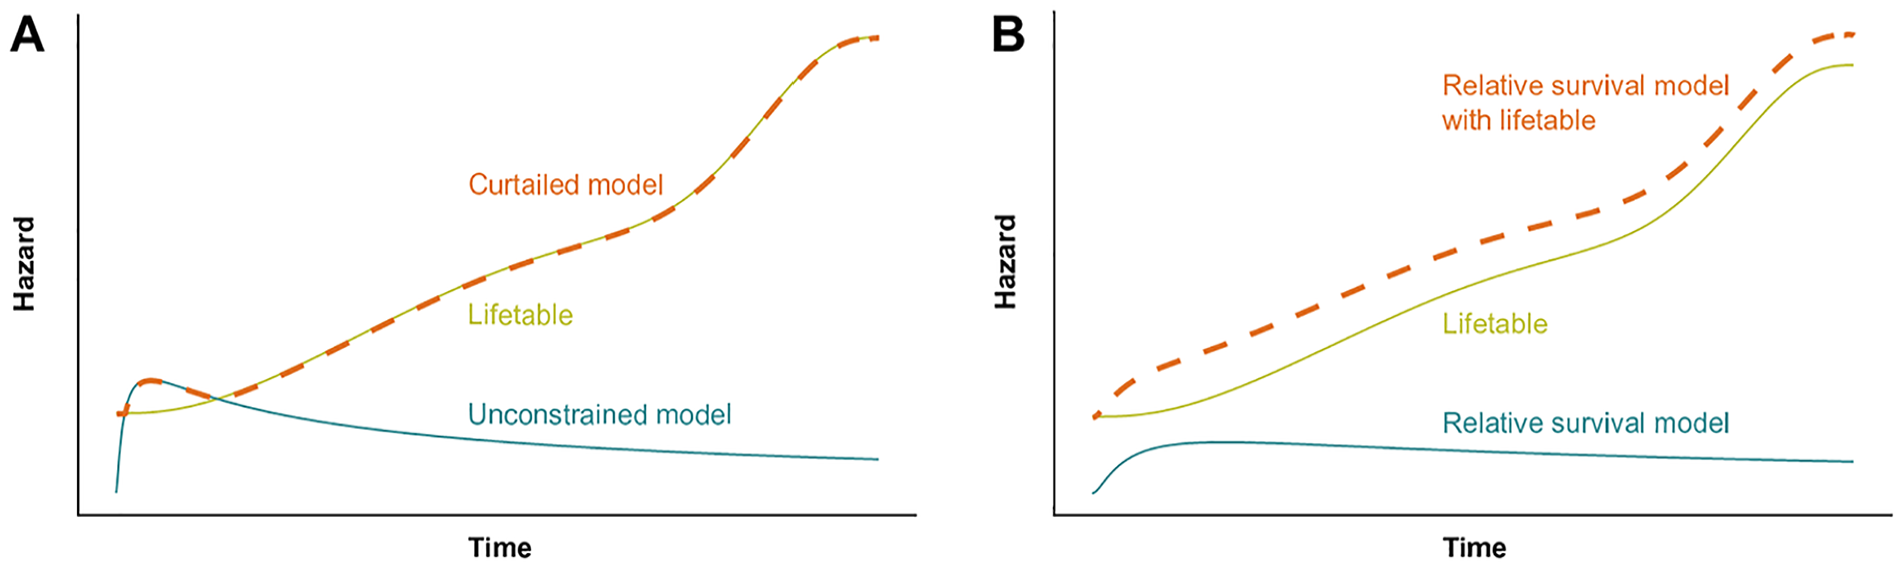
Illustration of methods for avoiding underprediction when compared with general population mortality hazards. (a) Hazard predictions from a curtailed model; the maximum of lifetable and unconstrained model hazards is taken. (b) Parametric relative survival model predicting all-cause survival by the addition of lifetable hazards. Lifetable: marginal mortality hazards in the general population. Unconstrained model: parametric all-cause survival model, free to predict hazards lower than the matched general population.
This post hoc modification compromises 2 foundational assumptions of the extrapolative model. First, that the partial distribution of the observed survival times is completed by the distribution of the unobserved survival times. Second, that estimation of parameters that maximize the likelihood of the model to predict the observed data result in a model that provides the best estimate of survival probability over time for the unobserved portion of the distribution. 18 In addition, after curtailment, the lack of first-order continuity of the hazard function denies the justification for extrapolation based on continuity (e.g., for Royston–Parmar spline models). 13 As such any ACS model that requires post hoc modification has no established justification for its use in extrapolation, presenting an existential problem for model selection.
RS Modeling
The issue of modeling complex hazard functions was reviewed by Rutherford et al., to produce NICE DSU TSD 21. 2 Recommendation III of this TSD was that models should incorporate background mortality to avoid implausible projections. Among other suggestions, the potential was identified for using RS models, otherwise known as excess mortality models.
RS modeling uses an externally defined expected hazard function to which a fitted hazard function is added such that all-cause hazard is estimated. 19 This additional hazard is assumed to be cause specific and can be applied even in situations where there is uncertainty about individual causes of death. 2 The expected and fitted excess hazard functions can then be combined to estimate long-term ACS, even when the hazard shape is complex.1,2,20 The tutorial of Sweeting et al., 21 describes the implementation of these models. Alone, the excess hazard predicted by the RS model will appear to underestimate marginal hazards, and it should never be applied without the addition of the expected hazard (Figure 1b). The incorporation of the expected hazards has greatest impact when the hazard of mortality due to the disease under treatment does not greatly exceed that of mortality due to other causes. This may be the case both before and after, or only after, intervention and is more common in older populations, who have a sharply increasing expected mortality hazard over time.
The excess hazard functions in the model of Nelson et al., 20 are flexible parametric models (FPMs), an approach taken by Anderson et al., 22 in estimation of loss of life expectancy in cancer patients. At the time of the development of the models in the application reported here, acceptance of the extrapolative performance of FPMs was still developing, with studies such as that of Gray et al. 15 being published contemporaneously. As such, the established rationale for extrapolation using conventional parametric survival distributions, such as the Weibull and lognormal distribution, 10 was used to determine the range of candidate models fitted here.
Application
This article illustrates the application of RS modeling to the treatment of ATTR-CM with tafamidis. It uses data from the 30-mo head-to-head double-blinded period of the ATTR-ACT trial and validates to data collected as part of the open-label LTE, within which patients either continued receiving their randomized tafamidis dose (tafamidis meglumine 20 mg or 80 mg per day) or were rerandomized to tafamidis if originally randomized to placebo. All patients subsequently transitioned to tafamidis free acid 61 mg (bioequivalent to tafamidis meglumine 80 mg per day). Interim data from this LTE are available to validate survival model extrapolations informed by the 30-mo head-to-head period.
Previously published economic analyses using parametric ACS models upon ATTR-ACT data are discussed to contextualize these results; Rozenbaum et al., 23 who used New York Heart Association (NYHA) predicted survival–specific models, and Li et al., 24 who used an alternative OS outcome.
Objective
To empirically evaluate RS models as a method to accurately model and extrapolate complex hazard functions, with comparison to standard ACS models, considerate of long-term plausibility.
Methods
All-Cause Survival Modeling
The model selection algorithm proposed by TSD 14 was followed to produce parametric ACS models. Data informing outcomes after treatment with tafamidis were taken from a pool of the tafamidis meglumine 80 mg and 20 mg arms, as during ATTR-ACT no difference in treatment effect versus the common placebo arm was measured between the 2 dosing arms.3,25 As the assumption of proportional hazards between tafamidis and placebo arms was rejected due to the late (>18 mo) divergence of the log cumulative hazard and a rejection of the Therneau–Grambsch test (Supplementary Material Section 3.1.1), only models fitted independently to the pooled tafamidis arms are reported here.
RS Modeling
As per the guidance of TSD 21, models incorporating external mortality hazards were fitted. A model of RS was defined as per Nelson et al., 20 (see Supplementary Material, Section 1 for a full methodological and mathematical description). A summary of the modeling approach is depicted in Figure 2. The model considers an all-cause hazard function composed of 2 independently competing hazards:
an expected hazard (Figure 2a), predefined from country-specific lifetables (Supplementary Material, Section 2) and
an additional (disease-related) excess hazard (Figure 2b) to account for the difference between the expected rate of death and the observed rate of death in ATTR-ACT. A parametric survival time distribution is chosen to describe this excess hazard function (Figure 2c), and the parameters of this function are fitted by maximum likelihood (Figure 2d).
The marginal survival function is calculated as a product of both the RS and a lifetable-informed expected survival.
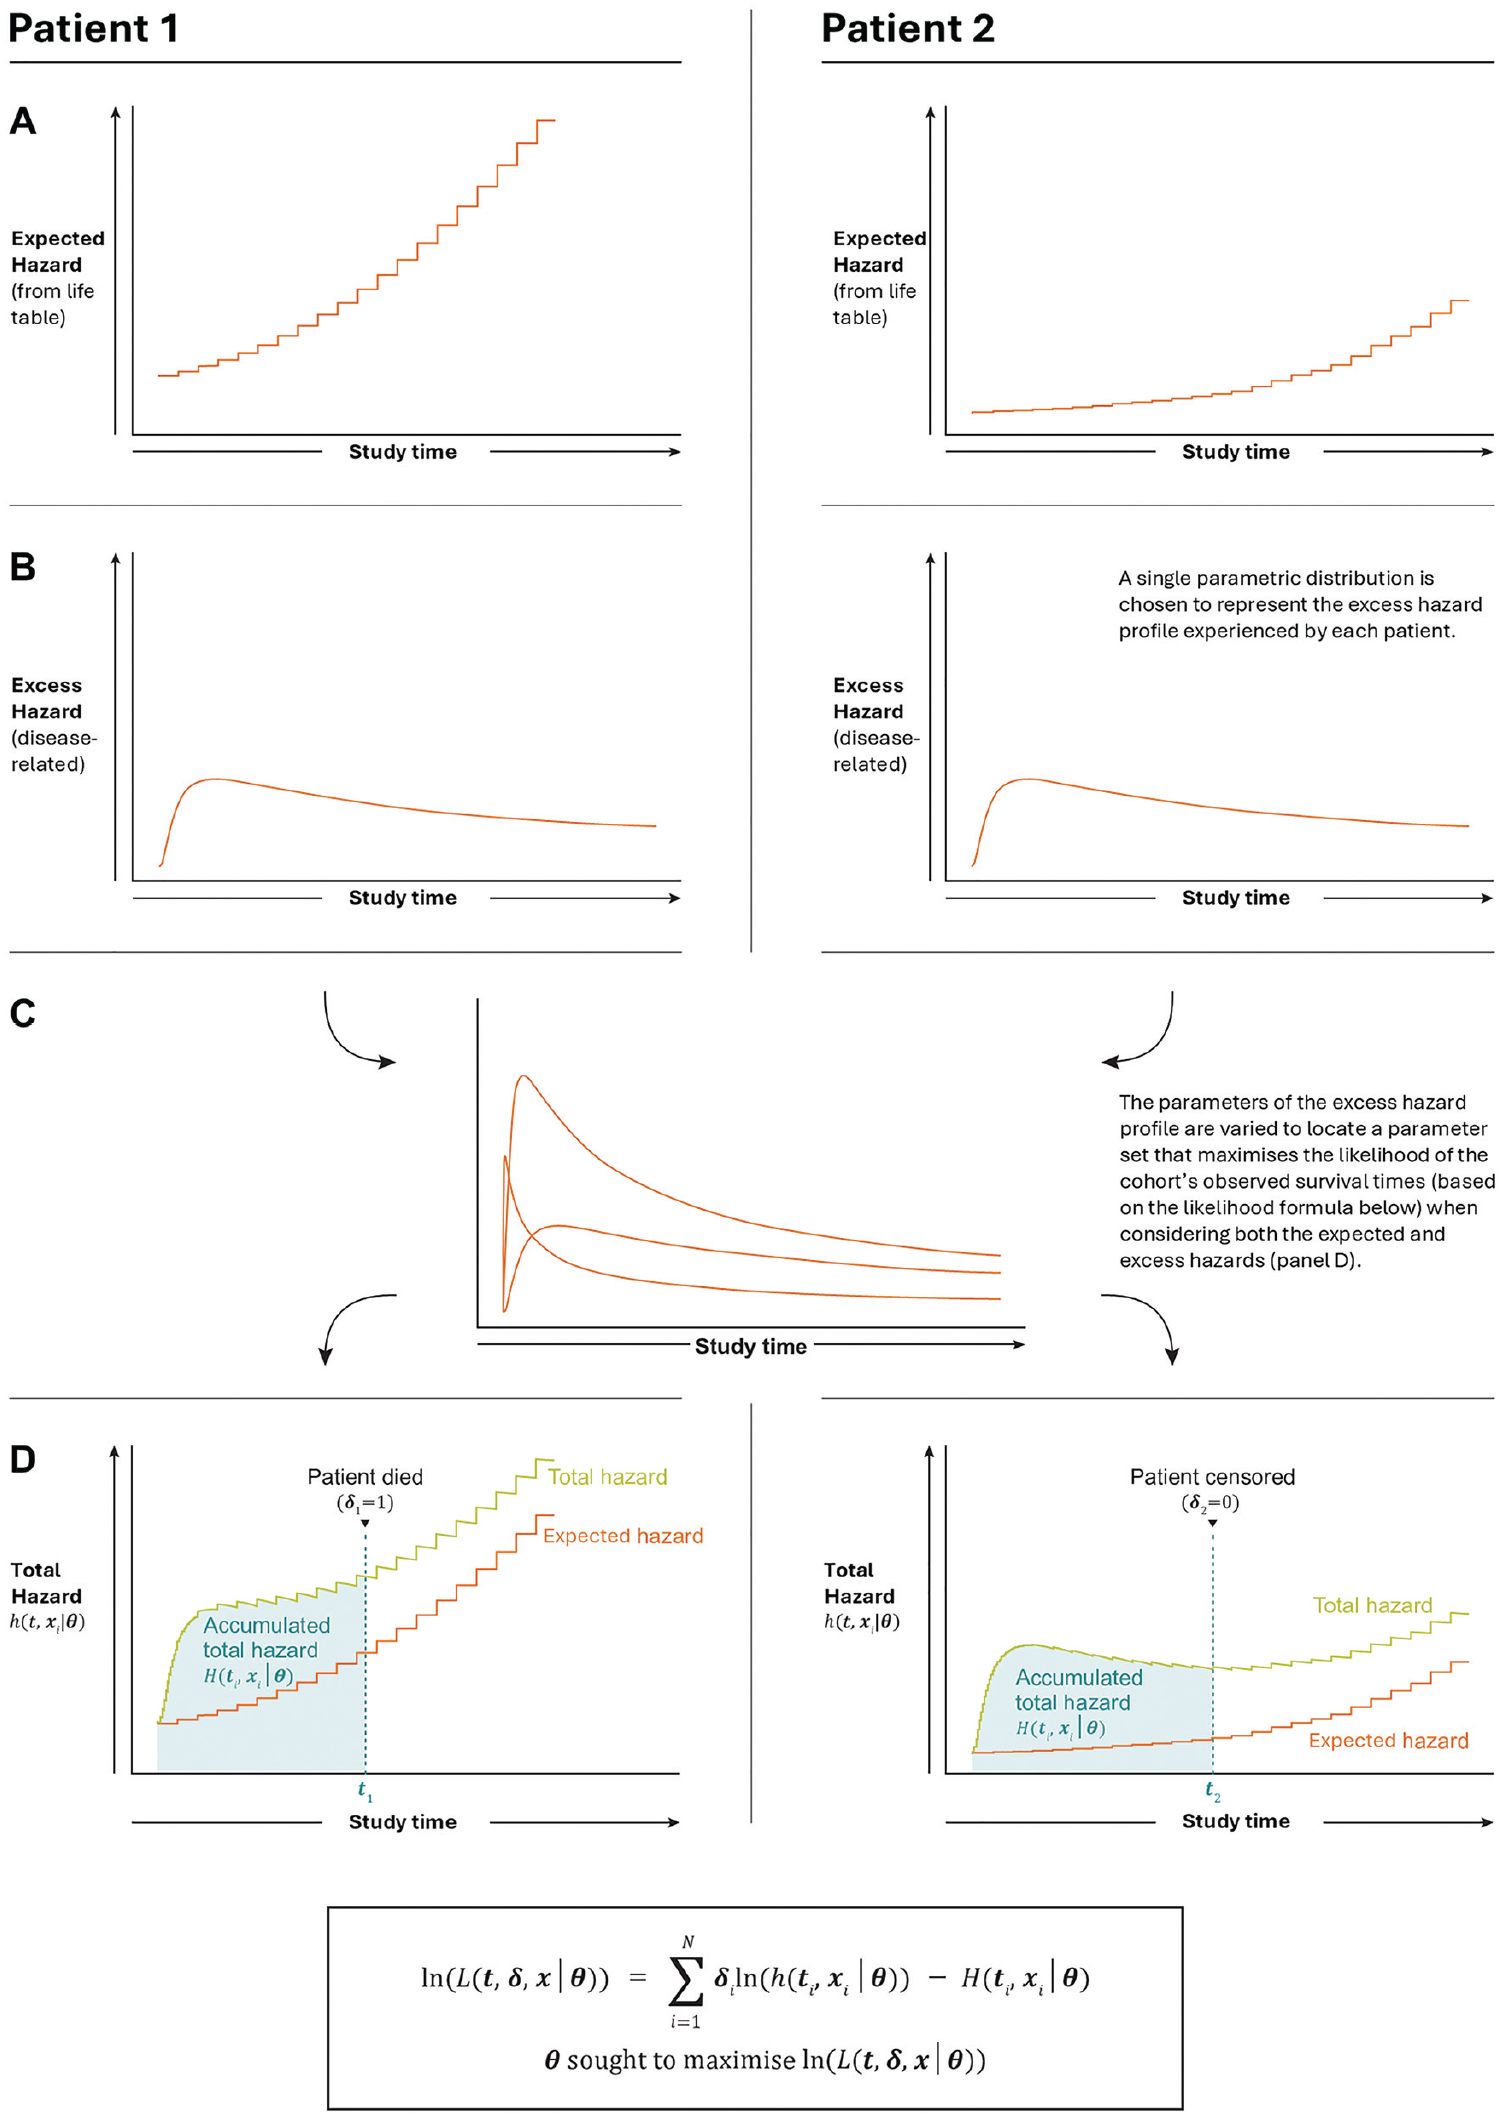
Illustrative summary of the modeling approach, applied for all patients in the modeled arm of ATTR-ACT. Fitting of parametric relative survival models to observed survival times within a cohort with heterogenous expected hazard profiles. Two example patients demonstrated, with differing expected hazard profiles due to, for example, differing baseline age, sex, and nationality. (a) Expected hazard was calculated from country-specific life tables for each patient. (b) An excess (disease-related) hazard, to be determined by maximum likelihood, was added to the expected hazard to account for additional mortality not expected by the matched life table data. (c) A parametric distribution was chosen to represent the disease-related death times of all patients. (d) The total hazard for each patient is the sum of their individually matched life table hazard and the unconditional excess (disease-specific hazard). The free parameters of the disease-specific distribution are fitted such that the cumulative hazard observed over all patients’ survival time is minimized and the hazard at the time of death is maximized, per the likelihood equation given in Supplementary Materials, Section 1.1.
The expected hazard function was considered to represent the hazard of mortality due to causes not linked to ATTR-CM, that is, the hazard of mortality among the population if the disease were not present in any individuals. In common with many estimations of RS for cancers, it was assumed that this was equal to the demographically matched general population life tables; that is, that the impact of patients with ATTR-CM upon the average rate of mortality in the general population was negligible. 26
Life tables reporting the years closest to contemporary with ATTR-ACT were sourced for each of the countries that had study centers in the trial (Supplementary Materials, Section 2.1). These were stratified by sex, and for the United States, additional stratification was available for subgroups identifying as of Black or African American race and non-Hispanic ethnicity, and of Hispanic ethnicity. Expected hazard was then determined (Supplementary Materials, Section 1.2). Due to the use of expected hazards with limited stratification, confounding of ATTR-CM–specific excess hazards with any other-cause excess mortality hazards in population subgroups with higher propensity to develop symptomatic ATTR-CM is acknowledged, and the excess hazard models fitted described the net effect of both of these sources of excess hazard. As the predictions presented here are upon the same expected hazard as the excess was fitted, total hazard is recovered over the same demographic mixture, but this confounding should be considered when predicting upon external populations with expected hazards that may reflect alternative demographics.
The prediction of total hazards and ACS used an expected hazard equal to the average matched life table hazard of the trial population, estimated using the Ederer (I) method, 19 that is, assuming that relative risks of mortality due to age and sex were consistent with life tables.
Selection of RS models proceeded per the TSD 14 algorithm, considerate of information criteria, visual fit, and hazard profile.
Validation with LTE Data
Validation was undertaken against LTE data using a cutoff date of August 1, 2021, providing a minimum of 72 mo of follow-up. Absolute rates of survival predicted by the Kaplan–Meier (KM) estimator upon these data at 60 and 72 mo were compared with extrapolated model predictions, with the latter time giving greater potential for deviation but higher uncertainty in the KM estimator due to censoring. In addition, the restricted mean survival time (RMST) for these same points, as predicted by a flexible parametric survival model fitted to the LTE data, were compared with the RMST predicted by extrapolated models. Candidate flexible parametric models consisted of Royston–Parmar splines with between 0 and 5 internal knots at regular quantiles on the hazard, odds, and normal scales. The model with minimal AIC was selected, representing a parsimonious representation of the observed LTE data. This method was chosen over aggregation of the area under the KM curve to reduce the sensitivity of the RMST to the timing of events at the extent of follow-up, where censoring results in larger “steps” in the estimator. Deviation from the KM at these times should be penalized less, as the survival estimate is less precise. It was therefore preferred to assess the RMST under a continuous function, which was fitted via maximum likelihood to the observed data provided that such a model was sufficiently flexible to be an accurate representation of the underlying hazard function.
General Statistical Considerations
Analyses were undertaken in the R statistical environment version 4.2.3, using the “flexsurv” package for maximum-likelihood fitting of (flexible) parametric models and “bshazard” for estimation of the empirical hazard function. 27 Confidence intervals (CIs) for survival model statistics were calculated using a nonparametric bootstrap (1,000 repetitions). Session details are provided in the Supplementary Materials, Section 1.3.
Results
All-Cause Survival Modeling
Following the TSD 14 algorithm, scaled (e.g., proportional hazards) models jointly modeling the placebo and pooled tafamidis arm outcomes were not feasible, and independent modeling of the tafamidis arm outcomes was undertaken. By inspection of nonparametric smoothers and transforms of the hazard, cumulative hazard, and survival functions, it was concluded that plausible all-cause hazard functions were likely to intercept general population mortality hazards. See the Supplementary Materials, Section 3.1, for details.
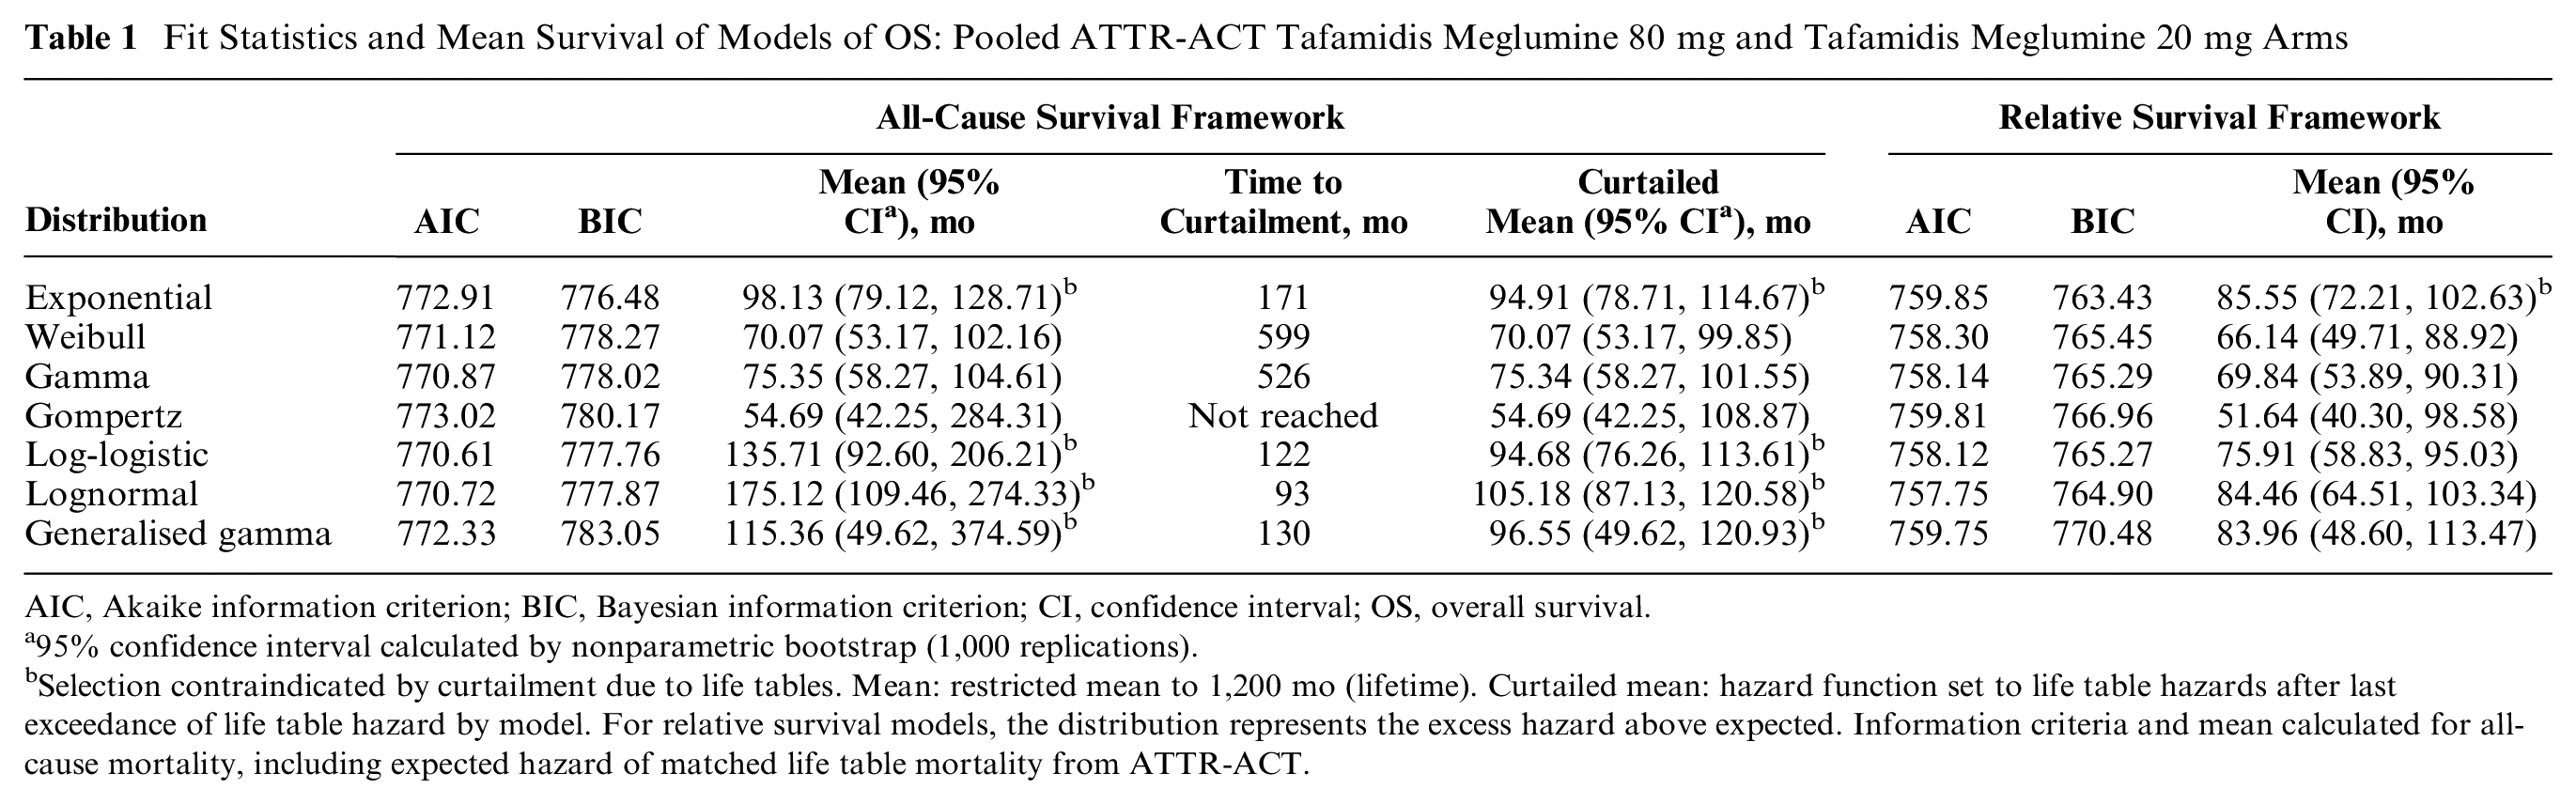
The 6 key parametric models plus the gamma distribution were fitted to the data as ACS models (Table 1, Figure 3a). All models for tafamidis were within the AIC range 770.61 to 773.02 (log-logistic and Gompertz, respectively) and BIC range 776.48 to 783.05 (exponential to generalized gamma, respectively). The exponential model was rejected by consideration of the empirical hazard estimator and interception of the general population mortality rate, and thus, the BIC was not considered reliable for model ranking. The lognormal, log-logistic, and generalized gamma models all reached peak hazard within the first 30 mo and decreased to intercept general population mortality rates between 7 and 11 y after trial start, requiring curtailment at these points. The use of these models would risk rejection by evidence reviewers due to this breakdown in extrapolation. Of the remaining distributions, hazard due to the Gompertz model increased rapidly and was inconsistent with the B-spline empirical hazard estimator (Figure 3c). The Weibull and gamma models increased in hazard at a lower and decreasing rate. The mean survival of the monotonically increasing hazard distributions was lowest for the Gompertz at 54.69 mo (95% CI 42.25, 284.31) and highest for the gamma at 75.35 mo (95% CI 58.27, 104.61).
Fit Statistics and Mean Survival of Models of OS: Pooled ATTR-ACT Tafamidis Meglumine 80 mg and Tafamidis Meglumine 20 mg Arms
AIC, Akaike information criterion; BIC, Bayesian information criterion; CI, confidence interval; OS, overall survival.
95% confidence interval calculated by nonparametric bootstrap (1,000 replications).
Selection contraindicated by curtailment due to life tables. Mean: restricted mean to 1,200 mo (lifetime). Curtailed mean: hazard function set to life table hazards after last exceedance of life table hazard by model. For relative survival models, the distribution represents the excess hazard above expected. Information criteria and mean calculated for all-cause mortality, including expected hazard of matched life table mortality from ATTR-ACT.
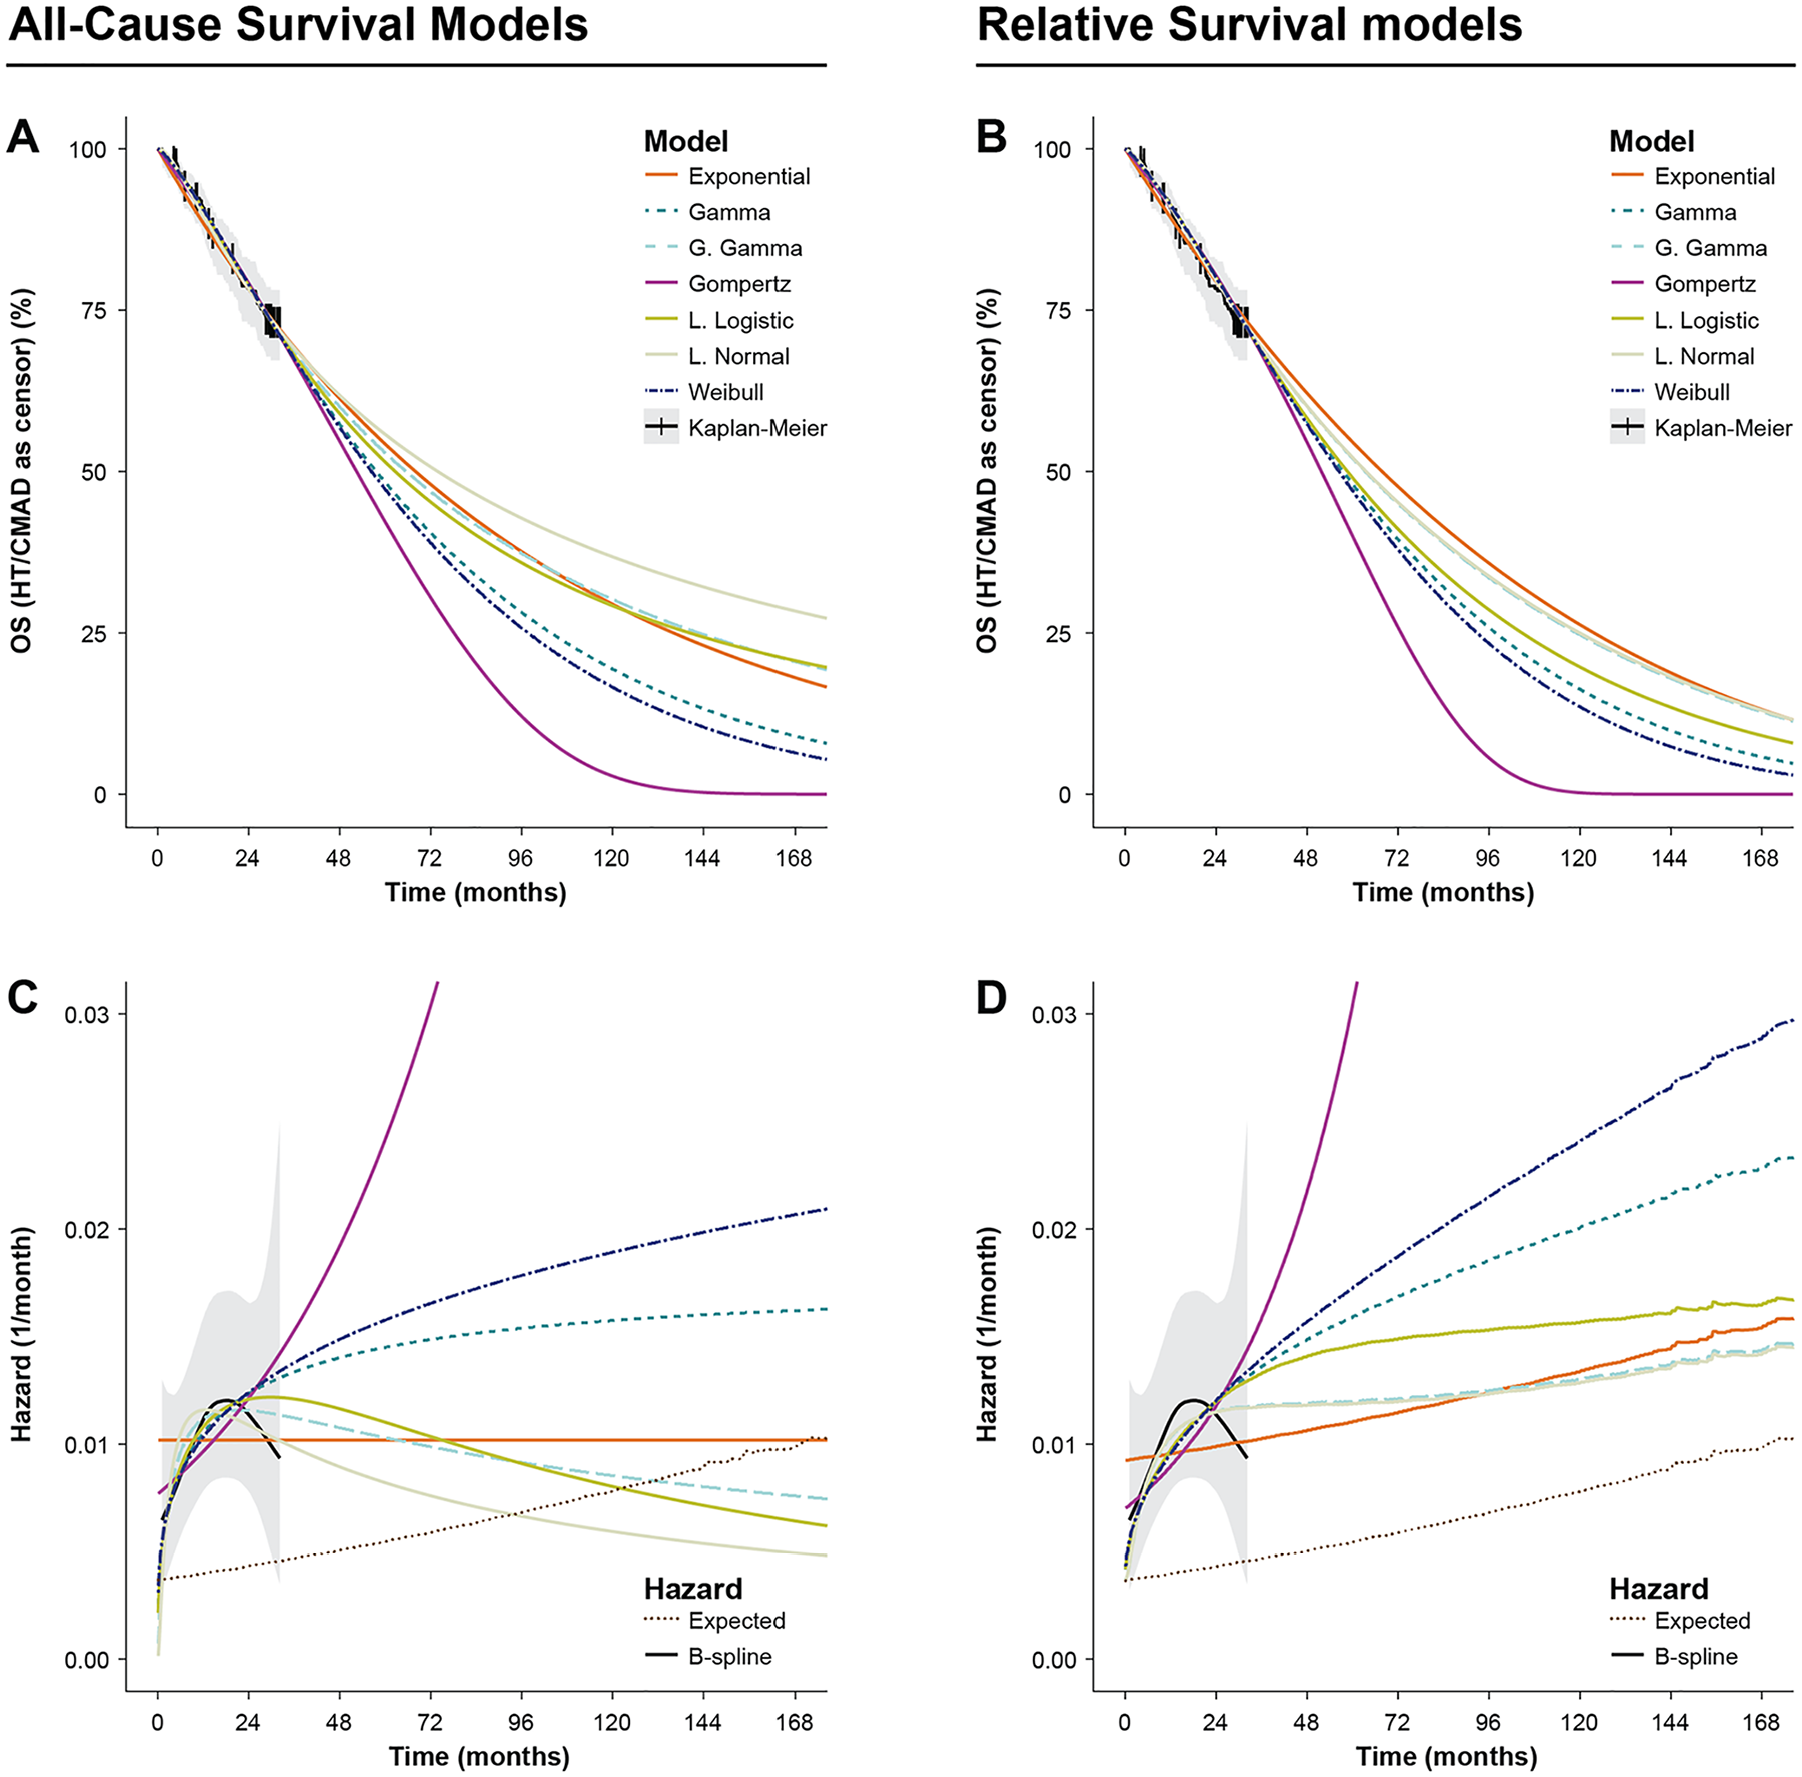
Extrapolative all-cause survival (ACS) (a, c) and relative survival (RS) (b, d) models of overall survival (OS) fitted to pooled tafamidis meglumine 80 mg and 20 mg arms of ATTR-ACT, with Kaplan–Meier (KM) survival and B-spline hazard estimators based on ATTR-ACT 30-mo head-to-head period. (a) OS predictions of parametric ACS models overlaying KM. Shaded area: 95% confidence interval (CI) of KM. (b) OS predictions using parametric RS models plus life table expected hazard overlaying the KM estimator. Shaded area: 95% CI of KM. (c) Hazards of ACS models of OS overlaying B-spline estimate of all-cause mortality hazard. Shaded area: 95% CI of B-spline. (d) All-cause hazards of RS models overlaying B-spline estimate of all-cause mortality hazard. Shaded area: 95% CI of B-spline. Fluctuations in hazard are visible due to the discrete end of the individual patient matched life tables.
Based on the above, the gamma model could be chosen as a practical base case; it initially followed the profile of the empirical hazards and did not intercept life table hazards within 20 y (Figure 3a and c, Table 1). However, the range of hazard profiles possible under the gamma distribution precluded representation of the observed hazard inflection. The log-logistic model also demonstrated good fit, but this provides an example of a model that would be expected to intercept general population mortality hazards within a few years of extrapolation, indicating a progressive degradation of its predictive performance over this period.
RS Modeling
The 7 parametric distributions were then fitted as RS models. As with the ACS models, fit statistics did not differ greatly between the distributions (Table 1); all AICs were in the range 757.75 to 759.85 (lognormal and exponential, respectively), and BICs were in the range 763.43 to 770.48 (exponential and generalized gamma, respectively). However, as the increasing rate of general population mortality was incorporated into the fitted models, only the exponential model was rejected due to being inconsistent with the observed hazard function, and the BIC was again considered unreliable to rank models for selection due to its favoring of the exponential model. Visual inspection of the model predictions showed consistency between models and the KM estimator (Figure 3b). Compared with plausibly acceptable ACS models, the range of predicted mean survivals was greater, from 51.64 mo (95% CI 40.30, 98.58) for the Gompertz to 84.46 mo (95% CI 64.51, 103.34) for the lognormal model. Moreover, models with greater mean (e.g., lognormal, generalized gamma, log-logistic) fitted the observed hazard profile better than those with lower mean did (e.g., Gompertz, Weibull, gamma) (Figure 3d) and maintained a plausibly increasing hazard as the population aged.
All models predicted substantial excess hazard compared with the general population in long-term extrapolation; the lowest being predicted by the lognormal model: 0.51% per month at 120 mo and 0.42% per month at 180 mo, resulting in hazards approximately double that of the general population (Figure 3d). This was in line with the clinical expectation that patients with ATTR-CM would not reach general population levels of mortality, as tafamidis is not a curative treatment. The lognormal and generalized gamma models best represented the shape of the empirical hazard function; in the former case leveling off around 30 mo and sustaining an approximately constant hazard before rising as the population aged (Figure 3d). The generalized gamma model fitted with parameter values that reduce to the lognormal distribution. Based on data to this follow-up, the lognormal was chosen as the preferred model, as the lower number of parameters versus the generalized gamma indicated a more parsimonious fit and there was high uncertainty in the parameters of the generalized gamma model.
Validation with LTE Data
An interim analysis of the ongoing LTE study reported 79 (44.9%) deaths with continuous tafamidis meglumine 80 mg (or 20 mg) and 111 (62.7%) in patients who crossed over from placebo to tafamidis (hazard ratio 0.59 [95% CI, 0.44–0.79]; P < 0.001), after median follow-up of 58.5 and 57.1 mo, respectively.25,28
Validation was undertaken upon the population originally randomized to tafamidis meglumine at 80 mg or 20 mg, consistent with the population used for parameterizing the survival models. Survival at 60 and 72 mo was predicted as 53.2% (95% CI 46.4%, 59.5%) and 44.5% (95% CI 36.5%, 52.2%), respectively, by the KM estimator (Supplementary Materials, Section 3.2). Among the ACS models, the log-logistic model produced central predictions nearest these values, at 51.5% (95% CI 42.0%, 60.8%) and 45.3% (95% CI 35.2%, 55.6%), respectively, with the generalized gamma model also validating well at 52.9% (95% CI 35.9%, 64.9%) and 46.9% (95% CI 22.5%, 61.1%), respectively. Among the RS models, the lognormal gave the most consistent predictions, with 52.2% (95% CI 41.1%, 61.1%) at 60 mo and 45.2% (95% CI 33.0%, 54.9%) at 72 mo. The generalized gamma model performed almost identically in central estimation but gave wider confidence intervals.
The RMST to 60 mo was estimated at 45.0 mo (95% CI 42.5, 47.2), and at 72 mo it was estimated to be 50.9 mo (95% CI 47.7, 53.7) using a 0-knot odds spline model (i.e., log-logistic model) fitted directly to the ATTR-ACT LTE data (Figure 4). Among the ACS models, the generalized gamma predicted well, with an RMST of 44.9 mo (95% CI 42.1, 48.0) at 60 mo and 49.6 mo (95% CI 45.0, 54.3) at 72 mo; other models tended to underpredict. Among RS models, the preferred lognormal predicted well, with an RMST of 45.2 mo (95% CI 41.7, 48.4) and 51.0 mo (95% CI 46.1, 55.3). The validation targets were consistent with respect to validation model selection; all other FPM models and the KM were within 0.74% and 0.52% of the selected 0-knot odds spline-predicted RMST at 60 and 72 mo, respectively.
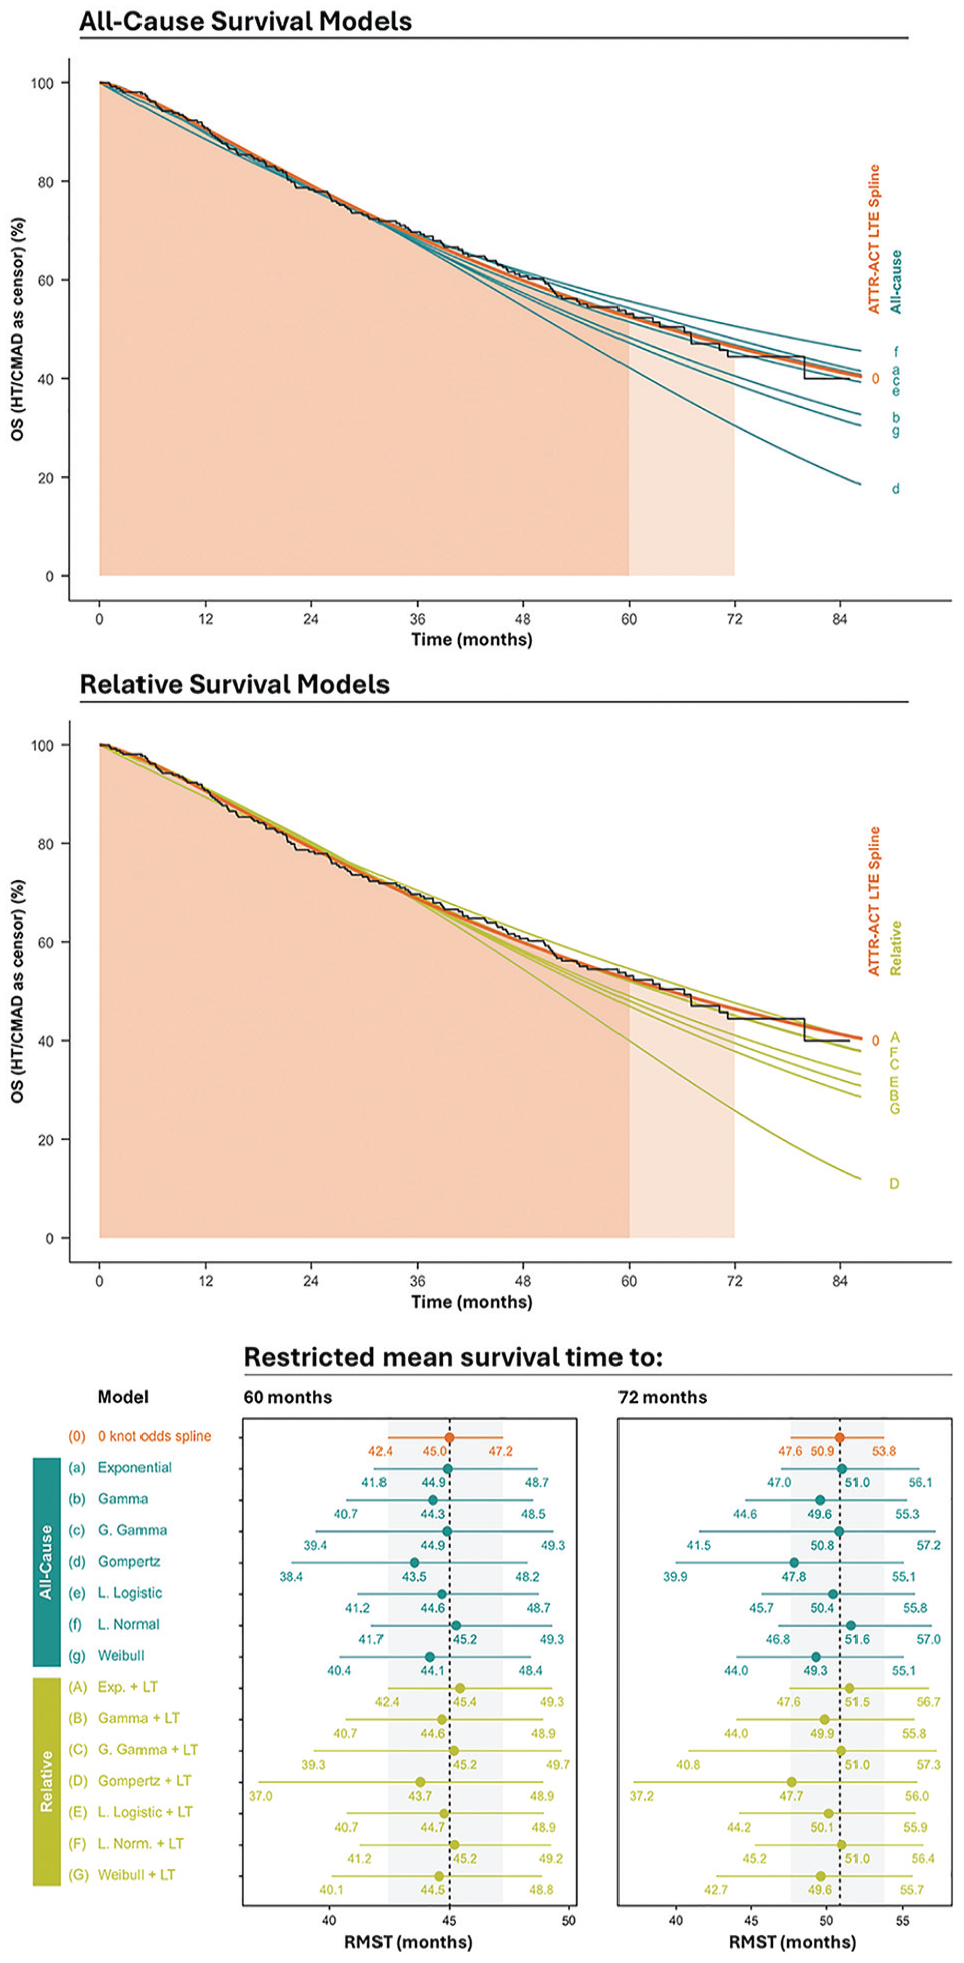
Overall survival censoring for heart transplant and cardiac mechanical assisted device: restricted mean survival time to 60 and 72 mo.
Discussion
In this article, we demonstrated the use of an RS model to improve the plausibility of modeling all-cause mortality in patients with ATTR-CM, allowing for the natural progression of hazards from disease-specific dominant to other cause dominant among long-term survivors in an elderly population. This method produced models with good predictive accuracy that generated higher mean survival estimates than the subset of ACS models that did not intercept general population hazards. This increases confidence in the strong survival benefits of tafamidis, which our results suggest may more than double the remaining life expectancy of patients with ATTR-CM compared with standard care—a result consistent with other studies, described below.
The RS models used in this analysis assume independence of expected and excess hazards, that is, that the factors determining expected hazard (e.g., age, sex, country, calendar year) are not influential upon excess hazard. A necessary feature expected within the ATTR-ACT data to support this assumption was that population demographics with respect to these factors would evolve per the expected hazard, for example, that the age distribution at month 30 would be due to the conditional expected mortality hazard over 30 mo over the baseline age distribution through 30 mo of follow-up. This is explained further in Supplementary Material Section 1.1 and demonstrated to hold in Supplementary Material Section 3.3.
Previous analyses23,24,29 have been based on the DSU guidance in the older TSD14, 10 whereas this analysis incorporated the more recent guidance provided in TSD21. 2 Rozenbaum et al., 23 used TSD14 to select survival models and determined that all-cause parametric models were appropriate, with independent models for the subgroups with NYHA class I/II (NYHA I/II) and NYHA III at baseline. They selected Gompertz models in the base case for the NYHA I/II subgroup and Weibull models for the NYHA III subgroup, with independently estimated parameters for the pooled tafamidis arms and the placebo (standard of care) arm. An early data cut of the ATTR-ACT LTE study was used to improve the estimation of the pooled tafamidis arms, and in both cases, these models would be expected to avoid curtailment. However, the rate of increase in hazard due to the Rozenbaum et al., model was very uncertain and resulted in a 95% CI in the mean life expectancy predicted by the combined model of 4.21 to 8.34 in the tafamidis arm, versus a central estimate of 6.73 y. This is similar to the 84.5 mo (7.04 y) predicted by the lognormal RS model. Despite using a more mature data set, parameter uncertainty using ACS models resulted in a confidence interval for life expectancy almost 2 y wider than that predicted by the present analysis. For the placebo/standard-of-care arm, data were more mature, and 2.85 (95% CI 2.50–3.34) life-years were predicted. The incremental life expectancy per maximum likelihood values differed by less than 1% between the models presented here and the Rozenbaum et al., models, but the uncertainty around this incremental life expectancy was reduced. Thus, RS models may improve precision from an earlier data cut.
Li et al., 24 also used the TSD14 algorithm to select survival models and concluded that simple all-cause parametric models were suitable. The gamma model was selected based on AIC/BIC across all arms. This did not consider that the increased spread of survival times among the population receiving tafamidis may be better described by an alternative statistical distribution, despite the superiority of both information criteria for the log-logistic and lognormal models over the gamma in the pooled tafamidis arms. It is unclear why these models were not explored in Li et al., and it may be that they were discarded due to their estimated hazards dropping below expected in an all-cause framework. The outcome used by Li et al., aligns with the trial primary analysis, which considered heart transplant and implantation of CMAD as deaths when calculating OS; in the analysis presented in this article, those events censor OS observations. Therefore, the outcome used by Li et al., underestimates mean OS, whereas censoring for CMAD and HT minimizes potential bias (of unknown direction). The gamma model has reasonable face validity as described in the ACS modeling section. The mean OS was not reported in the analysis of Li et al., but in the present analysis, the ACS gamma model predicted a mean survival of 75.35 mo (95% CI 58.27, 104.61) (6.11 [95% CI 4.86, 8.75] y). The confidence interval for this analysis is similar to the preferred RS model presented here, but the central estimate is almost a year lower, and RMST to 72 mo showed that the gamma model may underestimate survival in the long term; instead, the RS method may improve accuracy by enabling model selection from a broader range of candidates.
To follow-up times available for model validation in this study, curtailment of the ACS models did not occur and predictions, particularly of the generalized gamma model, were good. However, in further extrapolation, the generalized gamma model was curtailed at only 130 mo and, therefore, selection of this model would be expected to have incurred resistance from reviewers, whereas the most appropriate selection without curtailment, that is, the gamma model, would have resulted in substantial underprediction of survival by 72 mo. By contrast to the selection among ACS models, given that RS models are defined such that their hazards cannot drop below expected, models with higher mean such as the lognormal can be justified. These validated well to the ATTR-ACT LTE data.
The RS methodology described in this study was used to parameterize an economic model used in NICE TA 696. To our knowledge, and supported by the review by Bell-Gorrod et al., 8 this was the first use of an extrapolative RS model developed from trial data to support a NICE TA. A lognormal RS model incorporating outcomes from both the tafamidis meglumine 80 mg and 20 mg arms was used in the initial submission in 2020. During the submission, data became available from ATTR-ACT LTE. The lognormal model validated well to this, although the increased follow-up also enabled a change in the preferred model to the more flexible generalized gamma; however, this was rejected by the external assessment group (EAG). On resubmission in 2023, data from ATTR-ACT LTE were used to fit outcomes for patients who were randomized to tafamidis meglumine 80 mg, as by this point follow-up was sufficient to perform model selection upon the subgroup receiving the bioequivalent dose of tafamidis 61 mg, which is the formulation licensed for ATTR-CM. Although differences in outcomes between the dose groups were not apparent in ATTR-ACT, these were observed in LTE. A generalized gamma RS model was selected by the company, although the EAG preferred the lognormal RS model for consistency with the original submission, despite updated evidence. Ultimately, no concern was raised regarding the hazard profile of these models, although discrimination between similar or nested models, such as the generalized gamma and lognormal models, remains a challenge. Bayesian model averaging has been suggested as a method for reconciling this model selection challenge. 30
Conclusions
Given the advantages of the RS method illustrated in this analysis, we suggest that it should be considered more frequently in situations requiring the modeling of complex hazards, particularly in situations in which the overall hazard of mortality is comparable with general population norms due to low overall hazard, an elderly population, or survival of a fraction of patients to old age. RS modeling allows, without any post hoc modification, representation of a medium-term reducing hazard that will increase due to aging in the long term and so improve the accuracy and precision of estimates of lifetime benefits of life-extending treatments. These findings are consistent with the results of the model comparisons made by van Oostrum et al. 31 The flexibility of the method used here may be further extended by the use of flexible parametric models and dynamic RS models.32,33 The use of flexible parametric models for extrapolation has growing empirical support, despite being justified by only continuity assumptions.15,16 By allowing more accurate representation of observed hazard profiles in a plausible extrapolative framework, it is hoped that these improvements will increase the robustness of medical decision making.
Supplemental Material
sj-docx-1-mdm-10.1177_0272989X251342459 – Supplemental material for Relative Survival Modeling for Appraising the Cost-Effectiveness of Life-Extending Treatments: An Application to Tafamidis for the Treatment of Transthyretin Amyloidosis with Cardiomyopathy
Supplemental material, sj-docx-1-mdm-10.1177_0272989X251342459 for Relative Survival Modeling for Appraising the Cost-Effectiveness of Life-Extending Treatments: An Application to Tafamidis for the Treatment of Transthyretin Amyloidosis with Cardiomyopathy by Robert Young, Jack Said and Sam Large in Medical Decision Making
Footnotes
Acknowledgements
Medical writing assistance was provided by Jo Whelan and Robert H Jenkins of Health Economics and Outcomes Research Ltd., which was funded by Pfizer in accordance with Good Publication Practice (GPP3) guidelines (![]() ). R.Y. wishes to thank Jason Gordon of Health Economics and Outcomes Research Ltd. for additional scientific mentorship.
). R.Y. wishes to thank Jason Gordon of Health Economics and Outcomes Research Ltd. for additional scientific mentorship.
The authors declared the following potential conflicts of interest with respect to the research, authorship, and/or publication of this article: SL and JS are employees of Pfizer Ltd. RY is an employee of HEOR Ltd; HEOR Ltd received fees from Pfizer in relation to this study. The authors disclosed receipt of the following financial support for the research, authorship, and/or publication of this article: This study was funded by Pfizer Ltd. JS and SL are employees of Pfizer Ltd and were involved in the conception of the study and the writing of the manuscript.
Ethical Considerations
Not applicable.
Consent to Participate
Not applicable.
Consent for Publication
Not applicable.
Availability of Data and Materials
The analysis is based on individual patient-level data from the ATTR-ACT trial and its extension study; these data are not publicly available.
References
Supplementary Material
Please find the following supplemental material available below.
For Open Access articles published under a Creative Commons License, all supplemental material carries the same license as the article it is associated with.
For non-Open Access articles published, all supplemental material carries a non-exclusive license, and permission requests for re-use of supplemental material or any part of supplemental material shall be sent directly to the copyright owner as specified in the copyright notice associated with the article.