
Abstract
This study outlines methods for modeling disability-adjusted life-years (DALYs) in common decision-modeling frameworks. Recognizing the wide spectrum of experience and programming comfort level among practitioners, we outline 2 approaches for modeling DALYs in its constituent parts: years of life lost to disease (YLL) and years of life lived with disability (YLD). Our beginner approach draws on the Markov trace, while the intermediate approach facilitates more efficient estimation by incorporating non-Markovian tracking elements into the transition probability matrix. Drawing on an existing disease progression discrete time Markov cohort model, we demonstrate the equivalence of DALY estimates and cost-effectiveness analysis results across our methods and show that other commonly used “shortcuts” for estimating DALYs will not, in general, yield accurate estimates of DALY levels nor incremental cost-effectiveness ratios in a modeled population.
Highlights
This study introduces 2 DALY estimation methods—beginner and intermediate approaches—that produce similar results, expanding the toolkit available to decision modelers.
These methods can be adapted to estimate other outcomes (e.g., QALYs, life-years) and applied to other common decision-modeling frameworks, including microsimulation models with patient-level attributes and discrete event simulations that estimate YLDs and YLLs based on time to death and disease duration.
Our findings further reveal that commonly used shortcut methods for DALY calculations may lead to differing results, particularly for DALY levels and incremental cost-effectiveness ratios.
Disability-adjusted life-years (DALYs) measure disease burden in a population. Conceptualized in the Global Burden of Disease (GBD) study, DALYs quantify the total sum of years of life lived with disability (YLD), plus years of life lost to premature mortality from the disease (YLL; i.e., DALY = YLD + YLL). 1
In addition to their role in describing levels and trends in disease burdens worldwide, DALYs are a primary health outcome in evaluations of health interventions in low- and middle-income countries. In these settings, resource allocation decisions are guided by modeled assessments of the incremental costs per DALY averted under alternative (often competing) strategies to improve population health. i
Despite the prominent role of DALYs in global health policy, scant methodological guidance is available for adapting and/or structuring decision-analytic models for DALY outcomes. This methodological gap has its roots in health economics education, where textbooks and training exercises focus almost exclusively on quality-adjusted life-year (QALY) outcomes—the primary health outcome used for health technology assessments and policy decision making in high-income countries. DALYs differ from QALYs in important and model-relevant respects, including the use of reference life tables to calculate YLLs and standardized disability weights to calculate YLDs. ii To the extent DALY-specific modeling considerations are taught, they are often considered in isolation and without a firm methodological grounding in how one might structure a model to measure DALY outcomes.
As a consequence, and in practice, health economic applications often resort to shortcuts and other “hacks” for calculating DALYs. For example, practitioners may simply estimate a “QALY-like” DALY that is based on a diseased state occupancy payoff of 1 minus the disability weight. Other approaches define a diseased-state payoff using the disability weight as an estimate of YLDs and accumulate person-years in an absorbing death state (due to disease) as an estimate of YLLs. As this study will show, these shortcuts do not provide an accurate representation of DALY levels in a population.
This study outlines methods for direct incorporation of DALY outcomes in common decision-modeling environments. Our primary focus is on discrete-time Markov cohort models; however, our framework extends directly to microsimulation and is also easily adapted for continuous-time discrete event simulation models.
To maintain consistency within the literature, we build on an existing didactic disease progression model. 4 The underlying discrete-time Markov cohort model is time homogeneous; that is, transition probabilities do not vary as a function of age/time in the model. However, our methods and code are developed to accommodate time-inhomogeneous models. Finally, recognizing the wide spectrum of experience and programming comfort level among practitioners, we offer 2 approaches for modeling DALYs (beginner, intermediate) and provide replication materials for implementing our approaches in R and Microsoft Excel.
Background
This section provides background information sufficient for a conceptual understanding of DALYs and how to estimate them in a decision-analytic model; it is not intended as a comprehensive treatment of the subject. For an extensive discussion of the history, assumptions, and controversies around DALYs, see Arnesen and Nord (1999), 5 Mathers (2020), 6 and Parks (2014). 7
Years of Life Lived with Disability (YLD)
To quantify YLDs, conditions are assigned disability weights (
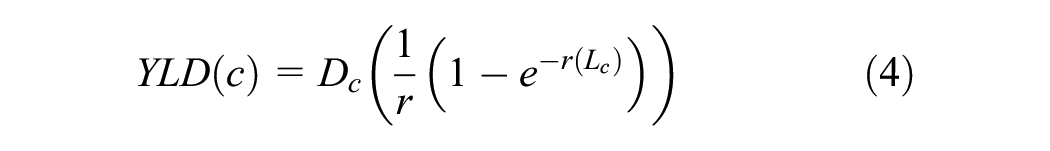
For a given condition

Years of Life Lost to Disease (YLL)
YLLs are determined by a loss function, which is typically defined as the number of years lost to premature mortality. This value is often taken from a life table that provides information on remaining life expectancy at the age of premature death,

For example, if an individual dies of a disease at age 60 y, and the remaining life expectancy for a 60-y-old is 30 y, then the YLL value for that individual would take a value of 30.
Choices over the specific value of remaining life expectancy will depend on the context and research question at hand. 10 Historically, the GBD has used an exogenous, external reference life table based on the maximum potential life span among humans.8,9 More recent GBD estimates draw on reference life tables based on the lowest observed age-specific mortality rates among geographies with populations greater than 5 million in 2016. 11
DALYS
DALYs are simply the sum of these 2 components:

Discounting
In the original GBD study, additional age-weighting and time-discounting practices were applied to DALY calculations. 1 These methods, respectively, weighted the burden of illness more during adulthood than early childhood and old age and valued present health over future years of illness by discounting YLD and YLL measures by 3% per year. From 2010 onward, both practices were discontinued to make the DALY a more descriptive measure. 8
While the GBD no longer uses age and time discounting, the World Health Organization’s Choosing Interventions that are Cost-Effective (WHO-CHOICE) program recommends consideration of time discounting of health outcomes.12,13 This creates a methodological tension between the GBD approach to quantifying disease burden and WHO approaches for cost-effectiveness analysis and health technology assessments.
To be comprehensive, we adopt the WHO-CHOICE recommendation and include discounting in our DALY modeling approach, although practitioners who do not wish to discount can simply set the discount rate to zero. One minor point of departure from standard methods is that we maintain the continuous-time discounting used in the original GBD DALY equations, which differs slightly from the more common use of discrete time discounting in Markov cohort models. We do so to allow for consistent discounting of YLDs and YLLs, since YLL values draw on continuous-time discounting to calculate a present value of remaining life expectancy at the time of death.
For an annual discount rate
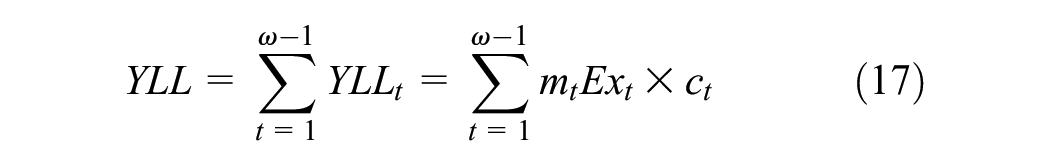
Similarly, YLLs are calculated as

It is important to note that the discounting shown in equation 4 and equation 5 yields the present value of YLD and YLL outcomes at a single point in time when the duration of disease (
Overview of the Decision Problem
We build on an existing progressive disease model in which healthy individuals develop a disease with 2 health states (“sick” and “sicker”). 4 Individuals can also transition to an absorbing death state due to causes unrelated to the disease (i.e., “background” mortality) or due to disease-specific causes.
We consider outcomes under 4 strategies:
A standard-of-care strategy based on the baseline model parameters
Strategy A, which improves the quality of life among individuals with the disease but does not affect disease progression
Strategy B, which reduces the rate of progression from sick to sicker by 40%
Composite strategy AB, which implements strategies A and B independently and concurrently
A state transition diagram is shown in Figure 1. In the figure, nodes are health states and edges depict transitions among them. Edge labels are defined in terms of transition intensities (rates). Other key model parameters are summarized in Table 1.
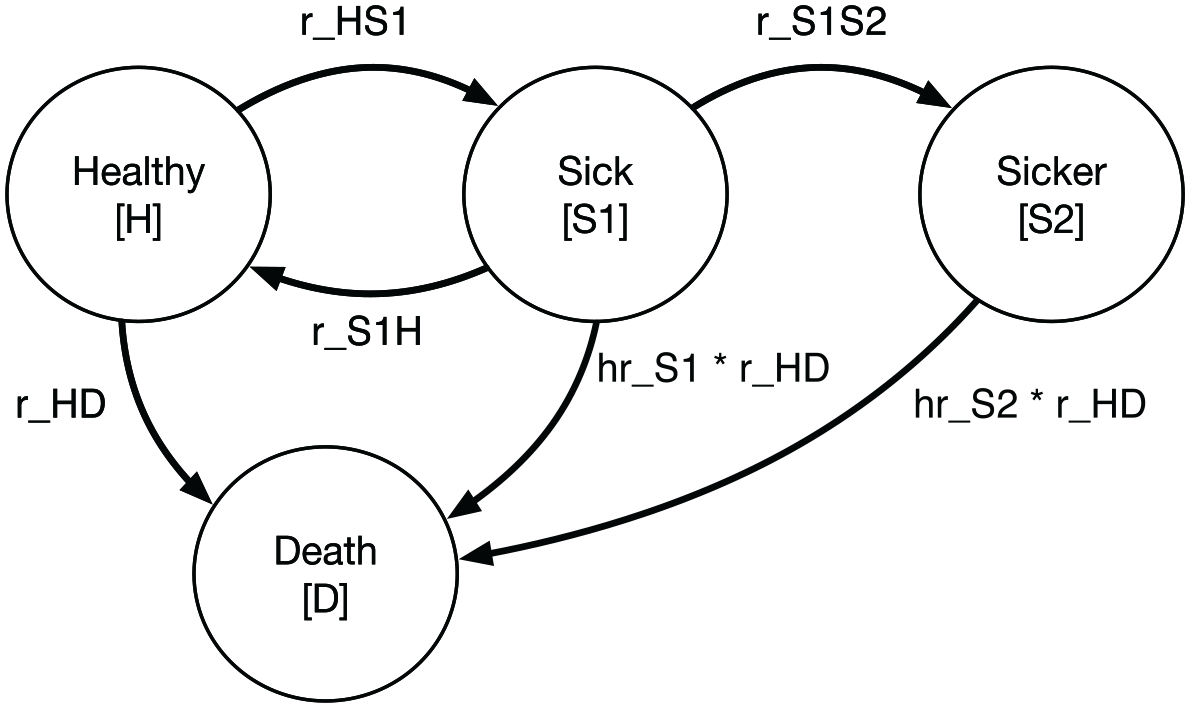
State transition diagram for the progressive disease model.
Model Parameters
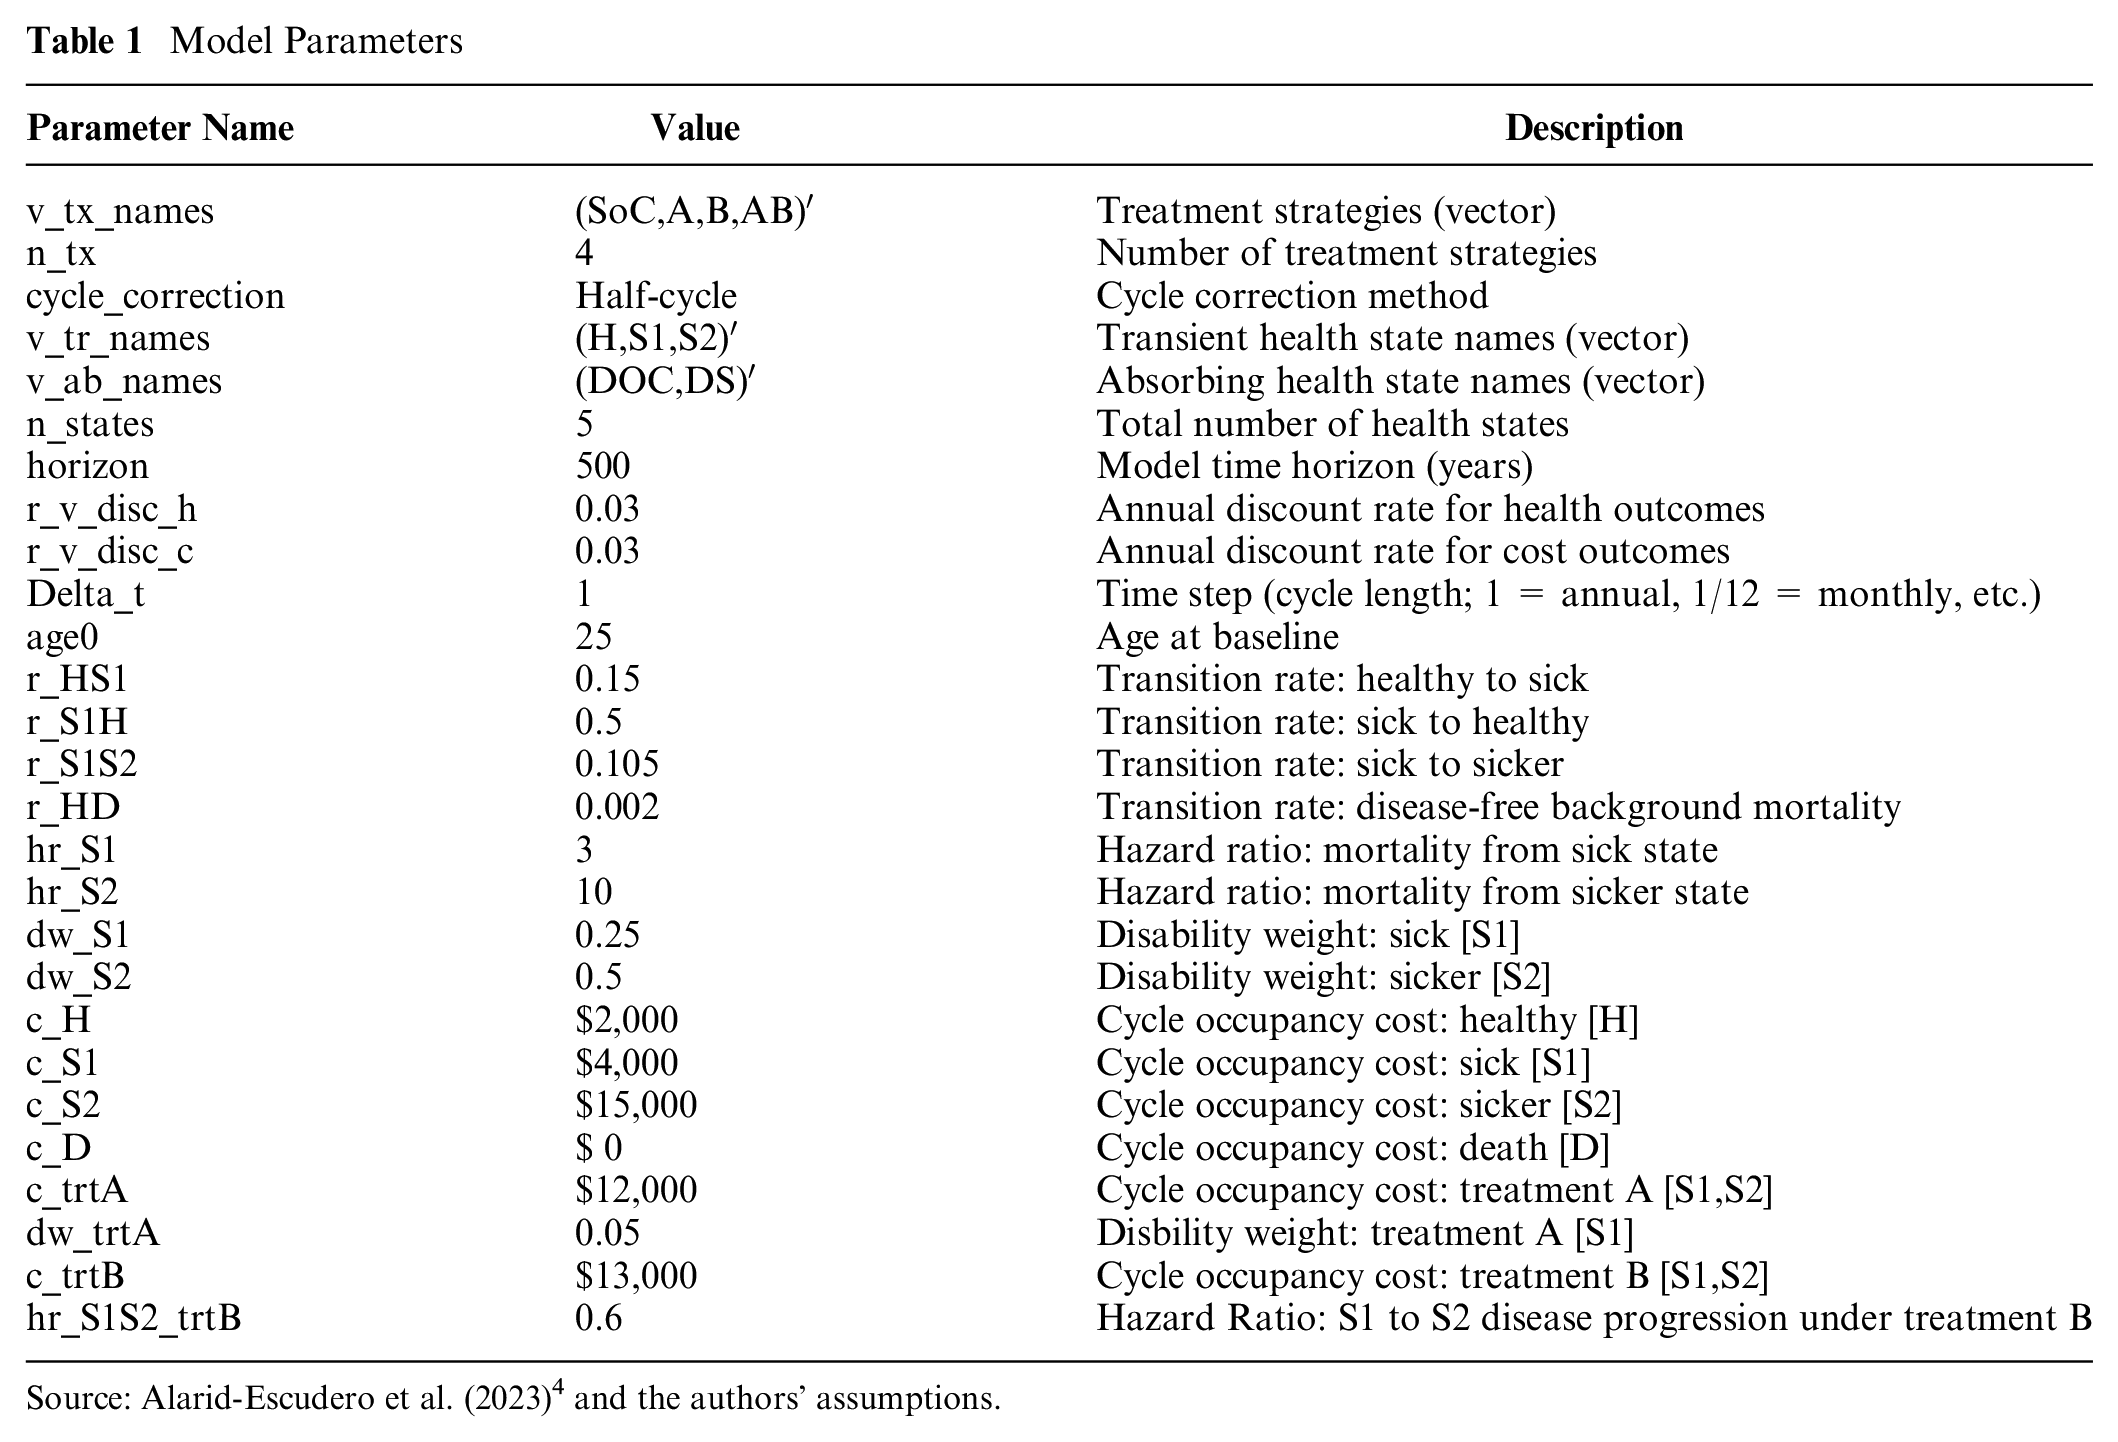
Source: Alarid-Escudero et al. (2023) 4 and the authors’ assumptions.
As depicted in Figure 1, the underlying Markov model is time homogeneous; that is, transition rates do not vary as a function of age/time. This is merely a simplification that builds on an existing time-homogeneous model constructed for didactic purposes.
4
We do, however, index all formulas and other model-relevant objects with the subscript
Methods
Transition Matrices
With the model parameterized, we next define the matrices that govern transitions. The state transition diagram represented in Figure 1 is not yet well-suited to calculate DALY outcomes, however. A primary reason is that transitions to the absorbing death state capture transitions due to all causes of death. To calculate YLLs, we must separately track the timing and number of deaths due to disease.
To accommodate this need, we developed 2 approaches for modeling DALY outcomes. We categorize each based on the level of experience and skill required:
Approach 1 (beginner): Separate death state: redefine the health states to include a separate cause-specific death state, as depicted in Figure 2. iii We then construct a Markov trace tracking state occupancy in each cycle and use changes in the number of cause-specific deaths across cycles to calculate YLLs.
Approach 2 (intermediate): Non-Markovian trackers: Augment the transition matrices to include a non-Markovian transition state for cause-specific deaths. This approach allows for efficient calculation of YLD, YLL, and DALY outcomes (often useful for microsimulation or probabilistic sensitivity analyses) because it sidesteps the need to derive a Markov trace.
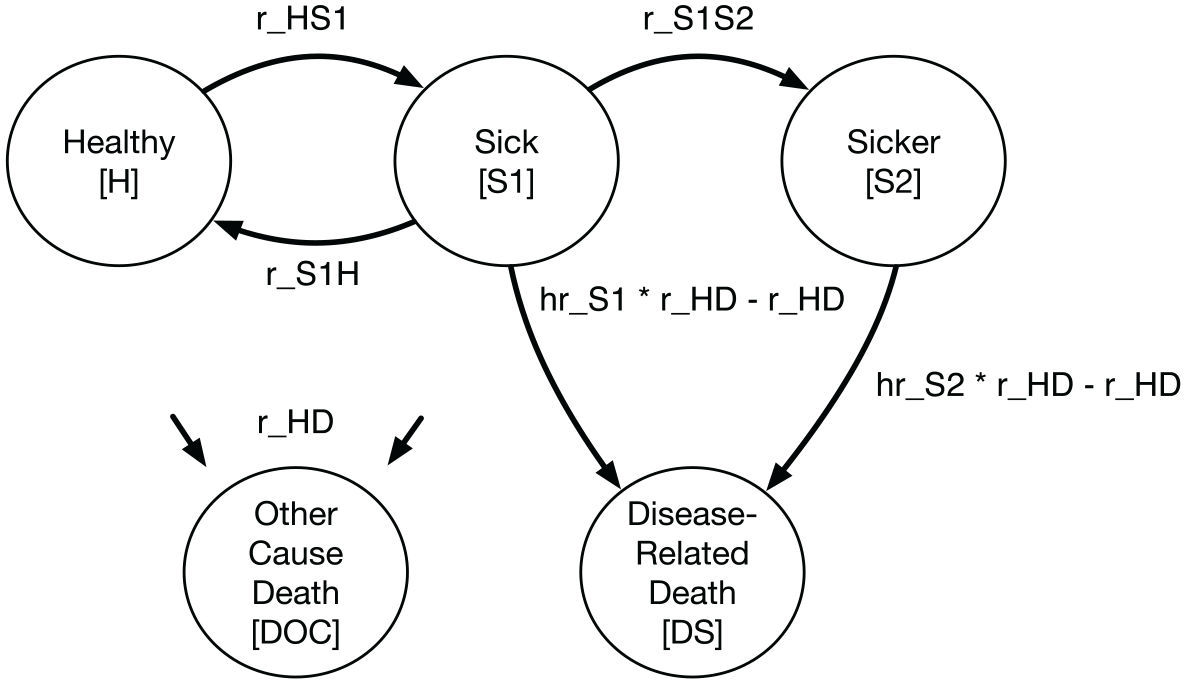
State transition diagram for progressive disease model with separate cause-specific death state.
Each approach facilitates the design and execution of a decision-analytic model that correctly calculates YLD, YLL, and DALY outcomes as well as other common outcomes such as life-years, QALYs, and costs. In practice, approaches 1 and 2 will produce identical results. We show in Results section that other shortcut-based approaches previously used in the literature, such as modeling a QALY-like DALY and/or accumulating time in the absorbing death state, will not in general yield similar results.
Beginner approach 1: Cause-specific death state
Under this approach, we separate deaths from disease versus other causes by defining a separate health state for cause-specific mortality; Figure 2 shows an updated state transition diagram.
Transitions among health states are defined in terms of continuous rates (“intensities”) and are captured within an intensity matrix
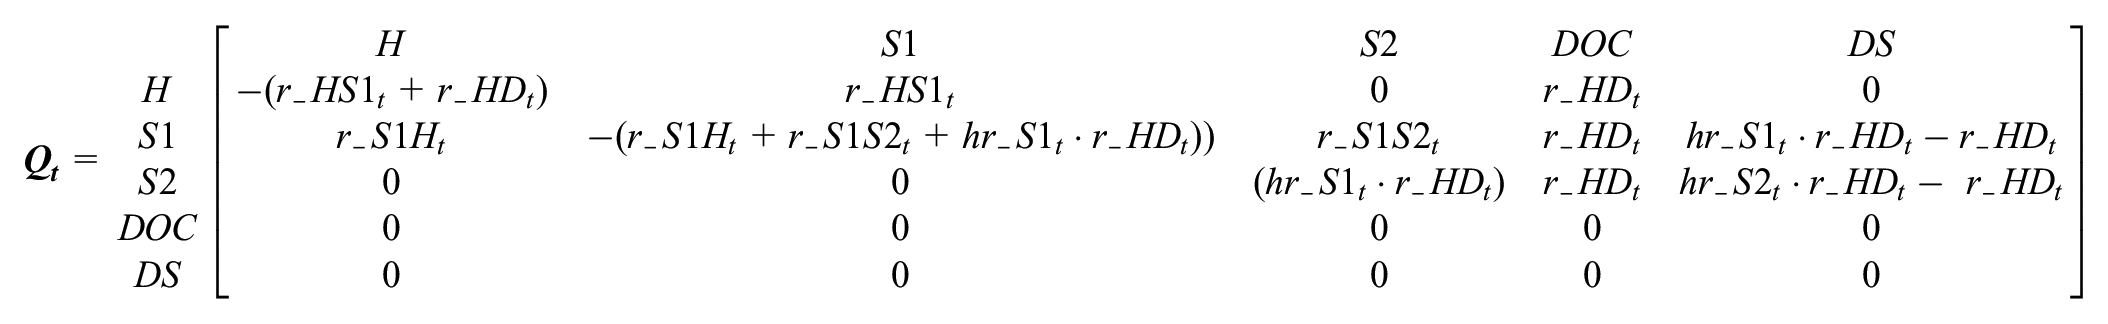
Cell values in row
We next embed the transition intensity matrix into a discrete time transition probability matrix by taking the matrix exponential of

Embedding the sick-sicker model results in a transition probability matrix
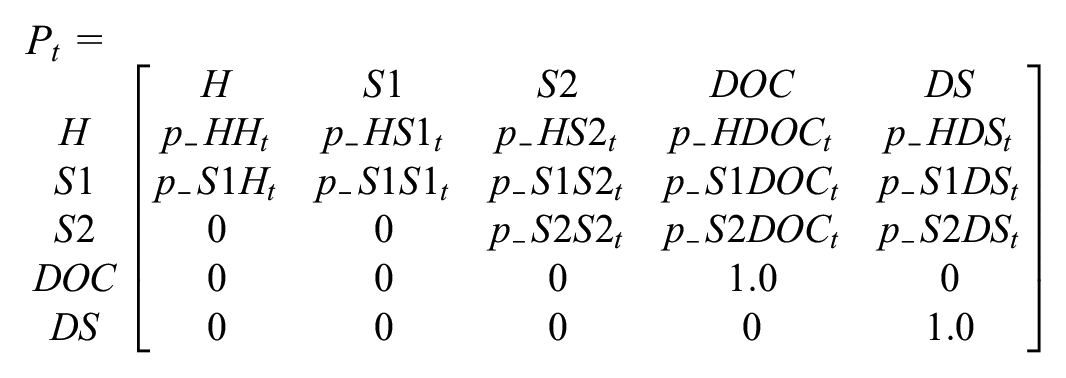
Embedding the transition probability matrix using equation 6 ensures that the resulting transition probabilities capture the underlying continuous-time disease process. In particular,
Intermediate approach 2: Non-Markovian tracking states
This method maintains the overall structure as depicted in the original Figure 1 but augments the transition probability matrix with non-Markovian components to facilitate accounting of disease-related deaths. vi Approach 2 offers a more generalized method that allows practitioners to accurately account for costs and/or health payoffs (such as YLLs) that are defined by transitions among health states rather than occupancy in a health state. DALY outcomes can also be calculated directly, without the need to derive a vector of disease-related death transitions from the Markov trace (as required for approach 1).
Figure 3 shows a state transition diagram with the tracking state added. The tracking state (shown as red nodes) simply records transitions as cohort members move from either diseased state to the absorbing death state due to causes related to the disease.
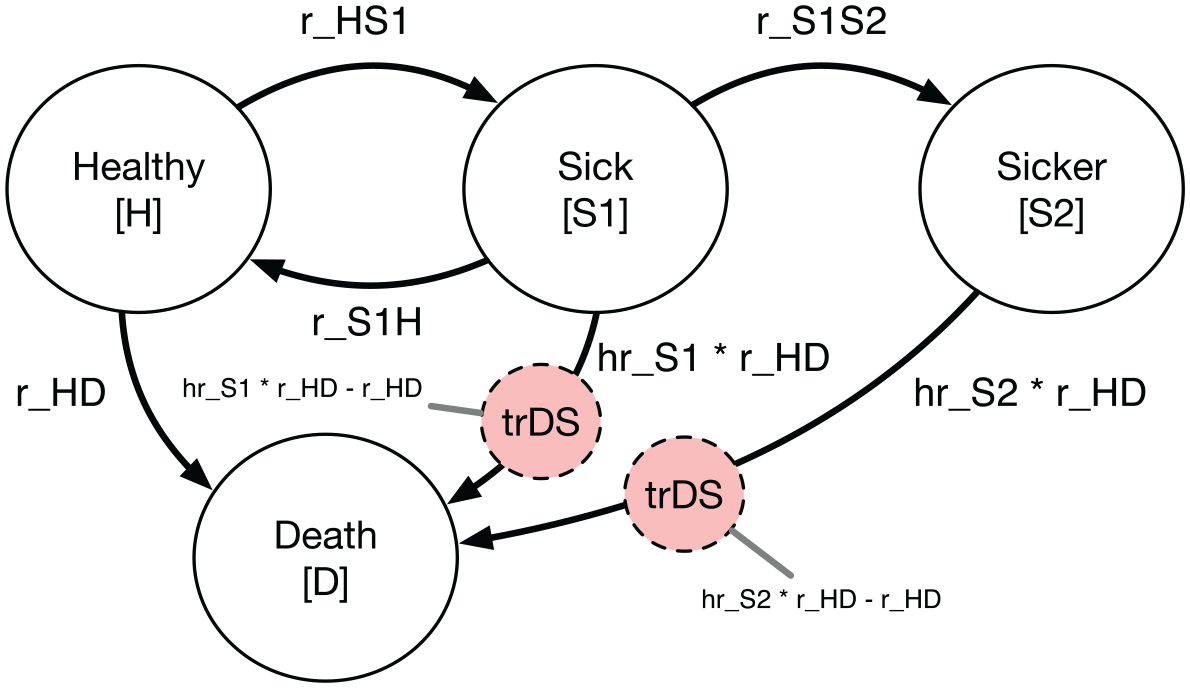
State transition diagram with transition state in red.
In general, tracking states can either count the total number of transitions that have occurred up to a given cycle (i.e., an “accumulator” state) or track the total number of new transitions that occur within a single cycle (i.e., a “transition” state). vii To calculate YLL outcomes, we will add a transition state that records the total number of new disease-related deaths in each cycle.
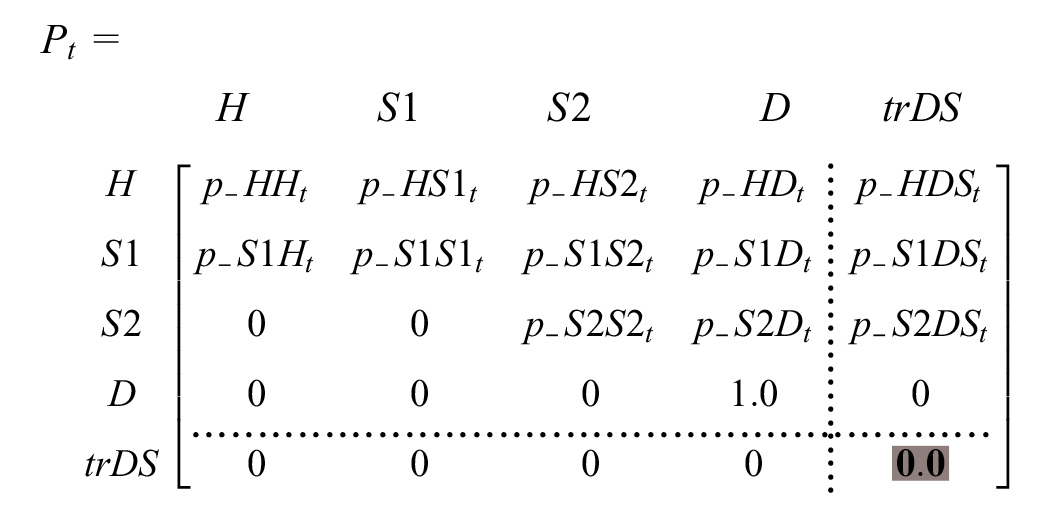
To implement approach 2, we add a transition state row and column to the transition intensity matrix. This transition state, called
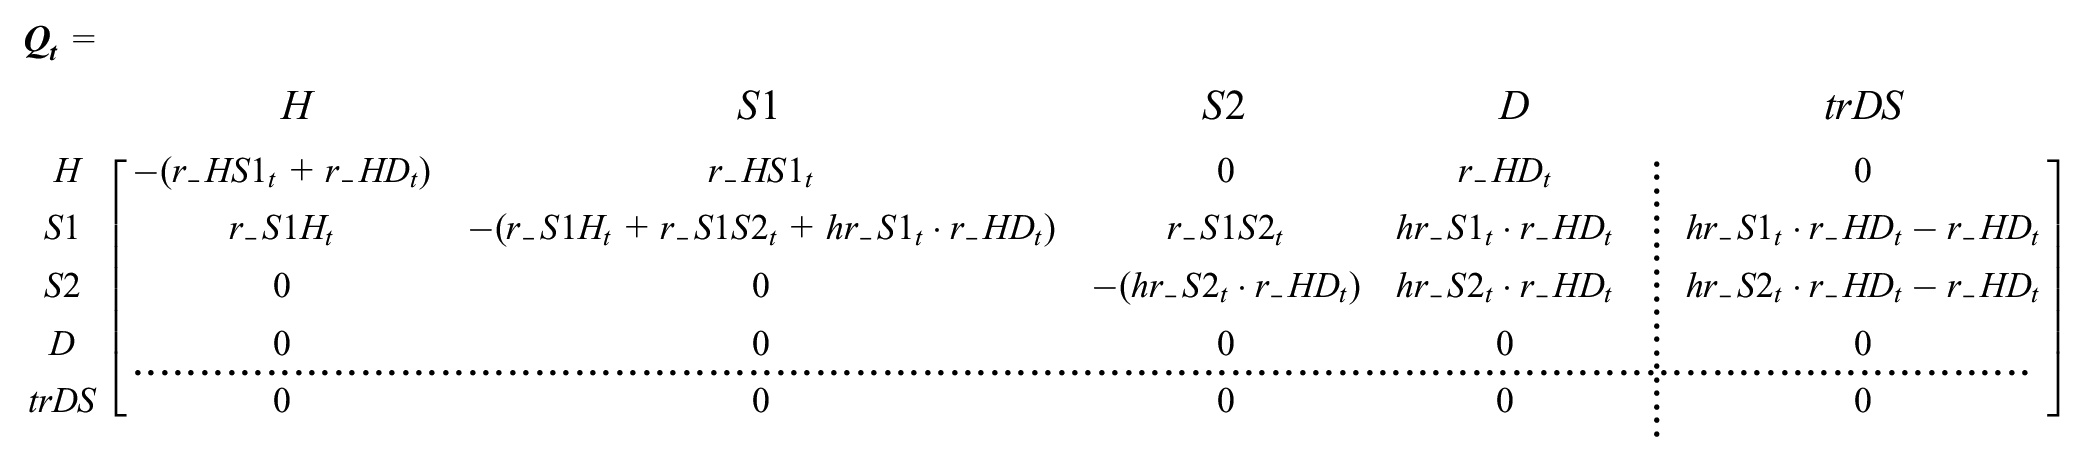
Two aspects of
Second, 2 transition intensities—from the S1 (sick) and S2 (sicker) states to death—appear in the tracking column. This ensures that
As above, we obtain the transition probability matrix by embedding
To change
Outcomes
We next define formulas for estimating outcomes. Our 2 approaches differ in how outcomes are calculated. Approach 1 requires a Markov trace that tracks occupancy in each cycle; for YLL outcomes, we use this information to calculate the number of new disease-related deaths in each cycle. Approach 2 does not require this extra step, as both cycle-specific and total outcomes are calculated directly.
Markov trace
YLL outcomes calculated under approach 1 require a Markov trace or a matrix summarizing occupancy in each health state in each cycle. Define

where
We apply equation 7 at each cycle to construct a Markov trace
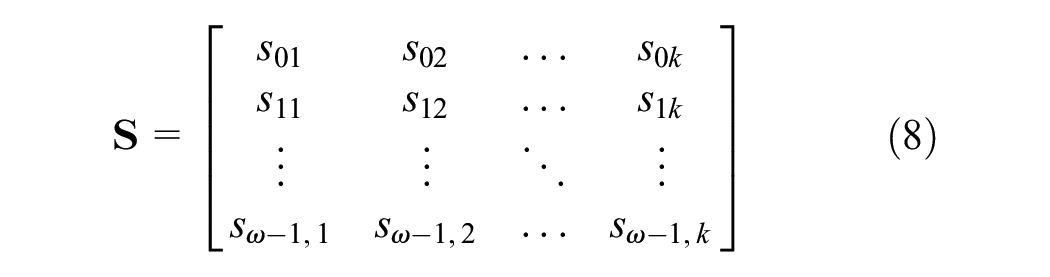
where each row represents state occupancy at time
Note that the rows in
YLD
To calculate YLDs, we define a
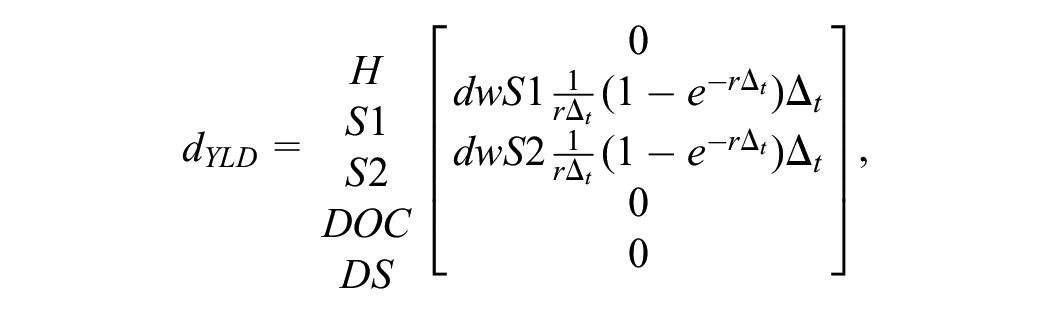
where

where
In the YLD payoff vector, the term
To fully discount outcomes, we still must discount all future outcome values back to baseline (

Total discounted YLDs are obtained by summing cycle-specific discounted YLD outcomes:

We can incorporate additional cycle adjustments (e.g., half-cycle adjustment or an adjustment based on Simpson’s rule) by defining an adjustment factor
where, at a minimum,
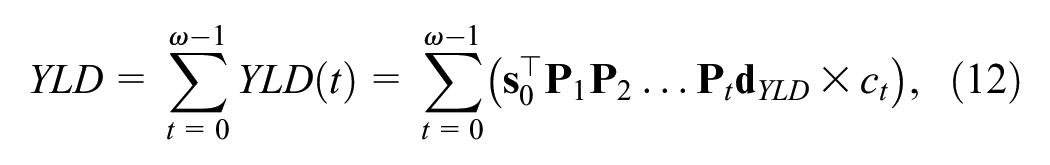
Finally, an equivalent way to calculate YLD outcomes is through matrix multiplication of the Markov trace matrix and the YLD payoff vector,

where
Years of life lost to disease (YLLs): approach 1
As noted in the Background section and equation 5, YLLs are based on the present value of remaining life expectancy among disease-related deaths. In a discrete time Markov model, these deaths may occur in any cycle, although, like YLDs, the fully discounted value is calculated relative to baseline (
Define

where
We next define
Following the GBD discounting approach,

where
To calculate YLLs, we use the Markov trace to calculate

The total discounted YLLs are given by
Years of life lost to disease (YLLs): approach 2
YLLs under approach 2 can be calculated in a similar way as YLDs, since we have augmented the model with a transition-tracking state that directly estimates new deaths in each cycle. Define the YLL payoff vector
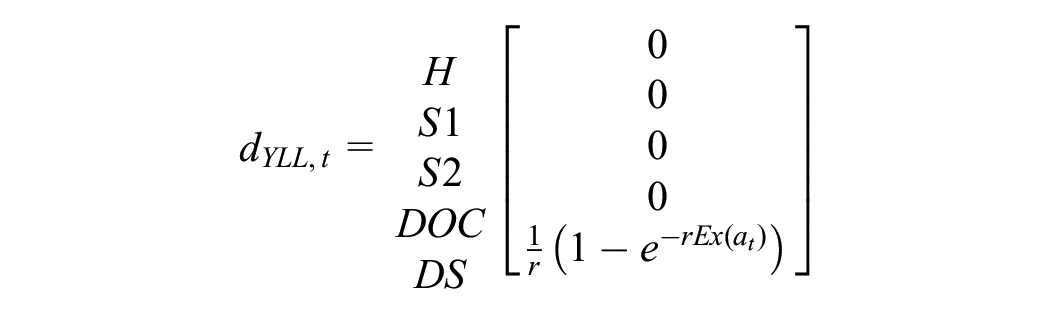
We can now apply similar equations as used for YLD outcomes to calculate fully discounted YLLs:
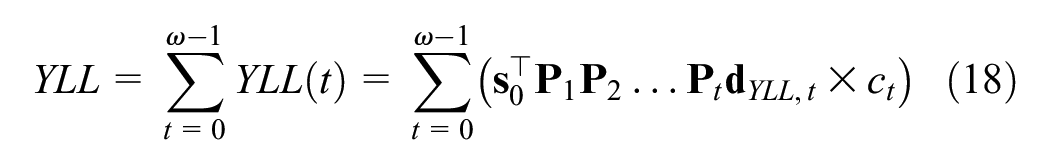
Alternatively, using the Markov trace, we stack each
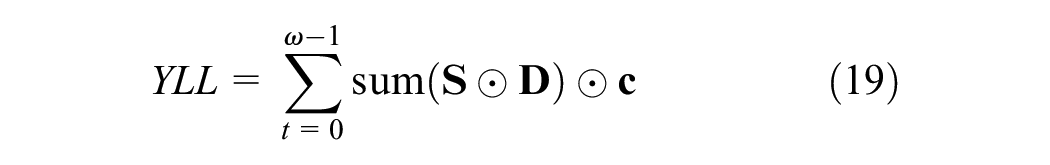
where the
DALY shortcut methods
We also consider 2 shortcut methods for estimating DALYs that researchers might use to simplify model calculations, both of which tend to overestimate the benefits of interventions. First, we execute a method that defines cycle payoffs based on the disability weight for the diseased health states and assigns a payoff value of 1.0 for cycles in the disease-related death state. This method accumulates time in the death state as an estimate of YLLs and is included in the TreeAge Pro software package as a template/example for calculating DALYs. xii
Second, we consider a simpler QALY-like DALY method. This approach defines the cycle occupancy payoff for the sick and sicker states as 1 minus the disability weight. As is common practice, under this method the healthy state receives a payoff value of 1.0, while the death state receives a value of 0.0.
Results
Comparison of DALY Outcomes under All 3 Approaches
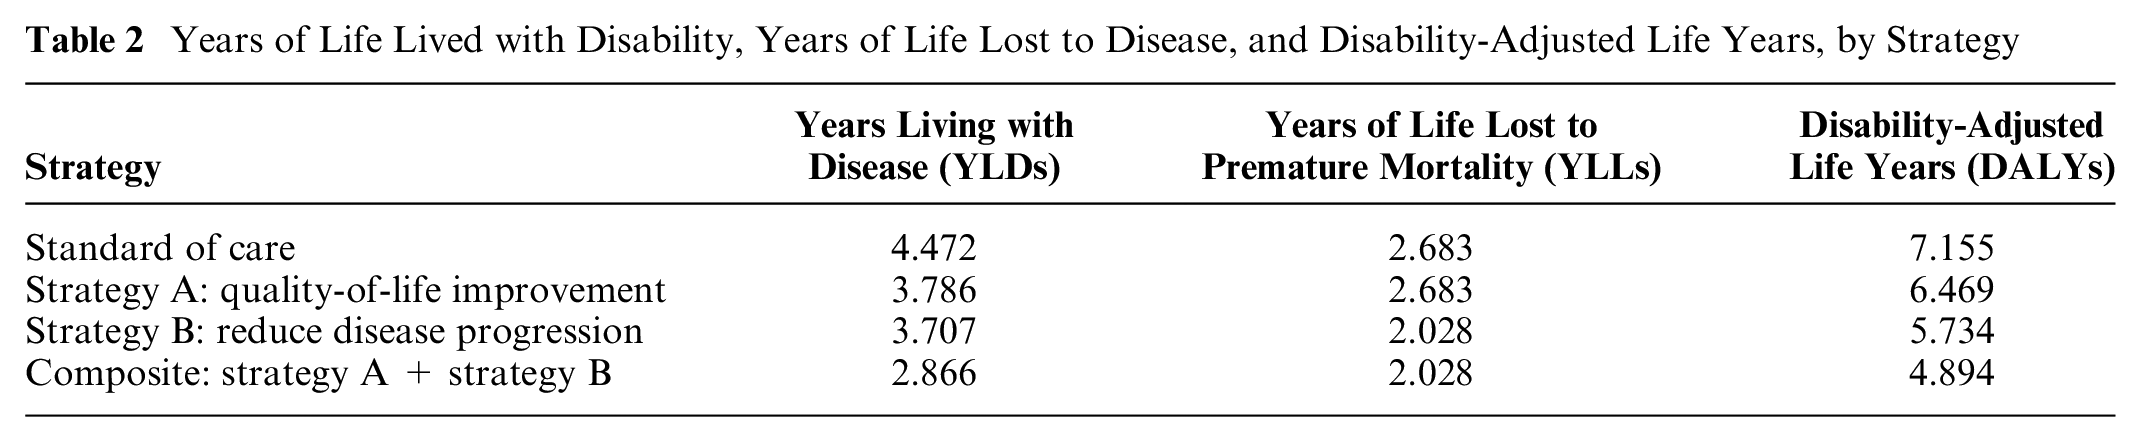
Table 2 draws on the sick-sicker model parameters and shows YLD, YLL, and DALY outcomes estimates. Note that because approaches 1 and 2 yield identical values, we present only 1 set of estimates in the table.
Years of Life Lived with Disability, Years of Life Lost to Disease, and Disability-Adjusted Life Years, by Strategy
Comparison with “Shortcut-Based” DALY Approaches
Table 3 reports cost, effect, and incremental cost-effectiveness ratio (ICER) results for our 2 DALY approaches. The table also includes results under 2 “shortcut” DALY strategies.
Comparison of Cost-Effectiveness Analysis Results
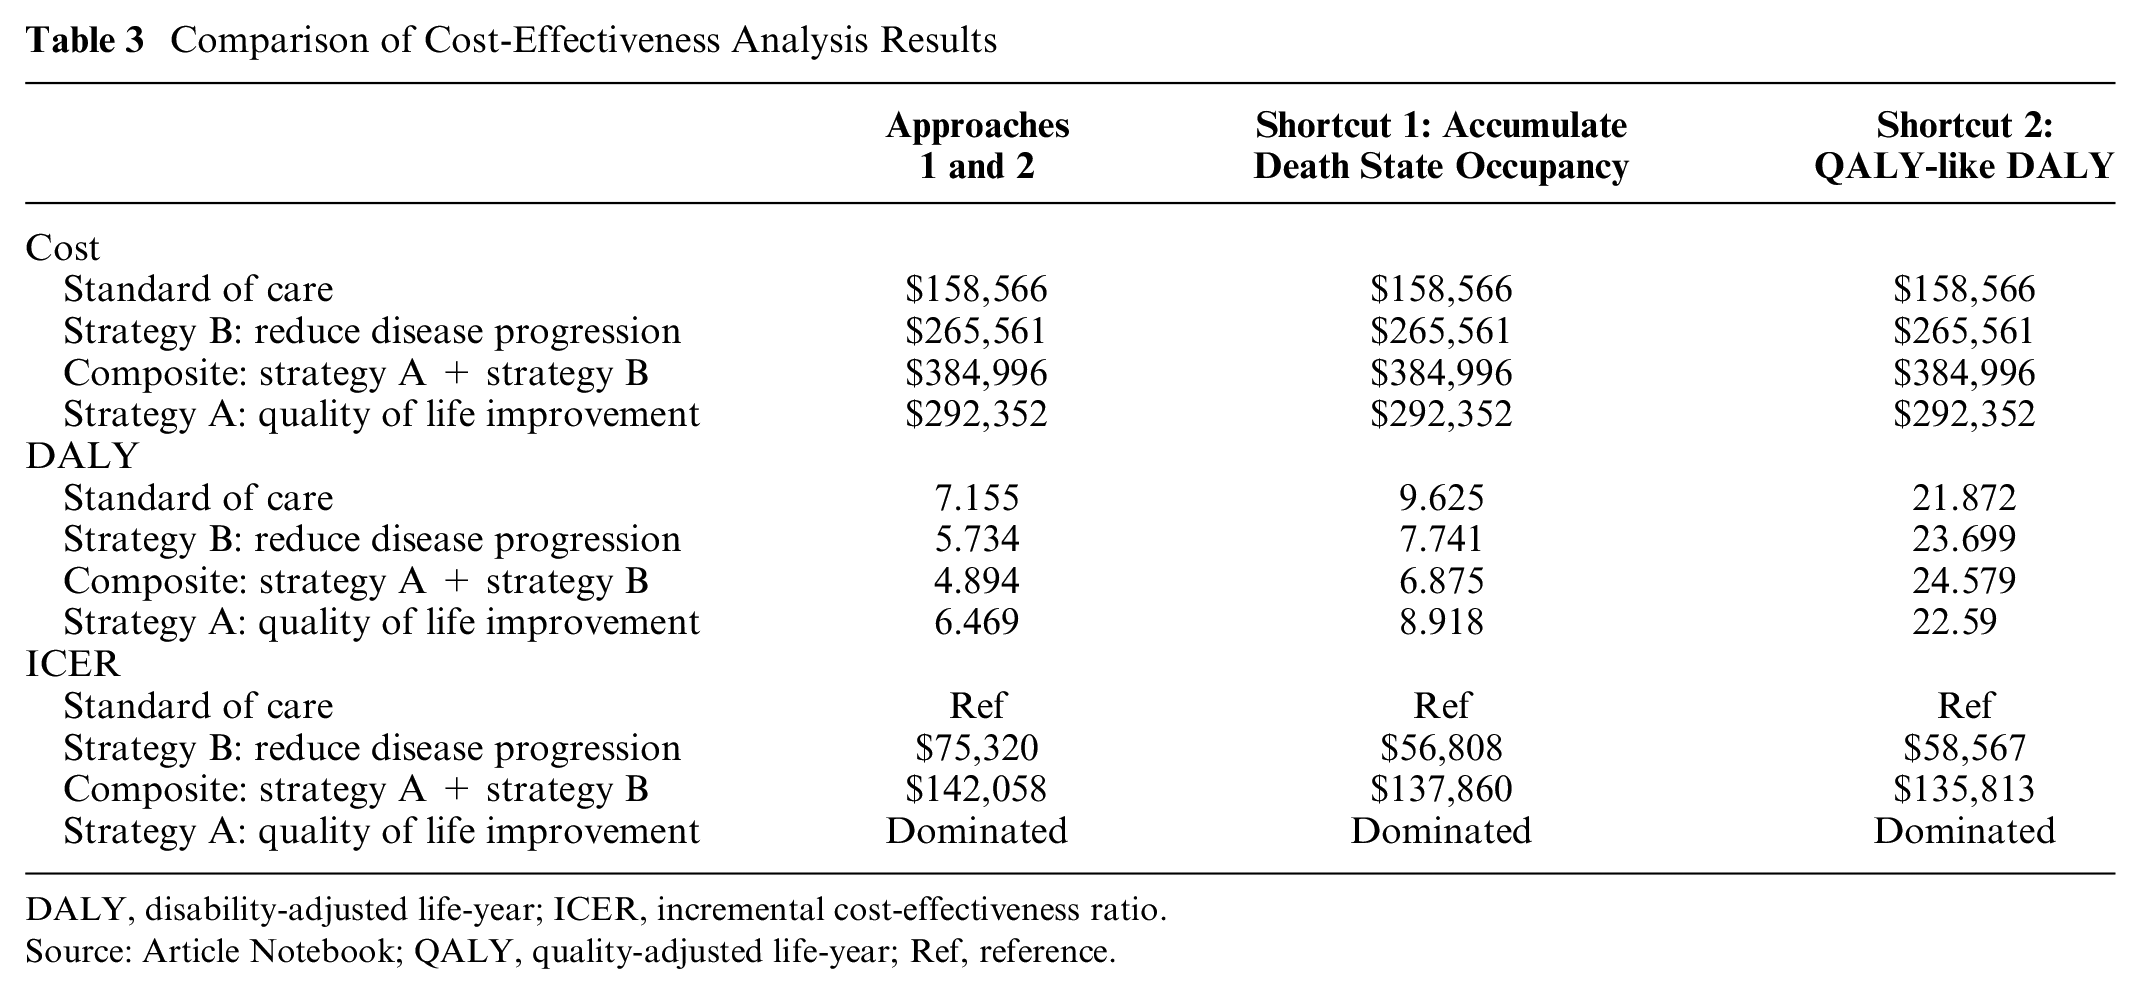
DALY, disability-adjusted life-year; ICER, incremental cost-effectiveness ratio.
Source: Article Notebook; QALY, quality-adjusted life-year; Ref, reference.
Table 3 also includes outcomes under alternative “shortcut”-based DALY estimation approaches. The death state occupancy method yields DALY estimates that are 34% higher than our approaches and results in an ICER that is 25% lower for strategy B versus the standard of care. The ICER for strategy AB is calculated relative to strategy B, so the only difference is the additional improvement in quality of life from strategy A. This improvement works exclusively through the YLD channel, as there is no differential effect on mortality. With this key information in mind, we note that the ICER for AB versus B is more similar between our approaches and the death state occupancy method.
QALY-like DALY estimates are, not surprisingly, higher than the other DALY estimates, owing to their conceptual difference with DALYs (i.e., QALYs accumulate and reward the quality and extension of life, while DALYs accumulate years lost to disease). Again, ICERs for strategy A versus the standard of care are about 25% lower, while they are very similar to our DALY approaches for the AB strategy that differentially improves quality of life.
Discussion
This study extends the methodological toolkit available to decision modelers by introducing 2 DALY estimation methods. Our approaches are designed to fit a spectrum of experience and skill, thus making our methods accessible to any practitioner who aims to include DALYs in their decision model. Our results demonstrate that both beginner and intermediate approaches yield similar values for DALY levels and ICERs in a progressive disease model constructed for didactic purposes. Finally, we also show that other shortcuts suggested for DALY outcomes do not in general yield similar results for either DALY levels or ICERs.
Our methods also extend to other common decision-modeling frameworks. For example, approach 2 directly estimates YLDs and YLLs in each cycle and can therefore be adapted to efficiently execute microsimulation models in which cycle transition probabilities depend on patient attributes or disease history. Discrete event simulation models, moreover, can apply the YLD and YLL equations provided (equation 5 and equation 4) to simulated time to death and duration of disease values.
A subset of our results yielded similar values when comparing DALY shortcuts to our DALY approaches, so it is useful to walk through the circumstances in which various approaches will be similar and differ. In general, DALY shortcut methods will be more accurate when YLDs dominate the DALY value. The reason is that our methods, as well as standard (“QALY-like”) methods, apply identical payoff weights to occupancy in diseased states. The methods differ substantially, however, in how they handle deaths from disease—either by “rewarding” deaths endogenously over the model’s time horizon or by simplifying the penalty for premature death. Our methods mirror the GBD approach of penalizing a disease-related death by using an exogenous, age-specific remaining life expectancy value. Shortcut-based methods, by comparison, may accumulate time in the disease-related death state—thus, the payoffs are determined endogenously within the model. Moreover, because a payoff value is applied to an absorbing state, results under this shortcut approach will be highly sensitive to the time horizon in a model. That is, “YLLs” could continue to accumulate for the remaining time horizon even after all cohort members have died. This will not greatly affect ICER calculations that make comparisons across strategies but will yield inaccurate DALY levels in a modeled population.
Another important consideration is the role of discounting. Our approaches apply a continuous-time discounting approach to maintain consistency with the GBD assumption that remaining life expectancy accrues as a continuous “flow” of health. This manifests in our approaches through the use of a cycle-specific discount factor (
Finally, it is important to note that the methods outlined here are not purely restricted to DALY outcomes. Indeed, each approach facilitates the estimation of other common outcomes such as QALYs, life-years, and so forth.
Supplemental Material
sj-pdf-2-mdm-10.1177_0272989X251340077 – Supplemental material for Modeling Disability-Adjusted Life-Years for Policy and Decision Analysis
Supplemental material, sj-pdf-2-mdm-10.1177_0272989X251340077 for Modeling Disability-Adjusted Life-Years for Policy and Decision Analysis by Ashley A. Leech, Jinyi Zhu, Hannah Peterson, Marie H. Martin, Grace Ratcliff, Shawn Garbett and John A. Graves in Medical Decision Making
Supplemental Material
sj-qmd-1-mdm-10.1177_0272989X251340077 – Supplemental material for Modeling Disability-Adjusted Life-Years for Policy and Decision Analysis
Supplemental material, sj-qmd-1-mdm-10.1177_0272989X251340077 for Modeling Disability-Adjusted Life-Years for Policy and Decision Analysis by Ashley A. Leech, Jinyi Zhu, Hannah Peterson, Marie H. Martin, Grace Ratcliff, Shawn Garbett and John A. Graves in Medical Decision Making
Supplemental Material
sj-xlsm-3-mdm-10.1177_0272989X251340077 – Supplemental material for Modeling Disability-Adjusted Life-Years for Policy and Decision Analysis
Supplemental material, sj-xlsm-3-mdm-10.1177_0272989X251340077 for Modeling Disability-Adjusted Life-Years for Policy and Decision Analysis by Ashley A. Leech, Jinyi Zhu, Hannah Peterson, Marie H. Martin, Grace Ratcliff, Shawn Garbett and John A. Graves in Medical Decision Making
Footnotes
Acknowledgements
We graciously acknowledged the support for this work from the Data to Policy program administered by Vital Strategies and the CDC Foundation with funding from the Bloomberg Philanthropies Data for Health Initiative. We thank Emily Myers (Vital Strategies), Chandra Dhakal (CDC Foundation), Andrew Ancharski (CDC Foundation), as well as workshop participants at the 2023 International Health Economics Association for their support and engagement on this work.
The authors declared no potential conflicts of interest with respect to the research, authorship, and/or publication of this article. The authors disclosed receipt of the following financial support for the research, authorship, and/or publication of this article: Support for this work is graciously acknowledged from the Data to Policy program administered by Vital Strategies and the CDC Foundation with funding from the Bloomberg Philanthropies Data for Health Initiative.
Ethical Considerations
Our study was exempt from institutional review board review because it used simulated data, which do not involve human subjects or identifiable personal information. The simulated data were generated solely for research purposes, ensuring that no real individuals were involved and no sensitive data were used.
Consent to Participate,Patient Consent,and Consent for Publication
Not applicable as our study relied exclusively on simulated data and did not recruit human or animal participants.
Data Availability
Notes
References
Supplementary Material
Please find the following supplemental material available below.
For Open Access articles published under a Creative Commons License, all supplemental material carries the same license as the article it is associated with.
For non-Open Access articles published, all supplemental material carries a non-exclusive license, and permission requests for re-use of supplemental material or any part of supplemental material shall be sent directly to the copyright owner as specified in the copyright notice associated with the article.