
Abstract
Introduction
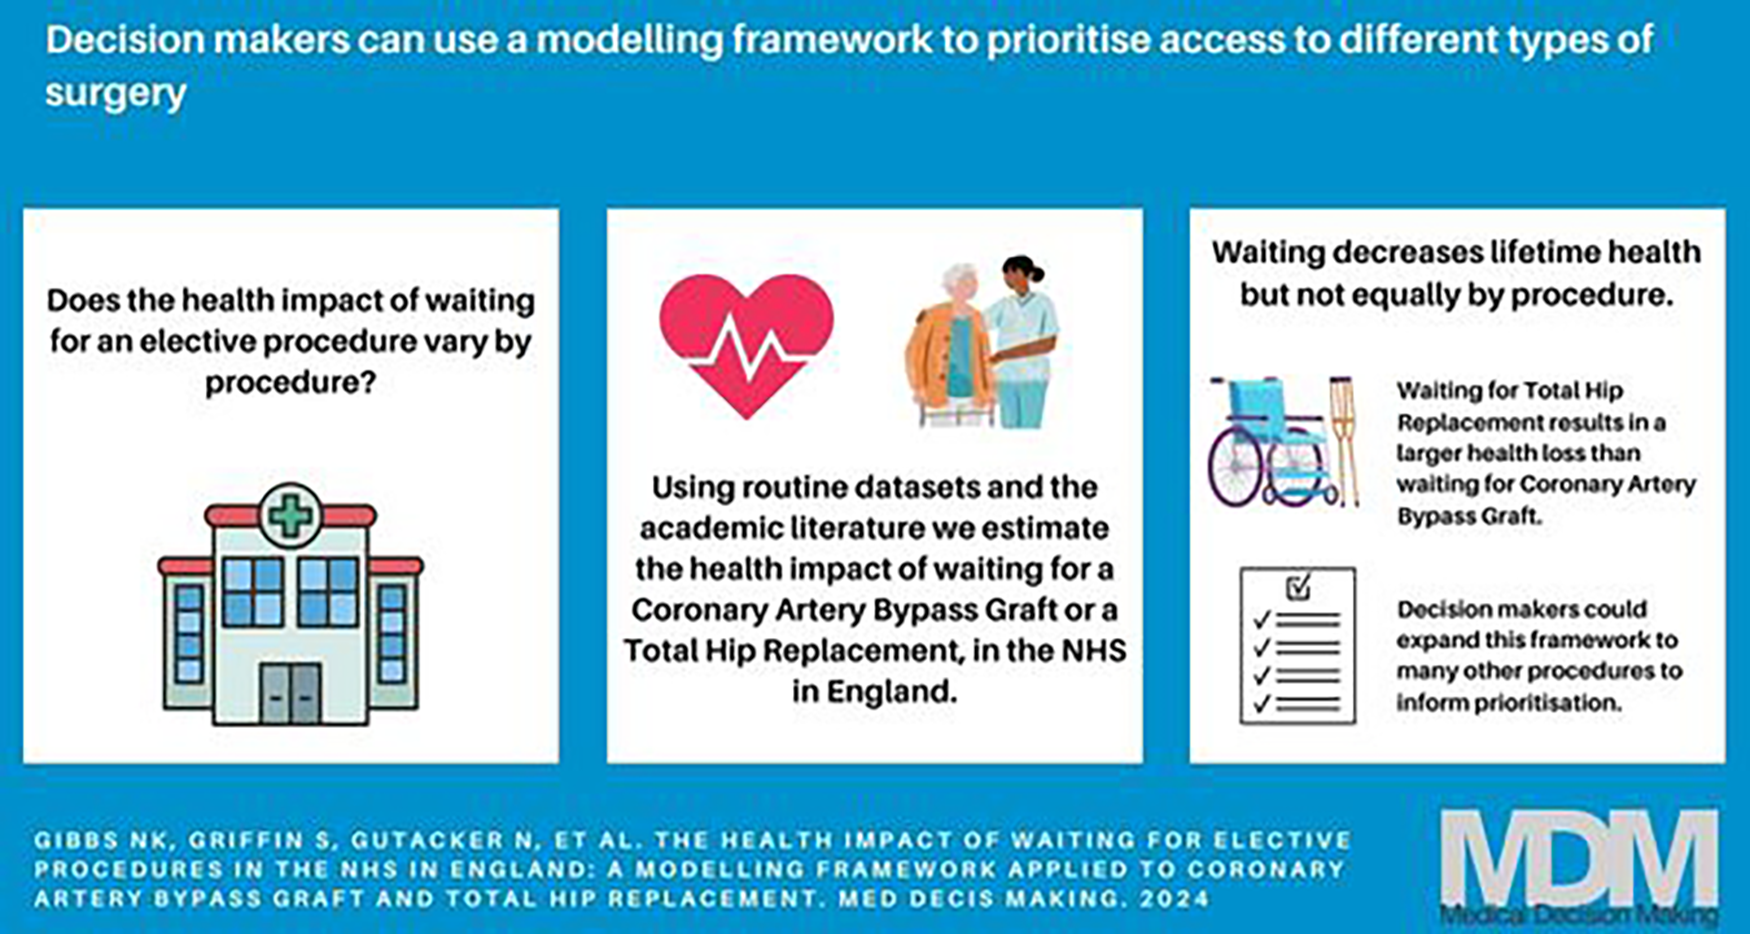
The aim of this study is to demonstrate a practical framework that can be applied to estimate the health impact of changes in waiting times across a range of elective procedures in the National Health Service (NHS) in England. We apply this framework by modeling 2 procedures: coronary artery bypass graft (CABG) and total hip replacement (THR).
Methods
We built a Markov model capturing health pre- and postprocedure, including the possibility of exiting preprocedure to acute NHS care or self-funded private care. We estimate the change in quality-adjusted life-years (QALYs) over a lifetime horizon for 10 subgroups defined by sex and Index of Multiple Deprivation quintile groups and for 7 alternative scenarios. We include 18 wk as a baseline waiting time consistent with current NHS policy. The model was populated with data from routinely collected data sets where possible (Hospital Episode Statistics, Patient-Reported Outcome Measures, and Office for National Statistics Mortality records), supplemented by the academic literature.
Results
Compared with 18 wk, increasing the wait time to 36 wk resulted in a mean discounted QALY loss in the range of 0.034 to 0.043 for CABG and 0.193 to 0.291 for THR. The QALY impact of longer NHS waits was greater for those living in more deprived areas, partly as fewer patients switch to private care.
Discussion/Conclusion
The proposed framework was applied to 2 different procedures and patient populations. If applied to an expanded group of procedures, it could provide decision makers with information to inform prioritization of waiting lists. There are a number of limitations in routine data on waiting for elective procedures, primarily the lack of information on people still waiting.
Highlights
We present a modeling framework that allows for an estimation of the health impact (measured in quality-adjusted life-years) of waiting for elective procedures in the NHS in England.
We apply our model to waiting for coronary artery bypass graft (CABG) and total hip replacement (THR). Increasing the wait for THR results in a larger health loss than an equivalent increase in wait for CABG.
This model could potentially be used to estimate the impact across an expanded group of procedures to inform prioritization of activities to reduce waiting times.
During the COVID-19 pandemic, there was a substantial reduction in elective activity in English National Health Service (NHS) hospitals (a publicly funded health system) due to hospitals canceling scheduled treatments to create capacity for the surge in COVID-19 patients and due to patients avoiding care. Added to the previous upward trend in waiting lists, the backlog of patients with unmet needs is growing, and as a result, waiting lists have reached historically high levels.1,2
The English NHS has operated a universal waiting time target of 18 wk from referral to procedure for most elective procedures (with a few exceptions, such as cancer surgery). 3 However, this approach fails to reflect the different health effects of delaying different types of elective care. If patients vary in the benefits they obtain from more rapid access to elective procedures, a targeted waiting time policy that sets different maximum waiting times for different elective interventions could potentially improve population health. It could also inform prioritization of recovery efforts in response to shocks such as the COVID-19 pandemic.
To inform such a policy would require quantifying the overall health consequences of waiting across procedures and, if it formed part of a decision maker’s objective function, illustrating the differential impact by equity relevant characteristics. The NHS elective recovery plans following COVID-19 explicitly highlight the need to prioritize patients from the most deprived groups in order to address health inequalities. 4 We previously presented a modeling framework to meet this evidence gap, estimating the combined mortality and morbidity impacts of waiting. 5 This framework captures the exit to other forms of care including self-funded private treatment and acute (emergency rather than planned) NHS care. It also has the flexibility to incorporate changing health-related quality of life while waiting and the impact of waiting on health-related quality of life postprocedure. It was developed with the pragmatic intention that the model be populated, where possible, by routinely collected data, so that it does not require further primary research to implement or update.
In this article, we apply this previously published framework 5 to 2 elective procedures and outline the resulting model structure before detailing how the parameters are estimated. The ability to source data to populate the model for different procedures forms an important part of understanding the feasibility of this modeling approach. To explore this, we consider 2 specific procedures: coronary artery bypass graft (CABG) and total hip replacement (THR), purposely chosen as high-volume procedures, one of which has a mortality and morbidity impact and the other only morbidity. We present the results and implications before discussing evidence gaps and potential next steps in the research.
Methods
Overview
The aim of this analysis is to estimate the health impact of changes in waiting times for 2 elective procedures in the NHS in England and to see if this differs across people receiving the procedure according to their sex or deprivation level, measured in terms of Index of Multiple Deprivation (IMD) quintile group, of where they live. The model has been used to estimate the health impact of changes in waiting times for 1) individuals requiring CABG and 2) individuals requiring THR. Outcomes are measured in quality-adjusted life-years (QALYs). The model runs until patients are 101 y to capture lifetime impacts, and QALYs are discounted at 3.5% per annum in line with UK methods guidance. 6
Model Structure
Our model is based on a framework for estimating the health impact of changes in waiting times. 5 A schematic of the model and full description is provided below (Figure 1).
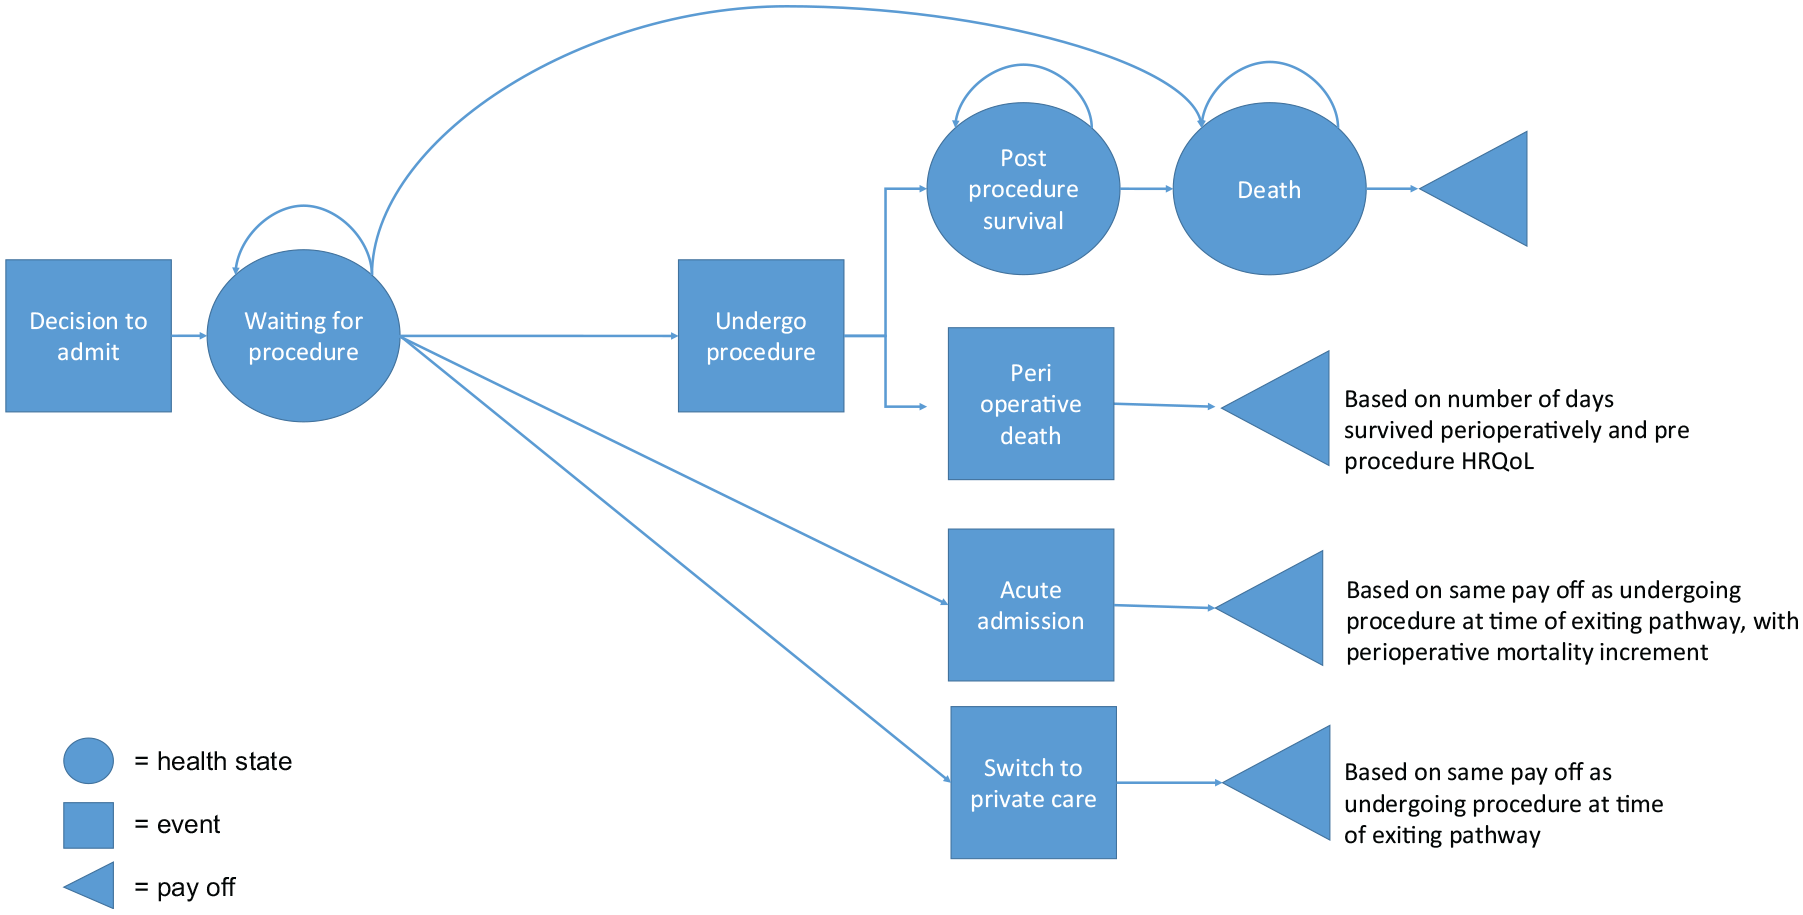
Model schematic
All patients enter the model on the waiting list. While waiting, they are at risk of preprocedure mortality. Patients can exit the list while waiting either due to an acute admission (assumed to be for the same procedure) or to receive self-funded (either via private insurance or out of pocket) health care from a private provider. All patients who remain in the “waiting for procedure” state receive the elective procedure at a fixed time point (which is varied to estimate the impact of changes in waiting time), then move to the postprocedure state, subject to a perioperative risk. They remain in the postprocedure state until they die. Patients who exit the waiting list to undergo self-funded private elective procedures experience the same mortality risks as patients undergoing NHS elective procedures. Patients who exit the waiting list for acute admissions are subject to higher perioperative mortality risk, but thereafter the same postprocedure risks are assumed, due to lack of evidence to the contrary.
Health-related quality of life (HRQoL) for “waiting for procedure,”“postprocedure survival,” and “death” states at each cycle is multiplied by the population in that state for that cycle to calculate QALYs. HRQoL improves following the procedure but decreases with age. For patients who die perioperatively (classed as within 30 d of the procedure), their QALYs postprocedure are the expectation of the number of days they live postoperatively and the HRQoL preprocedure, as we assume they do not realize the health benefit of the procedure. Payoffs for those who exit to acute or private admission while waiting for the procedure are estimated separately. For each specific day of exiting the list, the perioperative mortality is estimated and the corresponding days survived if the patient dies perioperatively. If patients exiting to acute or private care do not die perioperatively, they proceed to the postprocedure survival state and are followed for their remaining lifetime.
Parameter Estimates
Where possible, parameters were estimated on the same basis for CABG and THR to meet a key aim: to develop a framework that uses the same sources of data and same estimation approaches across multiple procedures. This article focuses on using Hospital Episode Statistics (HES) data, Office of National Statistics (ONS) data, and Patient-Reported Outcome Measures (PROMs) data to populate the model as far as possible. Details of these data sets are given in the Supplementary Material. However, the data available to estimate parameters using these data sets vary between procedures. Where PROMs data are available alongside HES data (as it is for THR), we considered it preferable to use these data given they are consistent with the data used for other parameters. Where PROMs data are not available (as for CABG), we based the parameters on targeted nonsystematic searches of the literature. For example, for clinical CABG parameters, we started with a recent systematic review by Duarte et al. 7 and checked every included study for relevance. We then used forward and backward citation searching on the most relevant studies to broaden the search. For other parameters, we searched Google Scholar using appropriate terms; for example, we searched for the quality-of-life decrement while waiting for CABG using the terms “Coronary Artery Bypass Graft” OR “CABG,” AND “quality of life,” OR “health” AND “wait*.”
Patient characteristics
The key demographic variables of the patients entering the models were based on all patients who received the elective procedure, funded by the NHS, between the start of April 2010 and end of March 2020, recorded in HES. We limited our study to patients residing in England. The variables included age, sex, Charlson Comorbidity Index i (measured at the point of elective procedure) and the IMD quintile group. The IMD ranks more than 30,000 small geographical areas in England according to their overall level of deprivation informed by 7 domains: income, employment, education, health, crime, housing, and environment. 8 Ten distinct subgroups were created for each procedure, one for each combination of IMD quintile group and sex. The mean age, Charlson Comorbidity Index and waiting time were computed for each IMD-sex subgroup.
Mortality and effectiveness data
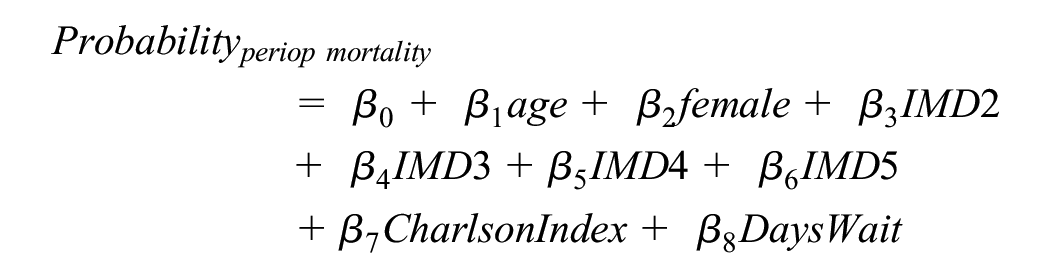
Perioperative mortality
Models were estimated using the sample of patients who underwent the procedure between 2010 and 2020 in the HES data set linked with ONS mortality data (April 2010 to March 2021). For CABG patients, we excluded all those who received concomitant heart valve or percutaneous coronary intervention procedures. Perioperative mortality (within 30 d postprocedure) was estimated using a logit model, which is a function of age at procedure, sex, IMD quintile group, Charlson Comorbidity Index, and days waiting for the procedure. These variables were a pragmatic choice of clinical and demographic characteristics available in the data, including those common to mortality estimation in the literature,9–11 and allowing for the model to be common across both procedures. The IMD quintile group was included as an important predictor of mortality that improves the estimation of overall health impact. It also enables the model to better disaggregate results by IMD quintile groups, which may be key information for decision makers (Table 1).
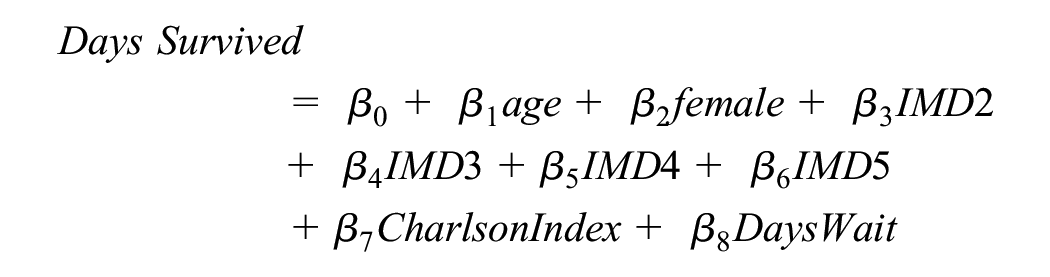
For patients predicted to die within 30 d of the elective procedure, the same covariates were then used in a linear regression to predict the number of days survived postoperatively.
CABG patients who exit to acute admission for the same procedure have increased perioperative mortality based on published estimates of the difference in mortality between those who have an elective versus emergency CABG. 12 Patients waiting for THR are assumed to not be at risk of an acute admission for THR.
Model Parameters for CABG and THR
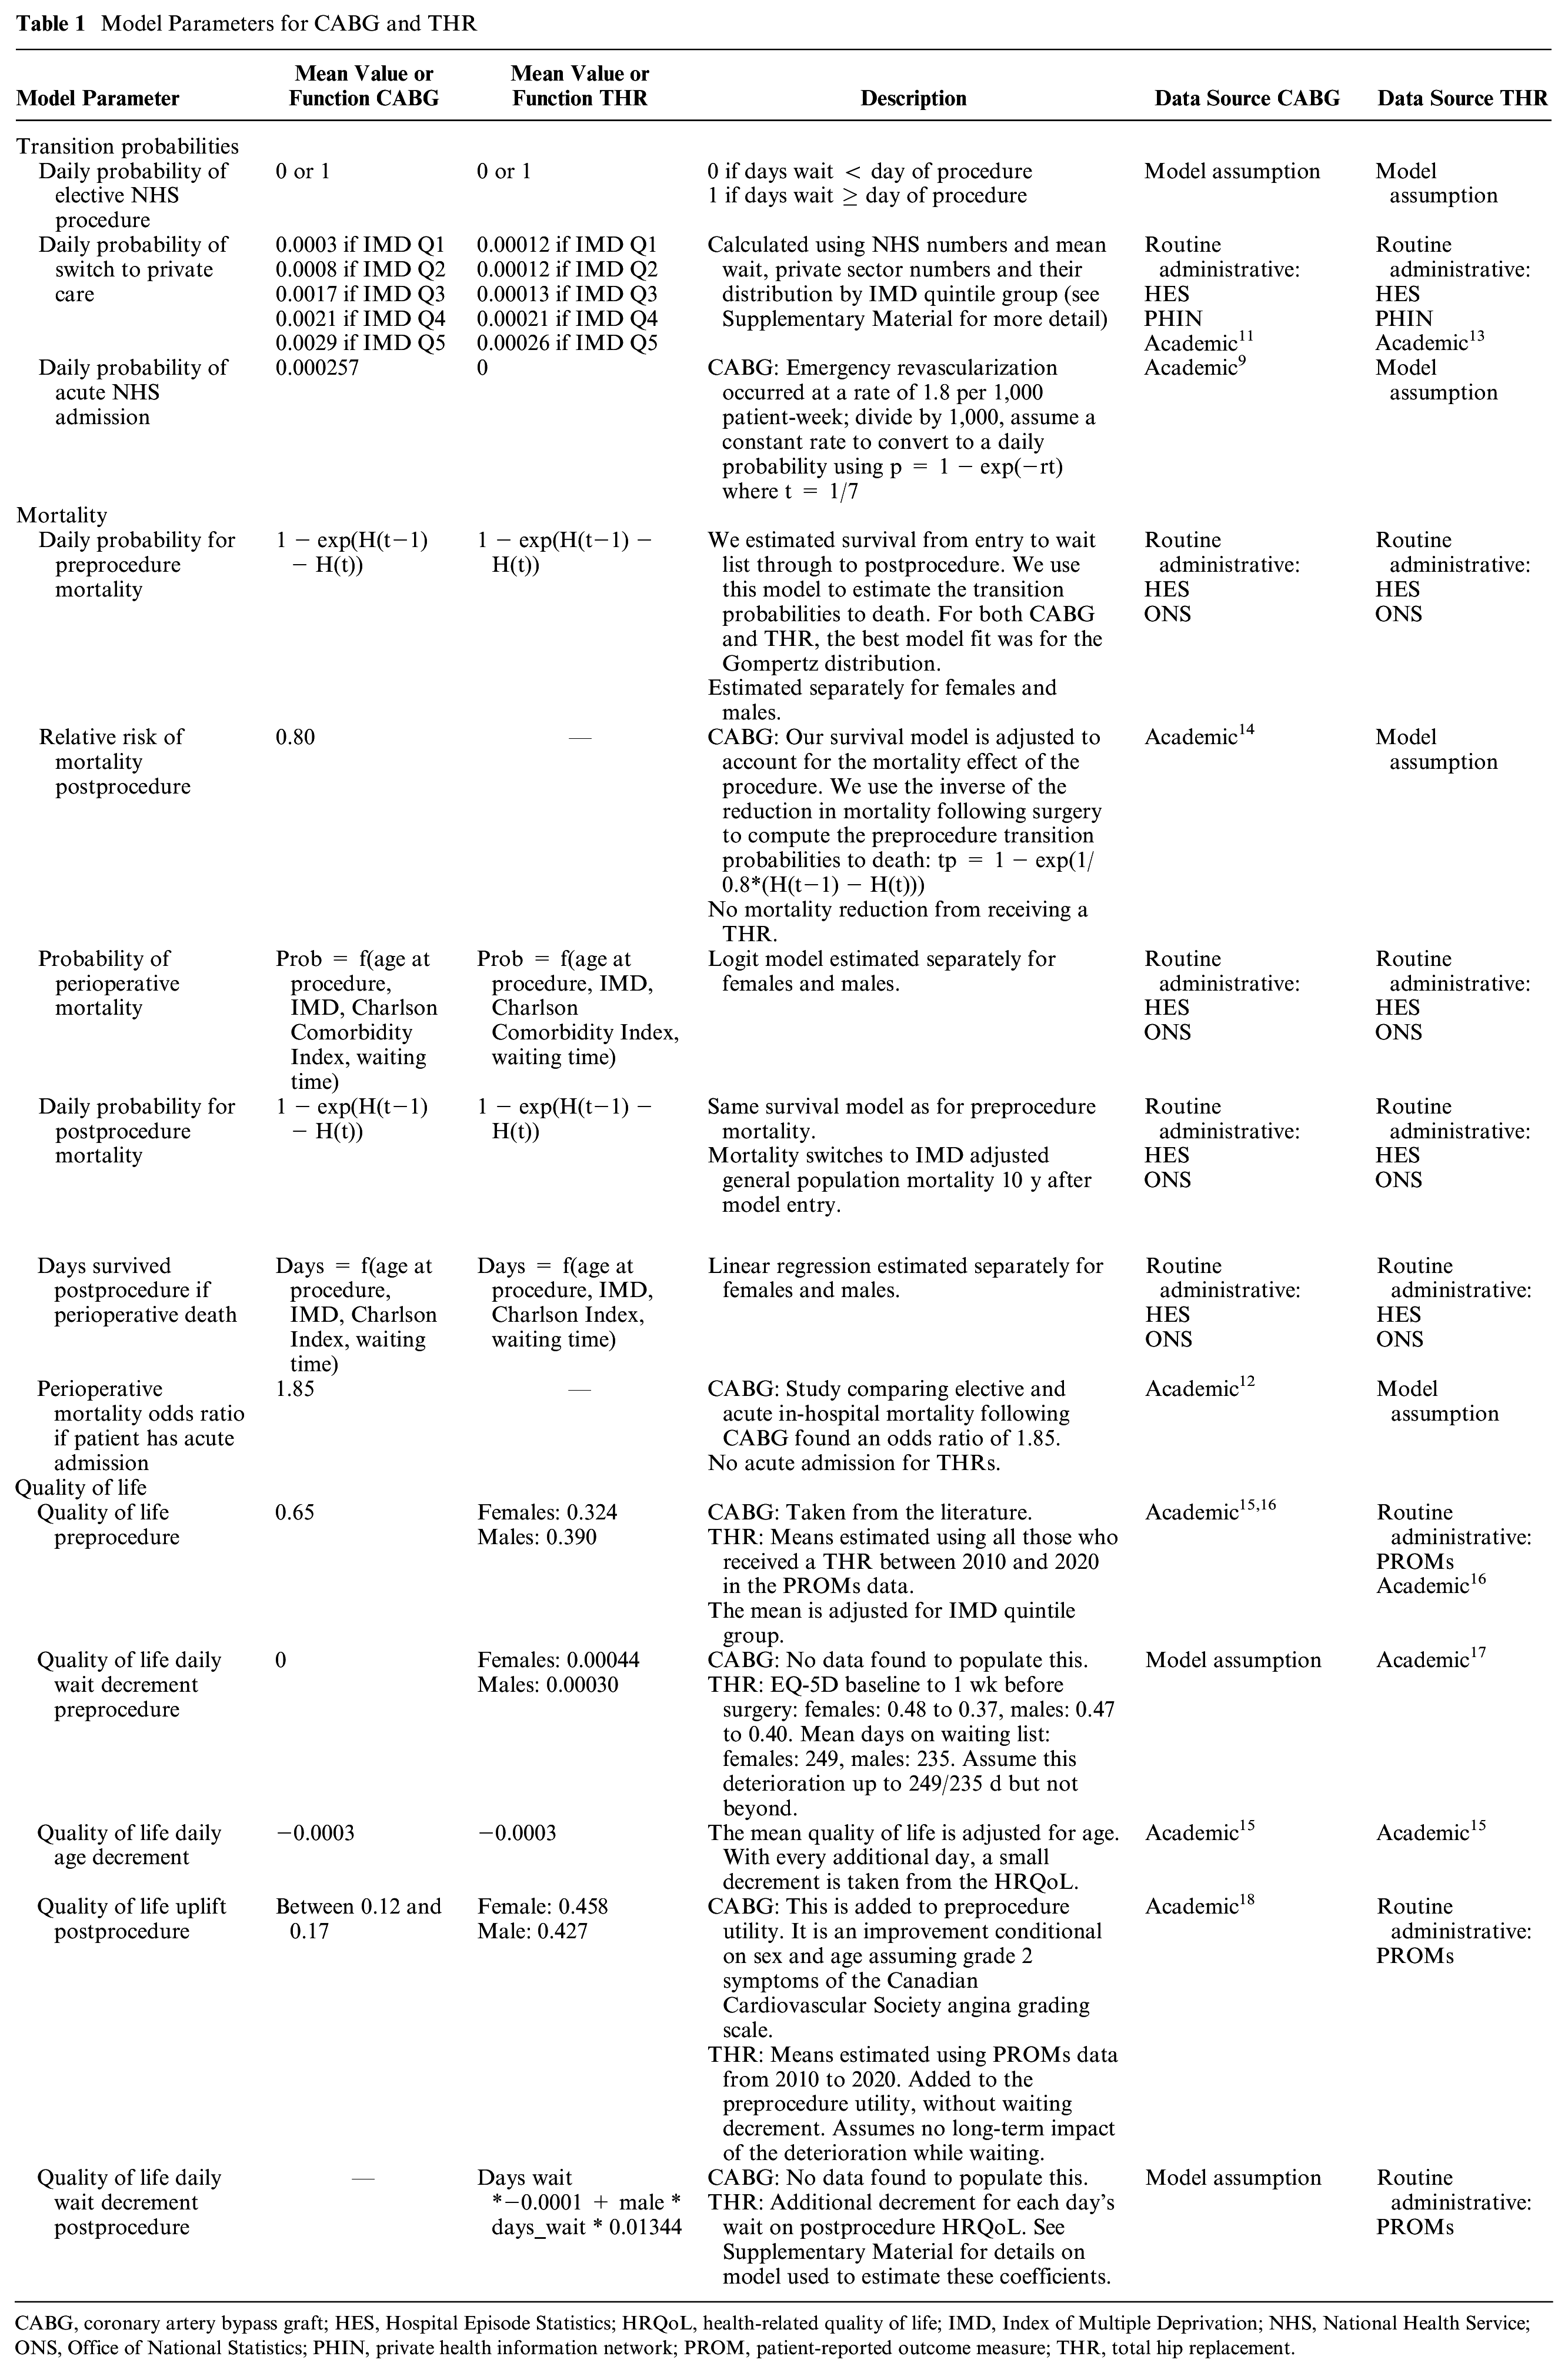
CABG, coronary artery bypass graft; HES, Hospital Episode Statistics; HRQoL, health-related quality of life; IMD, Index of Multiple Deprivation; NHS, National Health Service; ONS, Office of National Statistics; PHIN, private health information network; PROM, patient-reported outcome measure; THR, total hip replacement.
Mortality
Mortality risk was estimated using a parametric survival model fitted to all those who received a procedure between 2010 and 2020 and who survived more than 30 d postprocedure. Overall survival started from the point at which patients entered the waiting list; however, this potentially introduced selection bias as sicker patients were more likely to have died before they received their procedure and would not appear in our data. This led to a potential overestimate of the survival time. We used left truncation right-censored survival methods to adjust for this bias.19–22 Seven models were estimated (exponential, gamma, generalised gamma, Gompertz, log-logistic, log-normal, and Weibull) before selecting the most appropriate based on the Akaike information criterion, a visual inspection, and consideration of the long-run extrapolation. 23 We used HES and ONS data and the same set of covariates as for the 2 previous models. Results of the survival analyses are given in the Supplementary Material. The mortality estimates produced by the models were checked for face validity against general population mortality using ONS UK life tables for 2015 to 2017. 24 Mortality switched to that of the general population 10 y after entry to the list, accounting for age/sex/IMD quintile group. 25
For THR, it was assumed that there was no mortality effect of the procedure, so a common survival function was used, starting when the patient was added to the waiting list and continuing for 10 y, by which time they would be in the postprocedure state (unless they exited before they received the procedure). For patients undergoing CABG, we assumed that the procedure reduces the risk of death; therefore, the preprocedure mortality was increased using the inverse of the mortality risk reduction postprocedure taken from the literature. 14
Exit to acute admission or private care
A constant risk of acute admission for CABG patients was applied based on the published literature. 9 For THR patients, we assumed no risk of emergency admission.
We estimated the risk of exit to private care for each procedure, which was assumed to be constant over time. Private health information network (PHIN) 26 data (further details on PHIN are given in the Supplementary Material) was used to obtain the total number of private procedures, and these were split by IMD based on the literature or private insurance data. Based on this number combined with previous waiting times and volumes in HES, a constant probability of exit to private care was estimated (see the Supplementary Material for details of these calculations).
HRQoL
For CABG, preprocedure HRQoL and the increase postprocedure were taken from the literature.15,18 For THRs, we used PROMs data directly to estimate pre- and postprocedure HRQoL. For THR, we added a daily decrement while waiting, estimated from the literature. 17 In addition, we included a postprocedure decrement for each additional day’s wait computed using instrumental variable regression methods (more detail is given in the Supplementary Material). We were not able to find equivalent evidence for CABG.
HRQoL both before and after were adjusted for age and IMD quintile group.15,16
For those who died perioperatively, we applied the preprocedure HRQoL to the days they survived (less than 30), reflecting the assumption that they did not receive morbidity benefit from the procedure.
Analysis
The model was evaluated for each procedure for different waiting times, with the day of the procedure from entry set at 1 d, 6 wk, 12 wk, 18 wk (to correspond to the NHS target), 24 wk, 30 wk, and 36 wk.
Results were estimated for 10 subgroups, accounting for IMD quintile group and sex. For each subgroup, the mean age, Charlson Comorbidity Index and waiting time were computed to generate a representative individual for that group. This individual was then inputted into the model and the results estimated.
The model was programmed in R software. The code was provided open source. Only the model was provided, the data were not shared, as some of the model inputs were estimated from confidential protected data, namely, the HES and PROMs data (https://github.com/naomikategibbs/waiting_times).
Results
There were 82,029 CABG procedures and 633,941 THR procedures in the 10-y period. Most CABG procedures undertaken were for males (83%), whereas among THR patients, there were more females (60%). Missing data for the waiting time variable in HES data was 11% and 8% for CABG and THR, respectively. Further summary statistics are reported in Table 2.
Summary Statistics for HES Data (April 2010–March 2020) Matched with ONS Mortality Data (April 2010—March 2021), Used for Survival Analysis
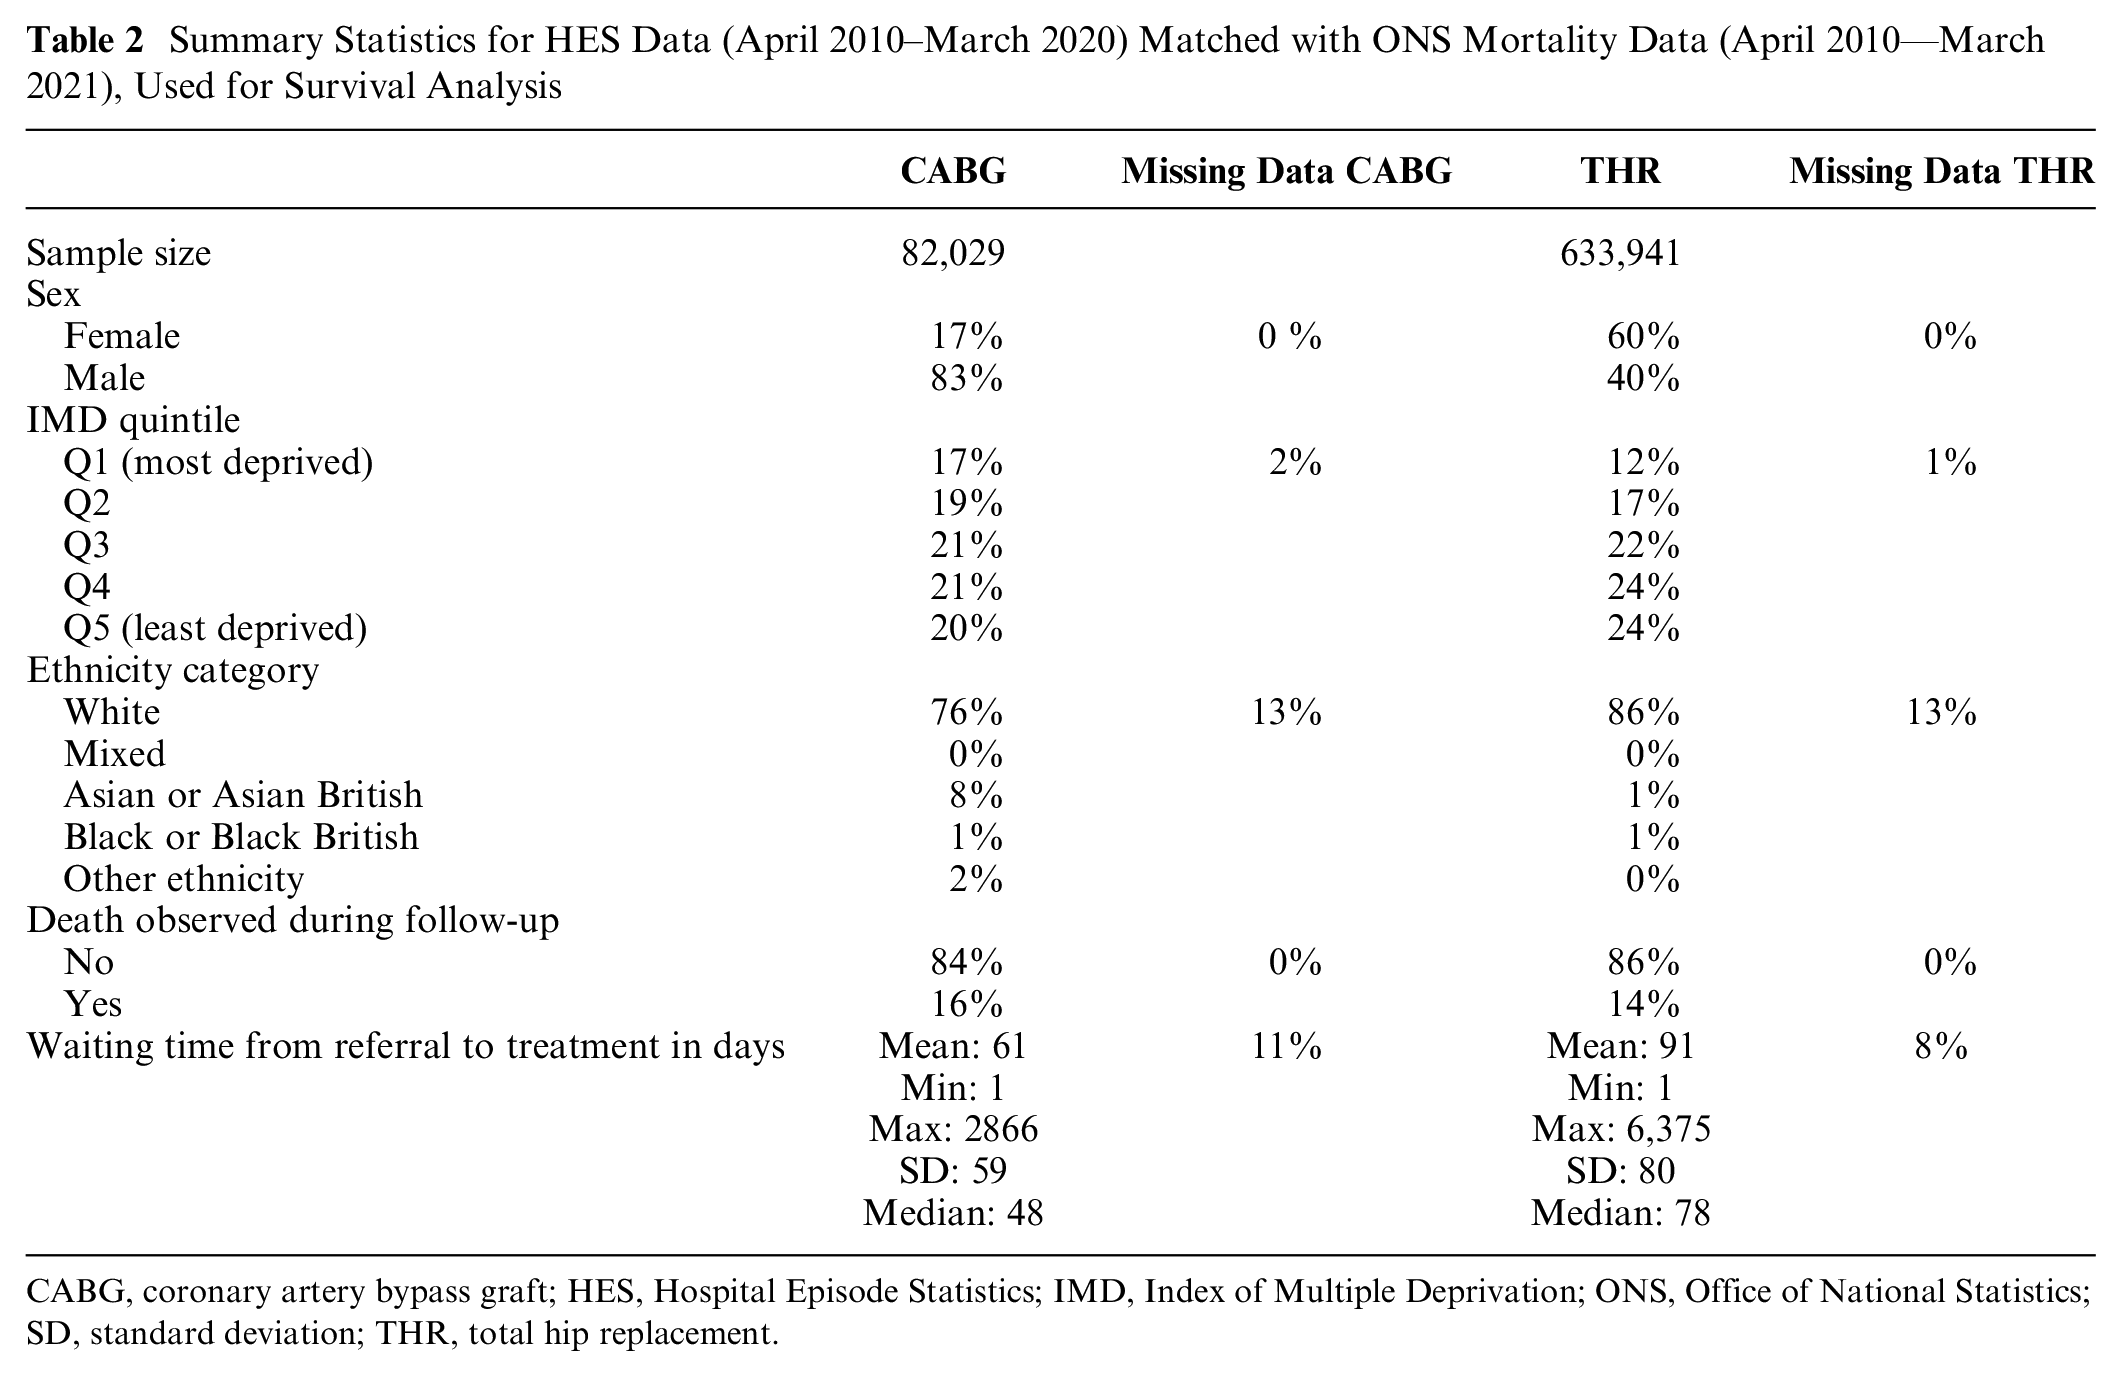
CABG, coronary artery bypass graft; HES, Hospital Episode Statistics; IMD, Index of Multiple Deprivation; ONS, Office of National Statistics; SD, standard deviation; THR, total hip replacement.
We used complete observations from our HES data and removed waiting time outliers (±3* SD) resulting in a sample of 70,934 for CABG and 575,216 for THR. We estimated mean age (when admitted to the waiting list), Charlson Comorbidity Index, and waiting time, to create a representative individual for each of our 10 subgroups (Figure 2). For both CABG and THR, females were older than males. The mean age decreased with deprivation, meaning more deprived quintiles were younger when admitted to the waiting list. Comorbidities as measured by the Charlson Comorbidity Index were higher for CABG patients than for THR patients and worsened with deprivation. For THR, the comorbidity index indicated that men had more comorbidities than women. For CABG, the relationship varied, with females in the most deprived quintiles having lower comorbidities than men, but the opposite was true in the least deprived quintiles.
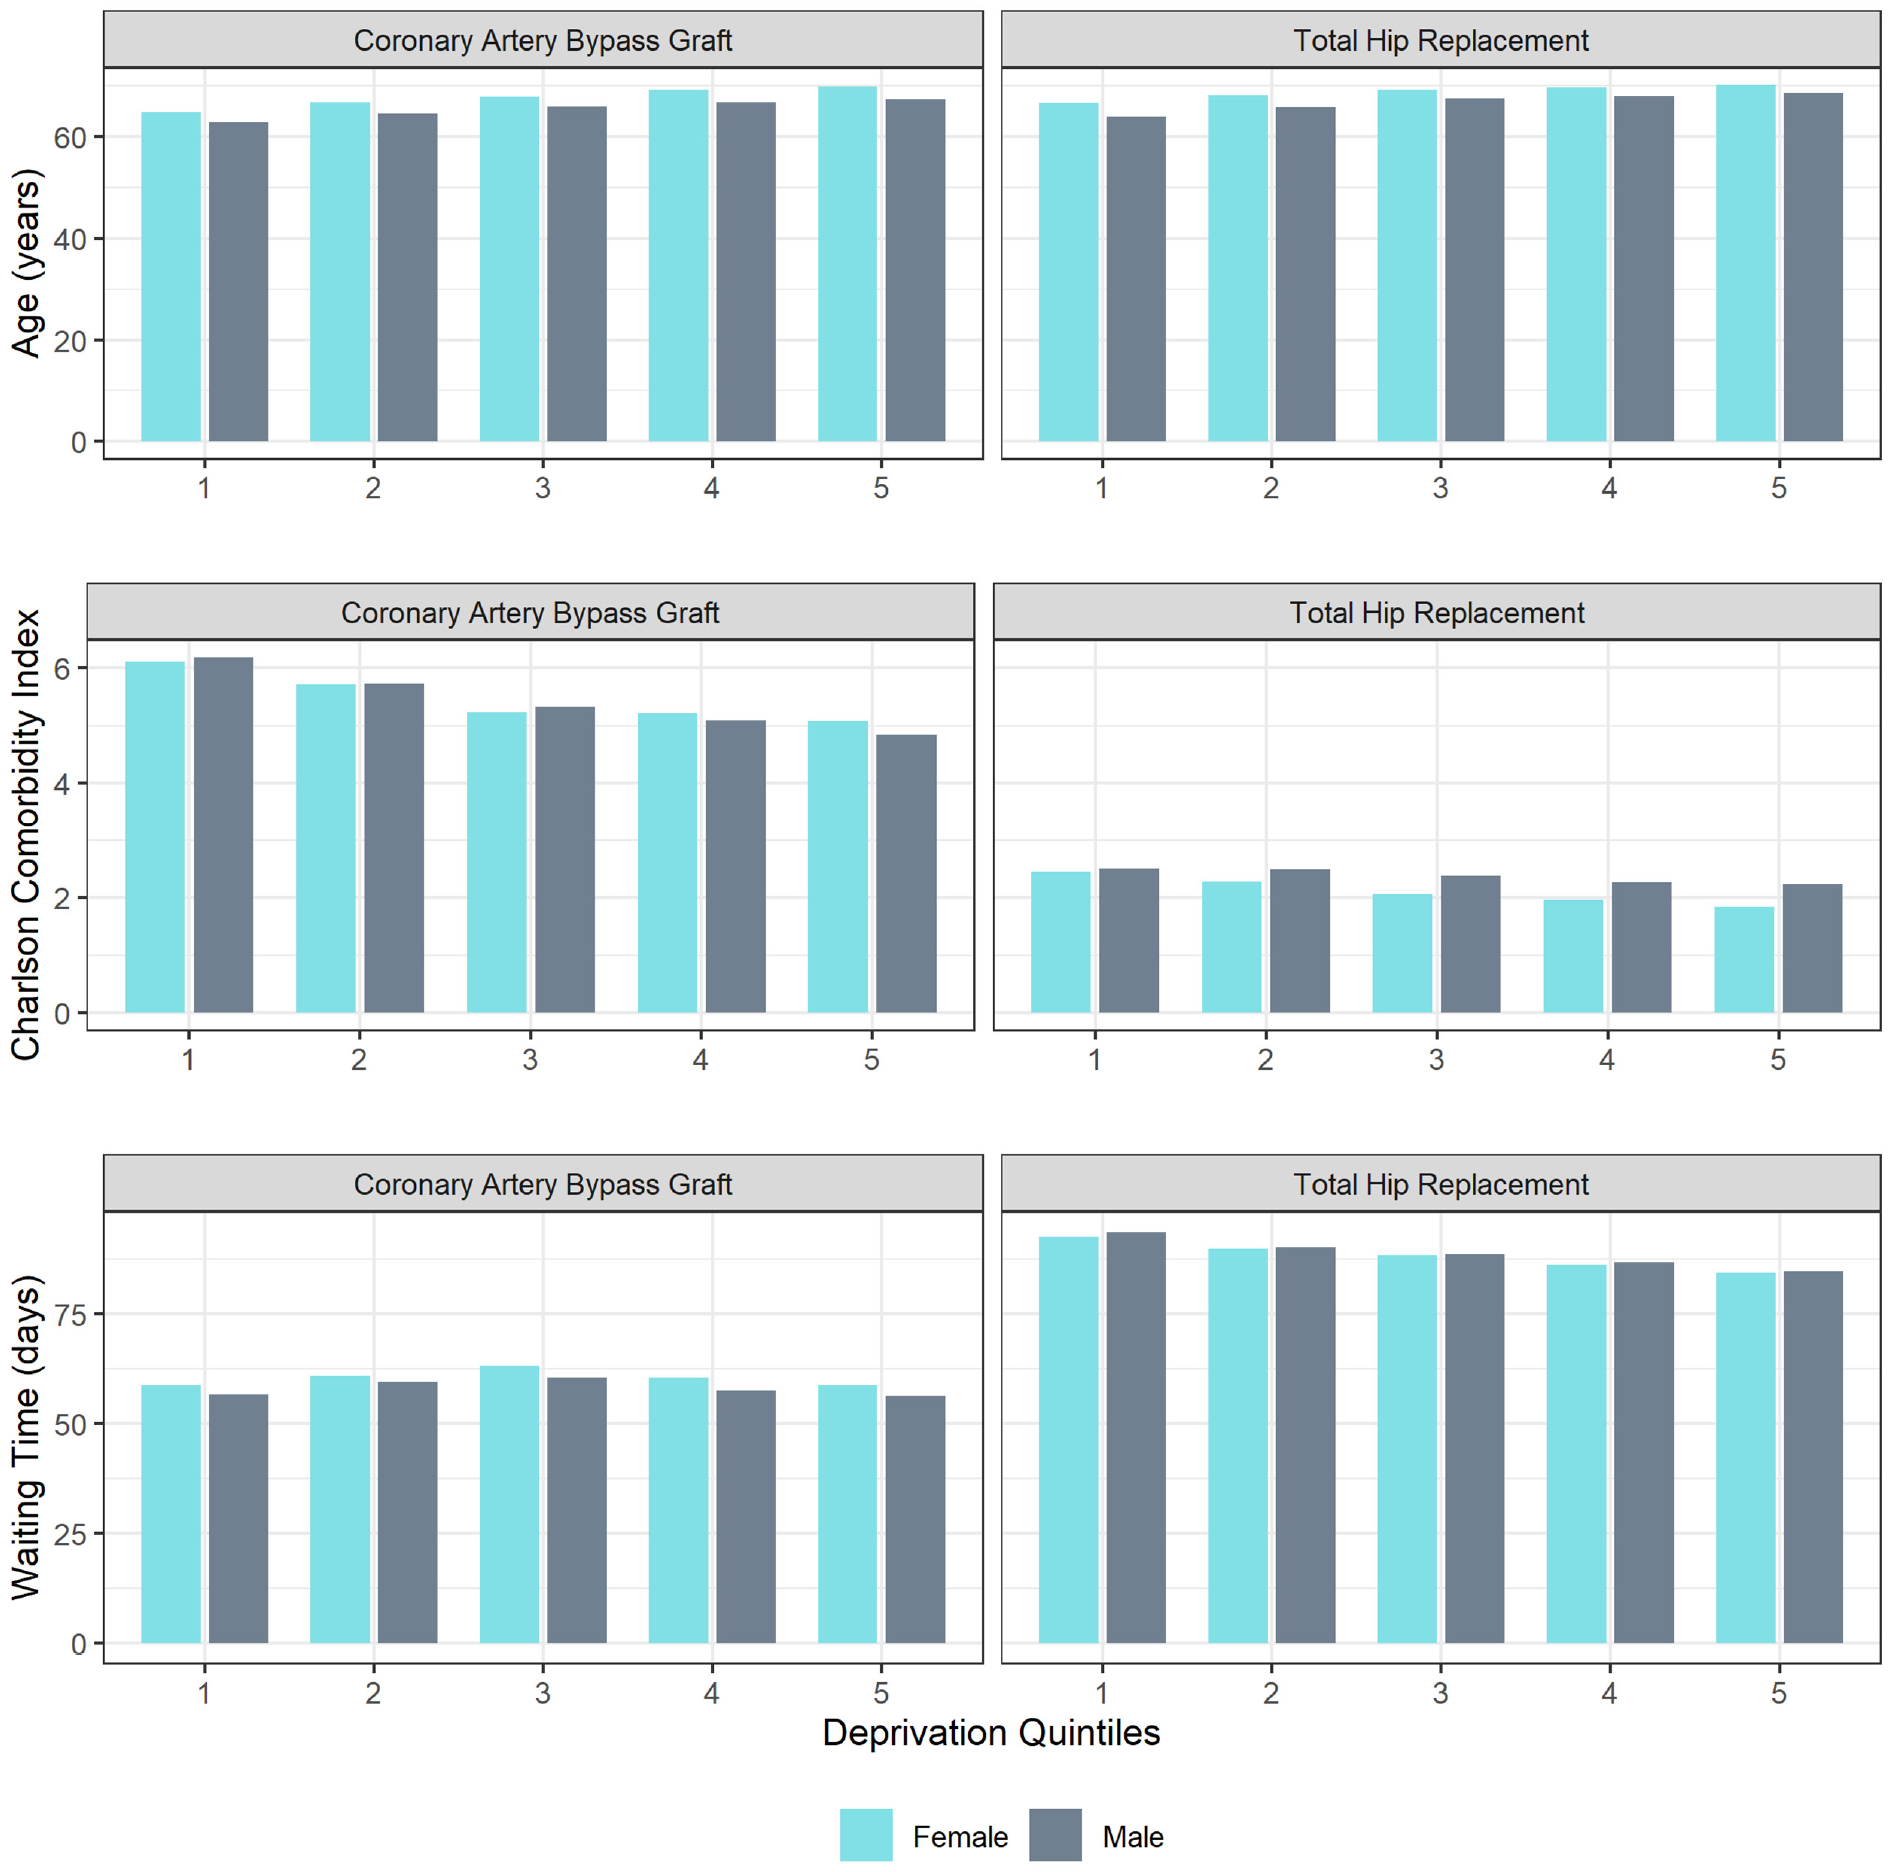
Mean age, Charlson Comorbidity Index, and waiting time by sex and deprivation.
Tables 3 and 4 report the change in lifetime discounted QALYs from referral compared with receiving the procedure at 18 wk, across our 10 subgroups. As waiting time increased, the discounted QALYs decreased across all subgroups. Compared with a baseline of 18 wk, increasing the wait time by a further 18 wk, to a 36-wk total wait, resulted in a mean discounted QALY loss in the range of 0.034 to 0.043 for CABG and 0.193 to 0.291 for THR. This impact of increased waiting time was not perfectly linear and not uniform across subgroups. This was also true for the undiscounted results.
Mean Individual Discounted Quality-Adjusted Life-Years Relative to 18 wk for Coronary Artery Bypass Graft
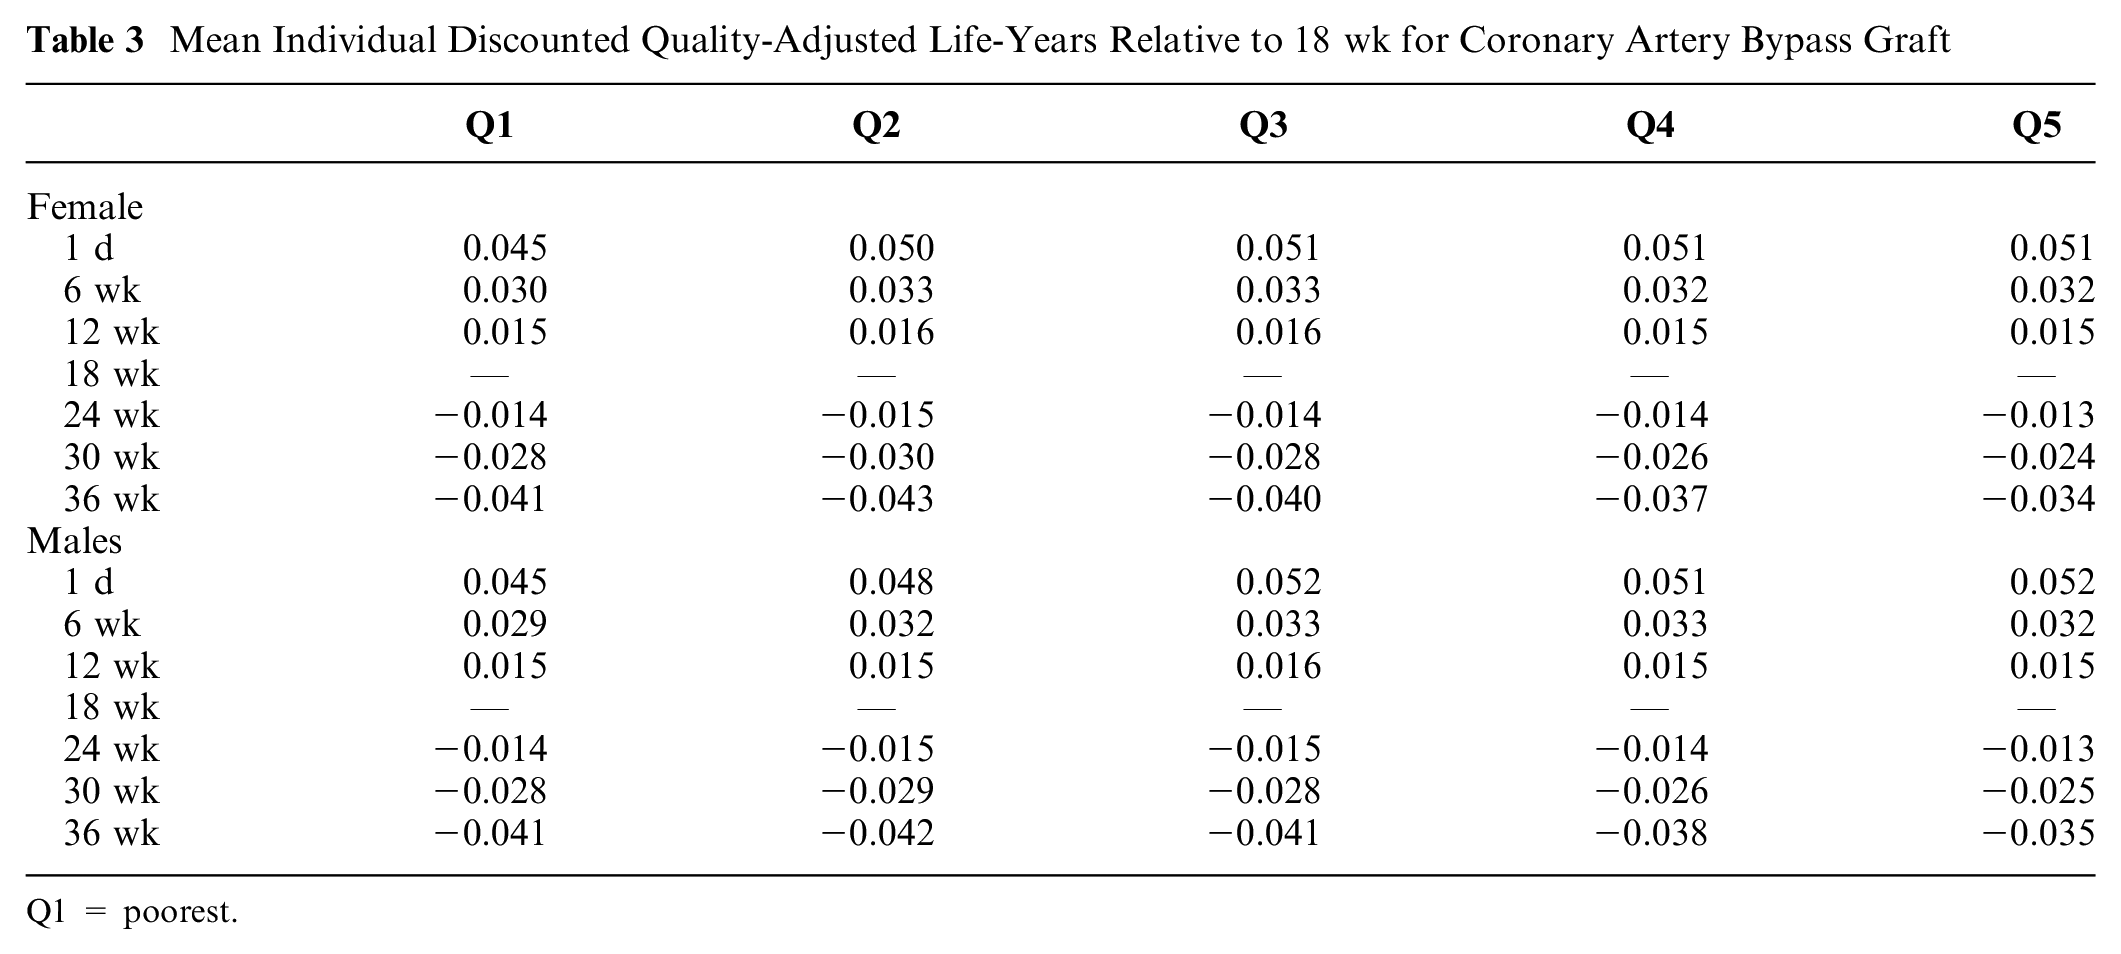
Q1 = poorest.
Mean Individual Discounted Quality-Adjusted Life-Years Relative to 18 wk for Total Hip Replacement
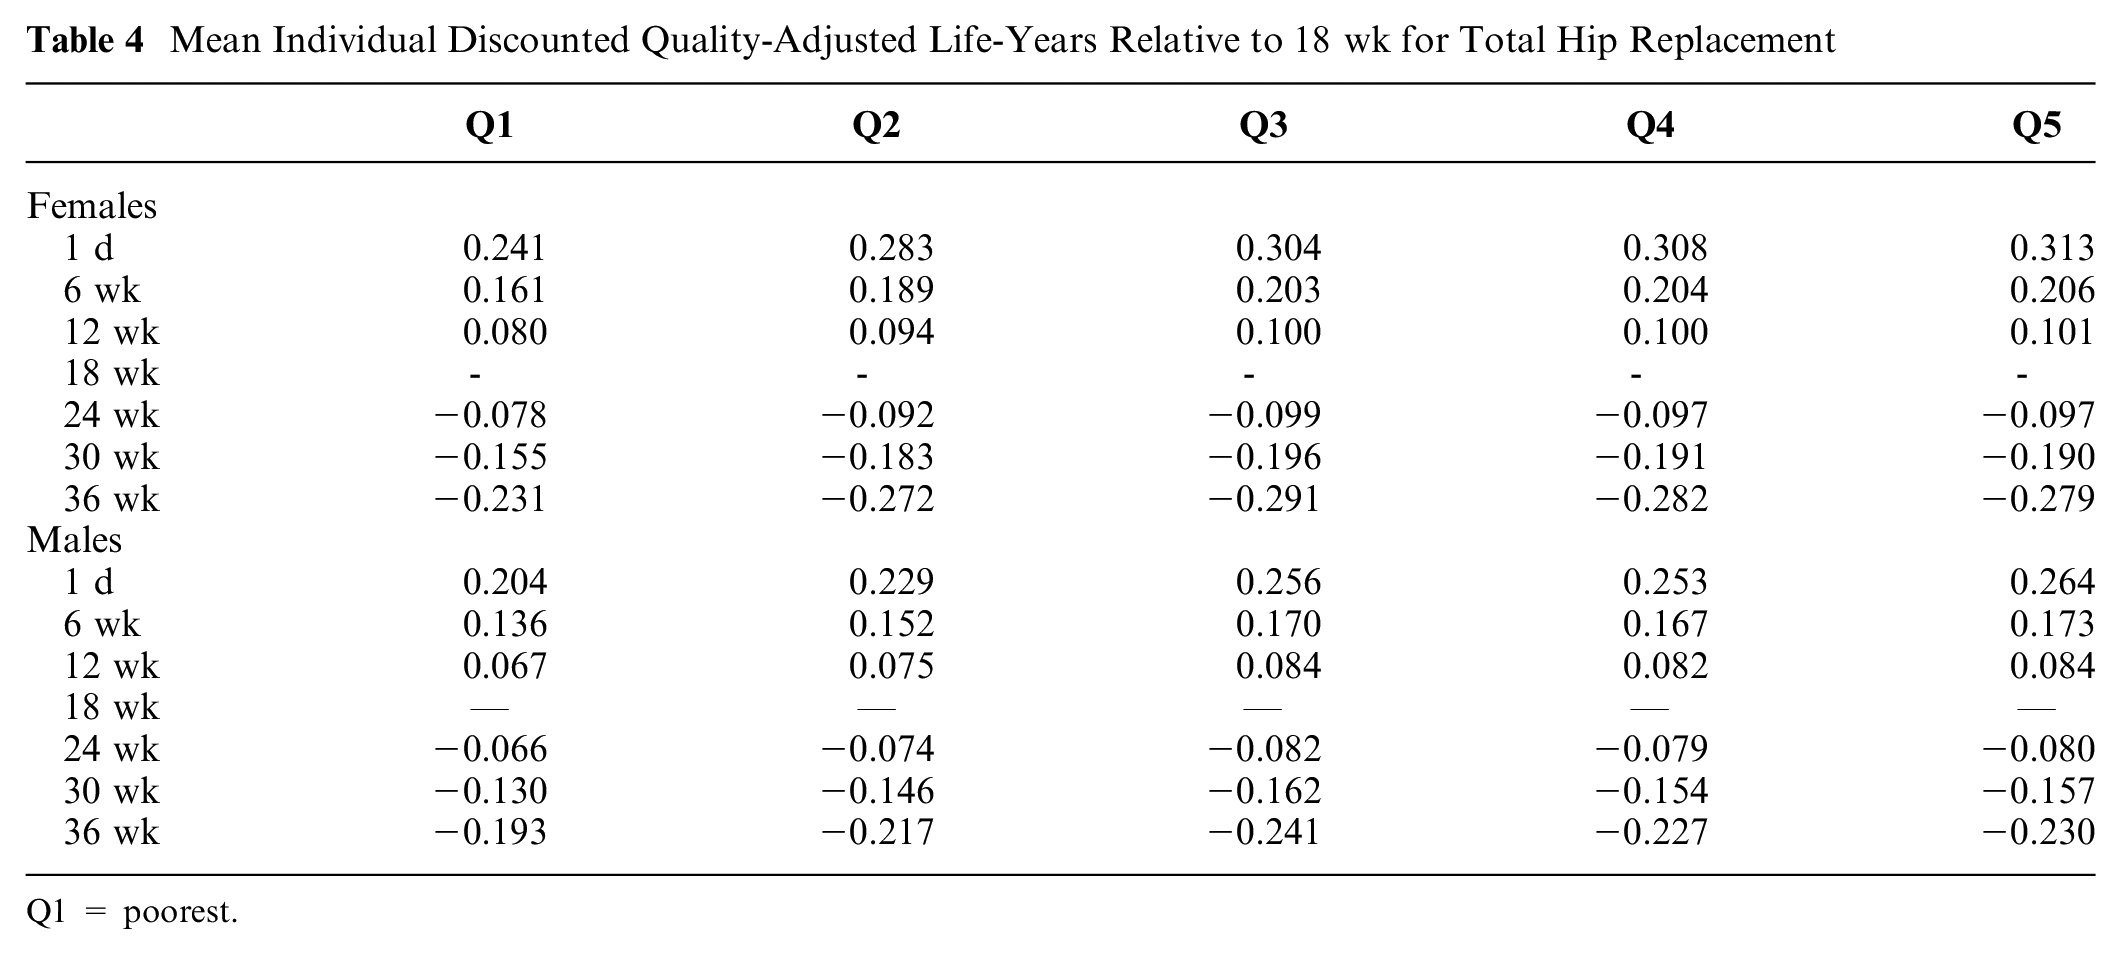
Q1 = poorest.
Figure 3 presents the discounted QALYs from a zero waiting time onward. We can see that as people waited, their discounted lifetime QALYs decreased. The most deprived quintile group for females appeared to have particularly low discounted lifetime QALYs relative to the other 4 quintiles. This is primarily due to the multiplication factors used to adjust the HRQoL by IMD quintile group. The slope of the decrease appeared steeper for THR driven by a greater change in HRQoL resulting from the procedure and the addition of evidence, which allows for a postprocedure decrement dependent on each additional day of wait, which outweighed the mortality impacts of CABG.
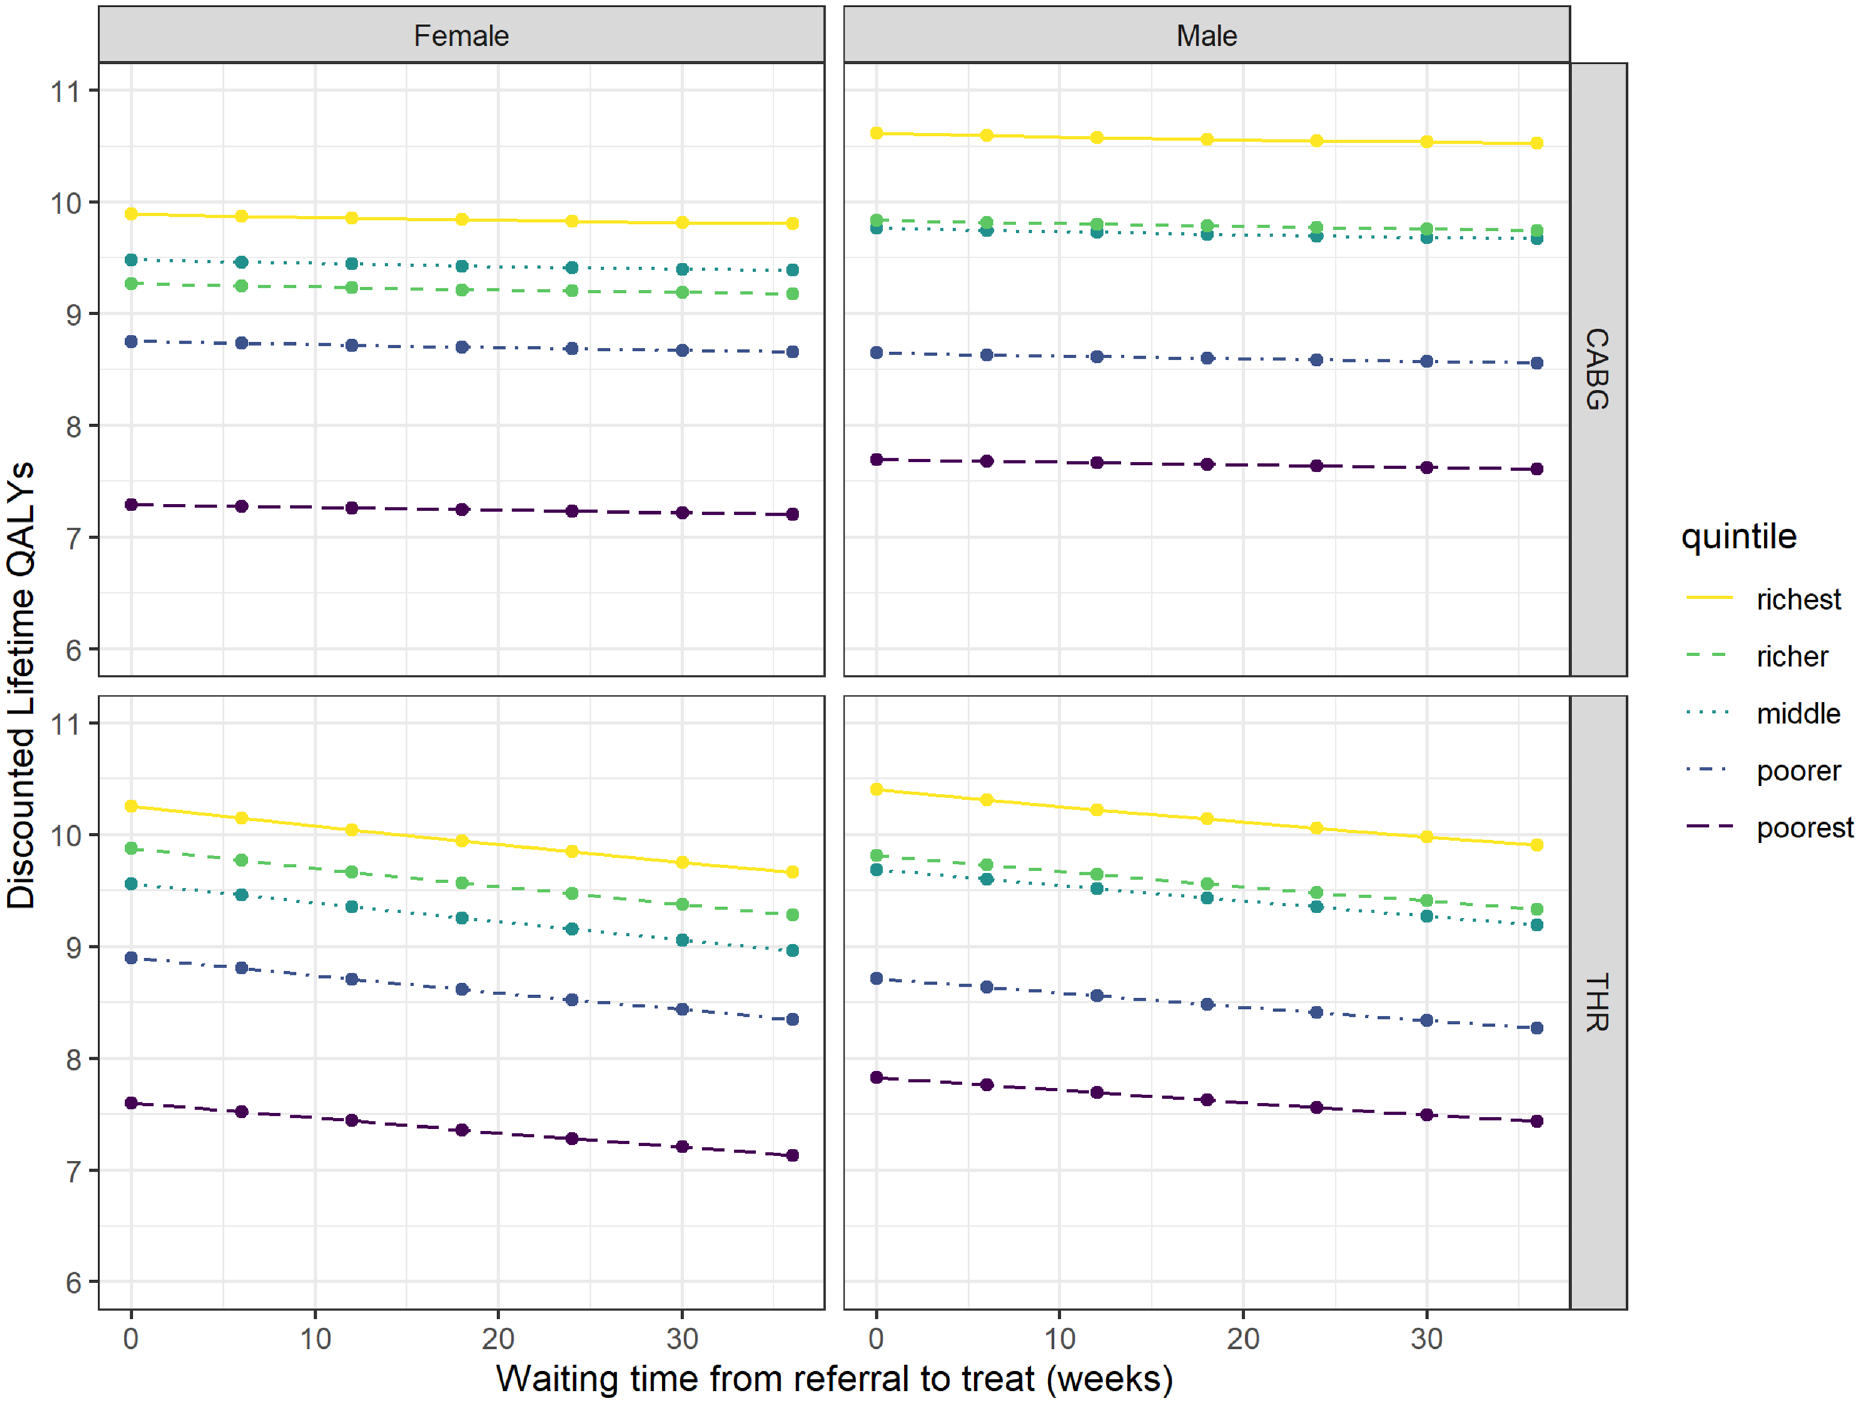
Total discounted quality-adjusted life-years by sex and Index of Multiple Deprivation quintile.
In Figure 4, we see the destination of patients who enter the waiting list as waiting time increases. The share of private procedures increased with wait time. CABG patients experienced an increased mortality risk while waiting, but this was not visible on the graph for waits up to 36 wk. Patients may also require acute admission for a CABG while on the waiting list, which we can clearly see. For THR, there was no increased mortality risk while waiting and no risk of acute admission for a THR.
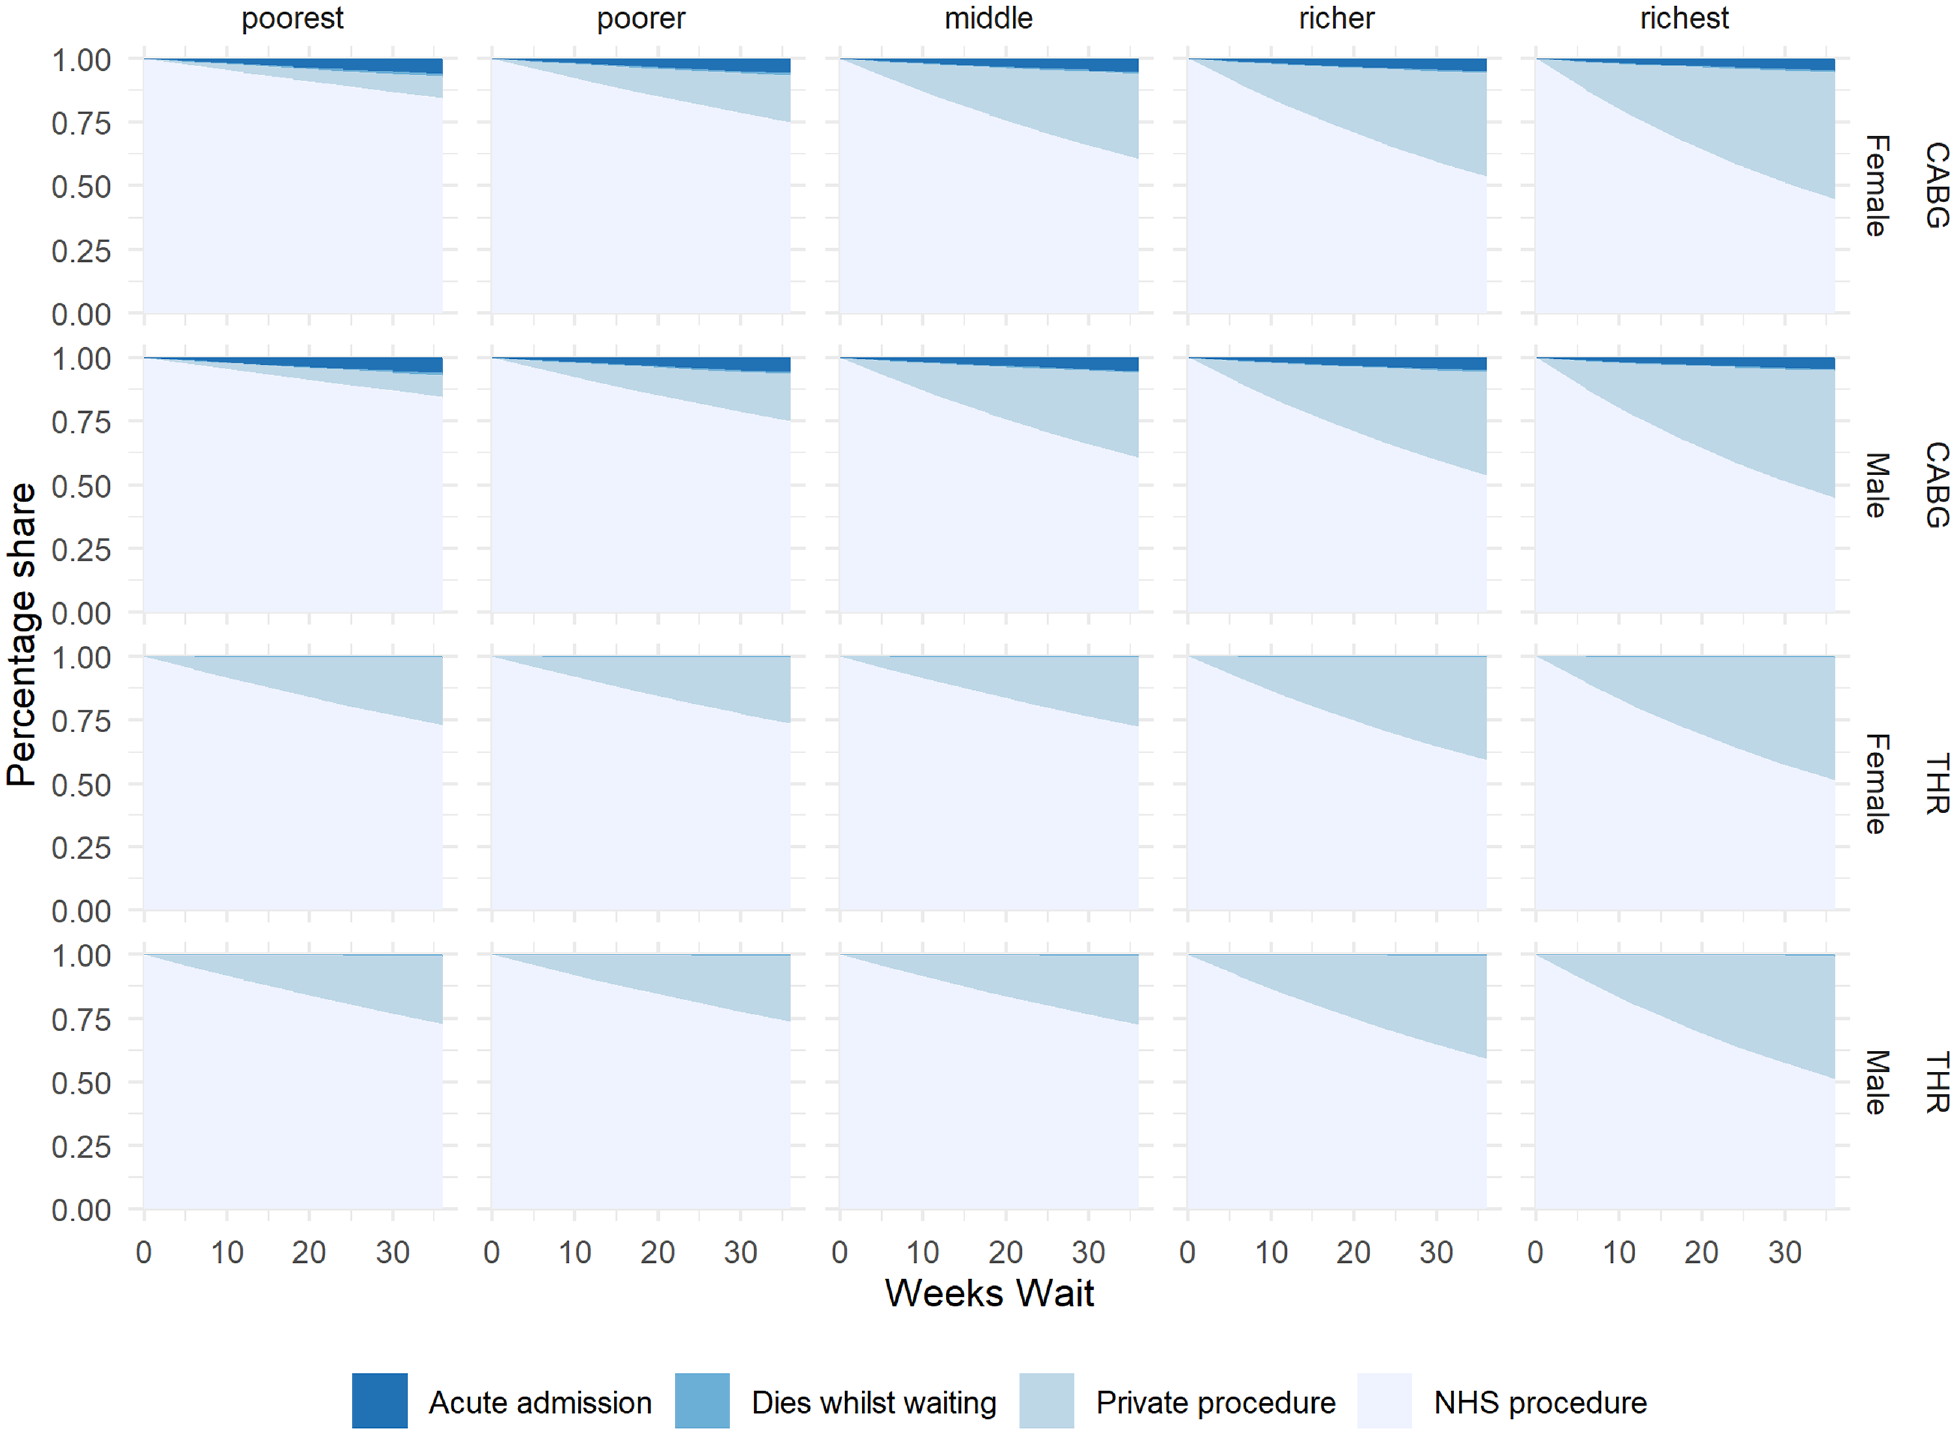
Percentage share between destinations as waiting time increases.
Discussion
We have outlined our methods to model the health impact of waiting for elective procedures in the NHS in England, using a simplified version of a general modeling framework. 5 We demonstrated the methodological approach by applying the model to CABG and THR, estimating how QALYs are lost while waiting and how this varies by sex/IMD subgroups.
The longer people wait for their procedure, the more QALYs they lose, although at a decreasing rate. Waiting an additional 18 wk, for a total wait of 36 wk, results in a QALY loss of between of 0.034 and 0.043 for CABG and 0.193 and 0.291 for THR.
The model allows for patients’ HRQoL to be linked to waiting time for both pre- and postprocedure, although we were able to parameterize this only for THR, for which we had access to PROMs data and academic literature covering the issue. This might have biased the results toward THR as we captured additional waiting decrements that were not included for CABG.
Most health conditions would be expected to deteriorate while waiting, with potential long-term impacts on postprocedure HRQoL, changing the magnitude and pace of the reduction in mean lifetime QALYs. If this evidence were available for CABG and other procedures, we expect it would better illustrate the relative impact of waiting between procedures and IMD quintile groups. We expect deterioration would likely be worse among poorer groups who have higher comorbidities, and we may even see an increasing marginal disutility of waiting.
Our approach joins other studies that estimated the health impact of waiting across different procedures27–31 (summarized in table 1 of our modeling framework report 5 ). We incorporate several features from across the previous work including modeling both mortality and morbidity effects, increased mortality risk while waiting, and postprocedure HRQoL dependent on waiting time. Our model expands on previous work by incorporating exits to private care, which represents an increasing share of health care delivery in England. Our model also includes deteriorating, rather than constant, HRQoL while waiting for those procedures where evidence is available. We also allow for differential impact by IMD quintile group, a potentially important part of a decision maker’s objective function. Governments looking to reprioritize resources to minimize waiting lists may be interested in which procedures reduce (or increase the least) population-level health inequality and whether there are tradeoffs with maximizing population health.
The inclusion of health outcomes that are generated by the private sector in our model raises important normative questions about how these should be valued. In this article, we have valued the health gained by procedures conducted in the NHS and private sector equally, but this may not be considered acceptable. In addition, any future inclusion of costs would require a cross-sectoral approach as health generated by the private sector generates costs that fall on the individual.
Limitations
There are several limitations to our approach, a number of which relate to data availability. We had access only to data for those who had undergone a procedure in HES. Those who entered the waiting list but who exited before receiving the procedure were not captured. Having these data would enable us to refine our estimates for preprocedure mortality while waiting (currently estimated using left-truncation right-censored survival methods), exit to private care, exit for acute admission, and exit for any other reason captured. We could have consulted clinical experts on all potential reasons for exit and conducted detailed searches to parametrize these. However, given our objective to create a model that could be pragmatically applied to a broader set of procedures, we limited our searches to exits to private, death, and acute admission for the same procedure.
We were also restricted by the level of granularity about individual characteristics in the HES data; this is a limitation when using survival methods that rely on observable factors. We have included the main observables found to be important in other studies of mortality, but there remains a possibility we have omitted important confounders.
There is a large amount of missing data for the waiting time variable within HES. We have taken time to compare key parameters between the group with missing data and without it and are confident in our analysis, but as waiting times grow, this variable may become more critical to future research.
The time spent waiting on the inpatient waiting list represents only a portion of the total patient wait. Patients may be considered to start waiting from their first contact with the health service. To be able to estimate this, we would need linked data between primary and secondary care in England.
We estimated the probability of switching to private health care using the data available. For CABG, we were able to find a specific study; however, for THR, we used a proxy of private health insurance coverage. As the numbers of private procedures are widely reported to be increasing, these are important parameters for our estimates, and further research would be beneficial.
There may be important variations by ethnicity. The majority of patients undergoing CABG or THR procedures are White British patients (76% CABG, 86% THR); however, a higher proportion of patients undergoing CABG are Asian or Asian British as compared with those undergoing THR. There is a large amount of missing data in HES for ethnicity (13% for both), and upon interrogating the data, we found this proportion to be increasing over time. There could be several reasons for this, but as the emphasis on reporting the impact of health policies by ethnicity category increases, these are crucial data.
Finally, ideally, there would be comparable sources of data over all parameters for both procedures. Although we have comparable sources of data for mortality, which is a strength of this study, the HRQoL data source differs between procedures, introducing potential bias. If PROMs data were to be expanded to all elective procedures in the NHS, this would strengthen our ability to make comparisons. We also acknowledge that it would be ideal to identify all parameters not available in the administrative data through systematic reviews, but this was not possible given the constraints of the project.
Conclusion
Waiting for elective procedures results in QALY losses for patients, driven by both mortality and morbidity consequences. These losses are quantifiable and comparable across procedures using a general model populated (as far as possible) by administrative data sets.
To further increase the usefulness of this research to decision makers, we plan to model the health impact of an additional 6 procedures, including cataract, knee replacement, groin hernia repair, percutaneous coronary intervention, hysterectomy, and cholecystectomy. This will enable greater comparison between procedures and may highlight additional methodological or data requirements for the model.
Another potential application of this model would be to apply it to estimates of the increased waiting time for elective procedures resulting from COVID-19 to allow an estimation of the impact of the pandemic. Longer term, this model could be developed to incorporate costs. This would provide evidence toward informing reallocation of resources via alternative targets for procedures or subgroups.
Supplemental Material
sj-docx-1-mdm-10.1177_0272989X241256639 – Supplemental material for The Health Impact of Waiting for Elective Procedures in the NHS in England: A Modeling Framework Applied to Coronary Artery Bypass Graft and Total Hip Replacement
Supplemental material, sj-docx-1-mdm-10.1177_0272989X241256639 for The Health Impact of Waiting for Elective Procedures in the NHS in England: A Modeling Framework Applied to Coronary Artery Bypass Graft and Total Hip Replacement by Naomi Kate Gibbs, Susan Griffin, Nils Gutacker, Adrián Villaseñor and Simon Walker in Medical Decision Making
Footnotes
The authors declared no potential conflicts of interest with respect to the research, authorship, and/or publication of this article. The authors disclosed receipt of the following financial support for the research, authorship, and/or publication of this article: This research is funded by the National Institute for Health and Care Research (NIHR) Policy Research Programme, conducted through the NIHR Policy Research Unit in Economic Evaluation of Health and Care Interventions, PR-PRU-1217-20401, and the NIHR Policy Research Unit in Economics of Health Systems and Interface with Social Care, PR-PRU-127-20301. The views expressed are those of the authors and not necessarily those of the NIHR or the Department of Health and Social Care.
Disclaimer
This work uses data provided by patients and collected by the NHS as part of their care and support. The Hospital Episode Statistics Admitted Patient Care data and Patient Reported Outcome Measures are copyright ©2010–2020 NHS England, reused with the permission of NHS England. All rights reserved. This project was undertaken on the Data Safe Haven, which is an ISO 27001–certified environment for handling sensitive data and is provided by the University of York. We are grateful for the support from the York Data Safe Haven team and the Research Computing team.
Notes
References
Supplementary Material
Please find the following supplemental material available below.
For Open Access articles published under a Creative Commons License, all supplemental material carries the same license as the article it is associated with.
For non-Open Access articles published, all supplemental material carries a non-exclusive license, and permission requests for re-use of supplemental material or any part of supplemental material shall be sent directly to the copyright owner as specified in the copyright notice associated with the article.