
Abstract
Objective
The main aim of this article is to test monotonicity in life duration. Previous findings suggest that, for poor health states, longer durations are preferred to shorter durations up to some threshold or maximum endurable time (MET), and shorter durations are preferred to longer ones after that threshold.
Methods
Monotonicity in duration is tested through 2 ordinal tasks: choices and rankings. A convenience sample (n = 90) was recruited in a series of experimental sessions in which participants had to rank-order health episodes and to choose between them, presented in pairs. Health episodes result from the combination of 7 EQ-5D-3L health states and 5 durations. Monotonicity is tested comparing the percentage rate of participants whose preferences were monotonic with the percentage of participants with nonmonotonic preferences for each health state. In addition, to test the existence of preference reversals, we analyze the fraction of people who switch their preference from rankings to choices.
Results
Monotonicity is frequently violated across the 7 EQ-5D health states. Preference patterns for individuals describe violations ranging from almost 49% with choices to about 71% with rankings. Analysis performed by separate states shows that the mean rates of violations with choices and ranking are about 22% and 34%, respectively. We also find new evidence of preference reversals and some evidence—though scarce—of transitivity violations in choices.
Conclusions
Our results show that there is a medium range of health states for which preferences are nonmonotonic. These findings support previous evidence on MET preferences and introduce a new “choice-ranking” preference reversal. It seems that the use of 2 tasks with a similar response scale may make preference reversals less substantial, although it remains important and systematic.
Highlights
Two procedures based on ordinal comparisons are used to elicit preferences: direct choices and rankings. Our study reports significant rates of nonmonotonic preferences (or maximum endurable time [MET]–type preferences) for different combinations of durations and EQ-5D health states.
Analysis for separate health states shows that the mean rates of nonmonotonicity range from 22% (choices) to 34% (rankings), but within-subject analysis shows that nonmonotonicity is even higher, ranging from 49% (choices) to 71% (rankings). These violations challenge the validity of multiplicative QALY models.
We find that the MET phenomenon may affect particularly those EQ-5D health states that are in the middle of the severity scale and not so much the extreme health states (i.e., very mild and very severe states).
We find new evidence of preference reversals even using 2 procedures of a similar (ordinal) nature. Percentage rates of preference reversals range from 1.5% to 33%. We also find some (although scarce) evidence on violations of transitivity.
Keywords
This article investigates, in a very basic and fundamental way, two empirical phenomena that challenge the multiplicative relationship assumed in quality-adjusted life-year (QALY) calculations, namely, nonmonotonicity in life span and related preference reversals. In the simplest case, QALYs are computed by adjusting life-years (denoted as t) by the utility (v) attached to the health state (q) in which they are spent, that is, u(q, t) = v(q) ·t, with u a QALY utility function over outcomes q and t, both embedded within a health episode (q, t), and v a utility function that assigns a value to every possible health state. The correction of t by factor v(q) is called the linear QALY model,1,2 since the utility u is linear in duration. If the linearity assumption is dropped, then the multiplicative QALY model3–5 follows; that is, u(q, t) = v(q) ·w(t), where w is the function that values life duration.
In QALY calculations, the utility of any health state is assumed to be constant, irrespective of the time spent in that state. This means that for a health state valued as better than death (BTD) (i.e., a positive state), with v(q) > 0, longer durations will be preferred to shorter durations; thus, QALY utility u(q, t) will increase monotonically with duration t. On the other hand, if a health state is regarded as worse than death (WTD) (i.e., a negative state), with v(q) < 0, the number of QALYs will decrease monotonically with duration.
On the contrary, if for a health state q preferences for life duration are nonmonotonic, then v(q) is no longer constant and becomes v(q, t), in such a way that the joint utility function u(q, t) cannot be decomposed into a product of separable factors, falsifying multiplicative QALY models.6–9 The phenomenon, known as maximum endurable time (MET), 10 is the paradigmatic example of nonmonotonicity, according to which poor health states can become intolerable to people, in such a way that when confronted with such poor conditions, individuals would like to have a little more time, say weeks or months, to stay alive and say “goodbye” to life, but not much longer. Put in graphical terms, the MET preference pattern can be depicted by an inversed U-shaped QALY utility function with a single peak at a time point (i.e., the MET), beyond which the health state is seen as increasingly intolerable. 11
Nevertheless, and despite that the findings reported by many studies11–15 have been commonly interpreted as supporting the hypothesis of the existence of the MET, there are still various issues that must be elucidated. First, as noted before, MET preferences are just one example of nonmonotonic preferences. Consider, instead of the typical curved pattern of MET preferences, with first upward and next downward sloping sections, just the opposite pattern: that described by a U-shaped curve. This nonmonotonic pattern was predominant among the respondents who were found to violate monotonicity in a study. 16 About 30% of the sample valued WTD increasingly over time, which is contradictory to the conventional MET. Thus, it is worthy to delve deep inside the “map” of diverse nonmonotonic preferences, which is one of the aims of this article.
Second, the disparity between results such as those we have just described above and those found by the majority of the remaining studies “may be due to differences in the way in which MET is assessed across studies” 16 (p. 400). Most studies11–14 have tested MET preferences by means of the comparison of just 1 direct choice between health episodes of type (q, t1) and (q, t2), with t1 < t2, and the implied choice derived from time tradeoff (TTO) assessments for the same episodes. A preference reversal typically arises from this comparison: respondents prefer the episode with the shorter duration when asked directly but assign with the TTO more utility to the episode with the longer duration.
Faced with this disparity, researchers 14 concluded that the preference reversal “hides the MET preferences when values are assessed with the time trade-off task” (p. 495). The explanation given to this preference reversal is attributed to a “rule of thumb” followed by respondents when answering TTO questions, called the proportional heuristic.11,12 In short, this heuristic means that respondents choose a duration in full health as a fixed proportion of the duration in the poor health state. Therefore, health state utility remains roughly constant irrespective of the duration used as a stimulus in TTO measurements, seemingly confirming the QALY model, as if respondents’ preferences were time independent. 13 According to several authors,11–13 the use of this heuristic is driven by scale compatibility. This compatibility effect states that respondents weigh more heavily the stimulus attribute that is more compatible with the response scale, 17 and it is one of the explanations to the so-called “choice-matching” discrepancy.18,19 As in the TTO, if individuals provide life-years as a response, then life duration will receive a larger weight than that for the health state, which could lead to neglect that, because of the poor health state, fewer years should be preferred to more. This fact has led to the claim 11 that, at least for severe health states, the usage of the TTO is not appropriate.
For all the reasons mentioned, this article has 3 objectives: 1) to test unambiguously nonmonotonic preferences by means of a variety of direct choices encompassing an ample set of different health episodes, including death. Since various health episodes are used, we also analyze possible intransitive preference orderings by inspection of the series of direct choices made by respondents. Furthermore, participants in the study also rank the same health episodes, which provides a parallel way to check nonmonotonic patterns. (2) To verify whether the nonmonotonic patterns are a function of severity and/or the type of task used. (3) To test whether preference reversals, in the presence of nonmonotonic patterns, may arise even if no matching task is used. The use of choices and rankings allows us to test potential preference reversals across both tasks. Note that the response scale of the 2 procedures is similar (i.e., choose 1 episode over another or rank an array of them), so scale compatibility should not provoke a discrepancy between both.
The article is structured as follows. The next section describes the experiment conducted to test failures in monotonicity and potential preference reversals between direct choices and rankings of the same set of chronic health outcomes. Results are provided in the third section. A discussion closes the paper.
The Experiment
Participants and Experimental Sessions
Participants were 90 economics undergraduate students who participated for course credits. They were recruited by means of a participation call posted in the teaching digital platform of the University of Murcia. No additional incentives were provided, apart for the course credits.
Each participant attended 3 experimental sessions, 1 to rank-order chronic health episodes (ranking session) and the other 2 to choose between them (choice sessions). The tasks asked in each session were administered by paper-based booklets. The sessions were run by one of the authors in small groups with at most 5 subjects at a time in a behavioral laboratory at the University of Murcia. To avoid order and memory effects, tasks within sessions were randomly assigned to participants, and sessions were separated by 1 wk each. Each session lasted at most 40 min.
Chronic Health Episodes
We used 7 health states based on the EQ-5D-3L classification system. 20 According to this system, health states are described by means of 5 dimensions, each of which can take 1 level out of 3 possible. Table 1 shows the description of the health states, anonymously labeled T–Z.
Description of the EQ-5D Health States
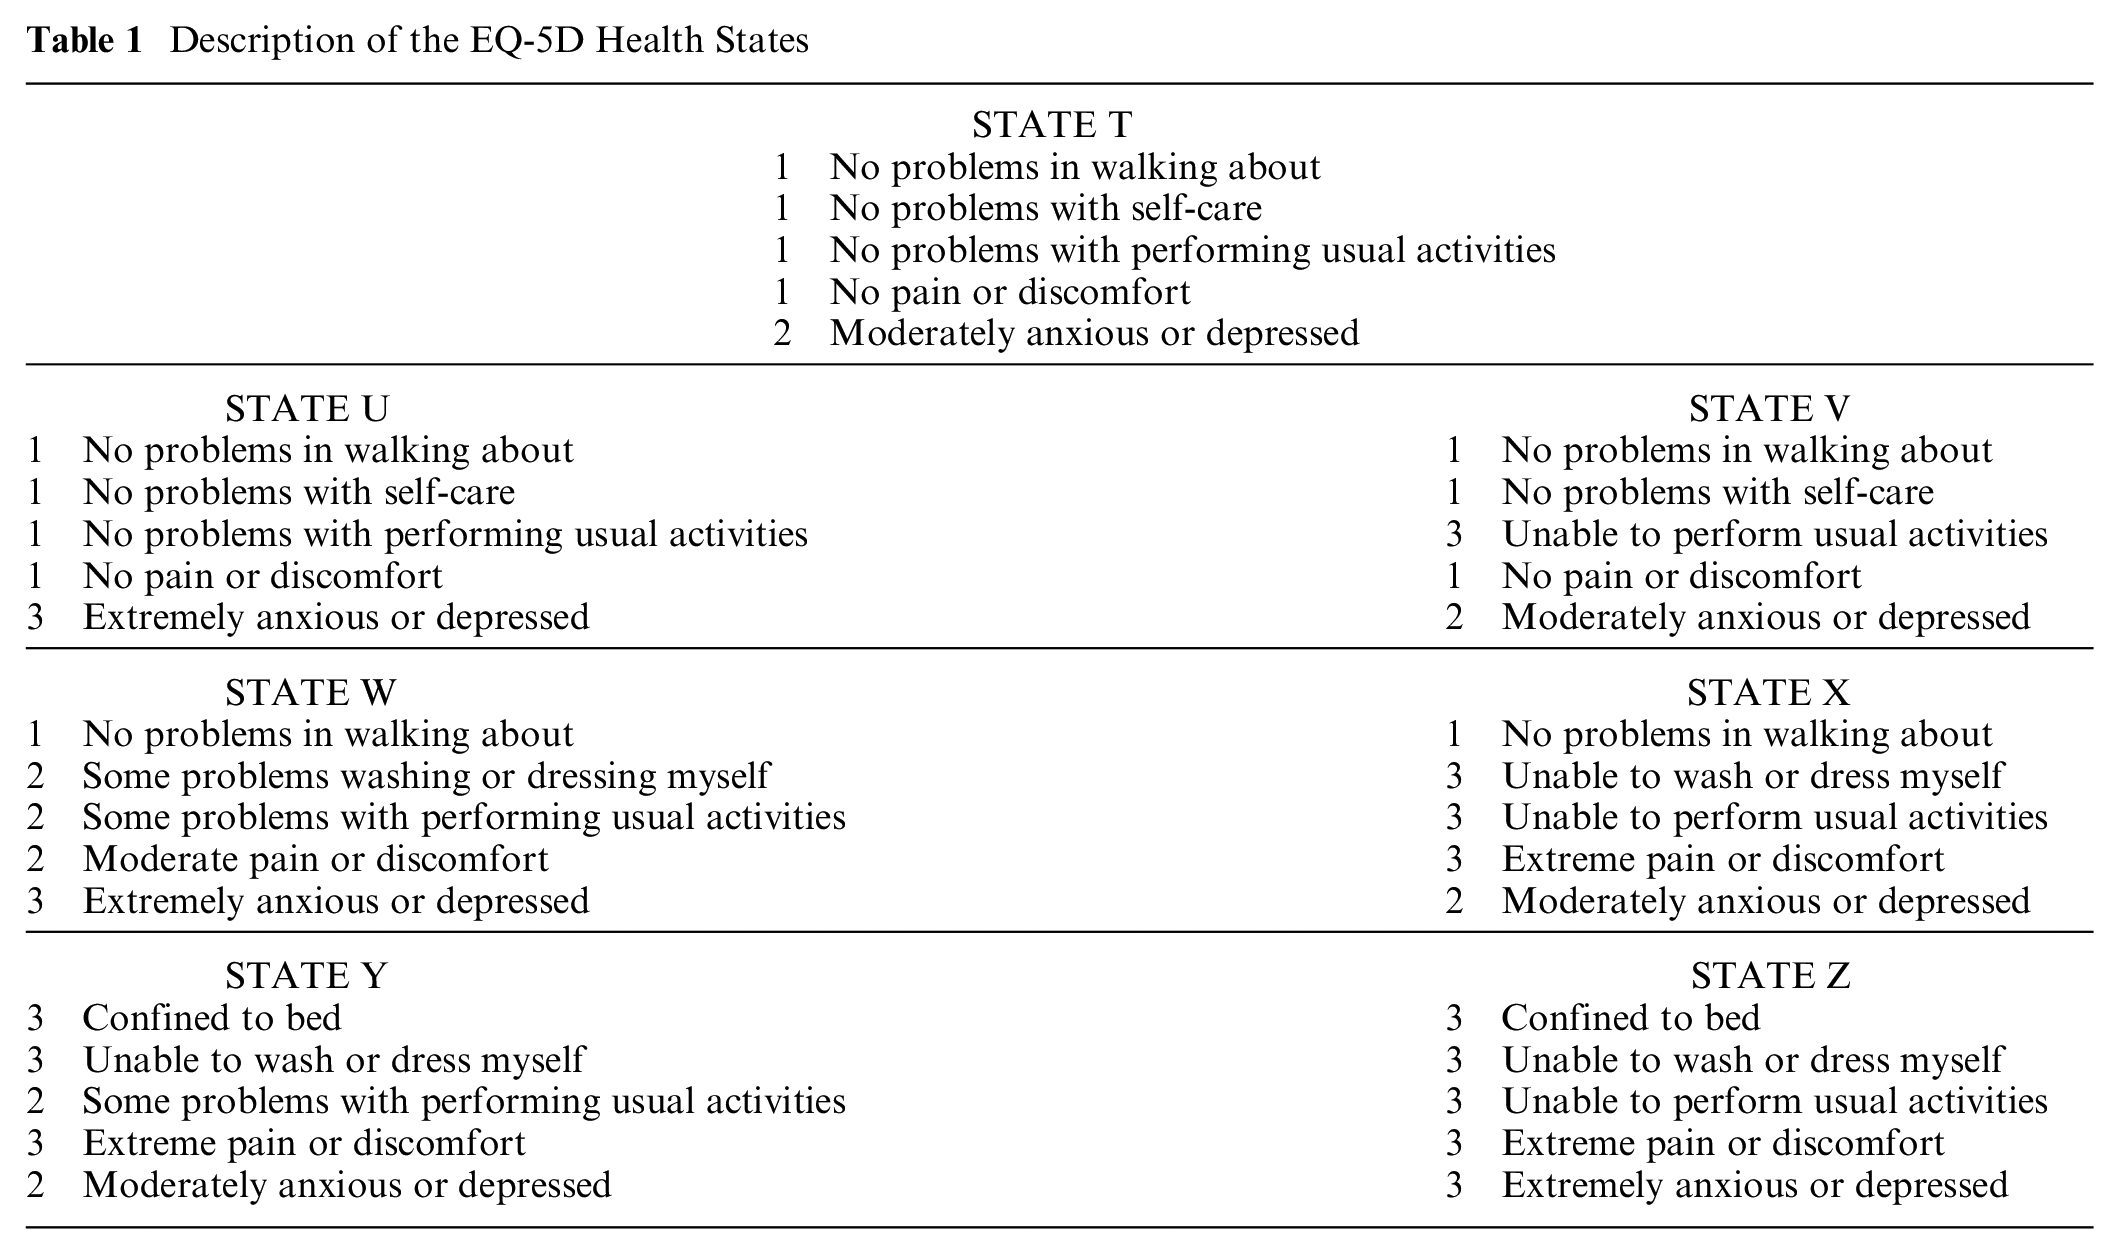
The health states were chosen to cover the range of the value set generated by the EQ-5D-3L algorithm for Spain. 21 According to this algorithm, the values attached to each of the health states are 0.91, 0.54, 0.43, 0.25, −0.14, −0.44, and −0.65 for states T(11112), U(11113), V(11312), W(12223), X(13332), Y(33232), and Z(33333), respectively. Our selection encompasses 1 “very mild” state (11112), 2 “mild” states (11113 and 11312), 1 “moderate” state (12223), 2 “severe” states (13332 and 33232), and the worst possible state that the EQ-5D-3L system can describe (the “pits” state 33333). 22
From the combination of each health state with durations 0, 13, 24, 38, and 57 y, respectively, we obtained the 5 health episodes per state presented to participants. Previous studies investigating MET preferences that have used EQ-5D-3L health states included in their designs durations up to a maximum of 20 y. 15 Scalone et al. 23 argued in favor of using a longer time horizon. For this reason, we included longer durations with a maximum duration of 57 y, so as not to exceed the life expectancy of participants (mean age 20 y). In addition, we intentionally avoided using “round” durations (e.g., 10, 20, 30 y) in an attempt to enhance respondents’ deliberation to compare the different episodes.
Tasks
Prior to the first experimental session, subjects were introduced to the EQ-5D system. In addition, at the beginning of each session, the participants made choices and rankings that could mean preferring less to more years in the same health state. The questionnaires began with a trial question that was checked with participants before starting the experiment.
Seven rankings (1 per health state) of 5 possible durations were obtained from each participant. So, for example, for state T episodes (T, 0 y), (T, 13), (T, 24), (T, 38), and (T, 57) are ranked. Episodes were printed on a set of cards that, to avoid order effects, were distributed at random. Each episode was described by means of a short sentence, for example, “You are living 38 more years in health state T.” To avoid response errors, participants were asked to confirm their rankings. If they did not confirm it, they could change the ordering. We repeated the process until participants did agree with the orderings revealed. After that, participants were asked to fill in a table, where they had to write, for each health state, the position 1 to 5 that corresponded to each duration, from most to least preferred episode.
In the choice sessions, participants were asked to make choices between 2 chronic health episodes. As there are 5 different durations, 10 pairs of health episodes for each EQ-5D health state follow. Overall, each participant made 70 choices (i.e., 10 pairs × 7 health states), evenly distributed across the 2 questionnaires administered in each session. The order in which choices were presented within each questionnaire was random. To avoid response errors, participants were asked to confirm their choices by filling in a table, where they had to write down their choice for every pairwise comparison. The table was made of 4 columns, the first 2 showing the 2 options for each pairwise comparison, under the headings “Alternative 1” and “Alternative 2” (e.g., 24 y in health state U v. 38 y in health state U). The other 2 columns offered 2 possibilities to participants: “I choose Alternative 1” and “I choose Alternative 2.” Respondents had to tick the chosen option. This additional task forced them to check earlier responses.
Analyses
As noted in the introduction, multiplicative QALY models imply that preferences should satisfy monotonicity in duration, which means that for all (q1, t1), (q1, t2) with t2 > t1, either (q1, t2) is “strictly preferred to” (henceforth denoted by the individual strict preference relation
To achieve the first objective of this article, the incidence of nonmonotonic and intransitive preferences was analyzed in 2 ways. On one hand, participants’ responses were classified into one of the different preference patterns observed in the data. That is, we counted the number of participants with nonmonotonic or intransitive preferences for each health state qi and procedure (i.e., choices and rankings). Participants whose preferences were nonmonotonic for at least 1 health state (e.g., a respondent with monotonic preferences for, say, 4 states and nonmonotonic for the remaining 3 states) were classified as nonmonotonic subjects. MET patterns and opposite nonmonotonic patterns (i.e., those revealing that shorter durations in a given health state are ranked as WTD, that is, (T, 0 y)
In addition, we also calculated both the percentage rate P(m) of participants for whom preferences were monotonic and the percentage rate P(non-m) of participants with nonmonotonic preferences, for each health state qi and task. The magnitude of P(non-m) in regard to P(m) gives, in this way, an idea of its relative frequency. The same was done to inspect intransitive cycles in the choice task: percentage rate P(t) of participants for whom preferences were transitive and percentage rate P(i) of participants with intransitive preferences are calculated for each health state as well.
To verify if monotonicity is the most frequent pattern (i.e., the “modal” one), we tested, for each health state qi and task, whether P(m) > P(non-m) holds. Those participants who exhibited intransitive preferences in the choice task for any of the health states were excluded from the test of monotonicity. Monotonocity was tested by using the goodness-of-fit chi-squared test.
To fulfill the second objective (i.e., whether nonmonotonic patterns change depending on the severity and/or the type of task used), we also tested whether the probability of exhibiting nonmonotonic preferences depended on the task by using the nonparametric McNemar test and/or if they depended on the health status by the nonparametric Cochran Q test.
Lastly, the existence of preference reversals (third aim of the article) was analyzed by calculating the percentage rate of preference reversals for each health state as the fraction of people who switch their preference from rankings to choices. That is, respondents who, in a direct choice, preferred the health state with duration ti over the same outcome with a duration tj but ranked a tj duration above a ti duration in the rank-ordering task for the same health state. The rates were computed both with and without participants who yielded any intransitivity.
Results
With regard to the first aim of the article (i.e., to test nonmonotonicity in duration), only 6 participants in the choice task and 1 participant in the ranking task displayed increasing monotonic preferences for all health states. The pattern is “mixed” (i.e., increasing monotonic preferences for some health states and decreasing monotonic preferences for others) for 20 participants in the choice task and 22 in the ranking. It was also found that most participants displayed nonmonotonic MET preferences for at least 1 health state. As can be seen in Table 2, 43 participants (47.8% of participants) behaved according this pattern in the choice task and 64 (71.1%) in the ranking task. There were only 4 participants (1 in the choice task and 3 in the ranking task) describing, for some health state, a nonmonotonic pattern contradictory with MET predictions, reported in Table 2 as the category “Other.” Subjects included in this category were dropped from subsequent analyses.
Preference Patterns for Individuals in Choice and Ranking
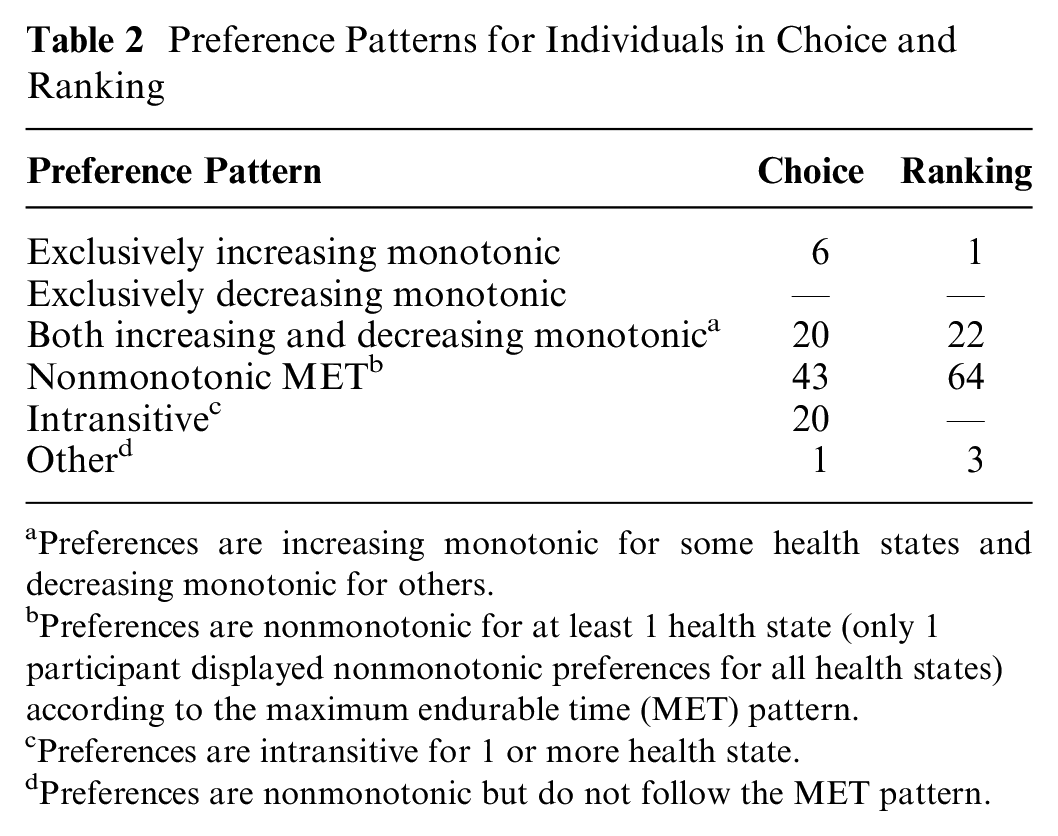
Preferences are increasing monotonic for some health states and decreasing monotonic for others.
Preferences are nonmonotonic for at least 1 health state (only 1 participant displayed nonmonotonic preferences for all health states) according to the maximum endurable time (MET) pattern.
Preferences are intransitive for 1 or more health state.
Preferences are nonmonotonic but do not follow the MET pattern.
Twenty participants made intransitive choices in the choice task at some point. After removing these participants, the percentage rates of nonmonotonic MET preferences in ranking and choice tasks were similar, that is, 66% and 62%, respectively.
Four main points arise from the inspection of Figures 1 and 2. First, percentage rates of nonmonotonic MET preferences ranged from 1.1% (state 11112) to 42.7% (state 13332) under the choice task and from 10.3% to 49.4% (for the same states) under the ranking task. Second, the percentage rate of nonmonotonic MET preferences increased with severity, reaching its maximum for health state 13332. Third, we observe that percentages of nonmonotonic MET preferences were lower for choices than for rankings. Fourth, percentage rates of intransitivities were relatively small. They ranged from 1.1% for health state 11113 to 9% for health state 12223.
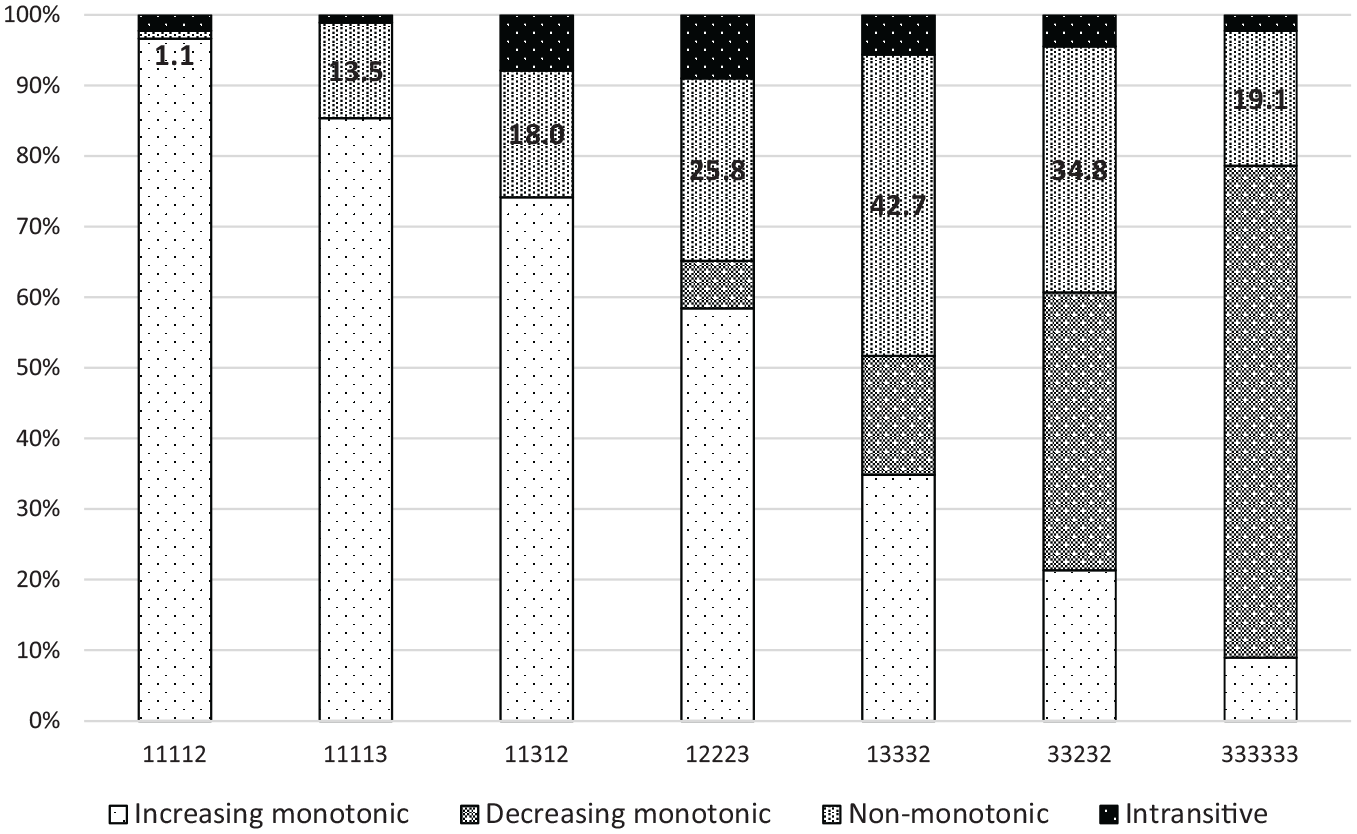
Preference patterns for separate health states, choice task (percent rate) (N = 89)*
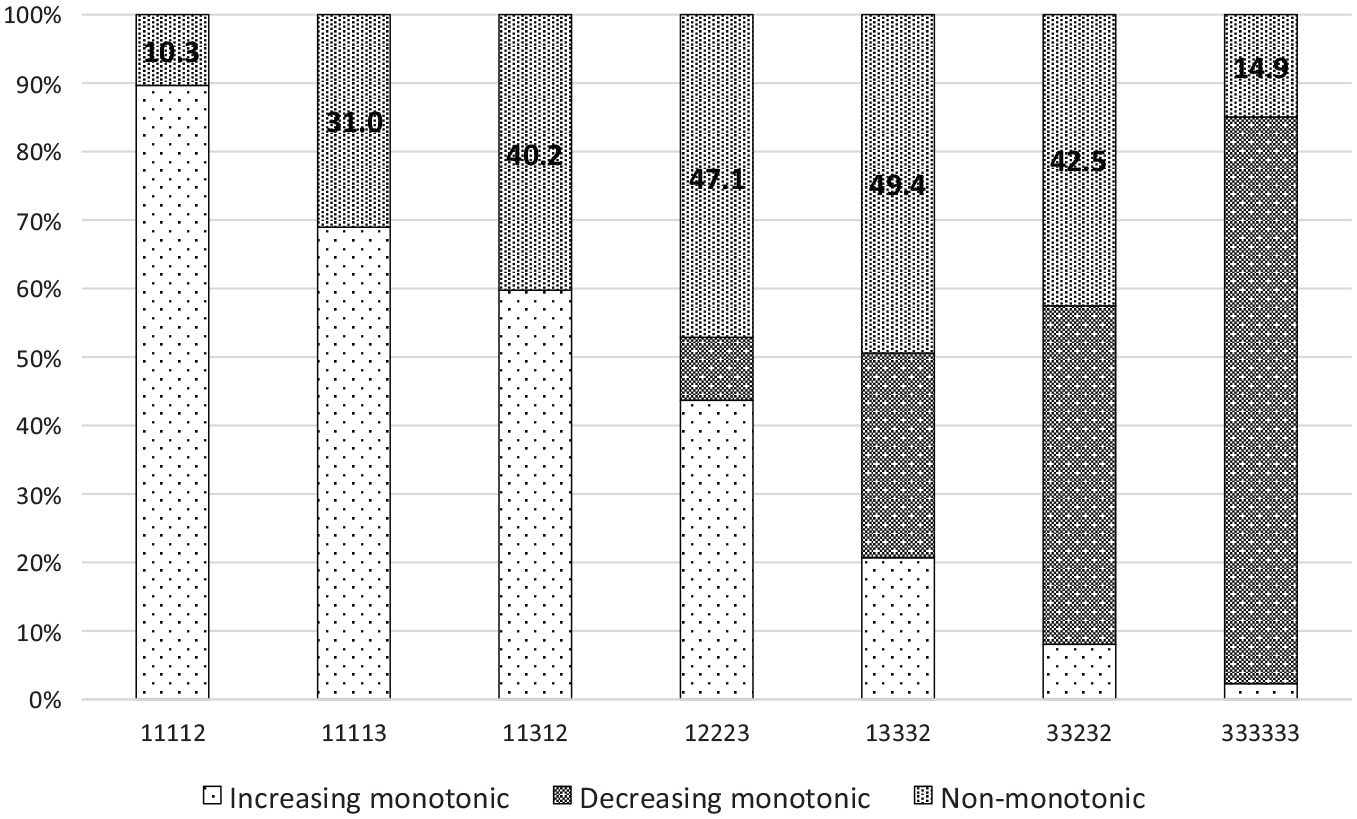
Preference patterns for separate health states, ranking task (percent rate) (N = 87)*
It can be seen that as the severity of health states increases, the number of subjects who prefer longer over shorter durations decreases. In the case of very severe health states (33232 and 33333), preferences are negatively monotonic, since a shorter duration is preferred to longer ones.
After excluding participants with intransitive responses, i we observed that, under the choice task, the rate of monotonic preferences was significantly higher than the rate of nonmonotonic MET preferences in all cases except for health state 13332 (chi-square, P = 0.093); thus, nonmonotonicity is, for that state, almost as likely as monotonicity (39.1% v. 60.9%). Furthermore, although for the remaining states discrepancies between monotonic and nonmonotonic MET percentage rates are statistically significant in the direction predicted by monotonicity, there are important rates of nonmonotonic preferences for health states 12223 and 33232 (i.e., 27.5% and 34.8%).
Results from the ranking task show more robust evidence, contrary to monotonicity in duration. In particular, we did not find significant differences between monotonic and nonmonotonic MET rates for health states 12223, 13332, and 33232 (chi-square, P = 0.337, P = 0.471, and P = 0.092, respectively). The percentage rates of nonmonotonic MET preferences for these states were re 43.5%, 44.9%, and 39.1%, respectively. They were also high for health states 11113 (29%) and 11312 (34.8%), although monotonicity could not be rejected.
With respect to the second objective of this article (i.e., to verify if nonmonotonic patterns are a function of severity and/or task), it is apparent in Figures 1 and 2 that monotonicity was more frequently violated with rankings than with choices. Indeed, we found that the probability of exhibiting nonmonotonic MET preferences was significantly higher in ranking than in choice for health states 11113, 11312, and 12223 by the McNemar test (P < 0.001 in the 2 first cases; P < 0.05 in the third case). In addition, it seems that the probability of occurrence of nonmonotonic MET preferences was not independent of health status (Cochran Q test, P < 0.0001 for both ranking and choice tasks). The percentage rate of nonmonotonic MET preferences increased with severity level from health state 11112 to state 13332, for which the highest rate was reached. Moreover, the inspection of individual responses suggested that the most preferred duration was shorter as the severity increased. In this way, the observation of rankings directly provided by the respondents revealed that 57 y is the most preferred duration for almost 93% of them in the state 11112, decreasing to 71% for state 11113, 65% for state 11312, 45% for state 12223, less than 19% for state 13332, and 7.2% and 1.4%, respectively, for states 33232 and 33333. In parallel, preference for the null duration (i.e., the death) went up as long as severity did, being the most preferred duration for more than 84% of the respondents for state 33333. In other words, the MET moved to the left (i.e., shorter durations) as severity increased.
Lastly, regarding our third objective (i.e., to test preference reversals across tasks), the proportion of preference reversals between the rank ordering and choice tasks was 1.5%, 19%, 24.9%, 33%, 22%, 13.5%, and 6.2% for health states 11112, 11113, 11312, 12223, 13332, 33232, and 33333, respectively. On average, intransitivities explain less than 5% of these reversals. After excluding intransitive subjects, most of the preference reversals occurred because participants preferred a higher over a lower duration in choices (e.g., 57 y
If we go deeper into this general picture, distinguishing between the different preference patterns behind the 2 tasks, we find that the pattern involving monotonically increasing preferences in choices (i.e., 57
In line with the observation noted before that the MET moves to the left as severity increases, the number of respondents judging a health state as WTD in one of the tasks (or in both) also increased, ranging from only 2 for state 11112 to 67 for state 33333, but was distributed asymmetrically between the 2 tasks, which contributes to explaining many of the preference reversals. On average, the frequency with which a health state is regarded as WTD in rankings was 39% higher than in choices. The duration most frequent for which the health state went from being considered better to WTD moved from 57 y (i.e., 38
Discussion
Main Findings
We used 2 different procedures to elicit preferences: choices and rankings. We found that monotonicity was frequently violated in the sense predicted by the MET phenomenon, that is to say, that longer durations were preferred to shorter ones until a switching point (i.e., the MET) was reached. Preference patterns for individuals revealed that violations of monotonicity ranged from about 48% with choices to 71% with rankings. Analysis of separate health states showed that the rate of violations for some health states was near 50% in the ranking task. We observed that violations of monotonicity increased with severity and were higher for the states 12223 and 13332 than for more severe states, such as 33232 and 33333. Therefore, the MET phenomenon appears to affect intermediate health states, rather than extreme states in our study.We found new evidence of preference reversals with 2 choice-based procedures. Percentage rates of preference reversals ranged from 1.5% for health state 11112 to 33% for state 12223. Finally, we also found some (although scarce) evidence on violations of transitivity.
Previous Related Studies
Dolan 24 estimated the EQ-5D tariff based on VAS valuations for 42 EQ-5D states and 3 different durations. The utility estimate for a given health state is a decreasing function of both its severity and its duration, in such a way that even for milder states, utility decreases with duration. This finding contrasts with recent estimations of QALY utilities for different health episodes23,25 that showed that utility declines with duration for severe problems but not for milder and extreme problems, for which utility increases (or disutility decreases) but at a decreasing pace. Our results are in line with these studies, suggesting that extremely bad states are negative over the duration range, just as very good states are positive EQ-5D states, whereas there is a medium range of health states (i.e., moderate and severe ones) throughout preferences that are frequently nonmonotonic.
We found that the percentage rates of nonmonotonicity for health state 13332 were close to those reported by Dolan and Stalmeier 13 for EQ-5D state 21223, the single state they considered. On the contrary, our results suggest that rates of nonmonotonic preferences for health states 12223, 13332, 33232, and 33333 are higher than those reported by other studies11,12 that used only 1 direct choice and 2 TTO questions to test monotonicity in preferences. All of these authors reported preference reversal rates that were significantly higher (ranging from 74% to 86%) than those we found across choices and ranking comparisons. Hence, it seems that the use of 2 tasks with a similar response scale may make preference reversals less substantial although it remains important and systematic. This finding is a novelty in the domain of health outcomes, using health episodes entirely riskless, that adds to previous evidence reported by studies also using choice-based procedures but applied to risky health outcomes.26,27
Robinson and Spencer 16 reported a majority of violations of monotonicity with patterns opposite to that predicted by MET. This evidence comes from the observation of utility estimates for different combinations of durations with EQ-5D health state 23323. Utilities for health episodes were elicited by applying a modified TTO procedure, initially called a “life profile” approach, which later became known as the “lead time” TTO method. 28 As described before, the presence of nonmonotonic patterns distinct from those consistent with MET preferences are scarce in our data. The only 4 violations of monotonicity reported in this article in a direction contrary to that predicted by MET seem to be respondents’ mistakes rather than true preferences. Therefore, previous MET findings are consistently supported by the data analyzed here, with the added value that they have been checked via simple preference questions, without using any variant of the TTO. Moreover, the evidence reported in this article encompasses a wide severity range, including 7 different EQ-5D states and not only 1 state, as Robinson and Spencer 16 used.
The study conducted by Stalmeier et al. 15 is, to the best of our knowledge, that closest to ours. The authors used 2 series of direct choices to test MET preferences: on one hand, choices between a health state of a specified duration and death, and, on the other hand, choices between 2 identical states of different duration. Proportions of individuals with preferences consistent with MET predictions were similar with both types of choices, occurring more frequently for severe health states. The percentage rates of nonmonotonic preferences reported in their article did not exceed 30% for any of the 5 EQ-5D states they considered, whereas we found rates higher rates for some states. Nevertheless, the qualitative picture is similar in the 2 studies, although nonmonotonic preferences were more frequent in our data. Note that experimental protocols, the nature of the sample, and the set of health states were different in both studies.
As Miyamoto et al. 3 asserted, the phenomenon of MET for a given health state constituted a basic counterexample to the multiplicative QALY model. Our data clearly show that the time point of the MET moves to the left as the severity increases, therefore indicating that QALY utility functions for life durations have a different curvature with respect to different health states, something that contradicts mutual utility independence between life duration and quality of life. A complementary result was reported by Attema and Brouwer, 9 who found stronger discounting of WTD states than BTD states, which also contradicts the multiplicative QALY model.
Preference reversals observed in this article are particularly troubling, because they cannot be explained by compatibility effects, such as those concerning the usual “choice-matching” discrepancy reported between direct choices and TTO responses. 11 Thus, a choice-ranking discrepancy arises from our data, similar to that previously identified by Bleichrodt and Pinto 26 for risky treatments. The different domain of the health outcomes used in their study (risky) and ours (riskless) makes that explanation to preference reversals hypothesized by these authors (i.e., anticipation of disappointment and elation in risky choice) not valid for our data. Although intransitive preference ordering has been suggested as an explanation for the classical choice-matching discrepancy, 29 later evidence suggests that intransitivity is likely to explain only 10% to 20% of the phenomenon. 30 Our data also support this observation for preference reversals between choice and ranking, since intransitivity hardly explains 5% of them.
A possible explanation for our findings can be the so-called evaluability hypothesis. 31 According to this hypothesis, the way in which attributes are evaluated, separately or jointly, provides different information to subjects, which may lead to preference reversals. In our experiment, the durations for each health state are compared together (joint evaluation) in rankings whereas they are compared head to head (something closer to a separate evaluation) in pairwise choices; thus, a preference reversal might arise between these 2 different “evaluation” modes. The joint evaluation of health episodes can make respondents more conscious of the interaction between duration and health state, whereas a separate evaluation can obscure that relationship, making duration more salient. In this way, nonmonotonicity would be more frequent in ranking than in choice, as our results reveal.
Limitations
This study is not exempted from limitations. First, assuming that, in general, students are in good health, their perception of the severity of a hypothetical poor health state may differ from that of older (i.e., less healthy) people because they never experienced adaptation to a health problem. Other objections may concern the sample size used, although it is larger than others used in some previous studies.12–14,32 Participants in our experiment did not receive financial compensation. Instead, participation in the experimental sessions was rewarded with course credit. Although it would be interesting to check if results are robust to changes in compensation, we do not believe that financial motivation may change our findings. 33 On another note, indifferences between outcomes were not allowed. Hence, some choices might be forced, and this might yield random error. However, with random choices, one would expect a 50% rate of nonmonotonic preferences for mild and severe health states alike. On the contrary, we found that violations of monotonicity depend on the severity of the health status.
Another objection could be that the health episodes used were too simple, inducing easily salience-based decision. However, if this had been the case, we believe that there would not have been so many violations of monotonicity as we observed. Likewise, it could be argued that participants in our experiment might have found it hard to perceive living for very long durations. For this reason, analyses were carried out after leaving out the 57-y duration. Rates of nonmonotonicity decreased for all health states, although nonmonotonic preferences persisted systematically. Lastly, we cannot discard that the inclusion of (positive) durations shorter than 13 y, say 1 y or even just a few months, could have led to a larger rate of MET preferences. In this respect, the evidence reported in this article might be seen as a lower bound of the phenomenon of nonmonotonicity in life duration.
Implications
From our study, it can be inferred that the MET phenomenon may particularly affect those EQ-5D health states that are in the middle of the severity scale. Therefore, it may be necessary to explore the role of nonmultiplicative models to describe nonmonotonic interactions between duration and health quality. Furthermore, in a line similar to previous studies suggesting how problematic the TTO can be in the presence of MET preferences,11,13,34 our findings signal that this method may be unable to deal with those intermediate health states for which more nonmonotonicity is observed. Very severe states seem to be often perceived as WTD for durations such as those used in this study, so the “negative” framing of the TTO (or also the “lead time” TTO) can reflect the underlying preference of the individuals. However, it cannot be equally suitable for moderate states, for which respondents’ preferences are not uniform but rather switch with the duration.
Our findings on preference reversals are troubling because choices and rankings have many similar features.19,35 However, in our data, nonmonotonic preferences seem to be more likely in rankings than in choices. We hypothesize that this choice-ranking discrepancy may be due to the different evaluation mode (joint v. separate) induced in each task. So, future research should test this hypothesis by, for example, comparing a choice-based ranking task, 26 according to which respondents are asked to choose the most preferred health episode, next the second one, and so on, to a conventional ranking. In addition, it would be interesting to confront respondents with their choices and rankings and ask them the reasons why they have performed such preference orderings and, moreover, which of the 2 tasks best represented their preference ordering. 36
Footnotes
Acknowledgements
The authors are very grateful for all the suggestions and comments received from the reviewers of the article. They have made a decisive contribution to enriching the manuscript. The authors also acknowledge administrative support given by administrative staff of the Faculty of Economics and Business of the University of Murcia (Spain).
The authors declared no potential conflicts of interest with respect to the research, authorship, and/or publication of this article. The authors disclosed receipt of the following financial support for the research, authorship, and/or publication of this article: Financial support for this study was provided entirely by a grant from the Spanish Ministry of Economy, Industry and Competitiveness, grant PID2019-104907GB-I00, and a grant from the Seneca Foundation (Science and Technology Agency of the Region of Murcia), grant 20825/PI/18. The funding agreement ensured the authors’ independence in designing the study, interpreting the data, writing, and publishing the report.