
Abstract
Background
Compartmental infectious disease (ID) models are often used to evaluate nonpharmaceutical interventions (NPIs) and vaccines. Such models rarely separate within-household and community transmission, potentially introducing biases in situations in which multiple transmission routes exist. We formulated an approach that incorporates household structure into ID models, extending the work of House and Keeling.
Design
We developed a multicompartment susceptible-exposed-infectious-recovered-susceptible-vaccinated (MC-SEIRSV) modeling framework, allowing nonexponentially distributed duration in exposed and infectious compartments, that tracks within-household and community transmission. We simulated epidemics that varied by community and household transmission rates, waning immunity rate, household size (3 or 5 members), and numbers of exposed and infectious compartments (1–3 each). We calibrated otherwise identical models without household structure to the early phase of each parameter combination’s epidemic curve. We compared each model pair in terms of epidemic forecasts and predicted NPI and vaccine impacts on the timing and magnitude of the epidemic peak and its total size. Meta-analytic regressions characterized the relationship between household structure inclusion and the size and direction of biases.
Results
Otherwise similar models with and without household structure produced equivalent early epidemic curves. However, forecasts from models without household structure were biased. Without intervention, they were upward biased on peak size and total epidemic size, with biases also depending on the number of exposed and infectious compartments. Model-estimated NPI effects of a 60% reduction in community contacts on peak time and size were systematically overestimated without household structure. Biases were smaller with a 20% reduction NPI. Because vaccination affected both community and household transmission, their biases were smaller.
Conclusions
ID models without household structure can produce biased outcomes in settings in which within-household and community transmission differ.
Highlights
Infectious disease models rarely separate household transmission from community transmission. The pace of household transmission may differ from community transmission, depends on household size, and can accelerate epidemic growth.
Many infectious disease models assume exponential duration distributions for infected states. However, the duration of most infections is not exponentially distributed, and distributional choice alters modeled epidemic dynamics and intervention effectiveness.
We propose a mathematical framework for household and community transmission that allows for nonexponential duration times and a suite of interventions and quantified the effect of accounting for household transmission by varying household size and duration distributions of infected states on modeled epidemic dynamics.
Failure to include household structure induces biases in the modeled overall course of an epidemic and the effects of interventions delivered differentially in community settings. Epidemic dynamics are faster and more intense in populations with larger household sizes and for diseases with nonexponentially distributed infectious durations. Modelers should consider explicitly incorporating household structure to quantify the effects of non-pharmaceutical interventions (e.g., shelter-in-place).
Keywords
Compartmental infectious disease (ID) dynamic transmission models are often used to quantify benefits from interventions intended to mitigate and control respiratory IDs. However, they may fail to provide accurate forecasts or estimates of intervention effects due to simplifications they necessarily make regarding mixing and transmission patterns, rarely separating transmission within households from community transmission. Empirical evidence from a range of respiratory IDs suggests that within-household transmission can be substantially more intense than community transmission.1–4 While dynamic transmission microsimulation models with explicit contact networks avoid the need to make this simplification, they can be computationally intensive, especially when modeling large populations, and extensive data are required to parameterize their contact networks.
As a feasible alternative, past work developed approaches for explicitly incorporating household transmission into compartmental susceptible-infected-recovered (SIR) models. 5 In SIR models, household size and transmission affect the dynamics of outbreaks, including infection incidence, with the time course and level of the overall epidemic depending on how household and community transmission differ and on household sizes. 6 Furthermore, the effects of nonpharmaceutical interventions (NPIs) predicted with a SIR model that does not separately model household transmission can differ if, for example, an NPI (e.g., business closures) reduced community contacts differently than household contacts as was shown using mobility and collocation data early in the COVID-19 pandemic.7–9
The utility of this past work could be substantially increased if the approach were extended to more complex compartmental models. Sometimes it is necessary for realism to implement multicompartment susceptible-exposed-infected-recovered (SEIR) models of open populations and to include symptomatic infections, case detection, venue-specific transmission, and combinations of NPIs and vaccination. 10 For example, when the Mexico City metropolitan area faced risks of COVID-19 outbreaks, using a network microsimulation model of its population of almost 20 million would not have been feasible, but the compartmental model used for this epidemic required many of these characteristics. 11
Our study extends the mathematical framework for the household and community transmission model based on House and Keeling’s work to include more complex compartmental models and a suite of interventions. We illustrate the relevance of these extensions by showing how failure to incorporate household transmission into more complex compartmental models in settings where community and household transmission differ can bias epidemic predictions and intervention effect estimates. Furthermore, we characterize the systematic ways this exclusion biases such outcomes and depends on household size in conjunction with other model features. While all models are wrong in the sense that they simplify reality, decision-analytic models are most useful when they capture dynamics relevant to the decisions that they are used to consider; hence, we are not arguing that explicit modeling of household structure is always required but rather that it is often needed and useful when community and household transmission differ. To this end, we provide an open-source implementation of this extension, facilitating its use by other analysts and incorporation into their models.
Mathematical Framework for Community and Household Models
SIR to MC-SEIRSV with Interventions
The epidemiology of many IDs can be described as a multicompartment susceptible-exposed-infected-recovered-susceptible-vaccinated (MC-SEIRSV) model with demography.
10
In the model, exposed
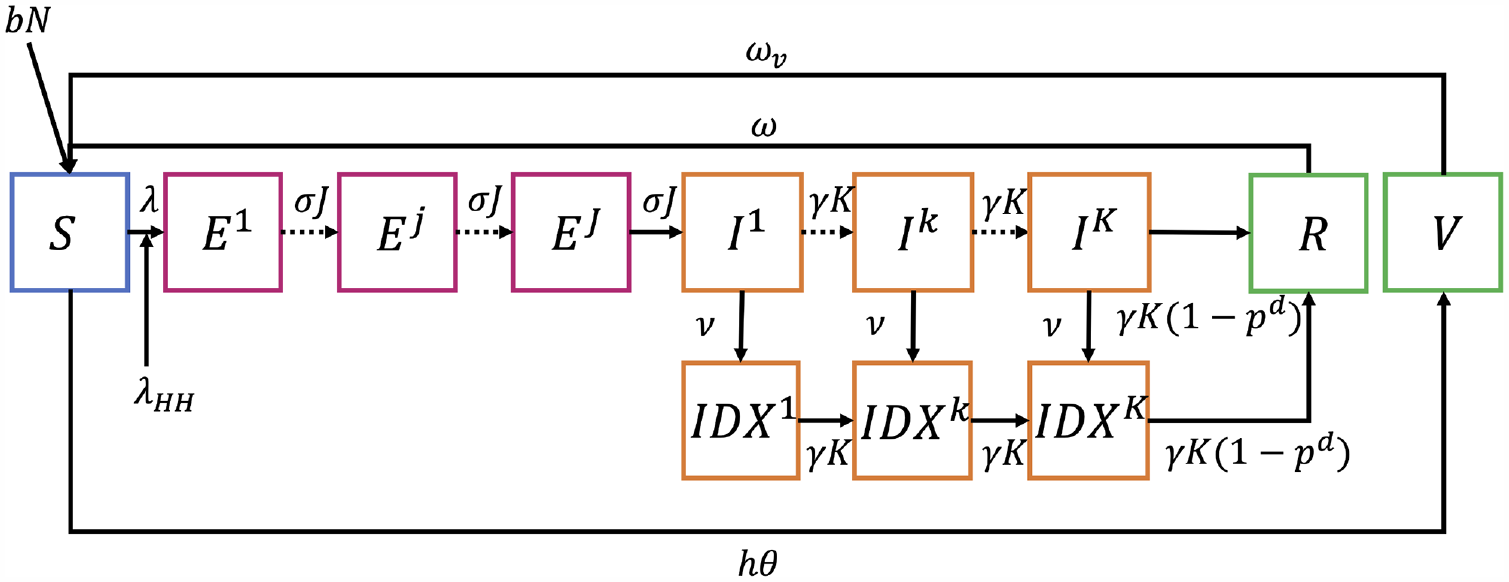
Generalized model diagram. Not shown in the figure is death from other causes at a rate
The full model encompasses multiple disease, demographic, and intervention processes. People are born into the susceptible compartment
To capture the dynamics of many ID epidemics, including COVID-19, it is important to consider both community and household transmission. 12 We term the model’s components described until now the “community submodel” (i.e., the nonhousehold components) to differentiate them from the “household submodel,” described below.
In brief, the household submodel acknowledges that people are generally embedded within households, implying that 1) once a given household’s members are all infected and/or recovered, no further transmission occurs within that household without waning or births or other household entries, and 2) if households are not entirely isolated from one another such that community transmission is still occurring, the interaction between the susceptible and infectious individuals within the household can drive additional community transmission via the within-household force of infection (FOI),
To describe overall transmission dynamics in the population, we first describe transmission in the community submodel, then the key elements of the household submodel, and how the household submodel’s transmission is integrated into the community submodel.
Community Submodel with Transmission from the Household FOI
The community MC-SEIRSV model consists of a system of ordinary differential equations (ODEs; see Appendix A.1.1).
FOI
The FOI governs the transmission of infection within a population, defined as the instantaneous per-capita rate at which susceptibles acquire infection. FOI reflects the degree of contact between susceptibles and infectious individuals and the pathogen’s per-contact transmissibility. Because contacts can occur in the community and within a household, we construct community- and household-specific FOIs. The community FOI,
Interventions Affecting the FOI
The model incorporates 2 epidemic control interventions: NPIs and vaccination. NPIs reduce the community FOI by a value
Household Submodel
As with House and Keeling,
5
the household submodel tracks the proportion of households whose members are in various states of the disease’s natural history. For example, in a given population at a given time, 5% of all 3-person households might have 1 member susceptible and 2 members recovered
The number of distinct
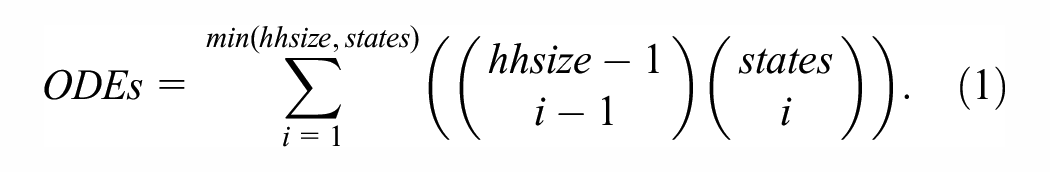
The above equation is based on a sum of products of combinations of partitions. The first combination operator in the equation gives the number of unique partitions of a given household size
To keep the number of household types and differential equations manageable, we assume that all households are the same size as the average household for a given population, rounded to the nearest whole integer.
We ensure that the household and community submodels’ initial states are consistent. For a given total population size at the start of the community submodel
The household submodel’s dynamics include progression, recovery, waning immunity, vaccination, within-household and community-household transmission, births, and deaths. Modeling many of these dynamics in the household submodel is somewhat more complicated than in the community submodel because the household submodel tracks the fraction of households in a set of discrete states characterized by counts of members in each community MC-SEIRSV model state.
The following example provides the intuition of how the household submodel handles progression and recovery. To simplify the exposition, we ignore the multicompartment nature of the exposed and infectious states and consider only progression. If there are 4 household members (1 susceptible, 3 exposed, 0 infectious) at a given time, then it is possible that 0, 1, 2, or all 3 of the exposed members will progress to infectious on a given day. Hence, the possible states that this household could be in on the next day include either (1 susceptible, 3 exposed, 0 infectious), (1 susceptible, 2 exposed, 1 infectious), (1 susceptible, 1 exposed, 2 infectious), or (1 susceptible, 0 exposed, 3 infectious). In this example, the frequency of households moving to each state follows a binomial distribution with the probability related to the rate of progression
Models of counts of household members where
Household FOI
There are both within-household and community-household transmission routes in the household submodel. Within-household transmission involves infectious household members infecting susceptible household members. Community-household transmission involves infectious individuals in the community (i.e., no nonhousehold members) infecting susceptible household members.
Within-household transmission is related to 1) the current number of infectious household members
The household FOI,
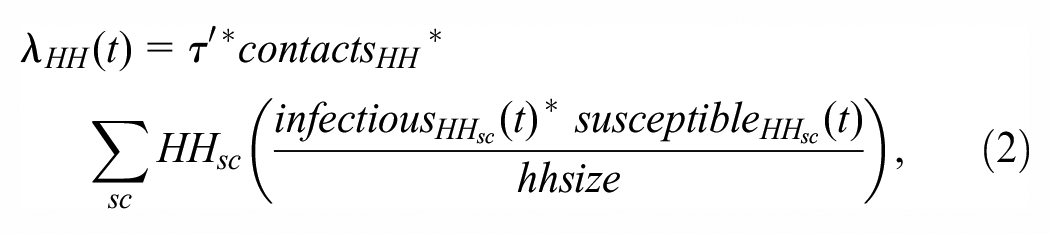
which is the weighted average of within-household transmission (higher where there are more infectious and susceptible individuals simultaneously present in the household), where the weight is the fraction of households with these counts of infectious and susceptible members. The rate of infections generated by household transmission,
Simulations and Analyses
To illustrate the value of our community-household modeling framework, we analyze its predictions compared with models that do not differentiate household and community transmission. Specifically, we perform analyses to assess how not including household transmission in more complex compartmental models can alter both predictions of epidemic outcomes and intervention effects. Outcomes include the cumulative epidemic magnitude along with the timing and height of epidemic peaks and how these are changed through interventions. As we are interested in situations in which household and community transmissions differ, we characterize systematic relationships between the size and direction of outcome biases and the population’s average household size in conjunction with other model features and parameters. We employ a design-of-experiments approach, simulating outcomes across a range of household sizes, numbers of exposed and infectious compartments, transmission and recovery patterns, and in the presence/absence of various interventions. We use meta-analytic regressions to characterize the patterns of bias across the model simulations.
Interventions
We use a set of stylized interventions to carry out our analyses. We consider higher and lower levels of contact reductions via NPIs and different levels of vaccine coverage and vaccine effectiveness. NPI effectiveness
Outcomes
We focus on 3 model-generated outcomes,
Effectiveness of Control Measures
We analyze the outcomes and the effects of control measures on them. We define each control measure’s effectiveness

Control measures generally reduce the number of cases; hence,
Calibration for Bias Assessment
We evaluate how failure to include household size and other features in the model produces a bias in model outcomes and estimated control measure effects. We sought to enable an interpretable comparison of otherwise similar models that differ only by their inclusions/exclusion of household transmission. Specifically, we imagined an analyst in the early days of an epidemic deciding whether to include household transmission in a dynamic model for epidemic forecasting and considering interventions and their potential effects. If the truth is that household transmission occurs and a household structure should be included, how much and what kinds of biases occur in modeled outcomes if the household transmission is omitted?
Hence, for each combination of the number of exposed compartments, number of infectious compartments, household sizes greater than 1 (i.e., models with household structure), household transmission rate, community rate, and waning rate in Appendix Table A1, we generate an epidemic trace of incident daily infections for the first 15 d of the epidemic in the absence of interventions. For each combination, we then instantiate a corresponding model with the same parameters except that it had no household transmission (
We use the corresponding pairs of models (those with and without household transmission that have the same epidemic trace for the first 15 d) to assess how predicted outcomes and intervention effects might be biased. We quantify the bias as the absolute or percentage change in a given control measure’s effectiveness as predicted with a model that includes both community and household transmission

If the effect of an intervention is a reduction in an outcome (e.g., total infection days, peak infections, etc.), then an absolute positive bias implies that the estimated effectiveness of control measures is smaller when the household transmission is not included (i.e., underestimated effectiveness). If the effect of an intervention is to increase an outcome (e.g., life expectancy, time to epidemic peak, etc.), then an absolute positive bias implies that the estimated effectiveness is larger when the household transmission is not included (overestimated effectiveness).
Design of Experiments
We use a meta-analytic regression approach relating epidemic outcomes and biases to household size, numbers of exposed and infectious compartments, and community and household transmission rates. The regressions also include 2-way interactions between household size and the number of exposed and infectious compartments, allowing for nonlinear relationships.
For epidemic outcomes in the absence of intervention, we estimate the regressions for each outcome based on a set of parameter values generated following a full factorial design of experiments (DoE; Appendix Table A1).14,15
We use the same general approach (i.e., DoE design and meta-regression) for intervention effects. We focus on the intervention effects of NPIs that would be differentially delivered in communities versus households (e.g., business closures) without vaccination. In supplementary analyses, we consider vaccination in the absence of NPIs.
Results
Household Structure and Calibrated Model Parameter Values
Otherwise, similar models with and without household structure can produce equivalent early epidemic curves across a broad range of disease parameters. However, this does not guarantee that their longer-term epidemic projections or projected intervention effects will be similar. With otherwise similar modeling choices at the beginning of an outbreak, models that do not include household structure calibrated to the initial period’s rise in infection prevalence correspond closely to otherwise similar models with a household structure for our study’s 648 natural history parameter combinations. Calibrations of all models lacking household structure converged, producing epidemic curves whose daily prevalent infections differed from corresponding models with household structure by 1% on average and all ≤2.25%. For all parameter combinations, calibrated models without household transmission had higher community transmission rates
Impact on Model-Predicted, Longer-Term Natural History
Failure to include household structure can cause modeled longer-term epidemic natural history to differ from otherwise similar models across a broad range of disease parameters. Figure 2 shows the natural history epidemic curves for an exemplar parameter set for which we systematically varied the number of exposed and infectious states. For this example, with household size = 3, when the household structure is not included, the model’s epidemic curve peak is higher, earlier, and drops sooner than the model that includes household transmission. The differences appear slightly larger when there are multiple
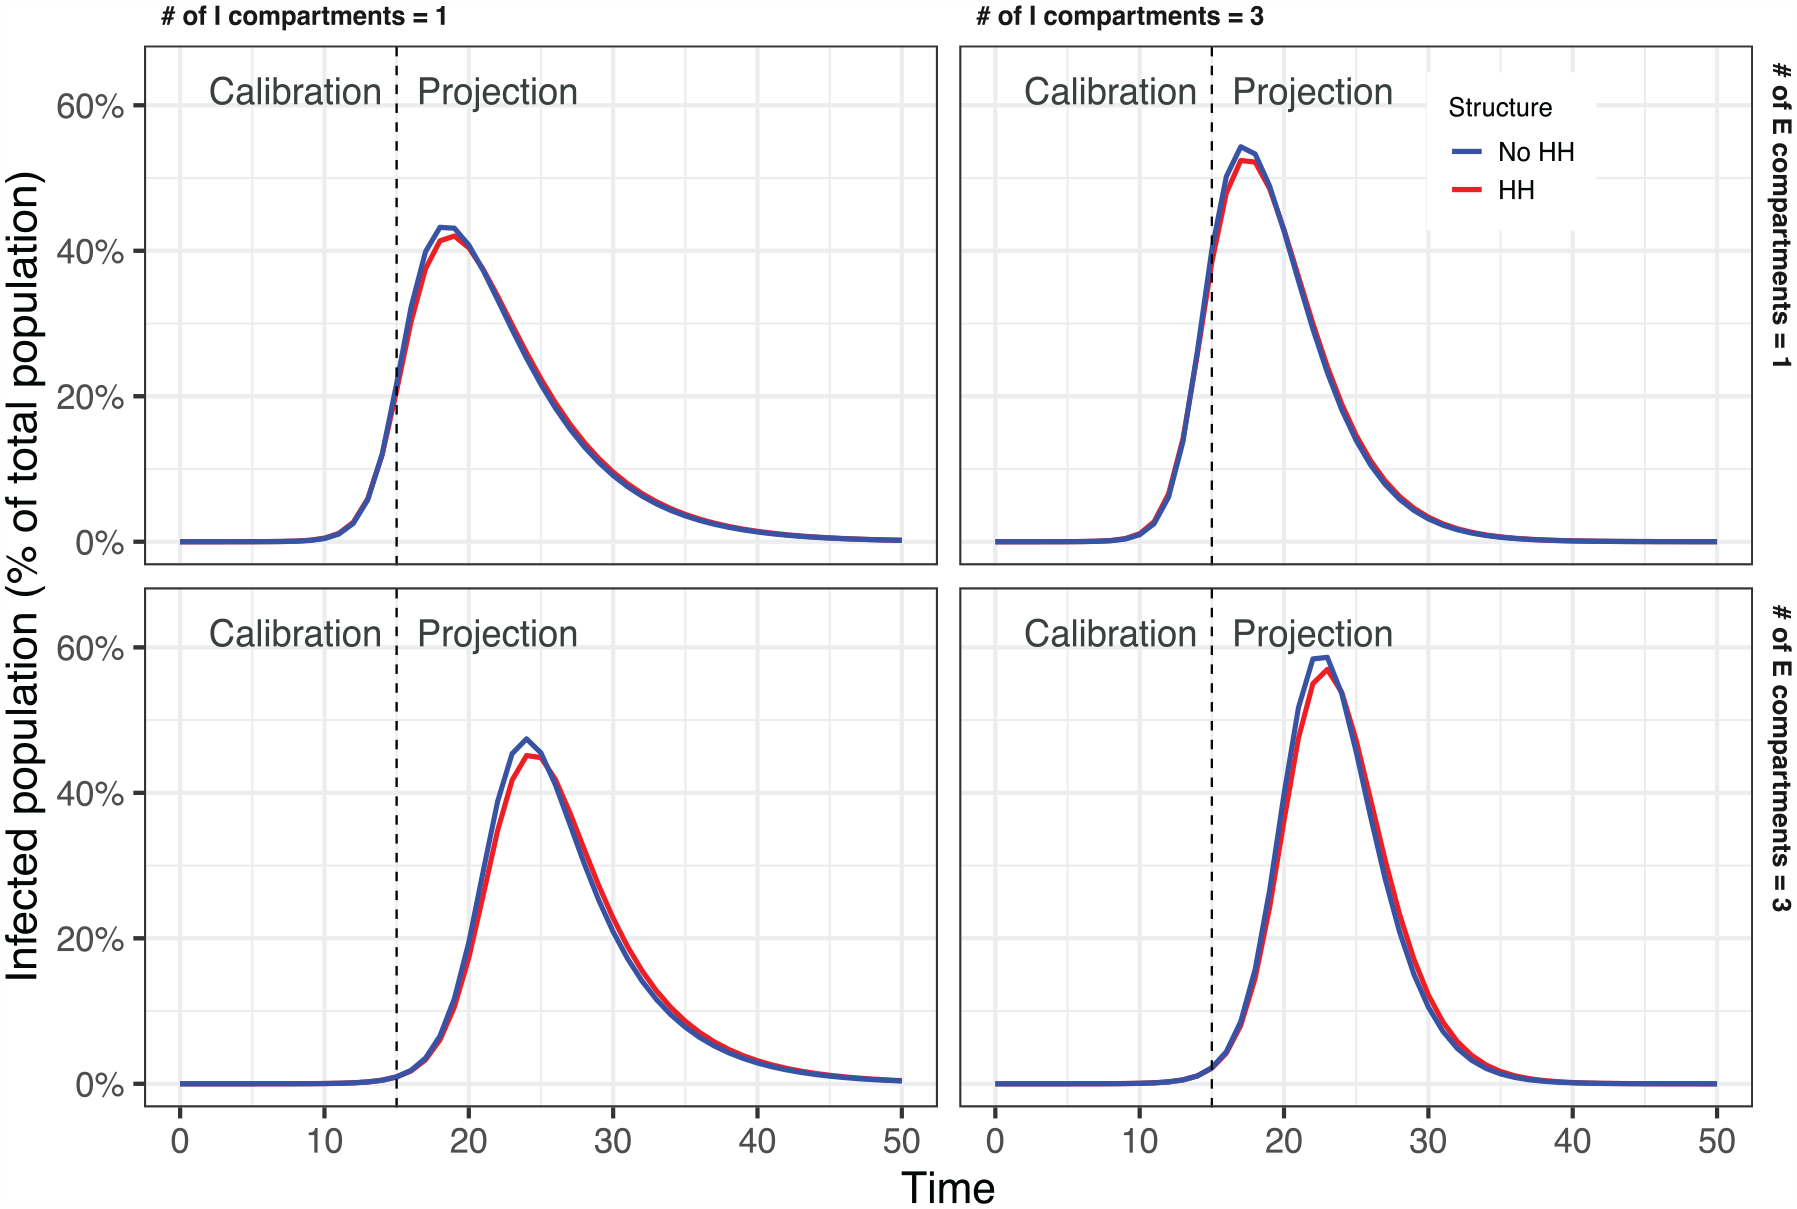
Natural history epidemic curves.
Using meta-analytic regressions to examine outcomes without intervention, we found that, on average, excluding household structure did not significantly affect peak time. However, the trend was toward having slightly later peaks with larger household sizes. The epidemic peak was approximately 25,000 people larger (5% larger) than the epidemic peak size when the household structure was excluded for a setting with a true household size of 3 or 5. The total epidemic size over 100 d was approximately 60,000 larger (1.2% larger) than the total epidemic size when the household structure was excluded, and the true household size was 3 (approximately 57,000 larger [1.1% larger] if the true household size was 5; Table 1). The magnitude of the differences, particularly for peak size, varied slightly depending on the number of exposed and infectious states; the more
Meta-Regression Estimates on Absolute Differences in Outcomes of Excluding Household Structure in the Absence of Intervention a
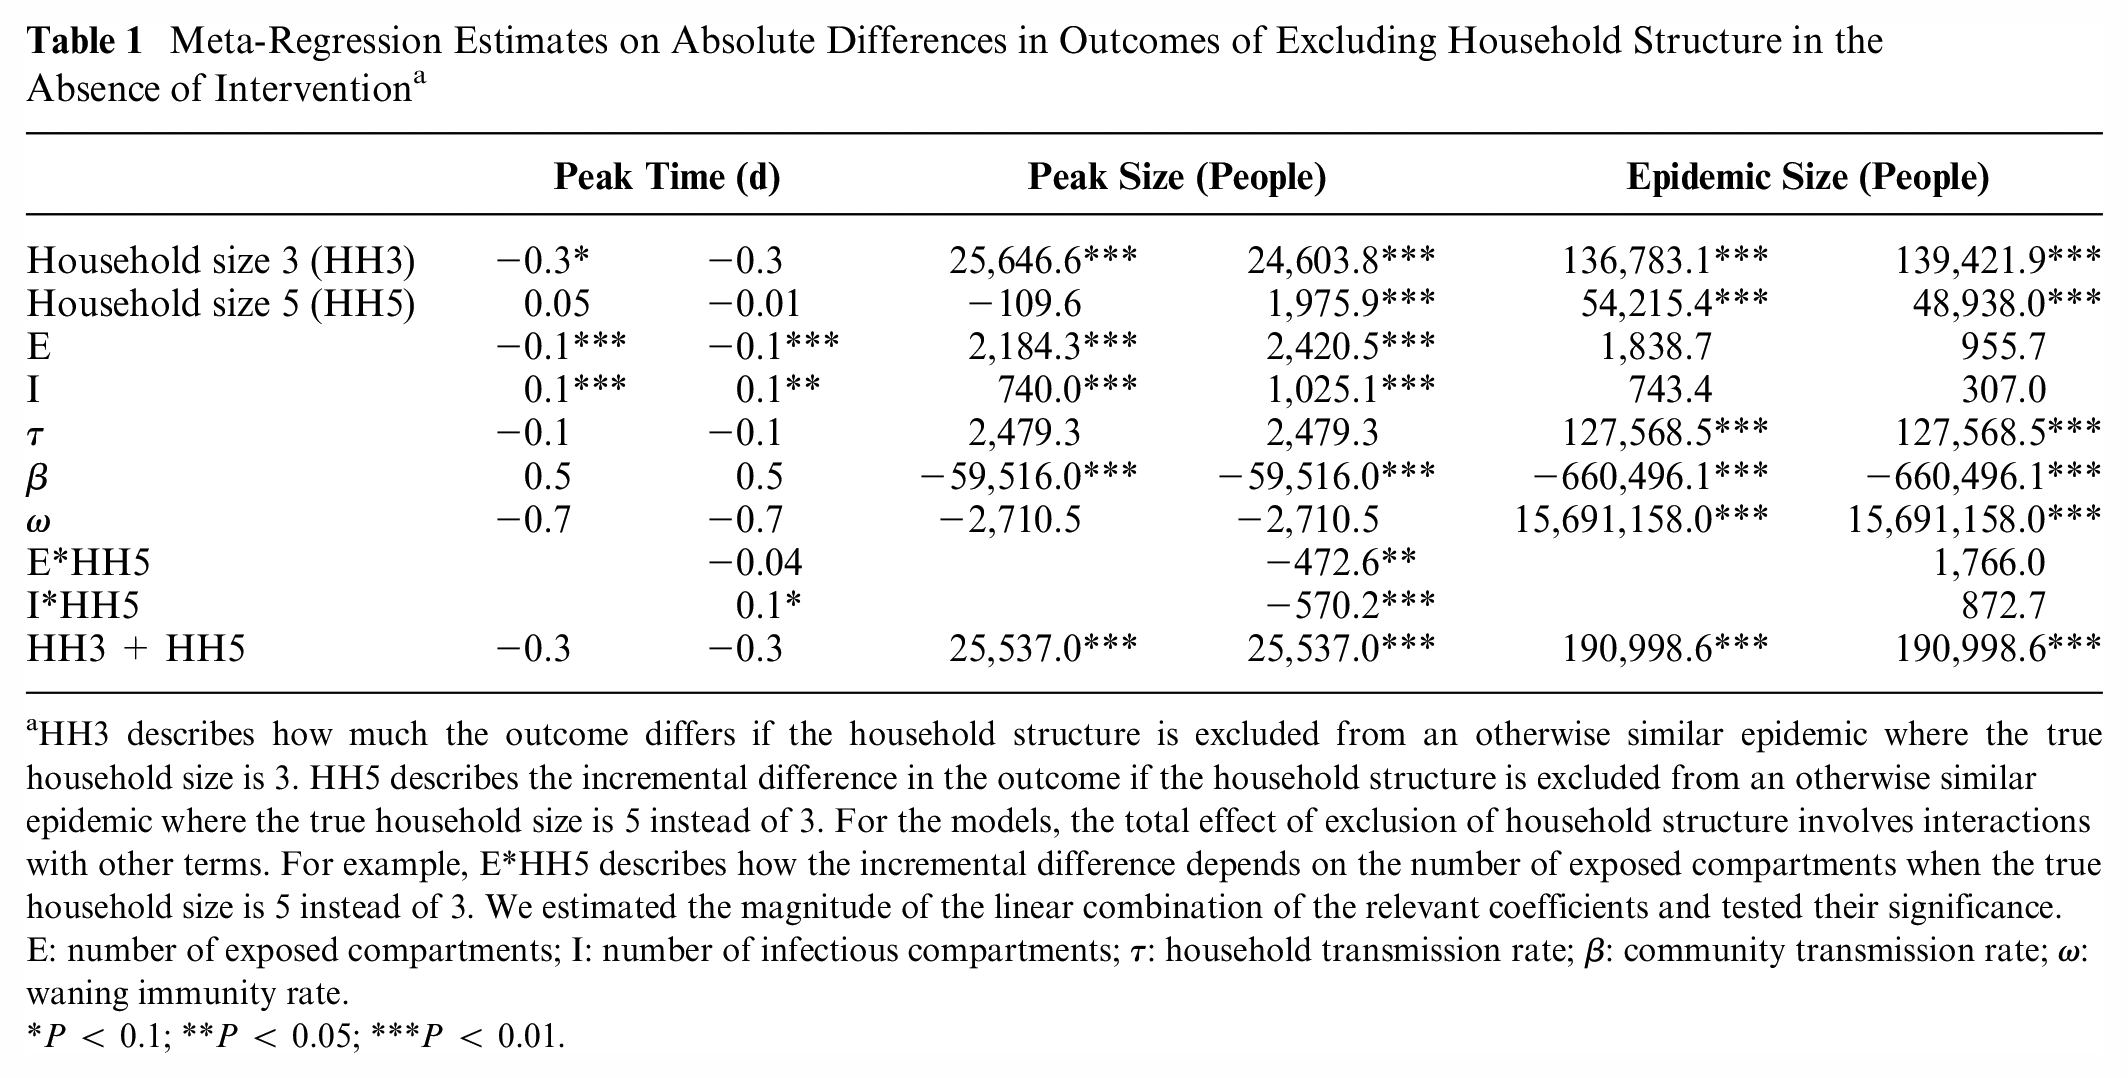
HH3 describes how much the outcome differs if the household structure is excluded from an otherwise similar epidemic where the true household size is 3. HH5 describes the incremental difference in the outcome if the household structure is excluded from an otherwise similar epidemic where the true household size is 5 instead of 3. For the models, the total effect of exclusion of household structure involves interactions with other terms. For example, E*HH5 describes how the incremental difference depends on the number of exposed compartments when the true household size is 5 instead of 3. We estimated the magnitude of the linear combination of the relevant coefficients and tested their significance. E: number of exposed compartments; I: number of infectious compartments;
P < 0.1; **P < 0.05; ***P < 0.01.
Impact on Model-Predicted NPI Effects
Failure to include household structure results in substantial biases in model-estimated effects of NPIs, which interact in complex ways with models that have multiple exposed and infectious compartments (Appendix Tables A5–A6). Panel A of Figure 3 shows how, in the example, the model-estimated reduction in peak size due to NPIs without household structure
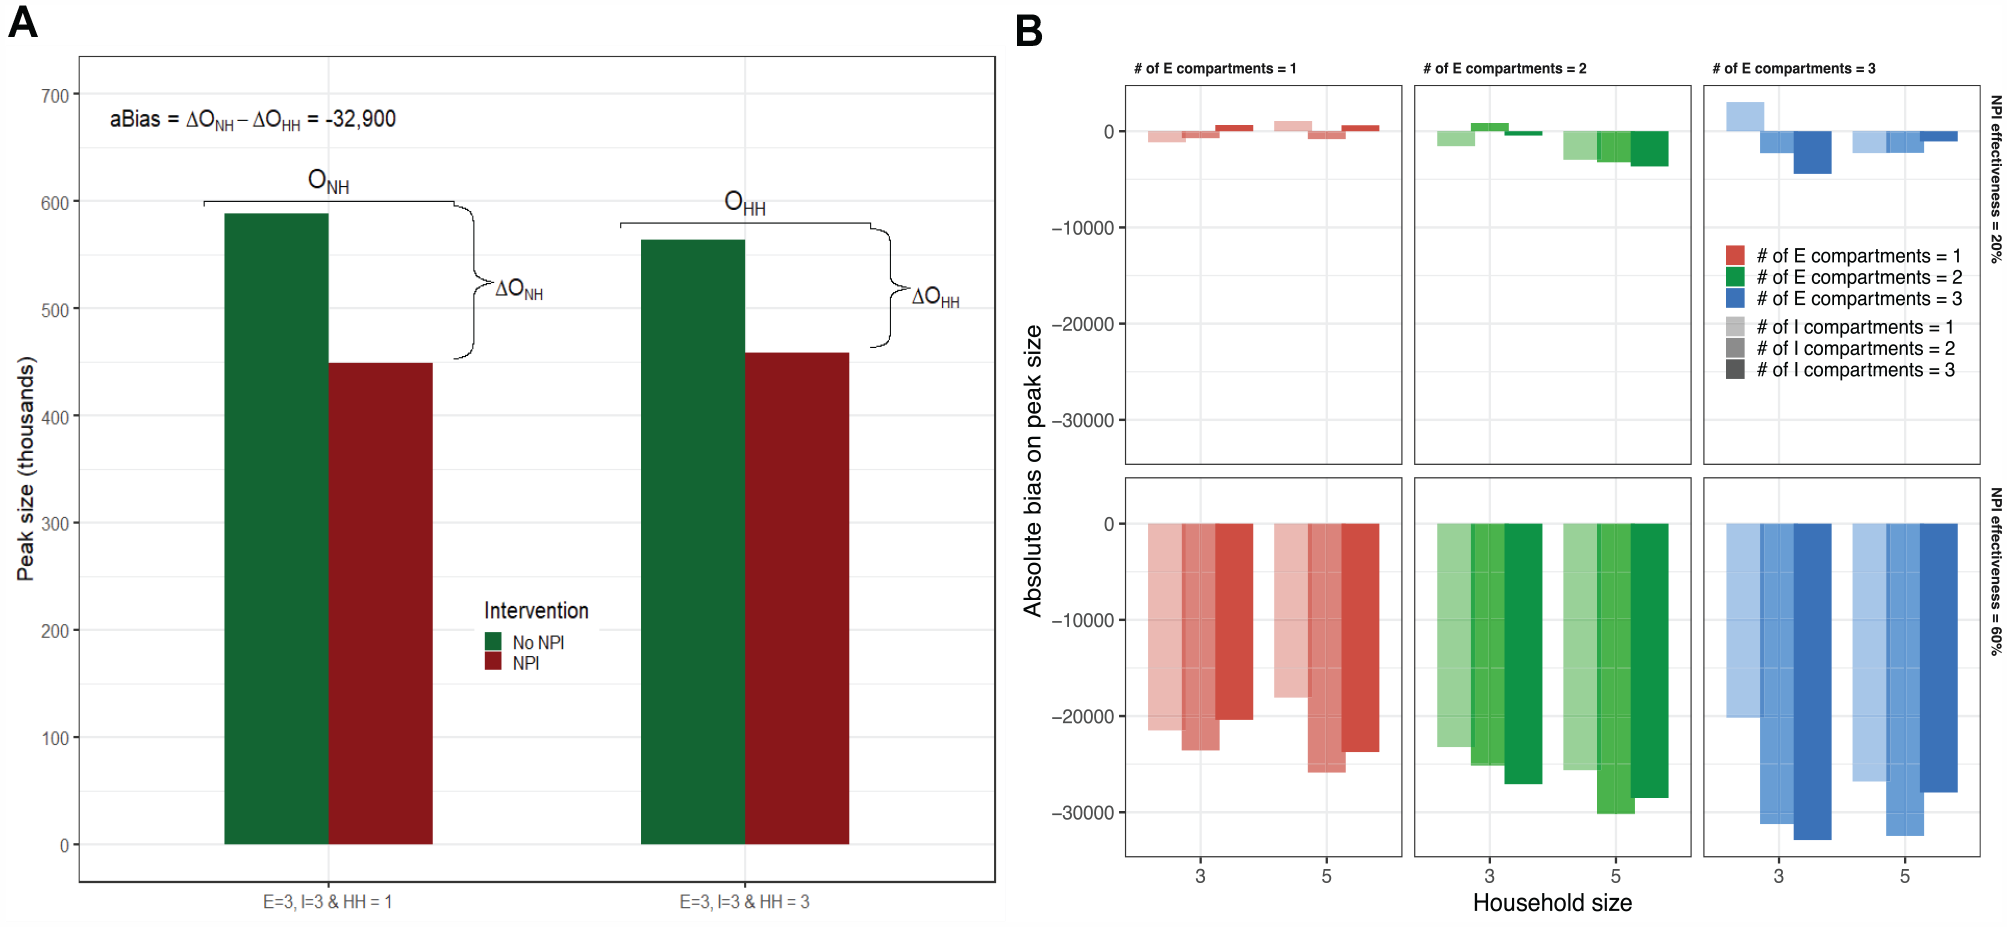
Control measures’ bias. (A) Bias with and without household structure for a nonpharmaceutical intervention with 60% effectiveness in reducing community contacts.
Using meta-analytic regressions, we found that, on average, model-estimated NPI effects of a 60% reduction in community contacts on peak time and peak size are systematically overestimated when the household structure is not included. In our example, for the model without a household structure, its peak is more delayed by the NPI (approximately 4 d more delayed) than the delay in an otherwise similar model with the household structure. The bias on peak time is slightly smaller when the true average household size is larger. The bias on peak size reduction due to the NPI is larger when the true household size is larger (preventing approximately 44,000 more cases at the peak without household structure when the true household size is 3; preventing approximately 45,000 more cases when the true household size is 5). For overall epidemic size over 100 d, the exclusion of household structure results in an underestimate of the effect of an NPI that reduces community contacts by 60% (approximately 61,000 and 57,000 fewer cases prevented in the first 100 d when the true model’s household size is 3 and 5, respectively; Table 2). Because models without household structure estimate that NPIs delay peaks longer and push the peak size lower, the effect on the epidemic size over 100 d appears smaller because it will take longer for the epidemic to essentially die out—the key is that the dynamics are different with interventions in the models with and without household structure. Panel B of Figure 3 illustrates this for exemplar parameter sets, showing that the model-estimated effects of NPIs on reducing peak size are frequently overestimated for NPI effectiveness of 60%. However, particular combinations of household size and NEDT exposed and infectious states interact in complex ways to determine the magnitude of this bias.
Meta-Regression Estimates on the Absolute Bias of Treatment Effects, NPI = 60% a
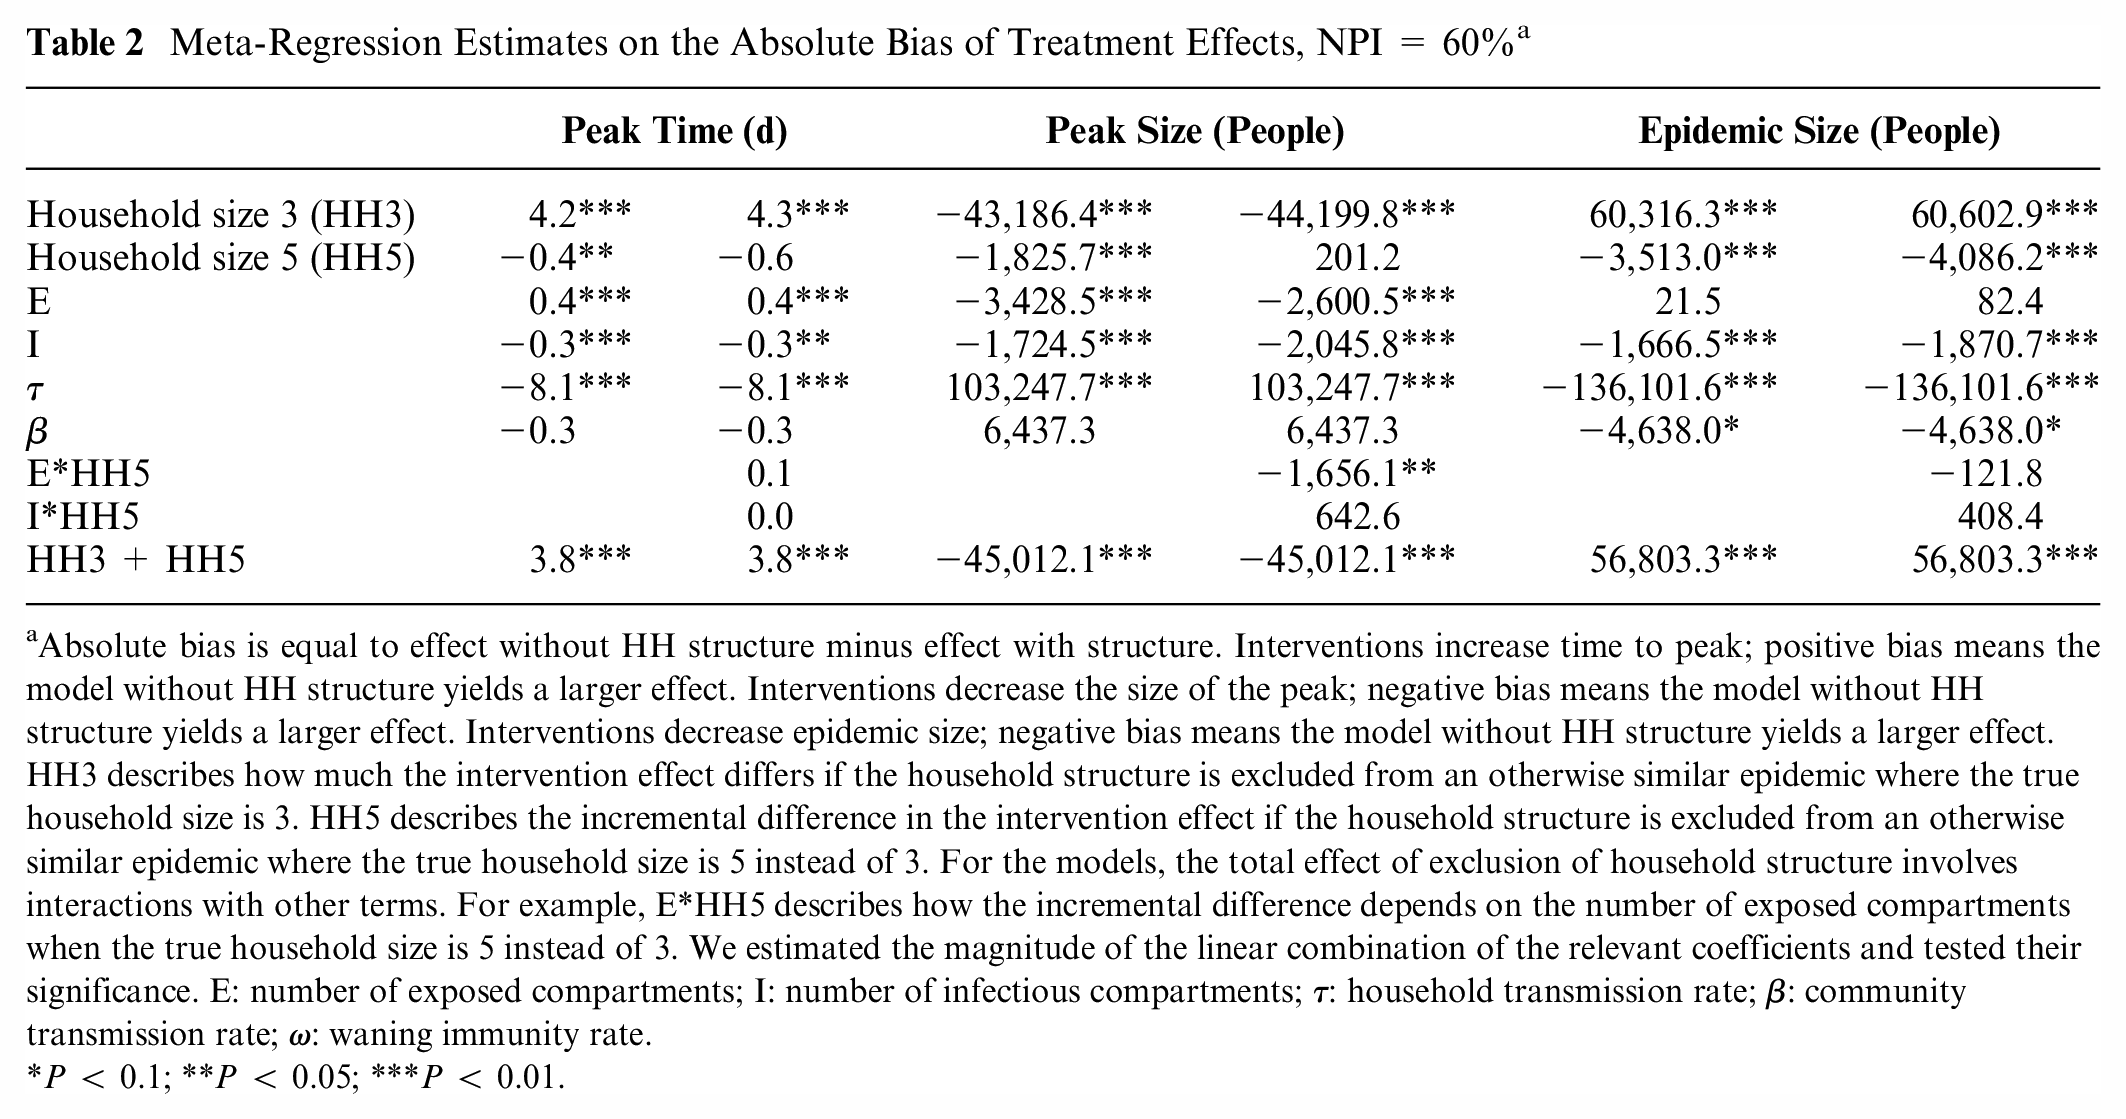
Absolute bias is equal to effect without HH structure minus effect with structure. Interventions increase time to peak; positive bias means the model without HH structure yields a larger effect. Interventions decrease the size of the peak; negative bias means the model without HH structure yields a larger effect. Interventions decrease epidemic size; negative bias means the model without HH structure yields a larger effect. HH3 describes how much the intervention effect differs if the household structure is excluded from an otherwise similar epidemic where the true household size is 3. HH5 describes the incremental difference in the intervention effect if the household structure is excluded from an otherwise similar epidemic where the true household size is 5 instead of 3. For the models, the total effect of exclusion of household structure involves interactions with other terms. For example, E*HH5 describes how the incremental difference depends on the number of exposed compartments when the true household size is 5 instead of 3. We estimated the magnitude of the linear combination of the relevant coefficients and tested their significance. E: number of exposed compartments; I: number of infectious compartments;
P < 0.1; **P < 0.05; ***P < 0.01.
As the NPI less effectively reduces community contacts (e.g., NPI effectiveness of 20%), the biases described above tend to be smaller and nonsignificant or even to underestimate the reductions in peak size using the exemplar parameter sets (Panel B of Figure 3 and Appendix Figure A.1). Using meta-analytic regressions, we found that, on average, model-estimated NPI effects of a 20% reduction in community contacts on affecting peak time and peak size are no longer significantly biased. For these outcomes as well as the bias in the effect on the total epidemic size, which is still significant, the magnitudes of their point estimates of biases are smaller (tending toward 0) compared with biases for a 60% effective NPI; Appendix Table A7).
The NPI results presented thus far are for models without waning immunity
Impact on Model-Predicted Vaccination Effects
Biases from excluding household transmission in the estimates of NPIs’ effects on epidemic outcomes are often larger than the biases in the estimates of the effects of vaccines because the modeled NPIs affect only community transmission. In contrast, vaccination affects both community and household transmission (Appendix Tables A5–A6). For a detailed description of the biases from excluding household transmission in the estimates of vaccination, please see the Appendix.
Discussion
Transmission dynamic models can support policy makers, providing timely epidemic forecasts and assessing the potential effectiveness of multiple control measures. While compartmental transmission dynamic models yield important insights, their simplifying assumptions regarding mixing and transmission can induce biases in epidemic forecasts and estimates of intervention effectiveness, particularly in situations with differential community and household transmission. However, using dynamic transmission microsimulation models may not be feasible because they require too much unobserved data (e.g., network structure) and computational resources to provide timely results. Our study provides a feasible alternative to address simulation needs within the spectrum of complexity from simple compartmental models to dynamic transmission microsimulation models. Specifically, it extends previous work incorporating household transmission into simple compartmental SIR models5,6 to include multicompartment SEIR models that can include both NPIs that reduce community transmission and vaccination that reduces both community and household transmission. To enable reproducibility and application, we provide an open-source implementation of the modeling framework (https://github.com/SC-COSMO/hhmcseirv/releases/tag/v1.0.0).
We demonstrate the value of our framework by comparing simulation results using the framework that incorporates household transmission to simulation results in which household transmission is not explicitly modeled. Across a range of parameters representing diverse pathogens in many epidemiological and social situations, we show that failure to explicitly include household transmission in the model induces bias in its forecasts, particularly on the size of the epidemic peak. Likewise, we show that failure to include household transmission biases estimates of NPI effects on the epidemic outcomes in complex ways. These biases differ substantially and systematically from biases in estimates of vaccine effects. Consistent with empirical studies,1–4 the fraction of overall transmission accounted for by within-household transmission varies by parameters representing the setting-specific transmission of the pathogen of interest (i.e.,
Failure to include household structure induces biases in the modeled overall course of an epidemic and the effects of interventions delivered differentially in community settings. It also limits the ability of the model to evaluate household-specific interventions convincingly. For example, contact investigations could be examined by increasing the rate of detection (and treatment or prophylaxis) among household contacts. Hence, our framework provides additional advantages regarding the types of targeted interventions that can be evaluated.
Our results are consistent with prior literature examining modeled epidemic spread and modeled intervention effects comparing network models to systems of ODEs. These studies have found that network model-predicted timing and size of epidemics differ from those predicted by ODE models and, likewise, that predicted intervention effects in network models would diverge from those of ODE models that produced similar endemic equilibria without intervention. Notably, the magnitude of divergence depends on various parameters, including the degree of clustering in the network models, which may be analogized to the household structure our framework approximates.16,17
Our modeling framework falls within a complexity spectrum between compartmental and microsimulation models. It introduces a set of differential equations whose size grows with the number of modeled states and household size to track households and household transmission. To keep the problem tractable, it assumes that all households are the same size—the average size for the population. Relaxing this assumption would add more equations to the model’s household subcomponent. Solving large systems of ODEs eventually results in numerical imprecision for compartments with extremely small proportions of the population and requires longer computation times. In our R implementation of the framework, household sizes of more than 5 combined with multicompartments of more than 4 exposed states and more than 4 infectious states resulted in computation times of minutes to hours. Reimplementing the framework in a high-performance language such as C++ or Julia and using appropriate differential equation solvers would likely raise these limits considerably. Even so, dynamic microsimulation models would become preferable at some point of complexity.
As famously noted, ”all models are wrong, but some models are useful” 18 ; the goal of this study is to extend the usefulness of compartmental dynamic transmission models for forecasting and policy evaluation by developing methods to incorporate household transmission into a broad class of such models. We provide the full mathematical details of such an approach and show that incorporating such dynamics into many models is feasible and bias reducing. We believe that it is advisable to incorporate household transmission into a wide range of dynamic transmission models. With the release of an open-source modeling framework to support analysts, we believe it is advisable to incorporate household transmission into a wide range of dynamic transmission models in the future.
Supplemental Material
sj-pdf-1-mdm-10.1177_0272989X231205565 – Supplemental material for Effects of Mitigation and Control Policies in Realistic Epidemic Models Accounting for Household Transmission Dynamics
Supplemental material, sj-pdf-1-mdm-10.1177_0272989X231205565 for Effects of Mitigation and Control Policies in Realistic Epidemic Models Accounting for Household Transmission Dynamics by Fernando Alarid-Escudero, Jason R. Andrews and Jeremy D. Goldhaber-Fiebert in Medical Decision Making
Supplemental Material
sj-pdf-2-mdm-10.1177_0272989X231205565 – Supplemental material for Effects of Mitigation and Control Policies in Realistic Epidemic Models Accounting for Household Transmission Dynamics
Supplemental material, sj-pdf-2-mdm-10.1177_0272989X231205565 for Effects of Mitigation and Control Policies in Realistic Epidemic Models Accounting for Household Transmission Dynamics by Fernando Alarid-Escudero, Jason R. Andrews and Jeremy D. Goldhaber-Fiebert in Medical Decision Making
Supplemental Material
sj-pdf-3-mdm-10.1177_0272989X231205565 – Supplemental material for Effects of Mitigation and Control Policies in Realistic Epidemic Models Accounting for Household Transmission Dynamics
Supplemental material, sj-pdf-3-mdm-10.1177_0272989X231205565 for Effects of Mitigation and Control Policies in Realistic Epidemic Models Accounting for Household Transmission Dynamics by Fernando Alarid-Escudero, Jason R. Andrews and Jeremy D. Goldhaber-Fiebert in Medical Decision Making
Footnotes
Acknowledgements
We thank Michael Fairly for his valuable contribution to deriving the distribution of household members in source and destination states between time steps. We thank Joshua Salomon for feedback on ideas related to this work.
The authors declared no potential conflicts of interest with respect to the research, authorship, and/or publication of this article. The authors disclosed receipt of the following financial support for the research, authorship, and/or publication of this article: Financial support for this study was provided in parts by a grant from the Society for Medical Decision Making (SMDM) funded by the Gordon and Betty Moore Foundation, a grant from Open Society Foundations (OSF), and a gift from the Wadhwani Institute for Artificial Intelligence Foundation, and Advanced Micro Devices (Santa Clara, CA, USA) provided a donation of servers. The funding agreement ensured the authors’ independence in designing the study, interpreting the data, writing, and publishing the report.
References
Supplementary Material
Please find the following supplemental material available below.
For Open Access articles published under a Creative Commons License, all supplemental material carries the same license as the article it is associated with.
For non-Open Access articles published, all supplemental material carries a non-exclusive license, and permission requests for re-use of supplemental material or any part of supplemental material shall be sent directly to the copyright owner as specified in the copyright notice associated with the article.