
Abstract
Introduction
The Dental Caries Utility Index (DCUI) is a new oral health–specific health state classification system for adolescents, consisting of 5 domains: pain/discomfort, difficulty eating food/drinking, worried, ability to participate in activities, and appearance. Each domain has 4 response levels. This study aims to generate an Australian-specific utility algorithm for the DCUI.
Methods
An online survey was conducted using a representative sample of the adult Australian general population. The discrete choice experiment (DCE) was used to elicit the preferences on 5 domains. Then, the latent utilities were anchored onto the full health-dead scale using the visual analogue scale (VAS). DCE data were modeled using conditional logit, and 2 anchoring procedures were considered: anchor based on the worst health state and a mapping approach. The optimal anchoring procedure was selected based on the model parsimony and the mean absolute error (MAE).
Results
A total of 995 adults from the Australian general population completed the survey. The conditional logit estimates on 5 dimensions and levels were monotonic and statistically significant, except for the second level of the “worried” and “appearance” domains. The mapping approach was selected based on a smaller MAE between the 2 anchoring procedures. The Australian-specific tariff of DCUI ranges from 0.1681 to 1.
Conclusion
This study developed a utility algorithm for the DCUI. This value set will facilitate utility value calculations from the participants’ responses for DCUI in economic evaluations of dental caries interventions targeted for adolescents.
Highlights
Preference-based quality-of-life measures (PBMs), which consist of a health state classification system and a set of utility values (a scoring algorithm), are used to generate utility weights for economic evaluations.
This study is the first to develop an Australian utility value set for the Dental Caries Utility Index (DCUI), a new oral health–specific classification system for adolescents.
The availability of a utility value set will enable using DCUI in economic evaluations of oral health interventions targeted for adolescents and may ultimately lead to more effective and efficient planning of oral health care services.
Keywords
Introduction
Cost-utility analysis (CUA) is the preferred type of full economic evaluation by most health technology assessment authorities to assess health care interventions across different disease areas.1,2 Quality-adjusted life-years (QALYs) are the most common outcome measure in CUA 3 and allow for a comparison of health interventions in terms of QALY gain or loss for an incremental cost. The QALY is a summary outcome measure that combines utility values assigned to the health states and the duration of time spent in each health state in the condition of interest. 4 These health state utility values represent individuals’ preferences for different health states and are presented on a full health-dead (1–0) scale. 5
Preference-based quality-of-life measures (PBMs) can be used to derive utility values for QALYs in economic evaluations.5,6 PBMs consist of a health state classification system and a set of utility values (a scoring algorithm). The classification system includes health states described in terms of dimensions with response levels relevant to general health or specific disease conditions. The scoring algorithm enables the generation of utility values for these health states. 5 The algorithms are generated using the values for selected health states in the classification system, estimated from a sample of patients or general population preferences using a preference-elicitation method. Once these values are obtained, statistical modeling techniques are used to generate the scoring algorithm and estimate the utility values for all possible health states derived from the classification system.
Most of the existing pediatric oral health–related quality-of-life (OHRQoL) instruments are non–preference based (non-PBM). They cannot be used to calculate utility values in health economic evaluations. 7 The available oral health–related pediatric PBMs, the Early Childhood Oral Health Impact Scale–4D (ECOHIS-4D), and the Caries Impacts and Experiences Questionnaire for Children classification system (CARIES-QC-U) are targeted at children of very young age and a wider age group of 5 to 16 years, respectively.8,9 Therefore, in this study’s first phase, a classification system for dental caries, the Dental Caries Utility Index (DCUI), was developed targeting adolescents older than 12 y. 10 The aim of the present study is to value health states defined by the DCUI classification system. A detailed protocol for this study has been published elsewhere. 11
Methods
DCUI Classification System
The DCUI classification system was developed based on a literature review, qualitative interviews, and expert opinion, the accepted methodologies to develop a classification system for a PBM. A systematic literature review of pediatrics OHRQoL instruments 7 and a quick literature search on studies eliciting utility values for oral health outcomes were performed to identify possible domains and items to develop a draft DCUI classification system. The draft classification system was then refined based on semi-structured interviews with a convenience sample of fifteen 12- to 17-year-old adolescents with dental caries experience and a group of dental experts using the modified Delphi technique. A detailed description of DCUI development is reported elsewhere. 10 The finalized DCUI classification system consists of 5 items: pain/discomfort, difficulty eating food/drinking, worried, ability to participate in activities, and appearance, and each item comprises 4 levels (Table 1).
Dental Caries Utility Index (DCUI) Classification System a
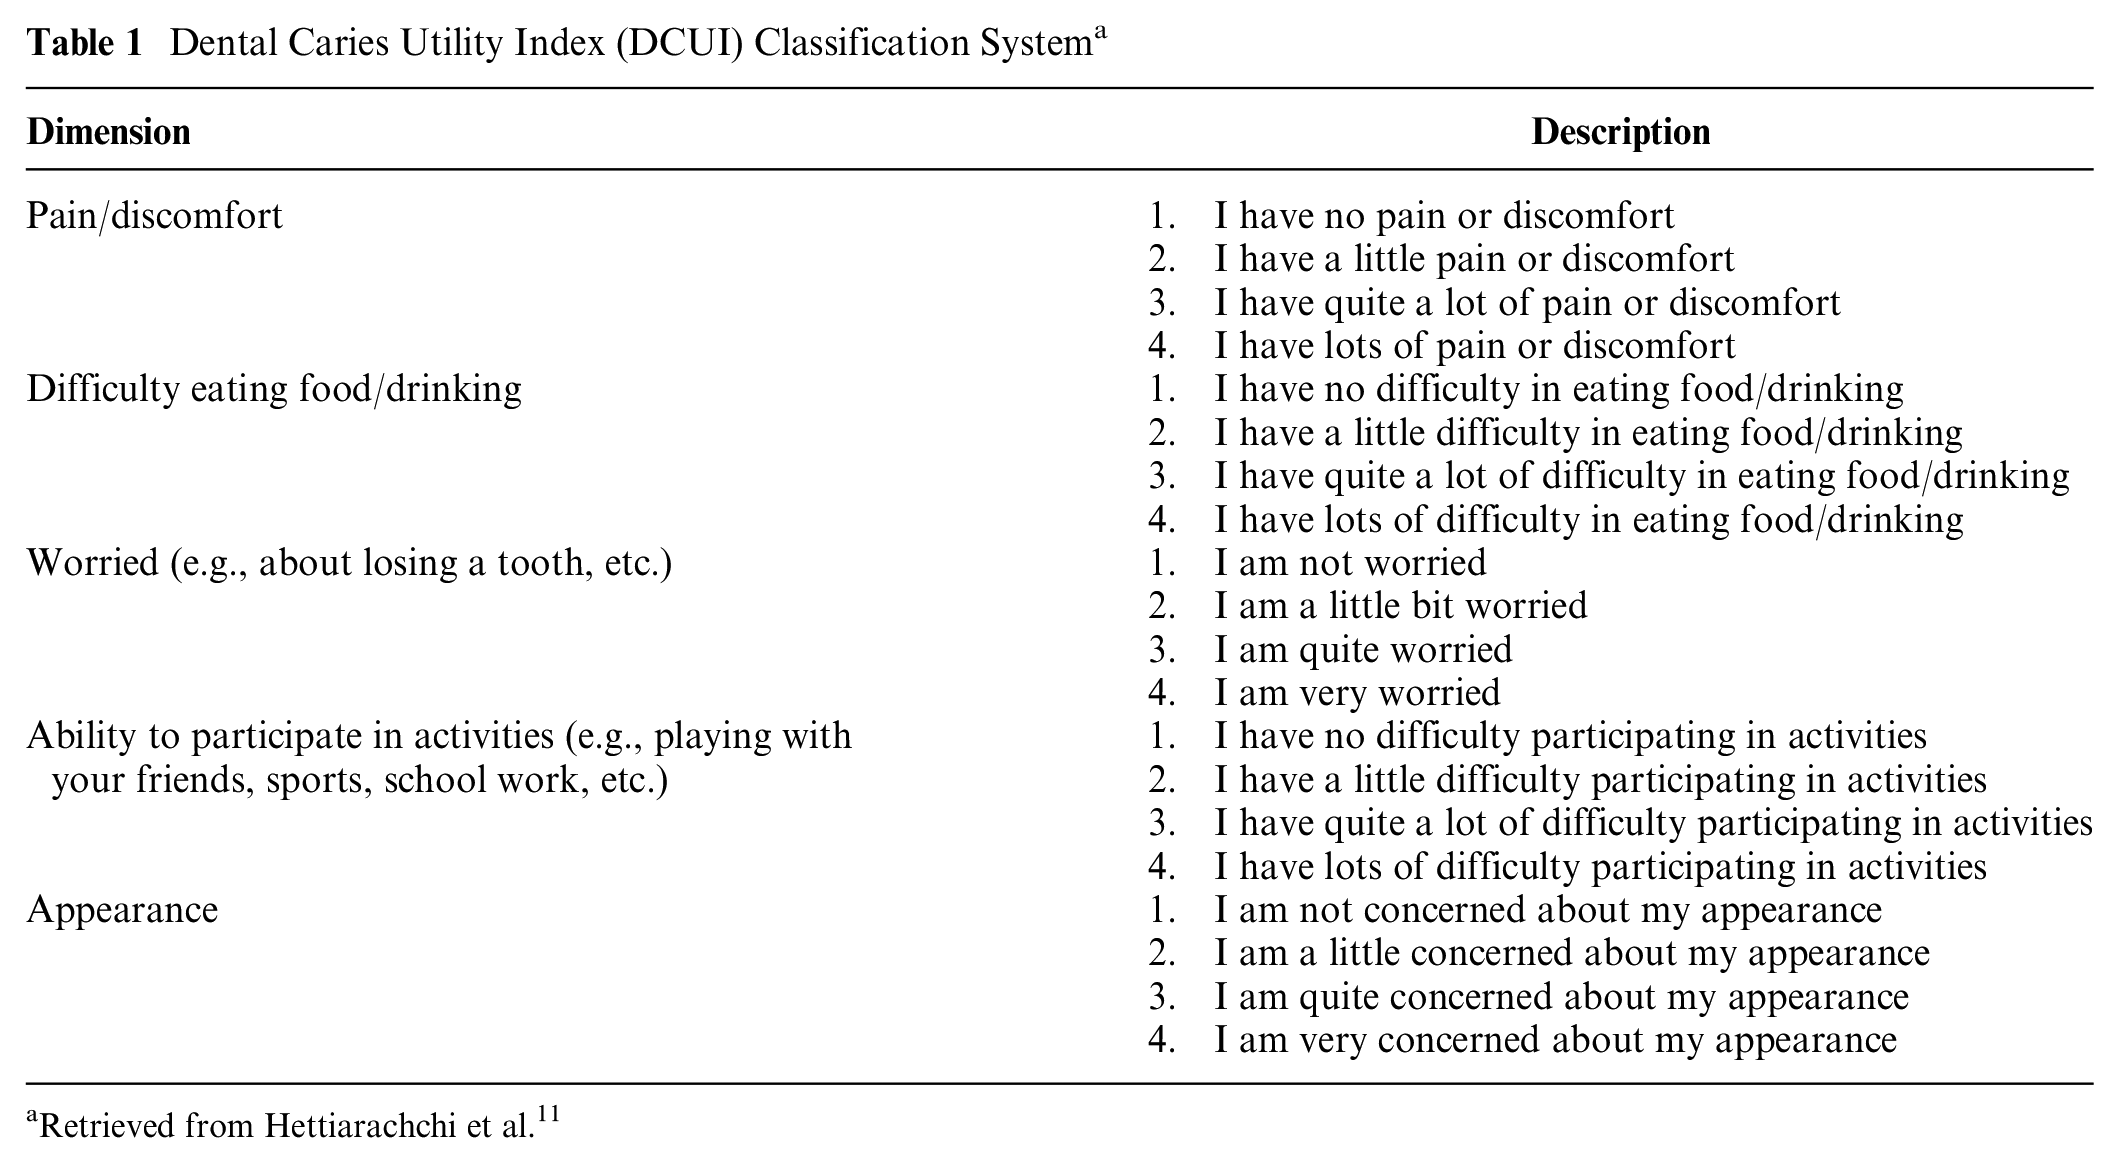
Retrieved from Hettiarachchi et al. 11
Preference Elicitation Technique
Discrete choice experiments (DCEs) have recently emerged as a preferred method for health state valuations. 12 The methodological aspects of DCE valuations have been tested widely and used in health state valuation studies. DCE surveys are typically compatible with online surveys; thus, they are less time- and resource-consuming than traditional valuation methods, such as the standard gamble (SG) and the time tradeoff (TTO) methods. 13 Furthermore, compatibility with the online mode allows large representative samples to be collected within a shorter duration, and DCE methods have moved forward methodologically for the health state valuation over the recent past. However, DCEs produce utility values on a latent scale. These values should be anchored onto the full health-dead scale to calculate the QALYs. 14 Several methods, such as DCE with duration, use of external data from a concurrent TTO study, anchoring with visual analogue scale (VAS), and use of immediate death as a health state, have been applied to anchor latent DCE values onto the full health-dead scale. 12 VAS health state valuation tasks are comparatively easy to understand and have less burden on participants than the SG and TTO methods do. 15 The VAS approach has been used to generate utility values in several health state valuation studies16,17 and oral health studies. 18 It has also been used solely as an anchoring approach to rescale DCE utility values onto a full heath–dead scale. 19 However, the lack of a tradeoff between life-years and risk, which does not require preferences of life-years over health, is a concern for VAS. Therefore, 2 online pilot surveys were conducted prior to the main survey to evaluate the feasibility and suitability of DCE anchoring with a VAS approach (DCEVAS) and DCE with duration approach (DCETTO). A sample of the adult Australian general population completed the 2 online surveys for DCETTO (n = 200) and DCEVAS (n = 191). Pilot data analyses indicated more ordered and significant coefficients from the DCEVAS approach compared with the DCETTO models. The utility decrements obtained from the DCETTO approach were more dispersed. Moreover, the DCETTO approach valued health states lower than the DCEVAS approach; in particular, severe health states were valued worse than death. DCE anchoring with a VAS approach is preferable over DCETTO for a dental caries health state valuation and was consequently chosen for the main survey. The detailed results of this comparison study will be published elsewhere. 20
DCE Experimental Design and Choice Tasks
The DCUI classification system has 1,024 (45) possible health states (Table 1). As the full factorial design is not feasible, a widely used D-efficient design was adopted with zero priors to select a manageable 200 pairwise choice tasks of these health states, which were further blocked into 25 versions using Ngene software. 21 Therefore, each participant completed 8-DCE choice tasks from the design. In addition, the survey included a practice choice task and a task with a dominant choice at the beginning to familiarize the participants with DCE tasks. Although there is no consensus in the literature about the number of choice sets per respondent, most DCE studies have used 8 choice tasks per respondent. 22 Also, the DCE design in the present study is in line with a recent structured review, which identified that most health state valuations studies using DCE included more than 151 choice tasks, 12 the number of choice tasks per respondent ranged from 2 to 108, 12 and also nonzero prior values are not essential for optimal study design. 23 An example of a DCE choice task is presented in Figure 1.
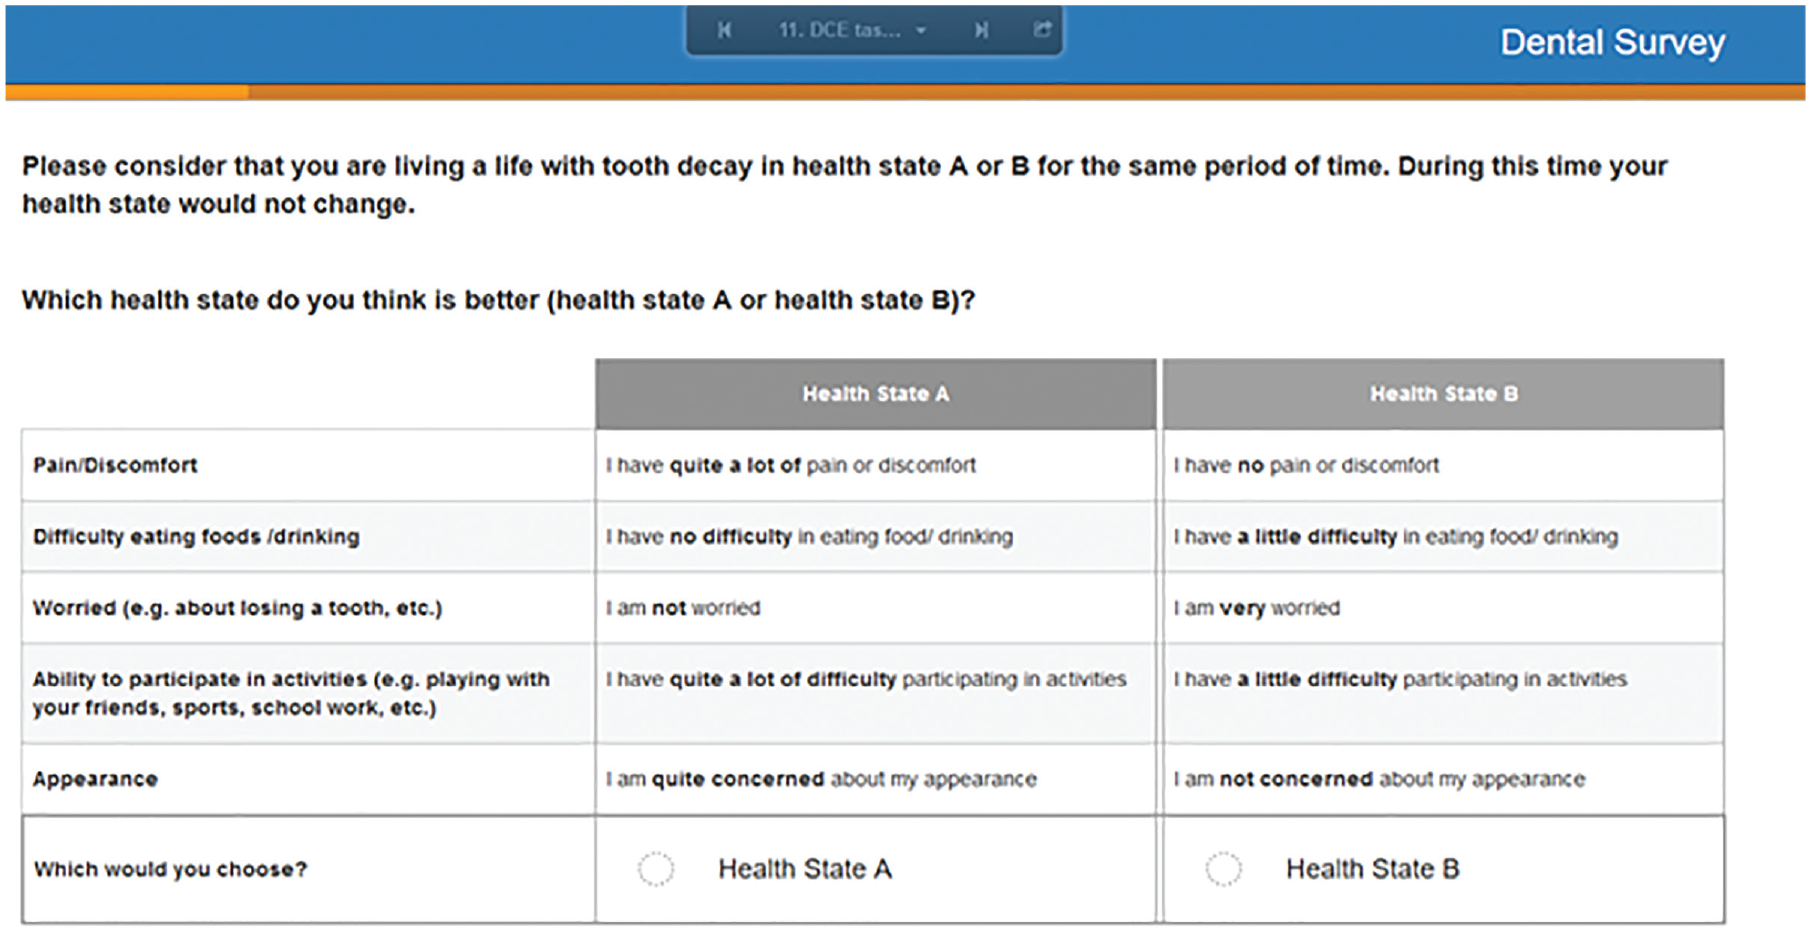
An example choice set from the discrete choice experiment valuation task.
VAS Task
The VAS task included 6 health states in a single VAS scale: best health state (best level, level 1 of each attribute denoted by 11111), worst health state (worst level, level 4 of each attribute denoted by 44444), mild health state (22211), moderate health state (33341) severe health state (44431) defined by the DCUI classification system, and death (Figure 2). The mild, moderate, and severe health states were selected to represent combinations of attribute levels with differing severity. The 2 extreme endpoints of the VAS scale were calibrated as “best imaginable oral health” (score 100) and “worst imaginable oral health” (score 0).
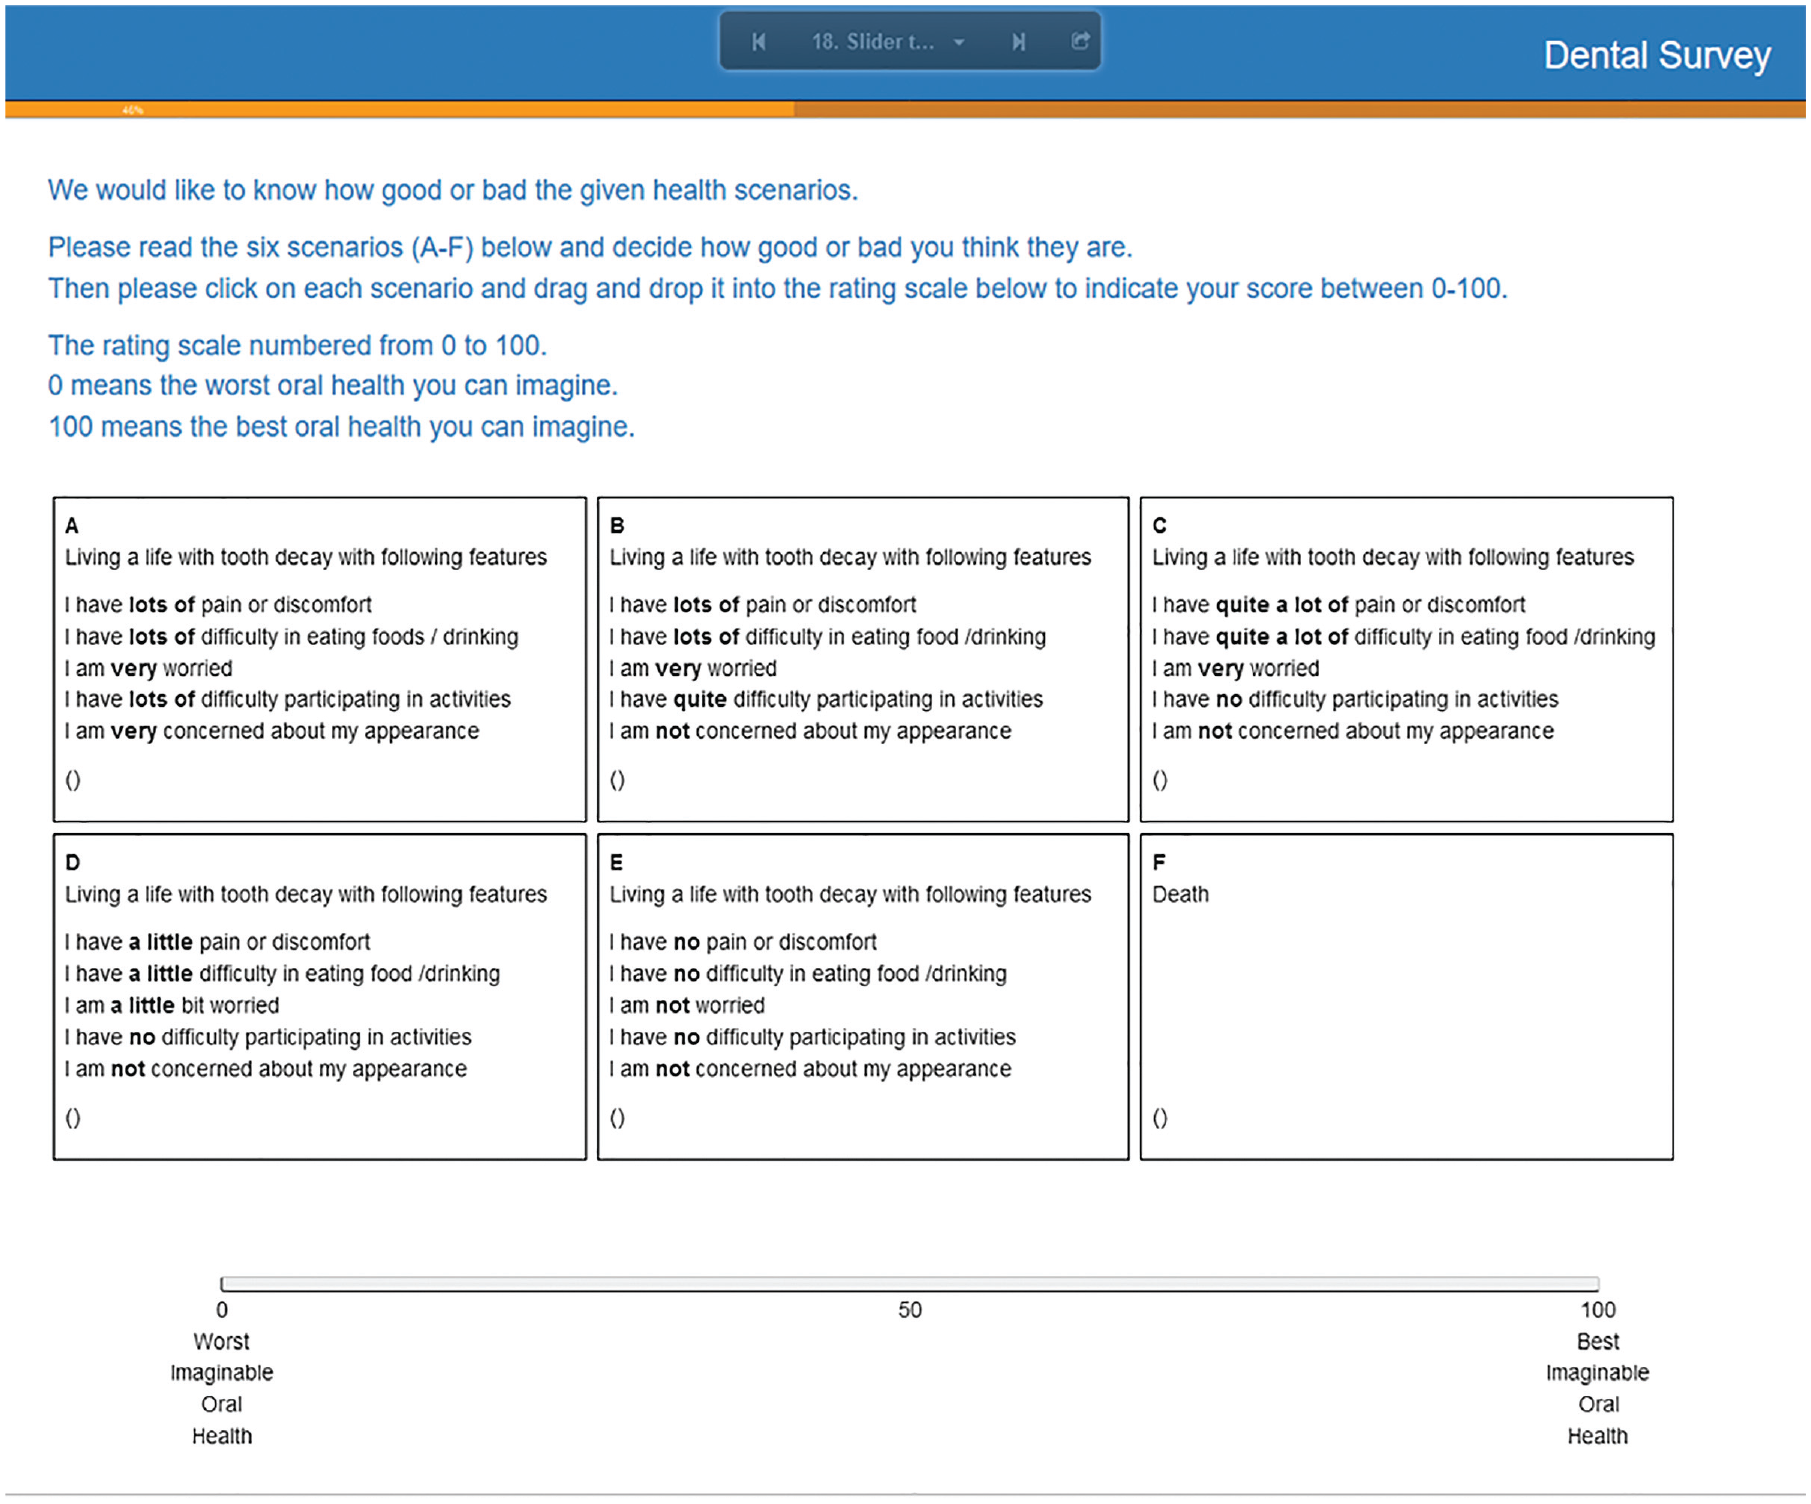
The visual analogue scale (VAS) valuation task.
Study Sample
Several options exist to generate utility algorithms for pediatric PBMs, including eliciting preferences from children and adolescents, or from the general adult population, or based on proxy responses from parents/guardians. 6 Eliciting preferences from a pediatric sample may be a better option to understand their preference given they tend to have different preferences for health states than adults do.24,25 However, it is methodologically challenging, as the DCE elicitation tasks require higher cognitive ability compared with the other methods, such as best-worst scaling. 26 Another major concern is the ethical issues associated with presenting tasks with the concept of “dead.” Consequently, it is more common to elicit preferences from adult general population samples to generate utility algorithms for pediatric PBMs.27,28 This approach is often justifiable, as taxpayers (adult general population members) should have greater influence in deciding which health interventions are funded through public health systems. Furthermore, the anchoring task based on the VAS also required participants to value “death” in relation to the 5 other health states defined by the DCUI classification system. One of the main concerns over general population health state valuation is that they do not have any experience with the disease condition. 6 However, dental caries is one of the most prevalent conditions among children and adults. According to the National Adult Oral Health Study 2017–18 data, 32% of Australian adults older than 15 y had untreated dental caries, and 77% of those 15 y and older had 1 or more filled teeth. 29 Hence, adults are more likely to experience dental caries and would provide more reliable values for the dental caries health states defined by the DCUI, compared with a disease condition for which they potentially have no experience. Furthermore, choice tasks were designed from the participants’ own health perspective to allow adults to call on their own experiences, as imagining a young person experiencing the state is challenging. 30 The DCUI is intended for adolescents older than 12 y, and most children have all of their permanent teeth by the age of 12 y. Therefore, the health states defined by the DCUI are relevant for the permanent dentition status of both adolescents and adults. Moreover, the dental caries symptoms do not differ across age groups. Considering these facts, the present study elicited preferences for health states from an adult general population sample and their “own health” perspective.
Sample Recruitment and Survey Administration
According to Lancsar and Louviere, 31 20 respondents per choice set and a sample size of 1,000 to 2,000 is sufficient to estimate a reliable model. Although the use of a larger sample was planned during the study protocol, due to time and financial limitations, the health state valuation study aimed to recruit a sample size of 1,000 members from the Australian general population. This sample size was compatible with the sample size requirement and also with other Australian online DCE surveys. 32 A representative sample of the adult Australian general population in relation to age and gender was recruited from an Australian online panel via a research company SurveyEngine (http://www.surveyengine.com). Australian general population age and sex distribution were obtained from Australian Bureau of Statistics data. 33
Quotas were set for age and sex based on these data during recruitment to derive an age- and sex-representative sample of the adult Australian general population. Invitations were sent to the potential participants registered with the survey company, and interested participants accessed the survey using the provided link. The online survey started with the introduction page, where participants were given all the necessary details about the research project and then requested to provide consent for data collection and use. Those who consented were guided through the online survey by screen prompts. The next section of the survey included screening questions (age and sex) to ensure the inclusion of a representative sample of the Australian general population. The participants were then asked to complete the DCUI classification system concerning their oral health as a warm-up task to familiarize them with the words used in the choice tasks. The next section included a set of DCE choice tasks, a practice choice task and a task with a dominant choice, to familiarize the participants with DCE tasks. These were followed by the 8-DCE tasks and the VAS anchoring task. The participants were then asked to complete a generic preference-based quality-of-life (QoL) instrument (EQ-5D-5L), 34 an oral health–specific QoL instrument (Oral Health Impact Profile-14; OHIP-14), 35 and questions regarding their sociodemographic characteristics, oral health status, and frequency of dental visits. The OHIP-14 and EQ-5D-5L are the most frequently used instruments in oral health research to evaluate oral health and general health–related QoL in Australian adults.36,37
Data Analysis
Sample characteristics
The sociodemographic characteristics of the sample (e.g., age, sex, education level, and income) were compared with those of the Australian general population. Chi-square tests were used to assess the representativeness of the study sample against the Australian general population, which were drawn from Australian Bureau of Statistics data33,38 as well as the Household, Income and Labour Dynamics in Australia (HILDA) Survey wave 16. 39
Utility estimation
The data were analyzed using the STATA version 15.1 40 statistical software package. Data from DCE choice tasks were modeled using a conditional logit model under a random utility framework, as specified in equation 1. The random utility framework assumes respondents choose the option that maximizes their utility. 41 The utility function consists of a vector of observable attributes and a random error term. 41

where μijk is the the utility individual i would get from choosing option k in the choice set j;

where μijk is the the utility individual i would get from choosing option k in the choice set j; η
i
is the variability term;
The best-fit model was selected based on the statistical significance, logical order of the coefficients, and Akaike’s information criterion and Bayesian information criterion. The base level of the effect-coded model was recovered using the equation 3 prior to anchoring. 42

Anchoring
The VAS data first underwent a quality check to ensure meaningful results were attained; that is, participants needed to give logical answers regarding the death and best or worst health states. Strict exclusion criteria were applied to remove all relevant logical inconsistencies to achieve meaningful results in the anchoring procedure. The participants were excluded if they met any of the following criteria:
Participants valued best ≤ death or worst or mild or moderate or severe.
Participants valued death ≥ mild or moderate.
Participants valued worst ≥ mild or moderate, or severe.
Participants were missing either death or best or worst VAS data (due to a technical issue in the VAS slider task, some missing data exist for participants who initially completed the survey).
The raw VAS scores of the worst, mild, moderate, and severe health states were converted to the full health–dead scale based on equation 4 at the participant level proposed by Brazier et al., 15 as used in previous studies. 16

where Vh is the adjusted VAS rating for health state h, Sh is the respondent’s unadjusted VAS score for state h, Sdead is the respondent’s assigned VAS score for the health state “death,” and S11111 is the respondent’s assigned VAS score for the health state 11111 (best state).
DCE data were anchored to the full health–dead scale using adjusted VAS scores via 2 methods: 1) anchoring with the worst (PITS) health state and 2) anchoring by mapping DCE onto VAS. DCE data were anchored to the worst-state value obtained in VAS using the equation 5 adopted from Rowen et al. 43 (in which the TTO instead of VAS was used):

where βrλə is the rescaled coefficient for level λ of dimension ə, βλə is the coefficient for level λ of dimension ə, wVAS is the estimated VAS value for the worst state generated using equation 4, and wDCE is the DCE value for the worst state estimated using the DCE model.
For the anchoring with mapping DCE onto VAS using linear regression, the mean VAS values obtained for the worst health state (44444), a mild health state, a moderate health state, and a severe health state of the DCUI were used as shown in equation 6:
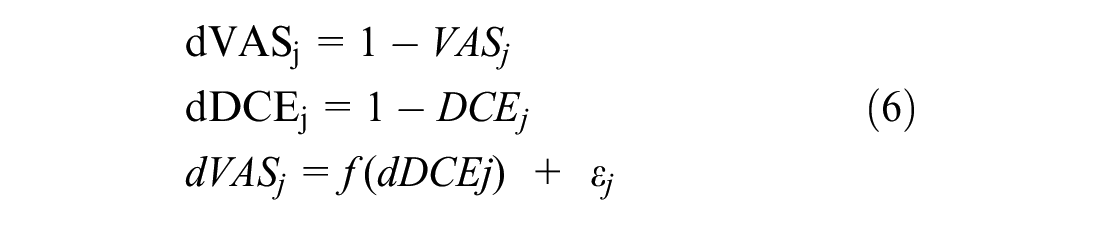
where VASj is the mean VAS value of health state j, DCEj is the modeled latent utility value of health state j, dVASj is the mean VAS disutility value of health state j, dDCEj is the modeled latent disutility value of health state j, and ε j is the error term.
The optimal anchoring procedure among anchoring with the worst (PITS) health state and anchoring by mapping DCE onto VAS was selected based on the model parsimony (e.g., logical order of the coefficients) and the goodness-of-fit mean absolute error (MAE). The MAE provides a measure of the fit of predicted values relative to observed or criterion values, with a small MAE being preferred. 44 Since there are no directly elicited health state utilities for the vast majority of DCUI health states, VAS health state utilities for the small number of health states included in the VAS task were used as the criterion to evaluate the MAE for the 2 anchoring approaches. The utility algorithm for the DCUI health states was developed based on the approach with a smaller MAE. 45
Results
A total of 995 participants completed the survey. Table 2 shows the sociodemographic characteristics, health characteristics, and self-reported oral health data of the study participants. The sample was more educated and had a higher weekly household income than the Australian general population.
Characteristics of the Study Sample (n = 995)
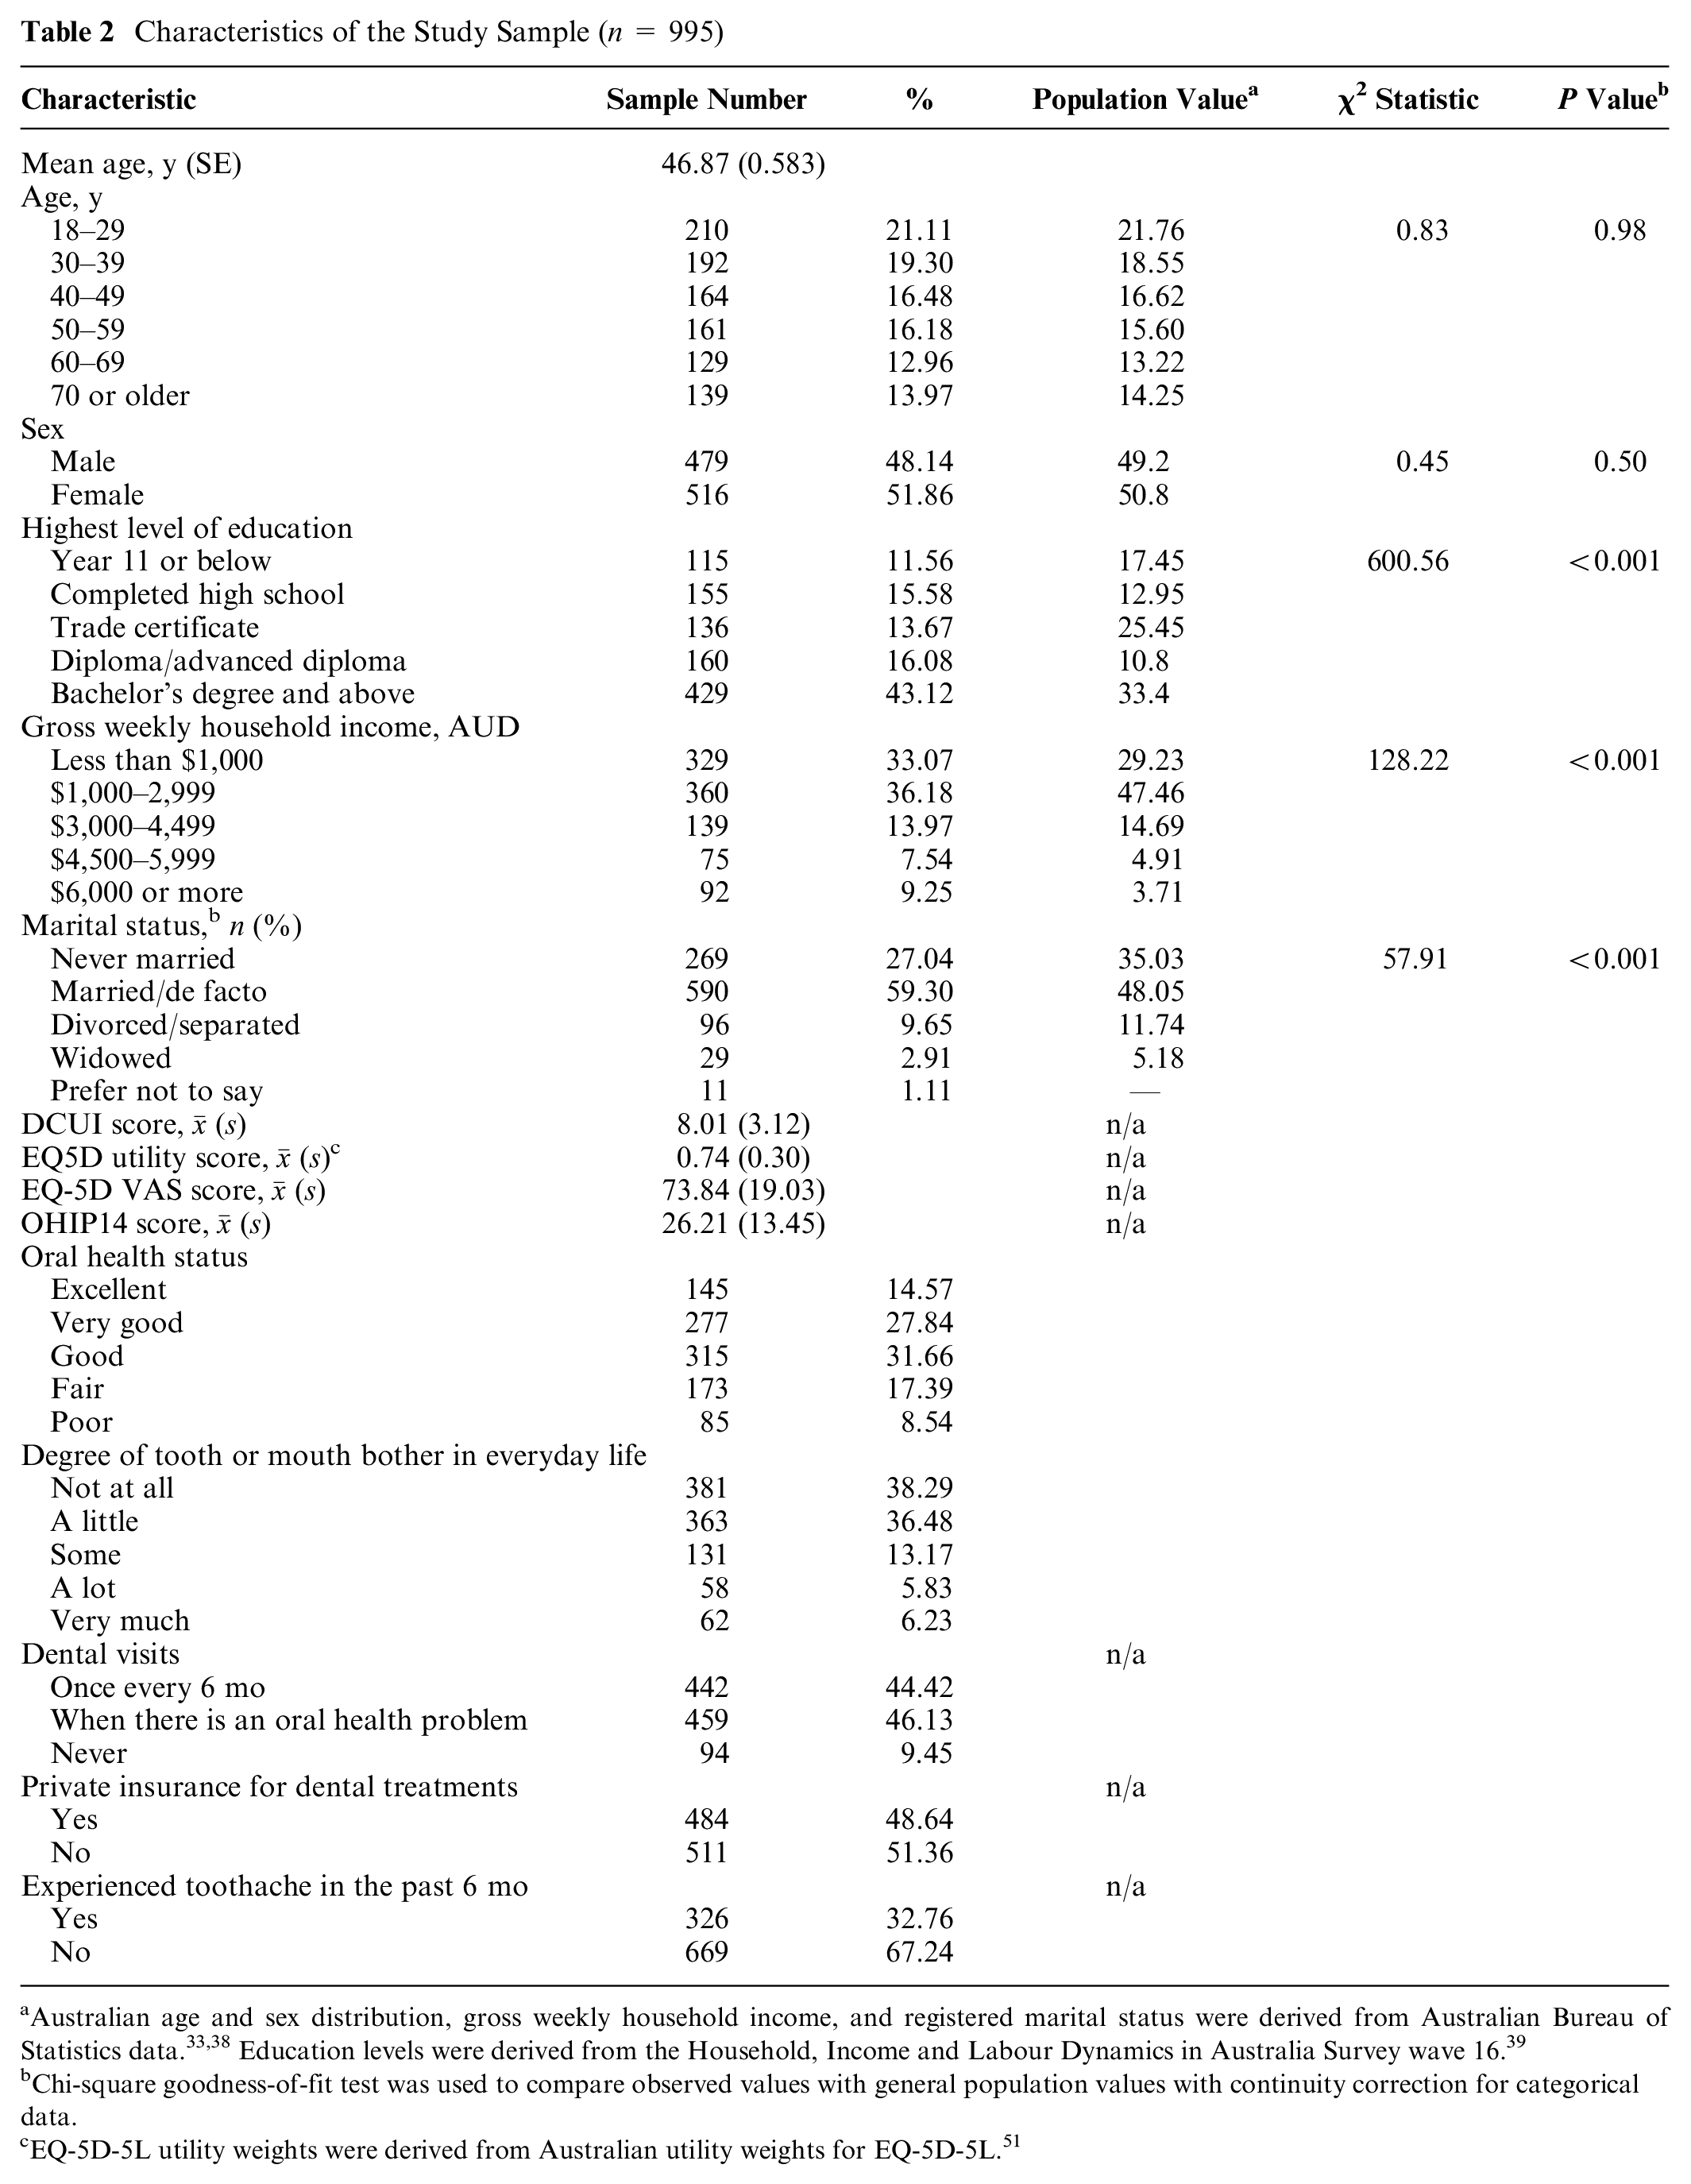
Australian age and sex distribution, gross weekly household income, and registered marital status were derived from Australian Bureau of Statistics data.33,38 Education levels were derived from the Household, Income and Labour Dynamics in Australia Survey wave 16. 39
Chi-square goodness-of-fit test was used to compare observed values with general population values with continuity correction for categorical data.
EQ-5D-5L utility weights were derived from Australian utility weights for EQ-5D-5L. 51
DCE Data Estimates
DCE choice data were modeled using conditional logit. Supplementary Table 1 reports the parameter estimates from the unadjusted dummy coded, conditional logit model, including all participants (n = 995). All coefficients were in the expected direction (all coefficient moves from level 1 of each dimension were valued negatively) and in the expected order for all 5 dimensions. All coefficients were significant except for level 2 of the dimensions “worried” and “appearance.”
Analysis of VAS Data
In total, 521 participants were included in the VAS data analysis. The participants included in the VAS data analysis were significantly different from those who met the VAS exclusion criteria concerning age, education level, and oral health status (Supplementary Table 2). Raw VAS scores for the worst, mild, moderate, and severe health states were adjusted to the full health–dead scale in VAS at the individual level using equation 4, and the mean scores were taken as the adjusted VAS scores for each health state. Supplementary Table 3 shows the unadjusted and adjusted mean VAS values for each health state.
Model Selection
For sensitivity analysis, DCE data were modeled by excluding the data of the participants who met VAS exclusion criteria, and the coefficients were estimated using a conditional logit model (Supplementary Table 1). As can be seen, except for the coefficient for level 2 of “appearance,” all coefficients estimated in model excluding participants who met VAS exclusion criteria were in the expected direction. Coefficients for each dimension were in the expected order. Of the 15 coefficients estimated from this model, 2 coefficients (level 2 of the dimensions “worried” and “appearance”) were nonsignificant. The exclusion of the DCE data of the participants who met VAS exclusion criteria did not improve the model estimates substantially, indicating that it was not necessarily correct to assume that those who failed the VAS task could not complete the DCE tasks. Furthermore, exploring other model types with total sample data (mixed logit; Supplementary Table 1) also did not differ substantially from conditional logit model and evaluating preference heterogeneity is a secondary concern of this study.
Therefore, anchoring of the DCE coefficients onto a full health–dead scale was performed based on conditional logit model.
Anchoring Modeled DCE Coefficients to the Full Health–Dead Scale Using VAS Data
The steps of rescaling based on the worst health state and mapping were derived from the studies to develop a new scoring algorithm for CHU9D.45,46 The base level was recovered in the effect coded, conditional logit model (Supplementary Table 4). To rescale it based on the PITS health state, effect-coded coefficients in the DCE latent scale were rescaled based on the adjusted mean VAS score for the worst health state, 0.1264 (Supplementary Table 3). The calculated utility values for 4 health states (22211, 33341, 44431, and 44444) in the DCE latent scale (Supplementary Table 4) were 0.8263, 0.2610, 0.0946, and 0.0000, respectively. To map VAS onto DCE, these calculated utility values were regressed onto the adjusted VAS scores shown in Supplementary Table 3, as outlined in equation 6. The estimated coefficient was 0.8319. Table 3 shows the coefficient estimates from effect-coded model and rescaled coefficients based on the worst health state of VAS data and mapping VAS onto DCE.
Estimated and Rescaled Coefficients
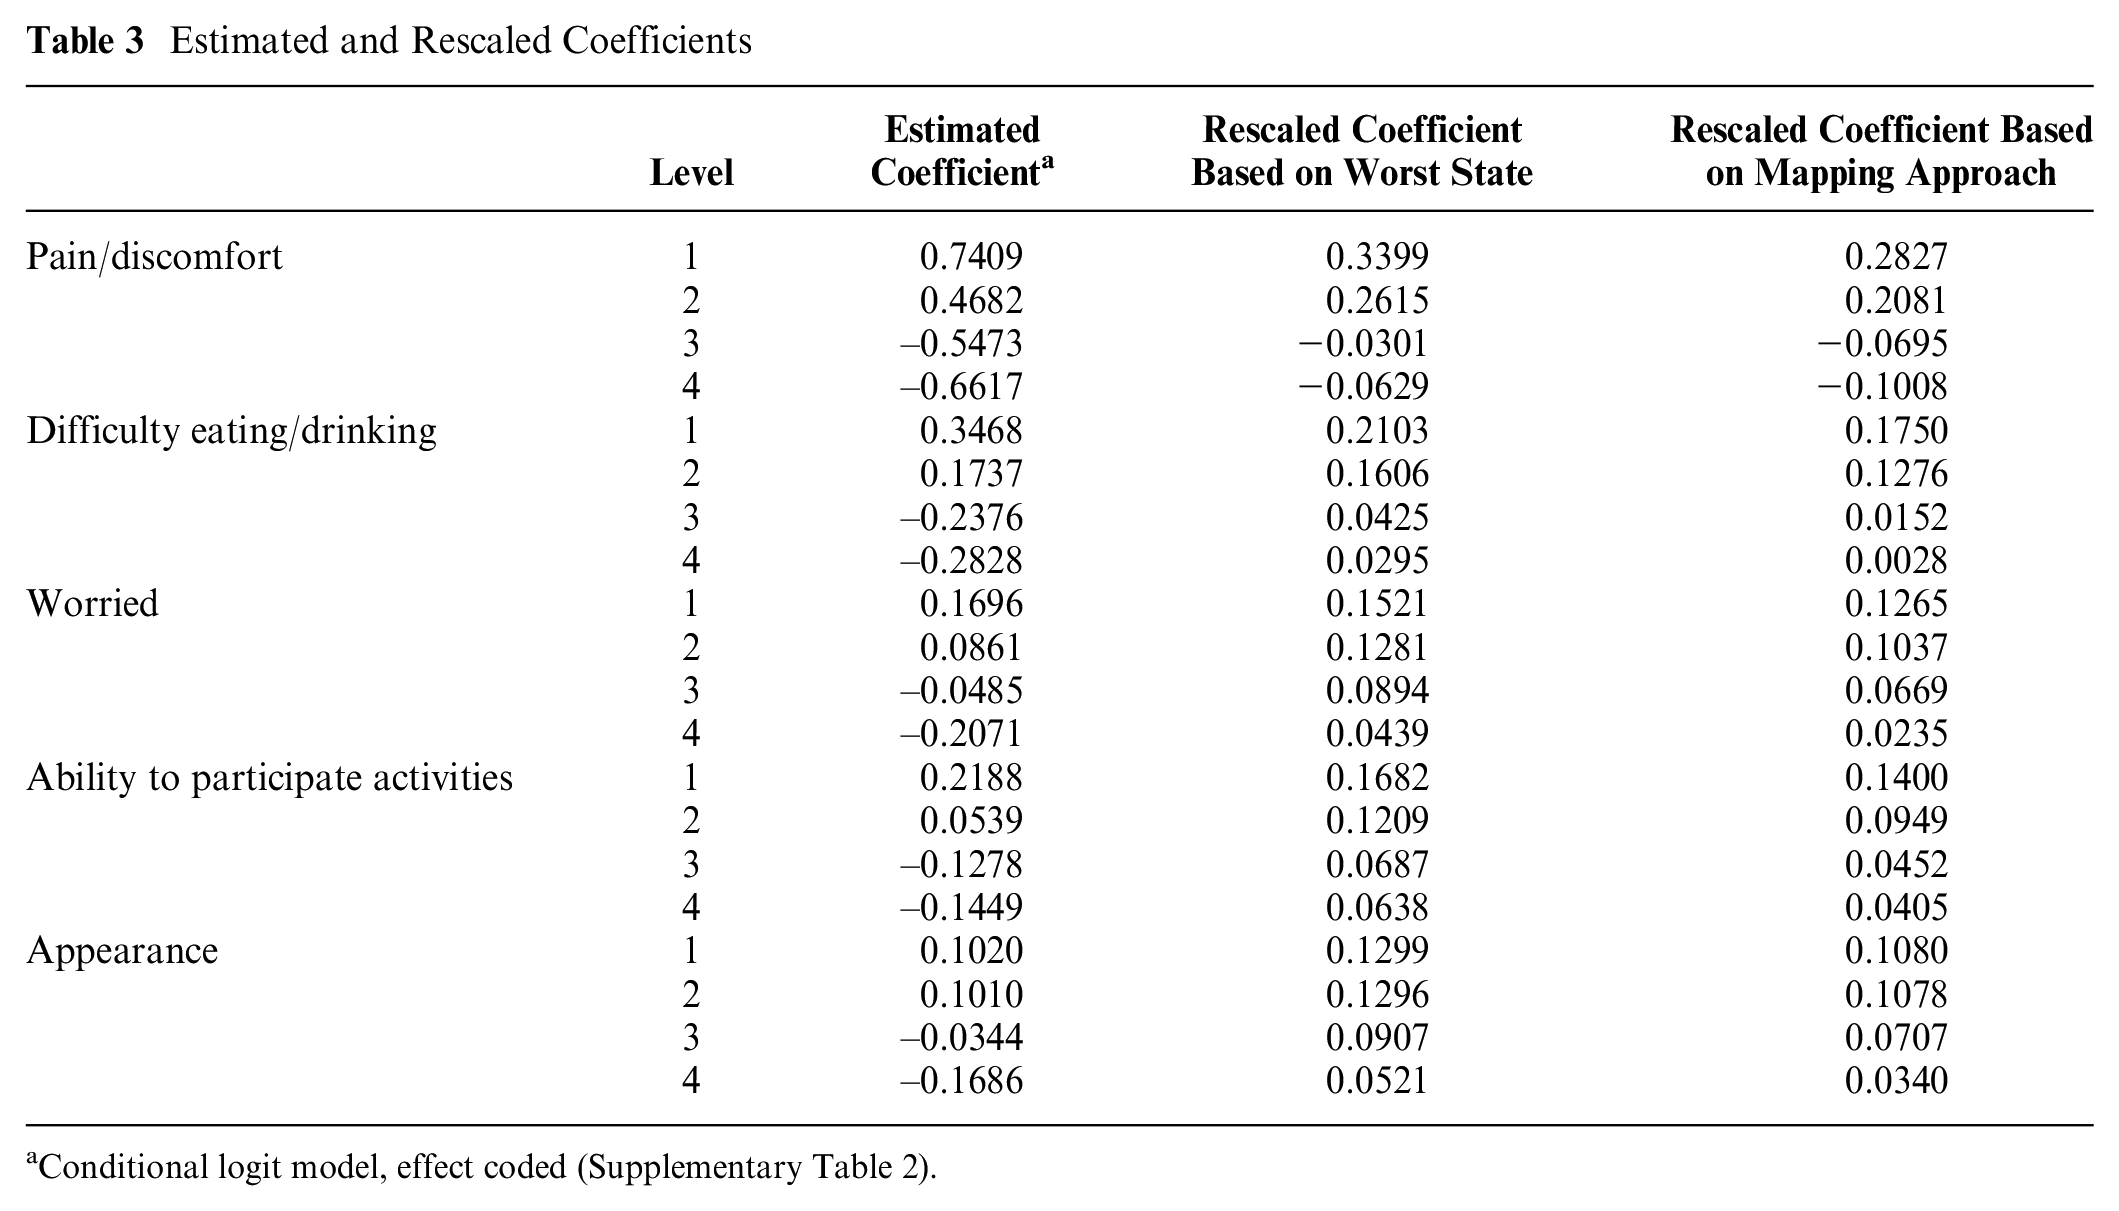
Conditional logit model, effect coded (Supplementary Table 2).
The utility decrements from Table 3 provided the weights for calculating utility values for the health states defined by the DCUI. The goodness-of-fit MAE value indicated that the DCE estimates based on the mapping approach had the lowest MAE and thus performed better than the estimates based on the PITS approach (Table 4). Therefore, the utility algorithm was developed based on the rescaled coefficients from the mapping approach.
Comparison of 2 Rescaling Approaches
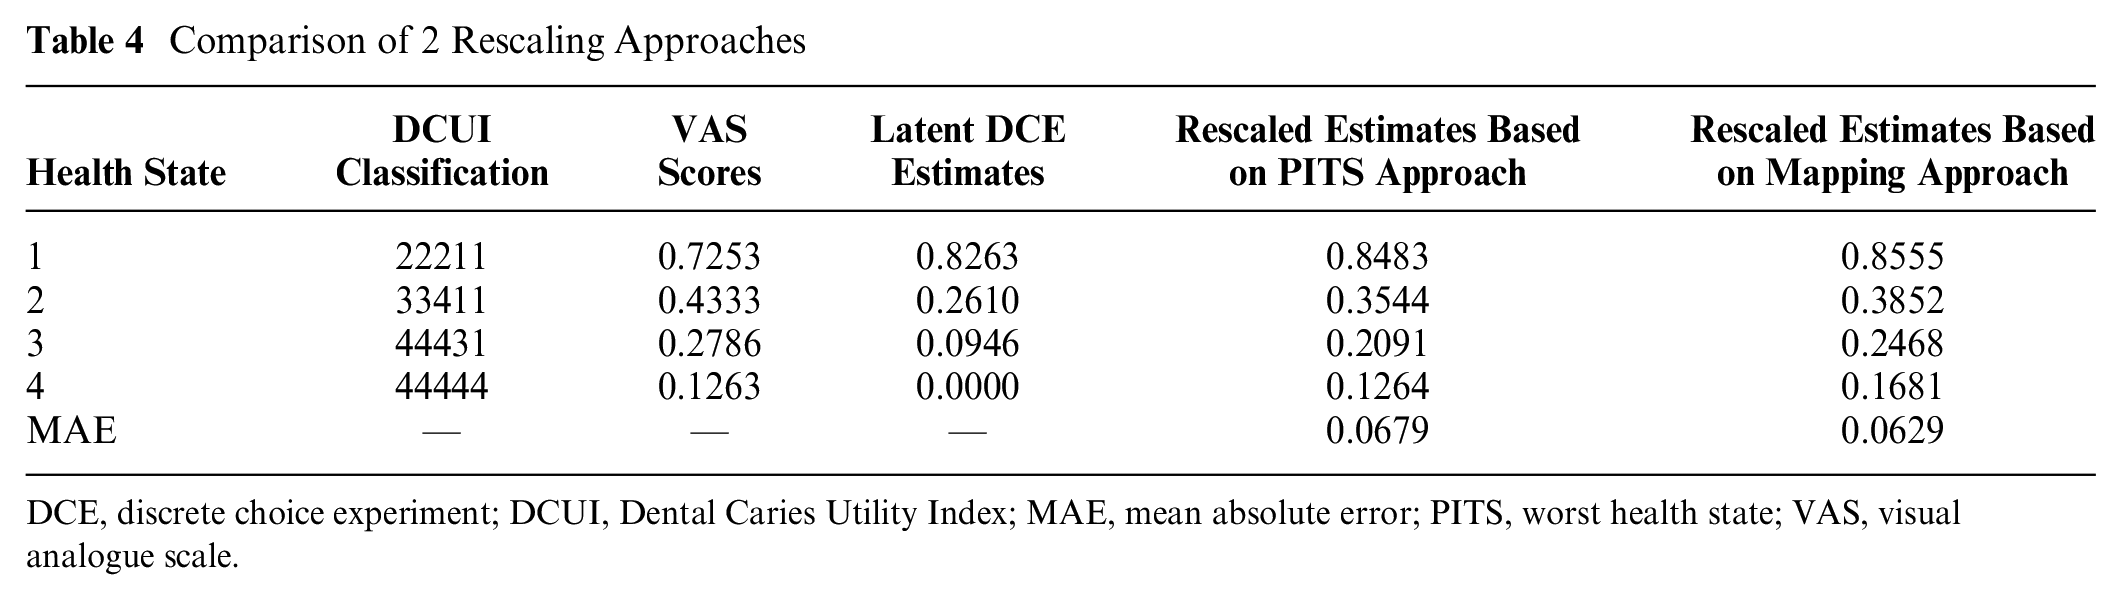
DCE, discrete choice experiment; DCUI, Dental Caries Utility Index; MAE, mean absolute error; PITS, worst health state; VAS, visual analogue scale.
Figure 3 shows the rescaled coefficients (attribute weights) of each dimension based on the mapping approach. The “pain/discomfort” domain was associated with the highest attribute weight decrements for each level, followed by “difficulty eating food/drinking.” Smaller decrements were observed in the “appearance” domain (mainly between levels 1 and 2). The utility value for a health state can be calculated as the sum of the constant and the relevant coefficient for each dimension. For example, the utility value for the worst health state based on the mapping approach was 0.1681, and it was calculated using a regression coefficient of 0.8319 and the constant 0.1681 (1-0.8319) as

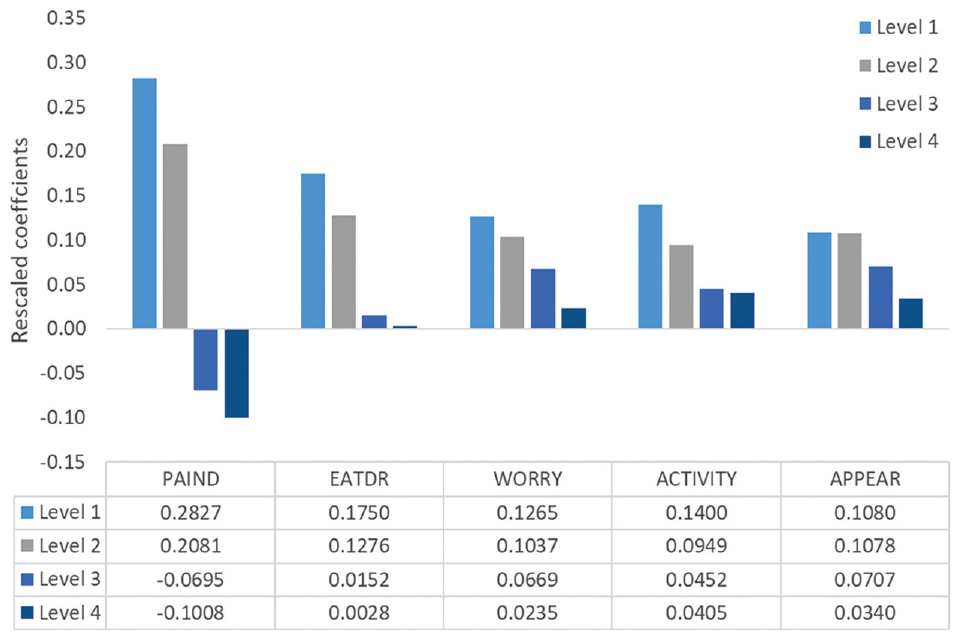
Rescaled coefficients for the Dental Caries Utility Index.
Discussion
We estimated a utility algorithm for the newly developed PBM for dental caries (i.e., DCUI) using an online survey with DCE and VAS approaches and an age- and sex-representative sample of the adult general population in Australia. The value set estimated from this utility algorithm is the first value set for this newly developed PBM for dental caries. We used conditional logit, and the resulting model was logically consistent for all dimensions in which utility decreases as severity increases. A logically consistent model is required to apply the utility algorithm in policy decisions. 27 Therefore, this value set enables the use of DCUI in the economic evaluation of dental caries interventions among Australian adolescents.
The “pain/discomfort” domain had larger attribute weight decrements than the others did, followed by “difficulty eating food/drinking.” This indicates that the average respondent opposed having more severe pain or discomfort. The domains “worried” and “appearance” showed the smallest decrement from level 1 to 2, which indicated that moving between these levels does not significantly affect the utility value. Similar observations were reported in the health state valuation of other oral health–specific PBMs. For example, the ECOHIS-4D health state valuation also reported the highest utility decrement for the “pain” attribute among the 4 attributes of ECOHIS 4D, indicating “pain” as the most important factor for trading off attributes between health states. 8 Moreover, previous health state valuation studies conducted using TTO and SG methods also showed that pain was an important factor influencing dental health state utility values.18,47
The DCUI worst health state (lots of pain or discomfort, lots of difficulties eating food/drinking, very worried, lots of difficulties participating in activities, and very concerned about appearance) has a utility weight of 0.1681. Compared with the utility value of the other oral health–specific PBMs, the DCUI worst health state was valued higher than the worst health state of the ECOHIS-4D (0.0376). 8 Nevertheless, the utility value for the DCUI worst state was lower than the worst health state of the CARIES-QC-U (CARIES-QC 33333 valued at −0.326 in the adolescent value set and −0.402 in the adult value set). 9 The DCUI worst health state utility weight was also lower than the worst health state values in other CSPBMs developed for nonfatal disease conditions. For example, a general population sample valued the worst health state of the PBM developed for atopic dermatitis in children as 0.36. 48 The PITS state of the Asthma Quality of Life-5D (AQL-5D) was 0.39. 49 However, it should be noted that the valuation techniques used in these CSPBMs are quite different from those used in DCUI health state valuation.
The suitability of using VAS in health state valuation and cost-utility analysis is often a debatable topic. VAS is comparatively simple, easy to use, and reliable. 15 However, VAS is often criticized because it does not involve any tradeoff of life-years or risk as in TTO or SG methods. 15 Nevertheless, Parkin and Devlin 50 suggested that VAS has many favorable features as a health state valuation technique when compared with the other methods based on theoretical and empirical evidence related to VAS. The VAS approach has been used in previous oral health studies as a direct health state valuation method to value dental health states’ utilities. 18 However, the health states valued in these oral health studies were not based on a classification system. Although the VAS approach has been applied in previous studies to derive preference weights for health states defined by classification systems, 16 it has not been used to anchor the utility values obtained from DCE studies, except for in a recent valuation study for EQ-5D health states. 19 In this study, the authors identified the VAS approach as a feasible method to anchor DCE results to a full health–dead scale using the worst health state and noted that it is more appropriate for a disease condition in which participants may be reluctant to trade off life-years to achieve a better health state. 19 Dental caries is not a life-threatening condition under normal circumstances. Thus, the present study supported VAS as a feasible and reliable approach to anchor the utility values obtained from DCE in a latent scale onto a full health–dead scale. Furthermore, the present study adds that in addition to the rescaling with the VAS worst health state, mapping VAS onto DCE is also another possible method to rescale DCE coefficients onto a full health–dead scale.
This study has some limitations. The valuation sample was large, and an age- and sex-representative sample was taken from the adult Australian general population. However, the sample’s other sociodemographic characteristics significantly differed from the Australian population average. This is commonly reported in other online studies as well.8,9 The CARIES-QC-U PBM reported both adult and adolescent value sets. The adolescent value set was derived by mapping adolescent best-worst scaling data onto the QALY scale using adult DCETTO values. 9 Although the DCUI measure is intended for adolescents, health state valuations were conducted among an adult sample due to the methodological constraints described in the “Methods” section. The perspective used here is adults on their own health. Therefore, future research is needed to assess whether these health state utility values significantly differ from the preferences elicited from an adolescent sample.
Furthermore, the study was conducted as an online survey. One of the limitations of online surveys is that it is difficult to control the environment and participant engagement; hence, we could not establish real reasons for implausible answers. 12 Participants can complete the surveys in any environment at their convenient time. The implausible answers could be due to the complex nature of the question or simply the lack of participant engagement for a particular question at the time of completion. Some participants in our study also provided logically inconsistent answers for the VAS task, and we were unable to establish reasons for these anomalous responses. However, we performed sensitivity analysis by removing the participants who met VAS exclusion criteria, and modeling suggests data quality was not an issue for the DCE tasks.
Conclusion
This study provides the first utility algorithm for the DCUI PBM for dental caries. This value set will facilitate future utility value calculations from participants’ responses for DCUI in economic evaluations of dental caries interventions.
Supplemental Material
sj-docx-1-mdm-10.1177_0272989X231197149 – Supplemental material for Valuing the Dental Caries Utility Index in Australia
Supplemental material, sj-docx-1-mdm-10.1177_0272989X231197149 for Valuing the Dental Caries Utility Index in Australia by Ruvini M. Hettiarachchi, Sanjeewa Kularatna, Joshua Byrnes, Brendan Mulhern, Gang Chen and Paul A. Scuffham in Medical Decision Making
Footnotes
Acknowledgements
The authors would like to acknowledge the participants of the online survey.
Author’s Note
This research work is a part of Ruvini Hettiarachchi’s doctoral research project submitted to Griffith University, Australia.
Ethics Approval
Ethical approval for this study was obtained from the Human Research Ethics Committee, Griffith University (HREC/2019/550).
Patient Consent
Not applicable as no identifiable data is included in the manuscript.
The authors declared no potential conflicts of interest with respect to the research, authorship, and/or publication of this article. The authors received no financial support for the research, authorship, and/or publication of this article.
Data Availability Statement
The data that support the findings of this study might be available on request from the corresponding author, upon approval by the ethics review committee.
References
Supplementary Material
Please find the following supplemental material available below.
For Open Access articles published under a Creative Commons License, all supplemental material carries the same license as the article it is associated with.
For non-Open Access articles published, all supplemental material carries a non-exclusive license, and permission requests for re-use of supplemental material or any part of supplemental material shall be sent directly to the copyright owner as specified in the copyright notice associated with the article.