
Abstract
Introduction
Countries develop their EQ-5D-5L value sets using the EuroQol Valuation Technology (EQ-VT) protocol. This study aims to assess if extension in the conventional EQ-VT design can lead to development of value sets with improved precision.
Methods
A cross-sectional survey was undertaken in a representative sample of 3,548 adult respondents, selected from 5 different states of India using a multistage stratified random sampling technique. A novel extended EQ-VT design was created that included 18 blocks of 10 health states, comprising 150 unique health states and 135 observations per health state. In addition to the standard EQ-VT design, which is based on 86 health states and 100 observations per health state, 3 extended designs were assessed for their predictive performance. The extended designs were created by 1) increasing the number of observations per health state in the design, 2) increasing the number of health states in the design, and 3) implementing both 1) and 2) at the same time. Subsamples of the data set were created for separate designs. The root mean squared error (RMSE) and mean absolute error (MAE) were used to measure the predictive accuracy of the conventional and extended designs.
Results
The average RMSE and MAE for the standard EQ-VT design were 0.055 and 0.041, respectively, for the 150 health states. All 3 types of design extensions showed lower RMSE and MAE values as compared with the standard design and hence yielded better predictive performance. RMSE and MAE were lowest (0.051 and 0.039, respectively) for the designs that use a greater number of health states. Extending the design with inclusion of more health states was shown to improve the predictive performance even when the sample size was fixed at 1,000.
Conclusion
Although the standard EQ-VT design performs well, its prediction accuracy can be further improved by extending its design. The addition of more health states in EQ-VT is more beneficial than increasing the number of observations per health state.
Highlights
The EQ-5D-5L value sets are developed using the standardized EuroQol Valuation Technology (EQ-VT) protocol. This is the first study to empirically assess how much can be gained from extending the standard EQ-VT design in terms of sample size and/or health states. It not only presents useful insights into the performance of the standard design of the EQ-VT but also tests the potential extensions in the standard EQ-VT design in terms of increasing the health states to be directly valued as well as the number of observations recorded to predict the utility value of each of these health states.
The study demonstrates that the standard EQ-VT design performs good, and an extension in the design of the standard EQ-VT can lead to further improvement in its performance. The addition of more health states in EQ-VT is more beneficial than increasing the number of observations per health state. Extending the design with inclusion of more health states marginally improves the predictive performance even when the sample size was fixed at 1,000.
The findings of the study will streamline the systematic process for generating precise EQ-5D-5L value sets, thus facilitating the conduct of credible, transparent, and robust outcome valuation in health technology assessments.
Keywords
The EQ-5D is a health-related quality of life (HRQoL) questionnaire widely used in health economic, clinical, and population health studies. 1 Developed by the EuroQol Group, it is a standardized generic instrument that collects descriptive HRQoL information on 5 dimensions (mobility, self-care, usual activities, pain/discomfort, anxiety/depression), and the EQ-5D-5L is a version having 5 levels of severity associated with every dimension. 2 An EQ-5D-5L health state is a set of responses to the 5 dimensions and is represented as a 5-digit number (e.g., 11111, 11112, etc.), with each digit representing the level of problem in the respective dimension. In total, there are 3,125 possible health states in the EQ-5D-5L descriptive system. The HRQoL of a patient is measured using the EQ-5D-5L descriptive system and then scored and represented by its utility score/weight/value. Thus, all possible 3,125 health states have a value attached with it, which indicates how good or bad HRQoL in that health state is according to the population preference.3,4 The range of utility values lies between −1 and 1, wherein a utility value of 1 means perfect health and 0 implies death. The health states having utility value < 0 are known as “worse than dead.” A value set contains utility values of all the 3,125 health states, which are derived through a valuation study. Thus, a value set consists of weights that can convert each EQ-5D-5L health state into a value on a scale anchored at 1 (meaning full health) and 0 (meaning a state as bad as being dead). 5 The scale allows negative values to be assigned to health states that are worse than dead.
As these utility values represent people’s preferences, various cultural and sociodemographic differences in preferences for health among the countries limit the transferability of utility scores,6,7 necessitating each country to have its own value set. However, performing such a valuation study for EQ-5D-5L is a challenge in terms of the tradeoff between feasibility and validity, as the conduct of a valuation interview is a cognitively demanding and time-consuming exercise. The EQ-5D-5L defines 3,125 states, which ideally should all be valued with the help of valuation interviews but is infeasible under the standard conditions due to the complex nature of valuation interviews. Hence, the EuroQol group prescribes a protocol (EuroQol Valuation Technology; EQ-VT) for the development of value sets, in which preference data are collected for a subset of EQ-5D-5L health states (86 health states), using composite time tradeoff (c-TTO) and discrete choice experiment (DCE). The population preferences for these 86 health states are modeled to predict the values for all the 3,125 health states to create a value set.8,9 Although c-TTO is the primary method of valuation in the EQ-VT, it is not the only method as the EQ-VT also prescribes 28 DCE blocks, with each block containing 7 pairs of health states. Nevertheless, some country-specific value sets are based solely on the c-TTO data, justifying the further development of the c-TTO methods. 10
As the requirement of the value sets rapidly increases due to the increased use of health technology assessment (HTA) in decision making across the globe, the pertinent questions while developing a value set are as follows. First, how many health states are required to be directly valued (observed through interviewing respondents) to predict the utility value of all the 3,125 health states with sufficient precision? Second, how many observations per health state are required to obtain sufficiently stable (reliable) utility values for health states? In the standard EQ-VT design, the target sample size is kept as 1,000 to ensure the feasibility of the obligatory protocol. 8 It has been observed in many empirical assessments that the standard EQ-VT design performs well.11,12 However, no study to date has been able to explore how much can be gained from extending the standard EQ-VT design in terms of sample size and/or health states. The EQ-5D-5L valuation study done in India provided an excellent opportunity to investigate this aspect, as the study aimed for a much larger sample to ensure the sample representativeness in such a large country, in terms of both demography and geography. 13 Thereby, our study evaluates if the predictive performance of the standard EQ-VT design improves with an increase in the number of health states to be directly valued and/or an increase in the number of observations per health state.
Methods
Study Settings and Sampling Approach
The data for this study were collected as a part of the Indian EQ-5D-5L valuation study (Development of an EQ-5D Value set for India using the Extended design; DEVINE study).13,14 The Indian EQ-5D-5L value set has been developed using the extended design, and the analysis presented here is a subproduct of the DEVINE study. The study was undertaken in 5 regions/states of India. The selection of regions was based on 3 criteria: income, health status, and geographical representation. The respondents were selected using a multistage stratified random sampling technique. To obtain a sample representative of the country’s population, the sample selection involved a rigorous process wherein the selection was made at 5 different levels (i.e., at the level of regions, districts, primary sampling units, households, and the individuals to be interviewed). The detailed approaches describing the selection of study settings, samples, interview process, and quality control have been published separately.13,14
In contrast to the proposed sample size of 1,000 in the standard EQ-VT design, the DEVINE study was conducted on a much larger sample of 3,548 and with an extended design increasing the number of health states from 86 to 150 and the number of respondents per health state from 100 to 135. 13 By sampling different subsets of observations from the DEVINE data set, we could study the performance of the standard EQ-VT design compared with designs that included more health states, more observations per state, or both.
Extended EQ-VT Designs
The tested designs are presented in Table 1. Briefly, the study included 4 designs. The predictive performance of 3 types of EQ-VT design extensions was compared with the standard EQ-VT design. The standard EQ-VT design was included as a reference case. It contains 10 blocks of 10 health states, and each block is randomly allocated to about 100 respondents, as it is optimized for a sample of 1,000. 8 Across the 10 blocks, the design has 86 unique health states. In each of the 10 blocks, 2 states were fixed: all blocks included 1 of the 5 very mild states (following coding conventions denoted as states 11112, 11121, 11211, 12111, and 21111) and the worst possible EQ-5D-5L state (state 55555). The other 8 states per block, 80 states in total, were selected using an algorithm. The extended EQ-VT designs were created by increasing the number of blocks from 10 to 18, and the target was to increase the number of respondents per block from 100 to 135. The results allow us to explore the individual and combined effect of the 2 design extensions on the model’s predictive performance. Thereby, we implemented 3 possible design improvements by 1) increasing the number of observations per health state in the design, 2) increasing the number of health states in the design, and 3) implementing both 1) and 2) at the same time.
Specifications of the Standard and Extended EQ-VT Designs Used in the DEVINE Study
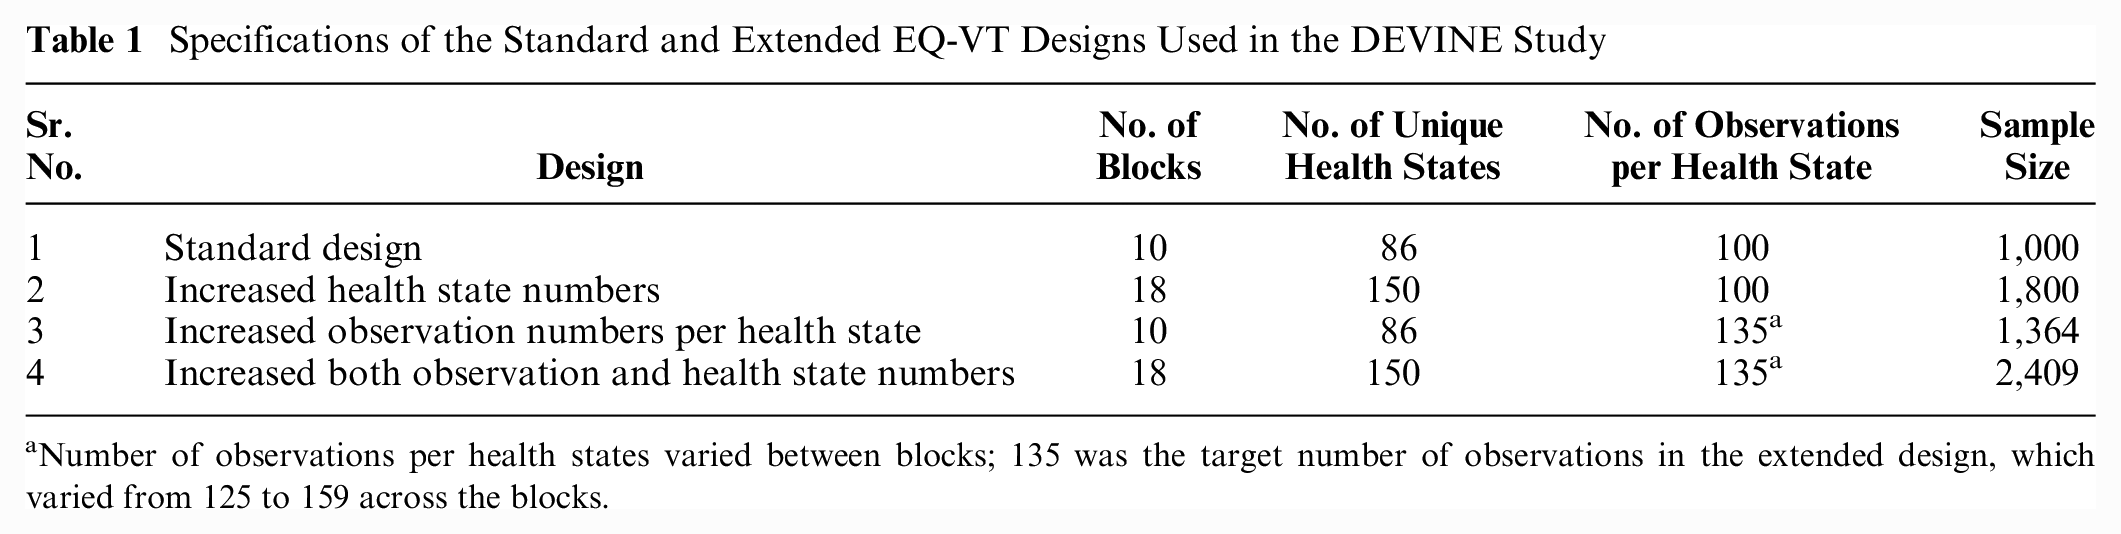
Number of observations per health states varied between blocks; 135 was the target number of observations in the extended design, which varied from 125 to 159 across the blocks.
The extended EQ-VT designs did not make change to the basic EQ-VT design part (i.e., 10 blocks and 86 health states). The health states that were included in the 8 new blocks were selected following the same procedures, which is used to select the health states for the existing 10 blocks, that is, each block contains 8 unique health states and 1 mild state (out of 11112, 11121, 11211, 12111, and 21111) as well as 55555 health state, and 64 health states were selected from the remaining 3,039 EQ-5D-5L states using an efficient design algorithm. 15 Thereby, in the extended design, there are 18 blocks (10 basic and 8 new), with 10 health states in each block. The total number of unique health states in the extended design is 150 (86 basic and 64 new). This selection of additional health states was guided by added-value considerations, taking the initial blocks as the points of departure. 13 The additional health states for the c-TTO were selected using an efficient design procedure, which minimized the D-Error. To select 64 additional c-TTO health states, 64 new states were randomly drawn from the 3,039 health states and appended on the existing 86 states to form a design. This process was repeated 5,000 times, and 5,000 candidate designs were created. Candidate designs with poor level balance were discarded. Next, we examined the D-efficiency of the designs and kept the best 100 candidate designs. Then we examined the prediction accuracy of the best 100 designs in a saturated data set. 11 Finally, we computed the implausible scores of the 5 candidate designs that have the highest prediction accuracy based on previous step, and the least implausible candidate design was used. Health states being implausible refers to those health states that respondents may find unrealistic, for example, a health state has an extreme problem with mobility but has no problem with usual activities. 16 The more variance there is between the health state levels, the higher the implausible score. 17
In addition to increasing the number of health states in the standard EQ-VT design, the available number of observations per health state was also increased in the extended design. This was done with the help of increasing the sample size. In contrast to the proposed sample size of 1,000 in the standard EQ-VT design, the DEVINE study was conducted on a much larger sample of 2,409. 13 Therefore, the average number of available observations for each health state was increased from 100 to 135. The detailed specifications of all the designs used in the study are presented in Table 1.
Each respondent was randomly assigned 1 c-TTO block by the EQ-VT software. The order of the health states being valued was also randomized within the c-TTO block. Subsamples of the data set were created for all the separate designs mentioned in the Table 1, except for the design with more observations and more health states (sr. no. 4), wherein all the available sample was used. Designs with 100 observations per health state (basic design and design with more health states) were required to draw 100 observations randomly from the total sample. Because this random selection of the subsample could introduce a bias, we repeated the random drawing process for 100 times using bootstrapping and presented the average results of 100 random draws in our study.
Since these extended designs are all implemented with an increased sample size, we added 1 more scenario to control for confounding: this scenario has an increased number of health states in the design paired with a fixed sample size of N = 1,000. This scenario was implemented with a lower number of 56 observations per health state. Also, for this design, we report the average prediction results over 100 random draws of 56 observations per state as well as the minimum and maximum.
Estimation of Predicted Utility Values
To estimate the predicted utility values of all the 3,125 health states in the EQ-5D-5L descriptive system, we used 20-parameter generalized least square (GLS) additive model, with censoring at −1. 14 The basic equation for the main effects GLS regression with random intercept was as follows:
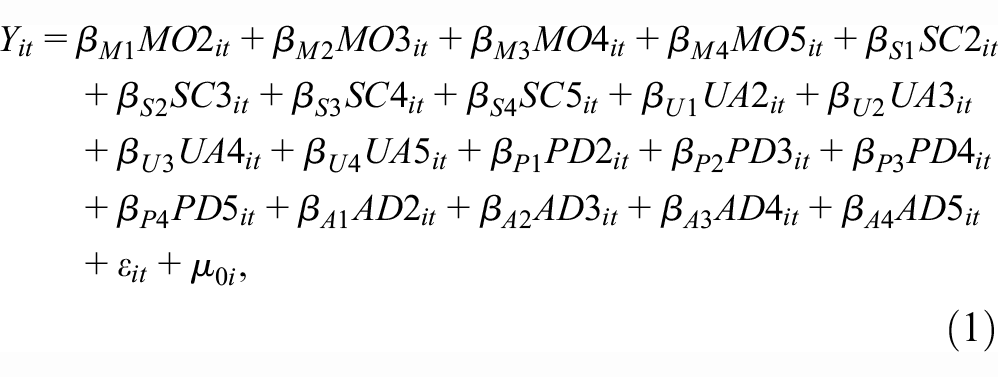
where
i respondent
t data set panel structure (since there were 10 c-TTO questions per respondent).
MO, SC, UA, PD, and AD are dummy-coded regressors for mobility, self-care, usual activities, pain/discomfort, and anxiety/depression, representing the 5 levels of EQ-5D-5L.
The constant reflected the utility decrement associated with any deviation from full health. The model assumed a latent variable

Evaluation of Predictive Performance of Different Designs
The root mean squared error (RMSE) and mean absolute error (MAE) between observed and predicted utility values were considered as the primary measure of prediction performance (i.e., the lower the value of RMSE and MAE, the better the performance). 11 For all the alternative designs considered in the study, we calculated the RMSE and MAE for all 150 health states, for 86 health states included in the basic EQ-VT design, and for 64 new health states included in the extended EQ-VT design. We summarized the RMSE and MAE of all designs using a boxplot to combine the results of the simulations per specific design. The RMSE and MAE of the basic EQ-VT design were added in the boxplot as a reference. We defined the most efficient design as the one that systematically achieved the lowest RMSE and MAE.
Because the basic EQ-VT design is optimized for a sample of 1,000, to evaluate the performance of the extended design with a greater number of health states in a valuation study using the same sample size, we performed a scenario analysis fixing the sample size at 1,000. For the basic EQ-VT design with 10 blocks (86 unique health states), the number of observations available per health state were 100. However, for the extended design with a greater number of health states, the number of observations per health state was reduced to 56, as the sample size was now fixed at 1,000. This analysis also has a random draw process and was repeated 100 times.
Results
Sample Characteristics
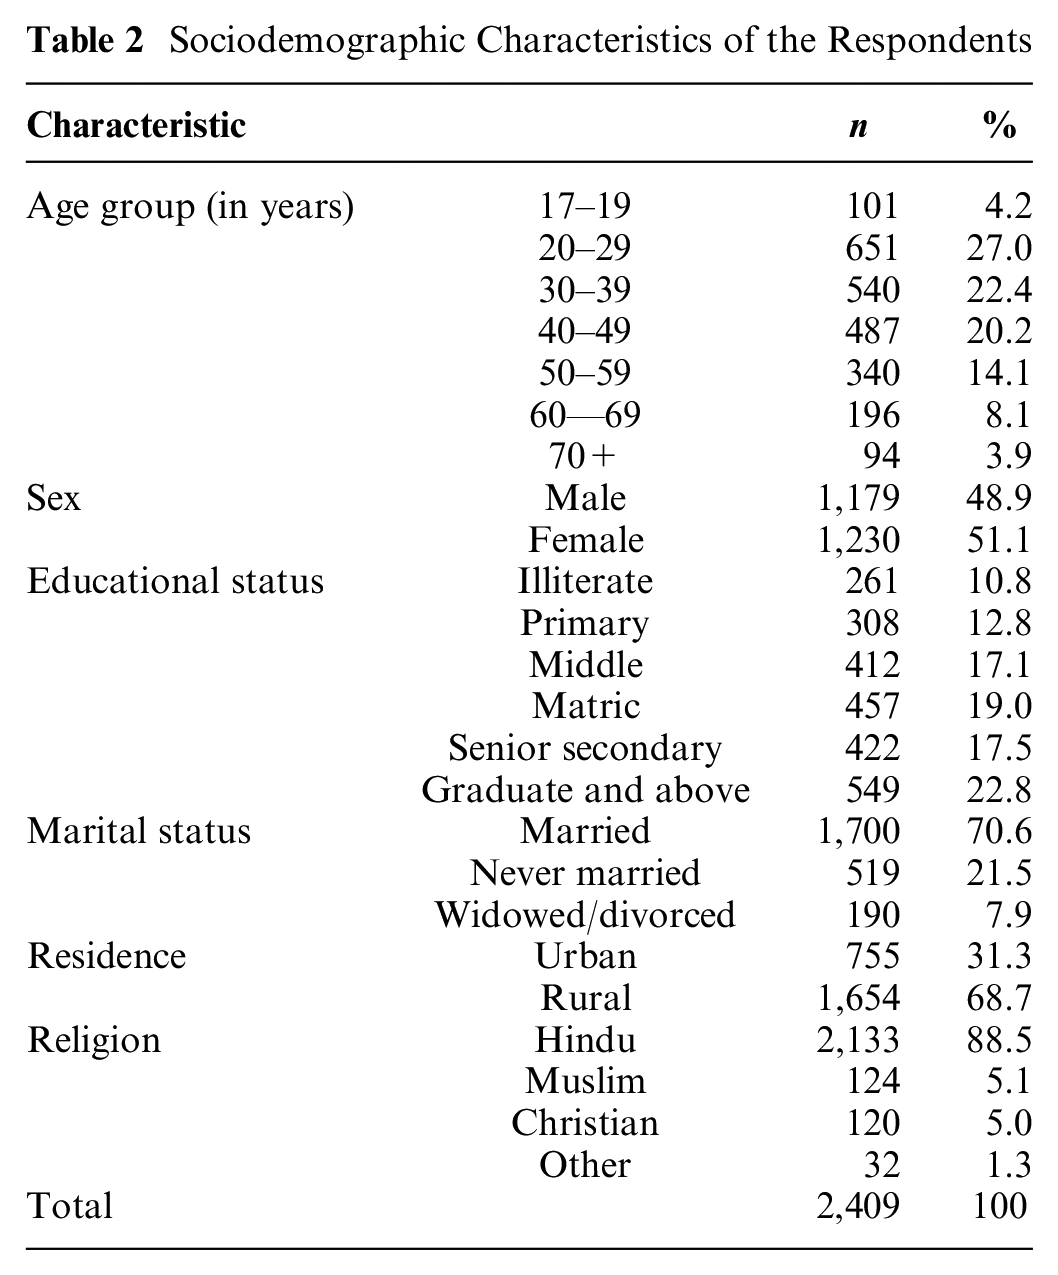
A total of 3,548 interviews were conducted between June 2019 and March 2020. All 2,409 interviews included in the development of the EQ-5D-5L value set for India were considered in the analysis. The interviews that were not included in the final analysis were predominantly pilot interviews (n = 788). Such a large pilot was conducted to ensure protocol compliance and minimize the interviewers’ effect, considering the limited literacy rate of the Indian population, and to standardize the data collection process across all the study sites as well as interviewers. The remaining interviews that were not included in the analysis were either requested for noninclusion by the respondents because of their lack of understanding (n = 301) or were flagged by the interviewers due to the respondents’ lack of involvement (n = 50). The sample characteristics of the respondents are summarized in Table 2.
Sociodemographic Characteristics of the Respondents
Performance of Basic and Extended EQ-VT Designs
Table 3 presents the RMSE and MAE for of the standard EQ-VT design (86 states) and the 3 extended designs. The columns present the overall RMSE and MAE as computed over the 150 states for which we have observations, with the rows indicating which observations were used as basis for predicting values. The other columns separate out the prediction results for the 86 states always used as the basis for predictions and the 64 states used only in extended designs 2 and 4. It demonstrates that all 3 types of design extensions showed lower RMSE and MAE compared with the conventional design and slightly outperformed the standard EQ-VT design. Further, the values of RMSE and MAE were lowest (0.051 and 0.039, respectively) for both the designs that use a greater number of health states. There was no additional gain in the predictive performance when moving from the design with more health states to the design with both more observations and more health states. This implies that the design with more health states may be preferred over the design with both more observations and more health states because of its reduced sample requirement.
RMSE and MAE for All EQ-VT Designs Considered in the Study
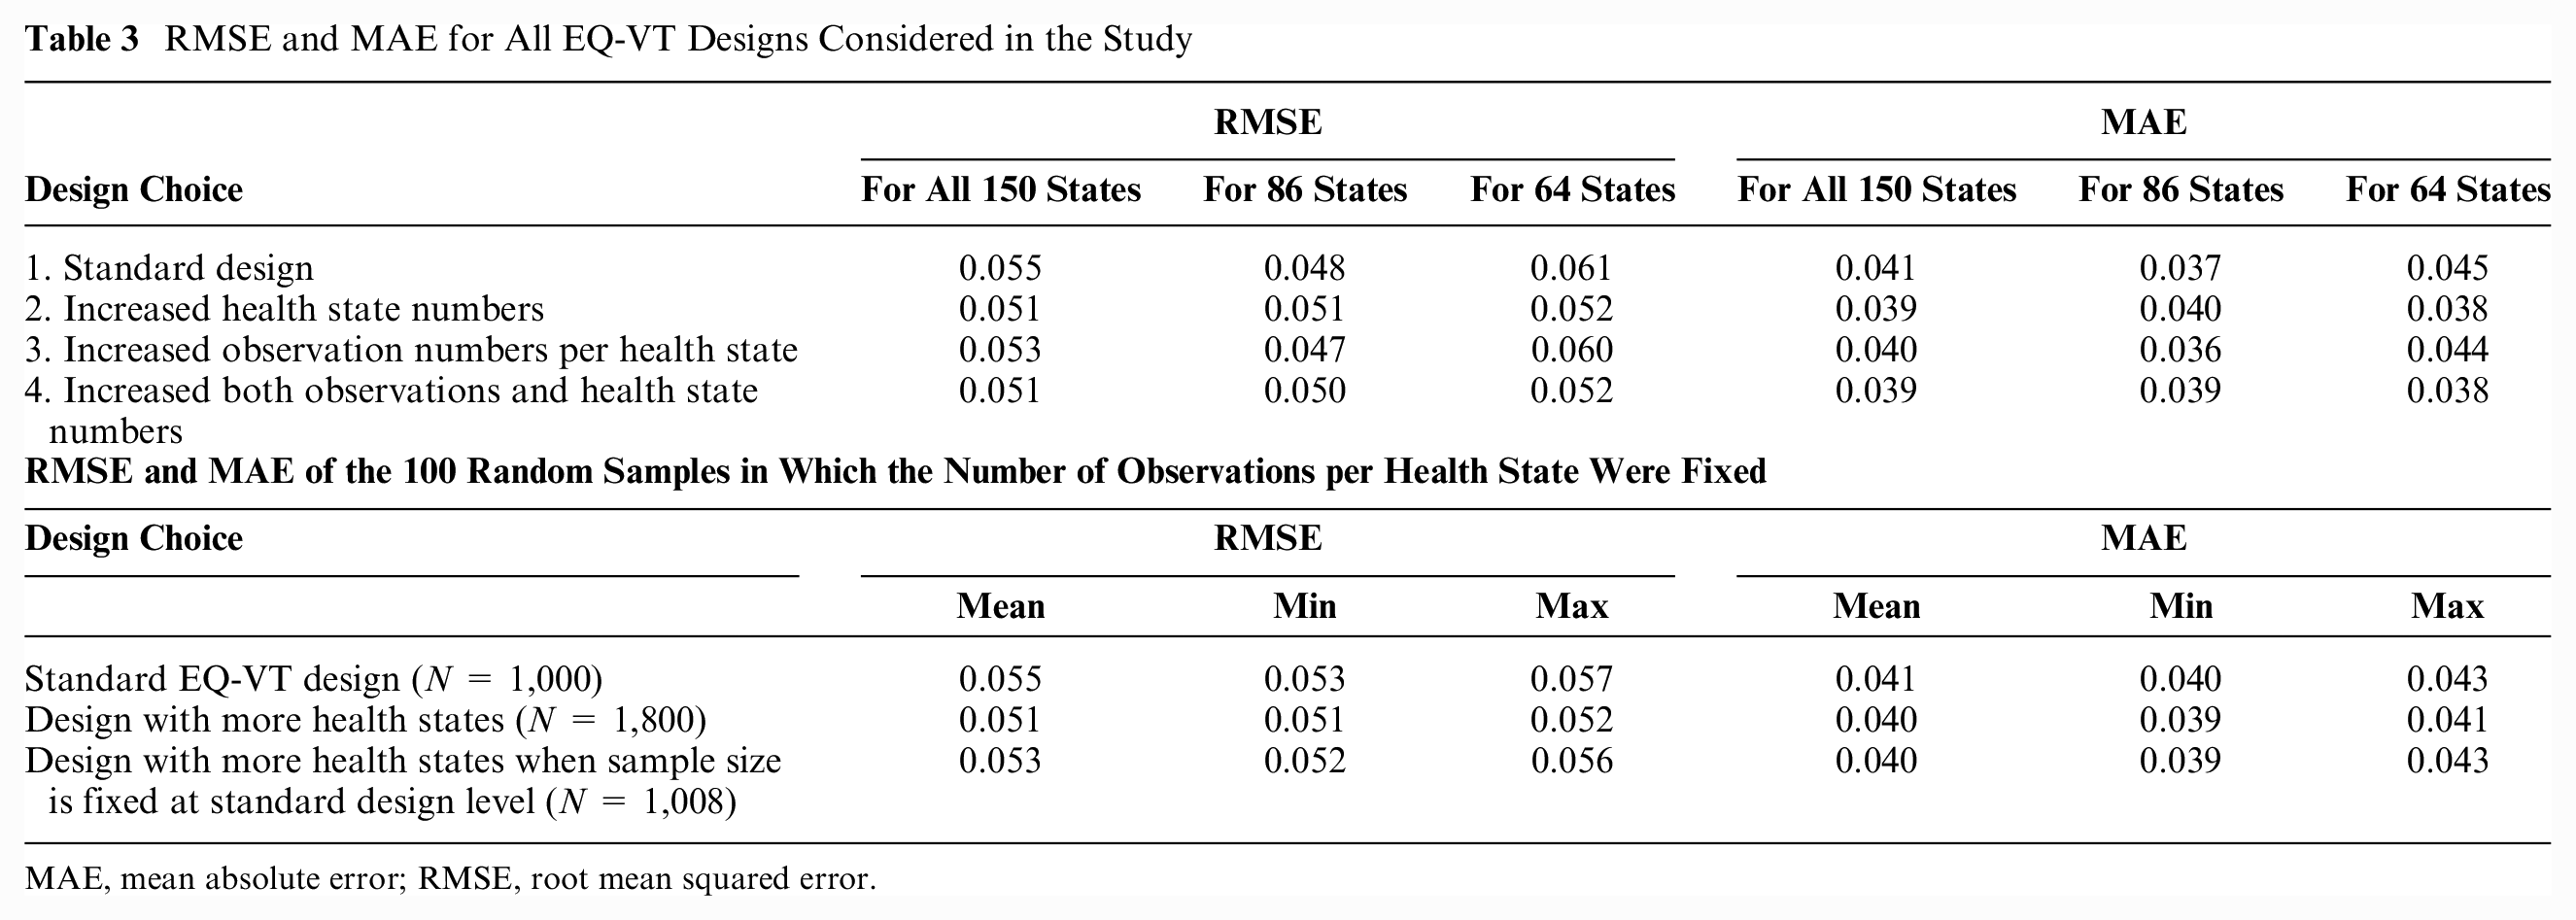
MAE, mean absolute error; RMSE, root mean squared error.
For all of the design specifications, apart from measuring the values of RMSE and MAE for all 150 health states, we have also separately reported the values of RMSE and MAE for the 86 health states that are included in the basic/conventional EQ-VT design and for the 64 new health states that are included in the extended design. These values were measured to assess how design extensions affect the prediction of health states that are empirically observed and health states that are not empirically observed (i.e., out of sample). Among all the design specifications, for the new 64 health states, the values of RMSE and MAE were lowest for the designs with more health states (i.e., 0.052 and 0.038, respectively; Table 3). These values imply that increasing the number of health states improves the prediction of those health states that are not empirically observed. Among all design specifications, for the conventional 86 health states, the values of RMSE and MAE were lowest for the design with a greater number of observations per health state (i.e., 0.047 and 0.036, respectively; Table 3). This implies that increasing the number of observations improves the prediction of those health states that are empirically observed in the conventional EQ-VT.
To spot how the MAE varies over the health state values, we plotted the Bland-Altman plot between the predicted values and the observed values (Figure 1) and the MAE for each misery index/level sum score group (Figure 2). The level sum score is an indicator of the severity of a health state, and it is calculated by adding the levels on each dimension. 5 For instance, the best EQ-5D-5L health state involves having no problems on any dimension and is represented as 11111. Treating the level labels as numbers, the level sum score for this health state would be (1 + 1 + 1 + 1 + 1)= 5. As the Bland-Altman plot is a method for comparing 2 measurements of the same variable, on the x-axis, the mean of 2 measurements was taken, and on the y-axis, the difference between the 2 measurements was taken. Figure 1 demonstrates that the relationship between the predicted values and observed values was similar across 3 improvement choices and the standard design. Figure 2 further confirms the results. In Figure 2, the standard design shows a higher MAE for level sum score in groups 10 and 24, but neither of 3 improvements lowered the MAE for these 2 groups. Of the 4 designs considered in the study, 2 designs (standard EQ-VT design and the design with more health states) contain the specification of 100 observations per health state. Because these 2 designs needed to draw 100 observations randomly from the total sample, we repeated the random drawing process 100 times using bootstrapping. Table 3 also summarizes the average results of 100 random draws for both of these designs. A boxplot of the 100 draws for both of these designs is presented in Figure 3.
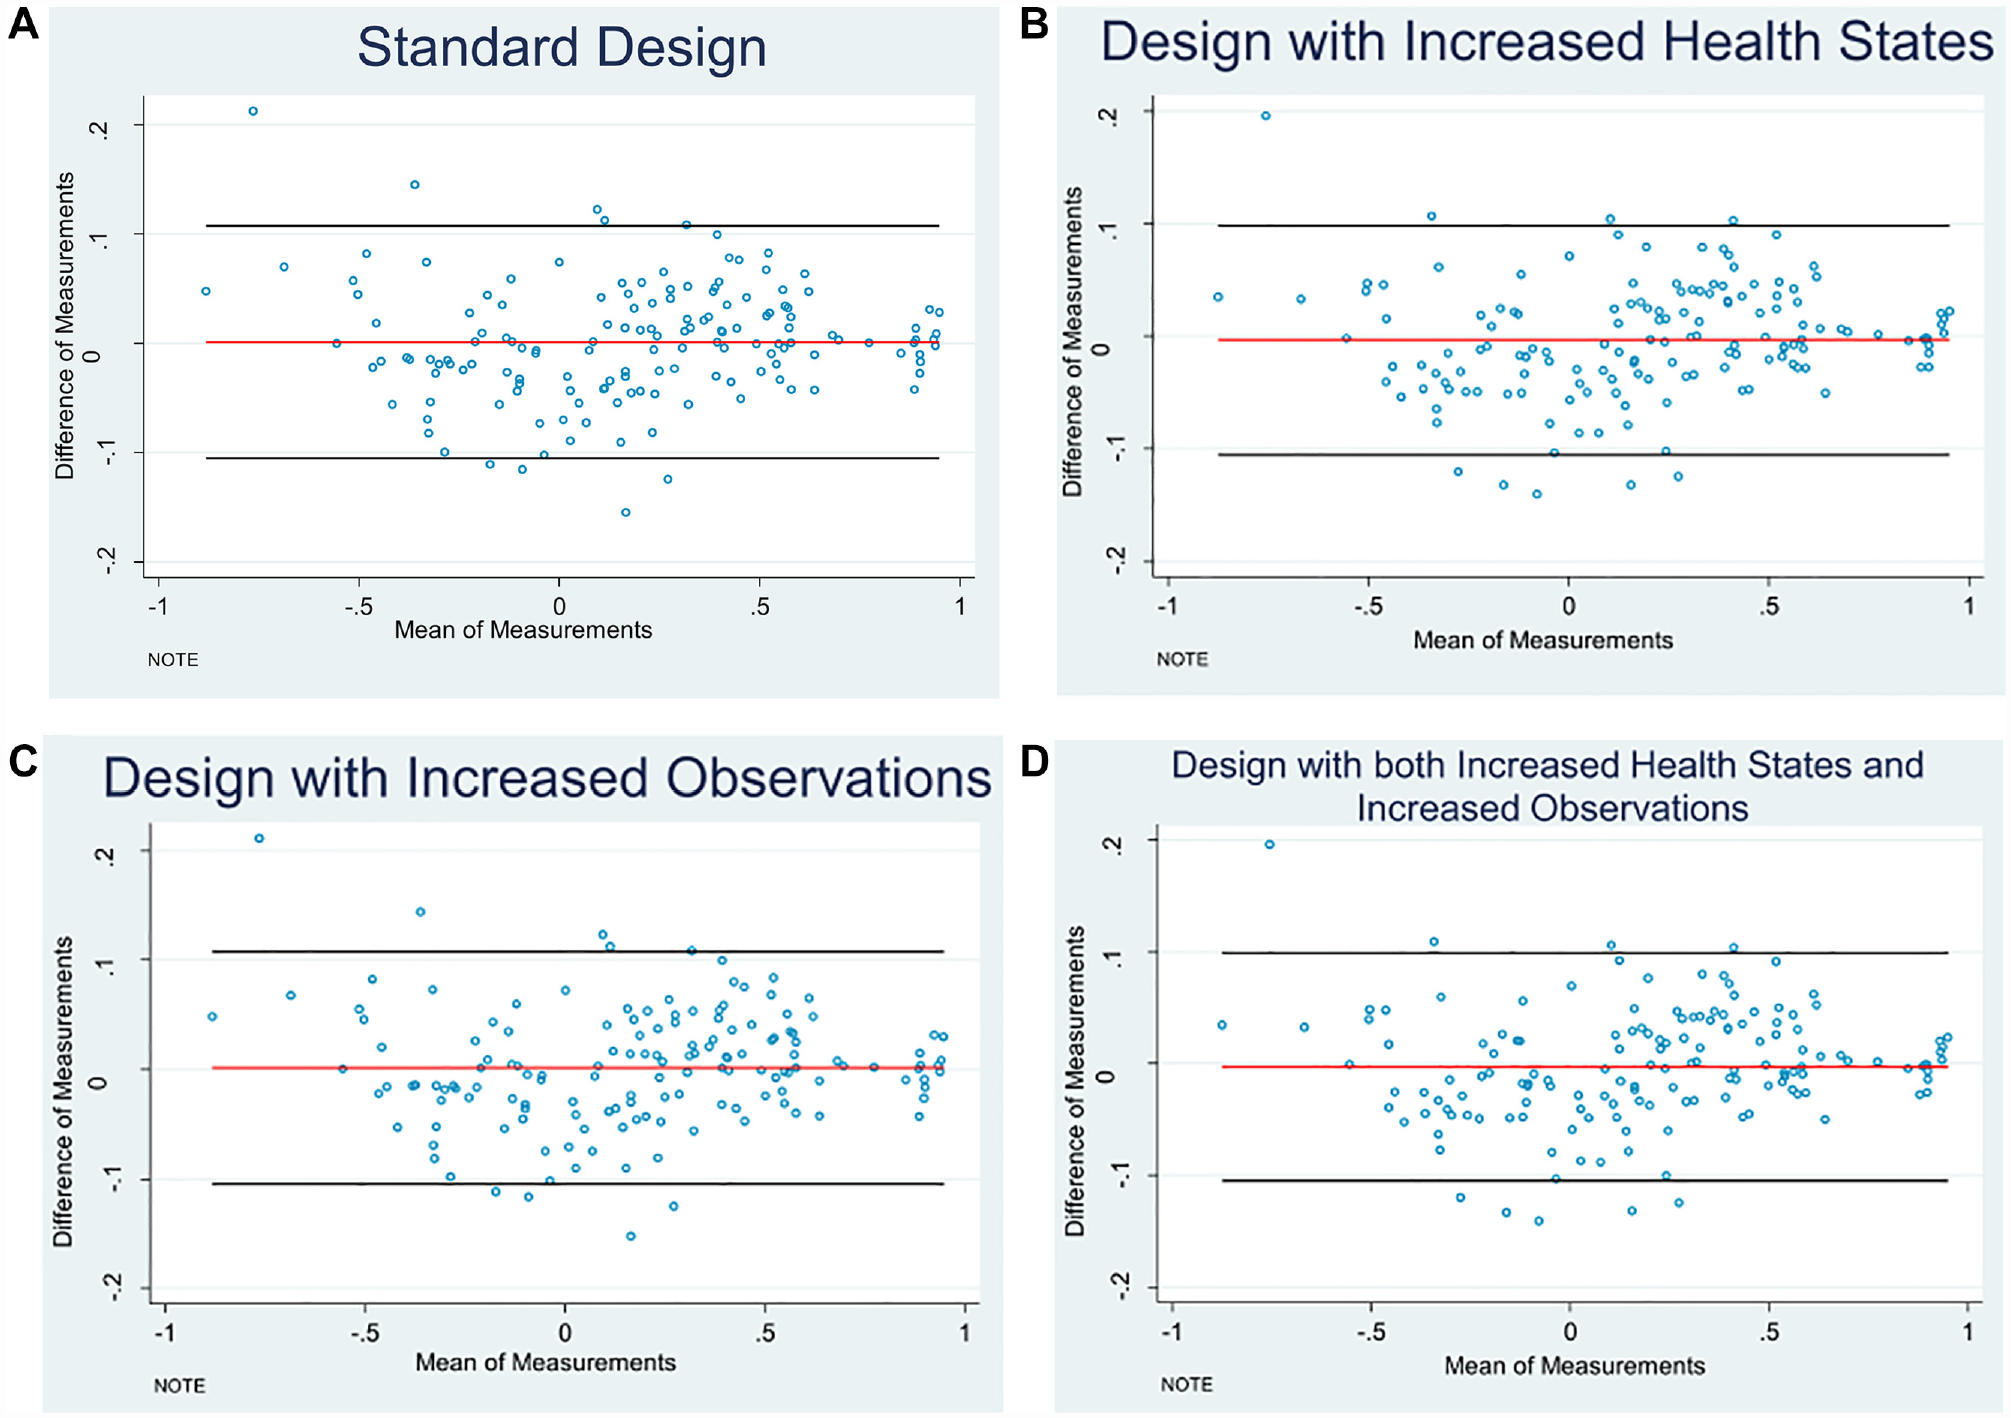
Bland-Altman plots of the prediction values by different design choices: (A) Standard design. (B) Design with increased health states. (C) Design with increased observations. (D) Design with both increased health states and increased observations.
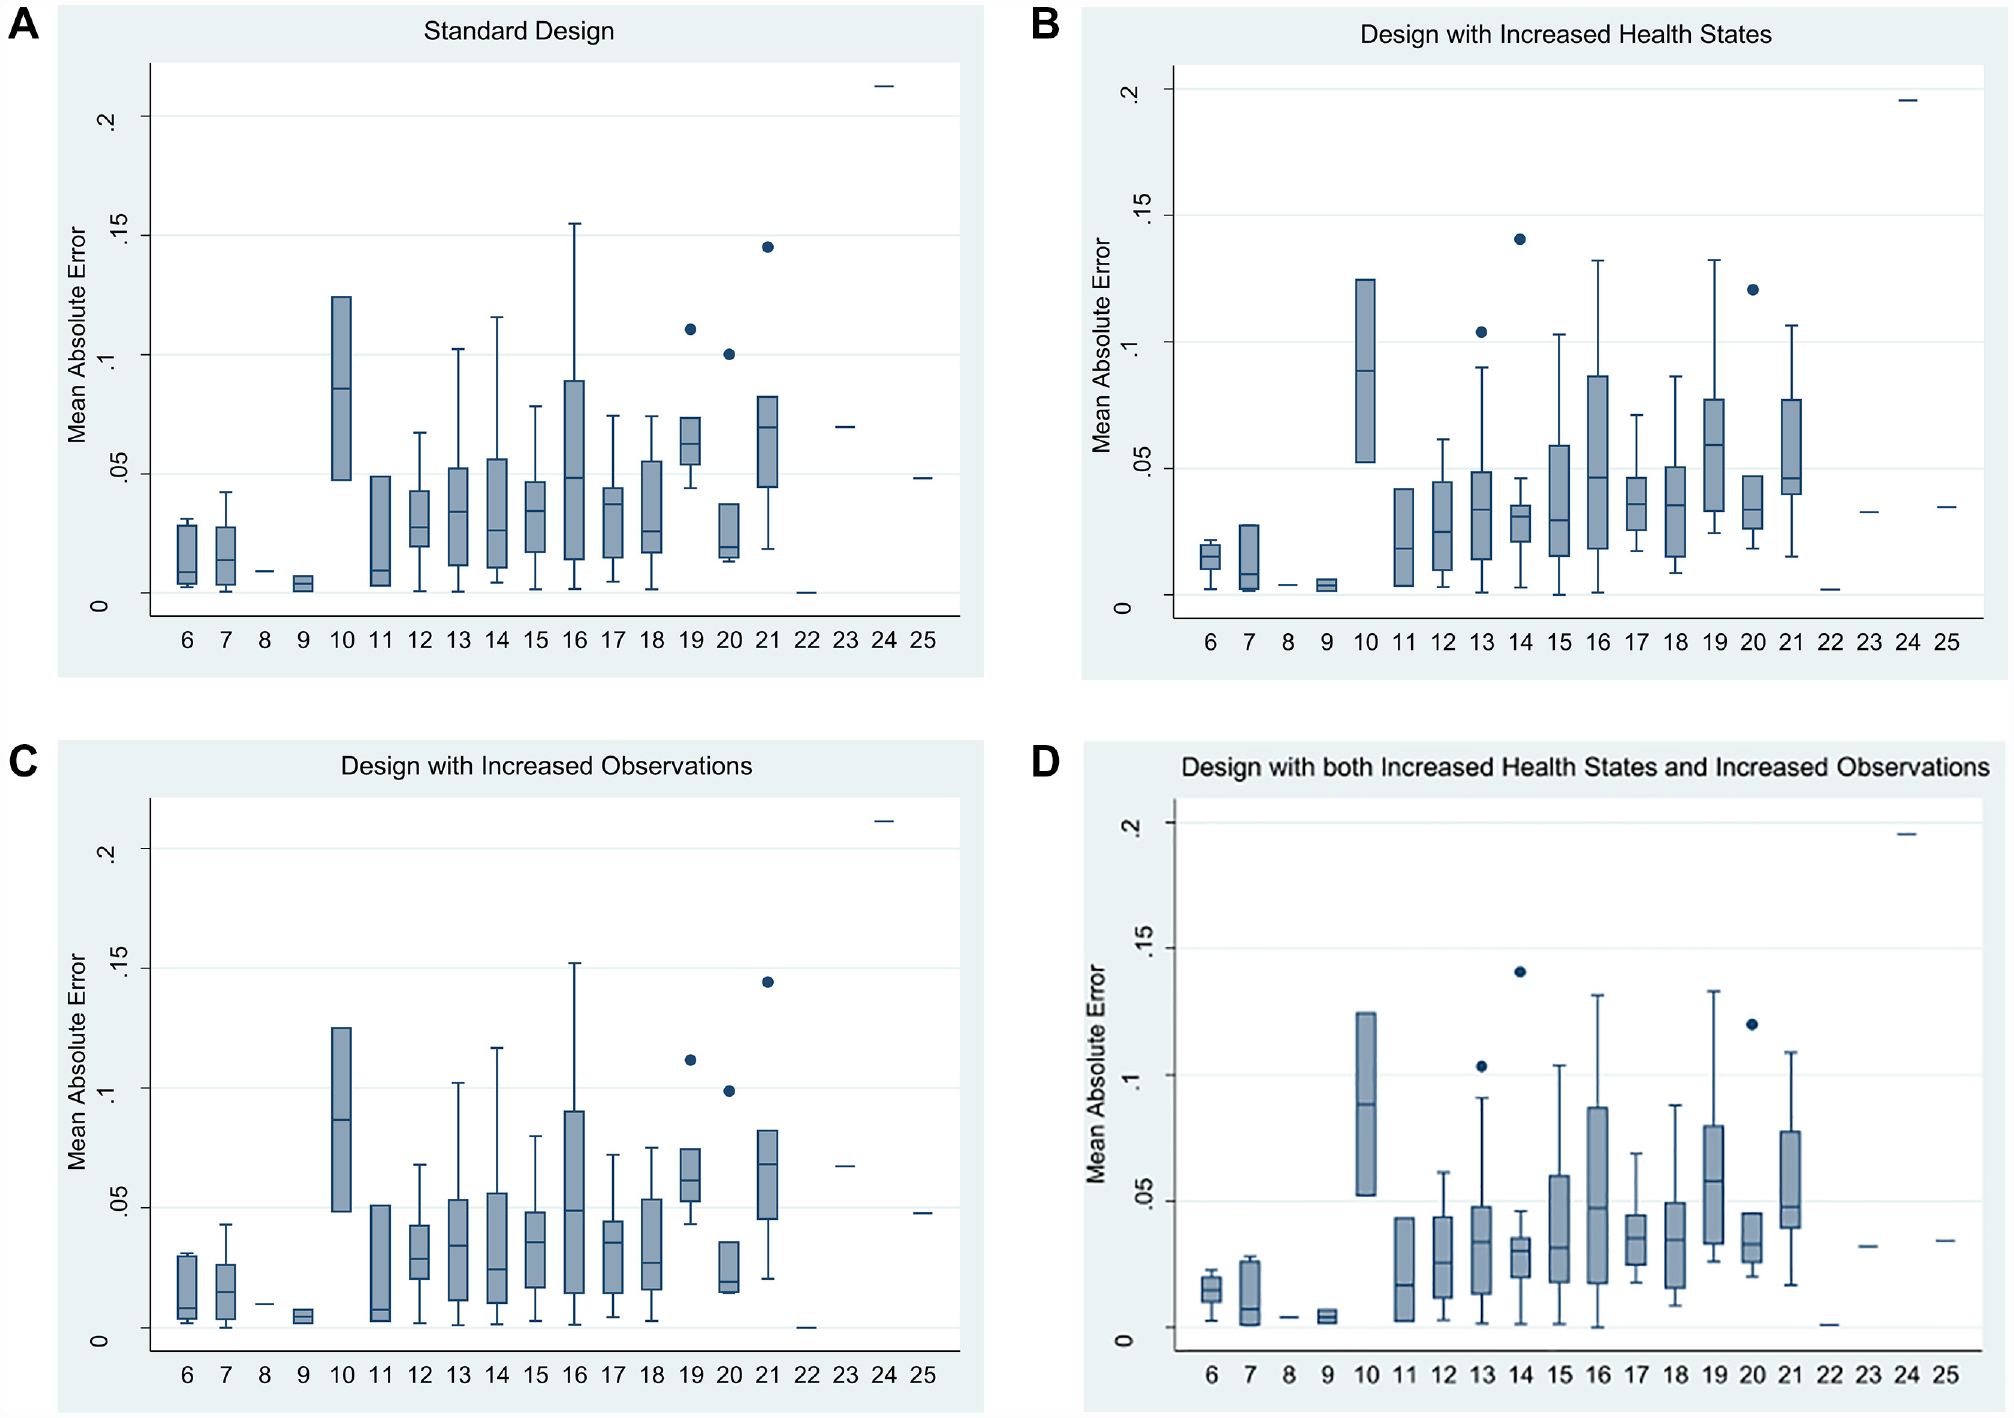
Mean absolute error of different design choices over distinct level sum scores: (A) Standard design. (B) Design with increased health states. (C) Design with increased observations. (D) Design with both increased health states and increased observations.
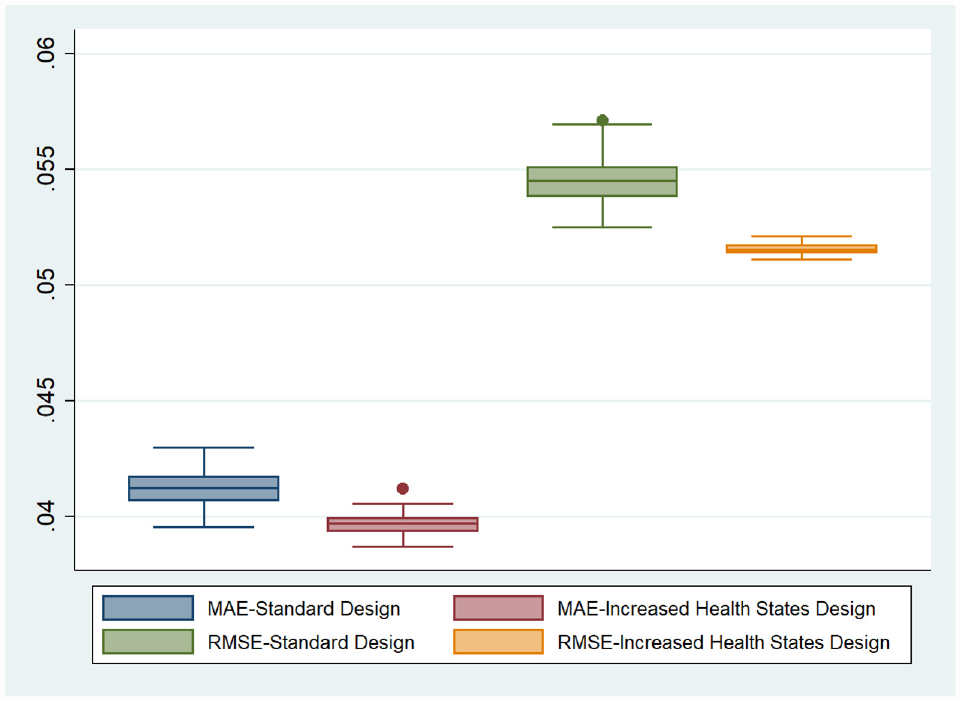
Mean absolute error and root mean squared error of the 100 draws for the basic EQ-VT design and the design with more health states.
Fixing the Study Sample Size at 1,000
As the standard EQ-VT design is optimized for a sample of 1,000, to evaluate the performance of the extended design with a greater number of health states in a valuation study employing the same sample size, we fixed the sample size at 1,000. RMSE and MAE for the extended design in this scenario were less than those of the basic design (Table 3 and Figure 4). The lower range of RMSE demonstrates that the design with more health states demonstrates better predictive performance than the standard EQ-VT design, even when the sample size is fixed at 1,000, although the benefits were relatively smaller when compared with alternative designs presented earlier.
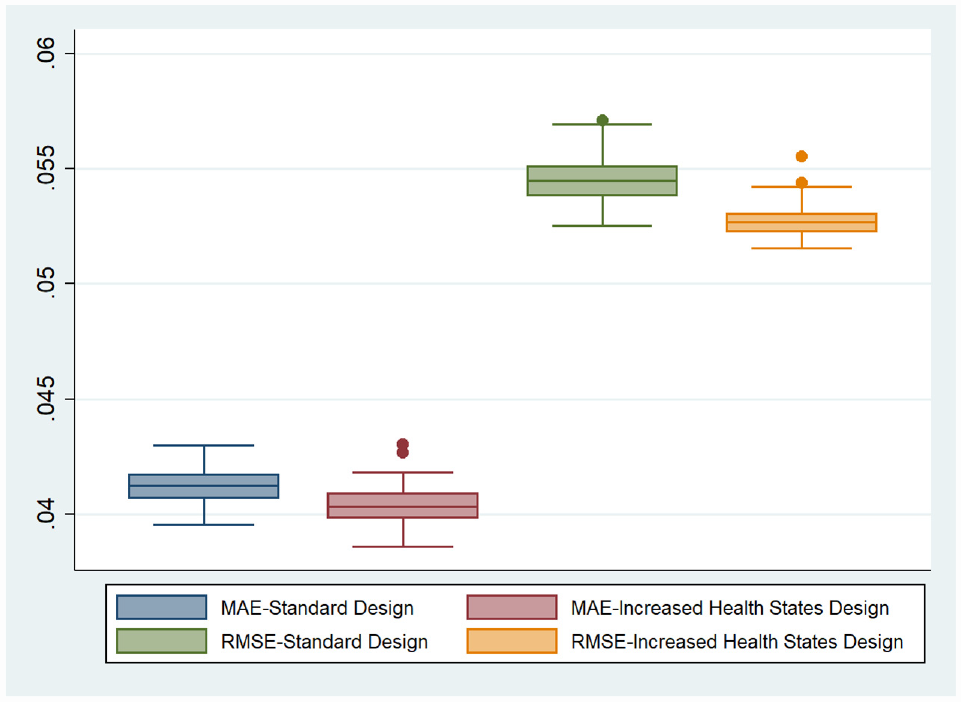
Mean absolute error and root mean squared error of the 100 draws for the basic and extended EQ-VT designs when the sample size is fixed at 1,000.
Discussion
This study presented a useful insight into the performance of the standard design of the EQ-VT. This study used the data collected as the part of Indian EQ-5D-5L valuation (DEVINE) study. We have assessed the potential extensions in the standard EQ-VT design in terms of increasing the health states to be directly valued as well as the number of observations recorded to predict the utility value of each of these health states.
The findings of the study suggest that the standard EQ-VT protocol performed really well, and an extension in the design of the standard EQ-VT can lead to further improvement in its performance. Increasing the blocks of health states improved the modeling predictions markedly. While the standard EQ-VT design predicted the values of the 86 states more accurately, this came at the cost of lower accuracy in the prediction of nonobserved states, suggesting that the design extension promoted robustness. These results are conditional on the larger sample sizes, as specified in Table 2. The benefits of extra blocks were much smaller when the sample size was fixed at 1,000, as shown in Table 3 and Figure 3. Increasing the number of observations per health state improved the predictions, but the effect was small in comparison with the standard EQ-VT design and further reduced when more blocks were distributed. Our results show that merely increasing the number observations per health (by increasing the sample size of the valuation study) will not substantially improve the prediction accuracy of the EQ-VT. On the other hand, an increase in the number of health states in the EQ-VT design will be more beneficial in improving the prediction performance of the standard EQ-VT design.
Previous research using a smaller subset of health states found that although the design with 25 states performed closely to the conventional EQ-VT design with 86 states,11,12 there were mispredictions in mild health states. Therefore, the current study aimed to use an increased number of health states and an increased number of observations per health state in the form of extended designs. Moreover, in our current analysis, we compared the prediction accuracy among health states at varying levels of severity by estimating the MAE across different level sum scores. As shown in Figure 2, the MAE is relatively lower for milder health states (level sum scores 6–9), implying that mild state prediction is adequately precise when the design with a greater number of health states or more observations per health state are used. Therefore, our findings confirmed that the mild state mispredictions are a characteristic of visual analogue scale (VAS) data and not an issue when TTO data are used for health state valuation.11,12
Furthermore, it is worth mentioning here that although the gain in the prediction accuracy by using the extended design appears marginal, it demonstrates an important improvement. It should be noticed that the results of the earlier attempts testing the valuation models with lesser number of health states were based on in-sample values; that is, they had used all health state values to estimate a model and then predict these health state values. However, out-of-sample prediction is a preferred way to conduct such an analysis, and it has been demonstrated that both large design and small design can achieve similar in-sample prediction accuracy, but large design often has better out-of-sample prediction of the health state values. 18 This is the value of the current study. Since a national value set forms the foundation for the economic evaluations conducted in a country, which subsequently plays a major role in determining the resource allocation decisions of the nation, we should always favor a design with lower (even marginal) prediction errors, whenever the resources permit.
HTA provides valuable evidence for rational allocation of resources for maximizing health and enhancing equity, which is imperative for low- and middle-income countries.19–22 Availability of a value set prepared with the health state preferences of the local population is essential for effective conduct of HTA studies.9,23–25 Meanwhile, it has also been demonstrated widely that the utility values in a value set represent people’s preferences and hence are likely to be influenced by several social and cultural factors—necessitating individual country-level assessments.6,7,26,27 As a result, with an increasing number of national HTA agencies preferring national value sets, more valuation studies will be conducted in the future. Even in the countries where a formal HTA process has not been started, the use of EQ-5D is increasing in clinical settings in measuring a range of physical and mental health conditions, including diabetes,28,29 arthritis, 30 many cancers,31,32 vision and hearing, 33 cognition, 34 and severe mental health conditions. 35 It has also been emphasized that the incremental cost-effectiveness ratio, which is a primary outcome of economic evaluation driving the HTA decision, is very sensitive to the utility values.36,37 Thereby, the use of incorrect utility values may significantly affect HTA-based reimbursement decisions. This implies that very precise valuation methods are required to correctly estimate value sets. Our study showed that the standard EQ-VT design currently being used by the countries to generate their national EQ-5D-5L value set performs very well, although some improvements are possible by using the extended designs. The use of a design with more health states was found to perform better and thus can be implemented in future valuation studies.
The results of this study will be used to inform the development of national value sets with improved precision and consecutively facilitate the effective conduct of HTA studies. However, the potential impact of the RMSE and MAE of value set estimation models on the results of economic evaluation and outcomes of HTA studies needs to be evaluated. Moreover, although c-TTO is the primary method of valuation in the EQ-VT, it is not the only method, as the EQ-VT also prescribes 28 DCE blocks, with each block containing 7 pairs of health states. Nevertheless, numerous country-specific value sets are based solely on the c-TTO data, justifying the further development of the c-TTO methods. 10 Thereby, in the current research, we have assessed the impact of extending the c-TTO component of the conventional EQ-VT design. The extended EQ-VT design used in the DEVINE study also employed an increased number of DCE blocks, and further research is underway to measure the impact of extending the number of DCE blocks in the conventional EQ-VT design.
Conclusion
The standard EQ-VT design performs very well, although some improvements are possible. It implies that wherever the resources permit, countries should use the extended design to develop their EQ-5D-5L value sets. While using the extended EQ-VT design, increasing the number of health states in EQ-VT is more beneficial than increasing the number of observations per health state. Therefore, the extended design with an increased number of health states may be used in these countries to develop the value set. In addition, extending the design with the inclusion of more health states was also shown to marginally improve the predictive performance even when the sample size recommended in the conventional EQ-VT (N = 1,000) was used. Using the design with an increased number of health states without any increase in the sample does not require any additional resources. Thereby, in settings wherein limited resources are available to develop the value set, the extended design with an increased number of health states can also be used on the sample size recommended in the conventional EQ-VT.
Footnotes
Acknowledgements
The authors sincerely thank the EuroQol Research Foundation for providing the financial support to make this paper available for open access.
The authors declared the following potential conflicts of interest with respect to the research, authorship, and/or publication of this article: Zhihao Yang, Elly Stolk, and Fredrick Dermawan Purba are members of the EuroQol Research Foundation. Elly Stolk is an employee of the EuroQol Research Foundation, Rotterdam, the Netherlands. There are no other conflicts of interest.
The authors disclosed receipt of the following financial support for the research, authorship, and/or publication of this article: The financial support for this study was provided by the Department of Health Research, Ministry of Health and Family Welfare, Government of India vide grant number F.NO.T.11011/02/2017-HR/3176774. The funding agreement ensured the authors’ independence in designing the study, interpreting the data, writing, and publishing the report.
Author Contributions
GJ, concept and design, acquisition of data, analysis and interpretation of data, drafting of the manuscript, statistical analysis, administrative, technical or logistic support. ZY, concept and design, analysis and interpretation of data, critical revision of paper for important intellectual content, statistical analysis. AS, acquisition of data, analysis and interpretation of data, critical revision of paper for important intellectual content, statistical analysis. AG, analysis and interpretation of data, critical revision of paper for important intellectual content, statistical analysis. ES, concept and design, analysis and interpretation of data, critical revision of paper for important intellectual content, administrative, technical, or logistic support. FDP, analysis and interpretation of data, critical revision of paper for important intellectual content, statistical analysis, administrative, technical, or logistic support. SG, analysis and interpretation of data, critical revision of paper for important intellectual content, administrative, technical, or logistic support. MK, analysis and interpretation of data, critical revision of paper for important intellectual content, administrative, technical, or logistic support. SP, concept and design, acquisition of data, analysis and interpretation of data, drafting of the manuscript, statistical analysis, obtaining funding, administrative, technical or logistic support, supervision.
Ethics Approval
The study was performed in accordance with the ethical standards as laid down in the 1964 Declaration of Helsinki. The ethical approval to conduct the study was obtained from the Institutional Ethics Committee of Postgraduate Institute of Medical Education and Research, Chandigarh, India, vide reference no. PGI/IEC/2018/001629.
Consent
Participants were presented with the information sheets, and written informed consent was obtained. All participants were given enough time to read or be read the participant information sheet and to ask questions and discuss concerns regarding potential participation in the study.
Availability of Data and Materials
The data sets generated during and/or analyzed during the current study are available from the corresponding author, Dr. Shankar Prinja, on reasonable request.