
Abstract
Background
Decision curve analysis can be used to determine whether a personalized model for treatment benefit would lead to better clinical decisions. Decision curve analysis methods have been described to estimate treatment benefit using data from a single randomized controlled trial.
Objectives
Our main objective is to extend the decision curve analysis methodology to the scenario in which several treatment options exist and evidence about their effects comes from a set of trials, synthesized using network meta-analysis (NMA).
Methods
We describe the steps needed to estimate the net benefit of a prediction model using evidence from studies synthesized in an NMA. We show how to compare personalized versus one-size-fit-all treatment decision-making strategies, such as “treat none” or “treat all patients with a specific treatment” strategies. First, threshold values for each included treatment need to be defined (i.e., the minimum risk difference compared with control that renders a treatment worth taking). The net benefit per strategy can then be plotted for a plausible range of threshold values to reveal the most clinically useful strategy. We applied our methodology to an NMA prediction model for relapsing-remitting multiple sclerosis, which can be used to choose between natalizumab, dimethyl fumarate, glatiramer acetate, and placebo.
Results
We illustrated the extended decision curve analysis methodology using several threshold value combinations for each available treatment. For the examined threshold values, the “treat patients according to the prediction model” strategy performs either better than or close to the one-size-fit-all treatment strategies. However, even small differences may be important in clinical decision making. As the advantage of the personalized model was not consistent across all thresholds, improving the existing model (by including, for example, predictors that will increase discrimination) is needed before advocating its clinical usefulness.
Conclusions
This novel extension of decision curve analysis can be applied to NMA-based prediction models to evaluate their use to aid treatment decision making.
Highlights
Decision curve analysis is extended into a (network) meta-analysis framework.
Personalized models predicting treatment benefit are evaluated when several treatment options are available and evidence about their effects comes from a set of trials.
Detailed steps to compare personalized versus one-size-fit-all treatment decision-making strategies are outlined.
This extension of decision curve analysis can be applied to (network) meta-analysis–based prediction models to evaluate their use to aid treatment decision making.
Randomized controlled trials (RCTs) and their meta-analyses have traditionally focused on inferences about treatment effects for the average patient. 1 Yet, what clinicians want to know is the treatment effect for the patient in front of them, and the effects of treatment may differ between individuals. To identify the best treatment option for an individual, researchers can use prediction models to evaluate the treatment effects on health outcomes as a function of patient-level characteristics.2–5
Personalized prediction models could be used to identify groups of patients for which the benefits of treatment outweigh the harms. Doing so would require extensive validation, and such validation should include an evaluation of clinical utility. The latter refers to the ability of the model to guide treatment decisions at the point of care. While methods to evaluate a model’s performance have been well studied and are described in the literature (e.g., calibration measures, the area under the curve, etc.),6,7 evaluation of the clinical utility of a model is a relatively new concept.
Decision curve analysis (DCA) has been proposed to evaluate the clinical utility of personalized prediction models.8,9 DCA can be applied to models that predict an absolute risk (such as a model to predict the risk of cancer to guide decisions about biopsy) and those predicting treatment benefit (such as a model to predict the change in outcome associated with drug therapy).8,10,11 The data used to calculate the net benefit (NB) for a treatment strategy typically come from an RCT that compares 2 treatments: a reference treatment (such as no treatment or placebo) and an active treatment of interest. Papers, software, tutorials, and data sets on DCA methodology can be found at www.decisioncurveanalysis.org.
There are often several treatment options for a given condition. Unfortunately, there is often uncertainty about their relative benefits due to a lack of a direct head-to-head comparison in a single RCT. Evidence synthesis in the form of pairwise meta-analysis (PMA) and its extension, network meta-analysis (NMA), can be used both to structure the evidence base (summarizing direct and indirect comparisons) and to produce an estimate of the effects of any treatment against other available options. It has been found that prediction models based on (network) meta-regression of multiple individual patient data (IPD) can be used to identify the best treatment option for an individual patient.10,12–14
Consider a patient diagnosed with relapsing-remitting multiple sclerosis (RRMS) who is contemplating starting a disease-modifying drug. The individual and her or his clinician may have access to the results of an NMA of aggregated data to inform their decision, but this evidence gives insight into only the expected health outcomes and the efficacy of the treatments being considered for the “average patient” in the model.15–17 Personalized treatment recommendations can be obtained if patient characteristics are taken into account when predicting the outcome under different treatment options. This can be achieved using network meta-regression with IPD data, 12 with the model indicating the optimal drug (in the case of RRMS treatment decision, this may be the one that minimizes the predicted risk to relapse over the time horizon of 2 y) for any given patient profile. Extending this idea to several outcomes and accounting for the tradeoff between safety and efficacy will result in a hierarchy of treatment options that is tailored to a participant’s characteristics.18,19
In this article, we extend the DCA methodology, as proposed by Vickers et al., 9 to evaluate the clinical usefulness of a personalized prediction model that aims at recommending a treatment among many possible options according to individual characteristics, such as the one described above. The focus of the article is methodological, and we use an example with RRMS only to outline the developed methodology. This work is supported and funded by the HTx. The HTx is a Horizon 2020 project supported by the European Union lasting for 5 y from January 2019. The main aim of HTx is to create a framework for the next-generation health technology assessment to support patient-centered, societally oriented, real-time decision making on access to and reimbursement for health technologies throughout Europe. We describe the network meta-regression prediction model in the next section. In the “Methods” section, we describe ways to select the threshold values for each treatment option and how treatment recommendations can be made based on the results of a network meta-regression prediction model, and we describe the estimation of quantities in DCA methodology from PMA and NMA data sets. We show the results from the case study in the “Results” section, and we conclude with a discussion of the advantages and limitations of the proposed approach.
Case Study: Personalized Treatment Recommendation for Patients with RRMS
Multiple sclerosis (MS) is an immune-mediated disease of the central nervous system with several subtypes. The most common subtype is RRMS. 20 Patients with RRMS present with acute or subacute symptoms (relapses) followed by periods of complete or incomplete recovery (remissions). 21 Effective treatment of patients with RRMS can prevent disease progression and associated severe consequences, such as spasticity, fatigue, cognitive dysfunction, depression, bladder dysfunction, bowel dysfunction, sexual dysfunction, pain, and death. 22 There are several available treatment options for RRMS, and their efficacy and safety profiles vary. For instance, natalizumab is more effective (on average) than dimethyl fumarate but associated with important side effects and increased risk of progressive multifocal leukoencephalopathy, which can cause death.23,24
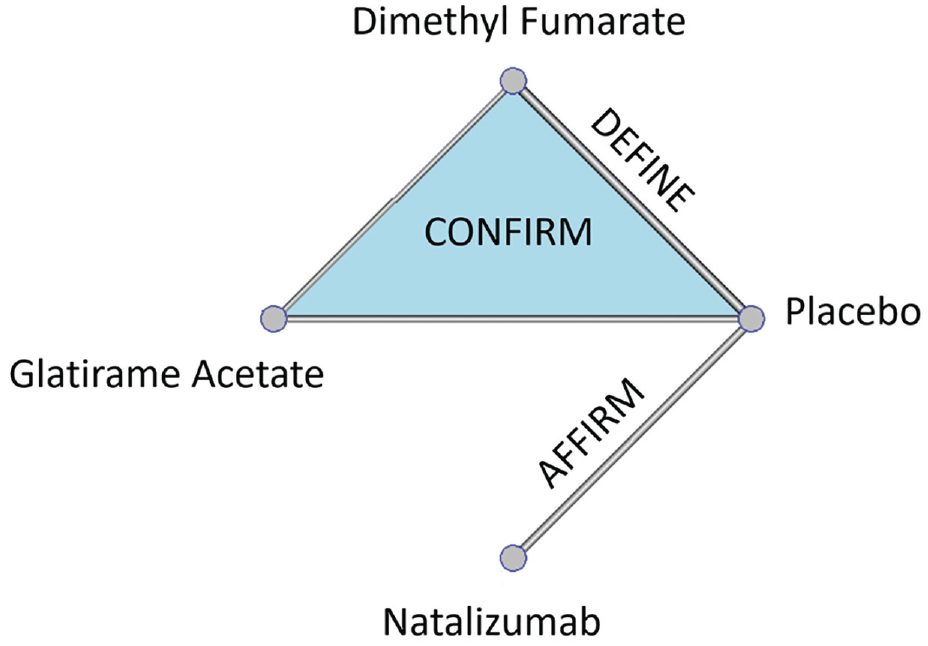
Recently, a 2-stage model was presented to predict the personalized probability of relapse within 2 y in patients diagnosed with RRMS. 12 Three phase III RCTs were used: AFFIRM, DEFINE, and CONFIRM.25–27 Patients were randomized into 3 active drugs (natalizumab, glatiramer acetate, dimethyl fumarate) and placebo, as shown in Figure 1.
In a first stage, the baseline risk score for relapse was developed, which is a score that summarizes the patient-level characteristics and indicates the severity of the baseline health condition. In a second stage, the baseline risk score was used as the only effect modifier, which has an impact on relative treatment effects, in a network meta-regression model to predict the risk to relapse within the next 2 y under the 3 drugs or placebo. The results are presented in Figure 2 as well as in an interactive R-Shiny application available at https://cinema.ispm.unibe.ch/shinies/koms/. A detailed description of the development of the RRMS personalized prediction model, which we use as an example here, has been previously given. 12
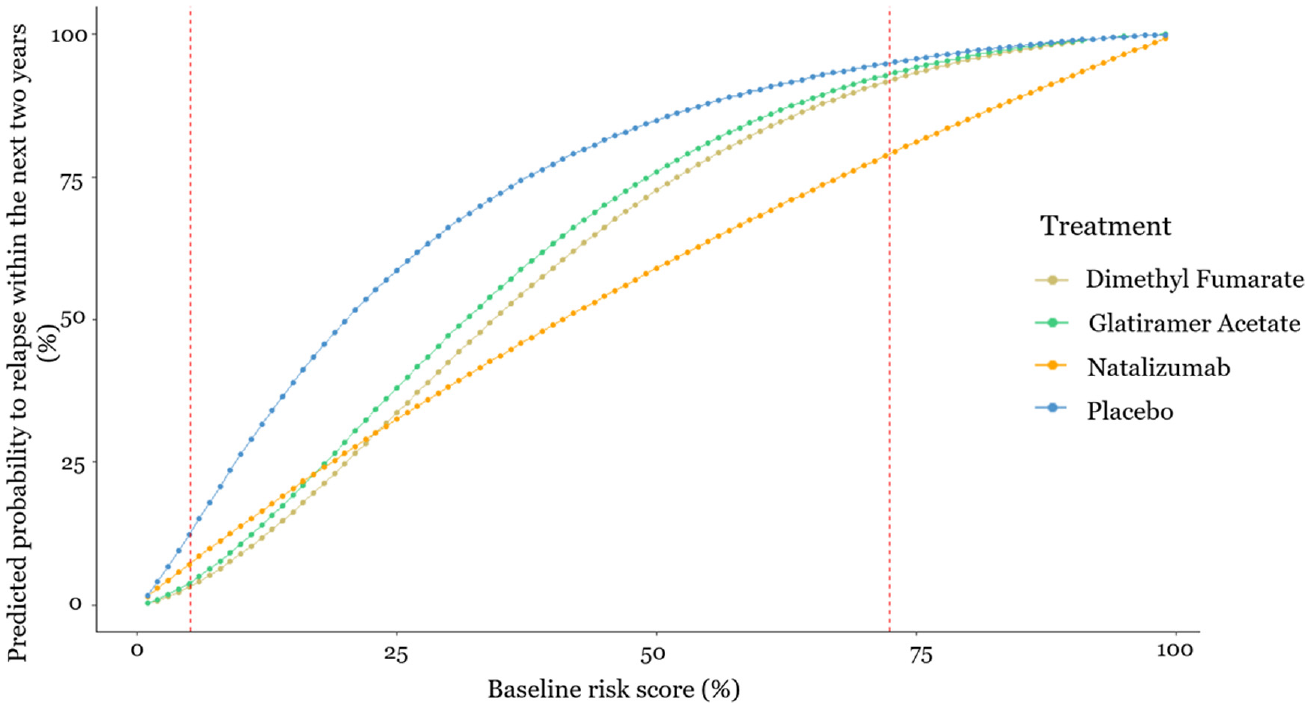
Estimated probability to relapse within the next 2 y as a function of the baseline risk score. The x-axis shows the baseline risk score of relapsing within the next 2 y, and the y-axis shows the estimated probability of relapsing within the next 2 y under each of the treatments. Between the 2 dashed vertical lines are the baseline risk values observed in the data used.
Such models can be used to guide clinical decisions, assuming heuristically that relapse is the only health outcome of interest. For example, this prediction model would recommend dimethyl fumarate to patients whose baseline risk is lower than 25% and natalizumab to patients whose baseline risk is higher than 25%. However, even when a patient has baseline risk score equal to 30%, where natalizumab minimizes the predicted risk to relapse, the absolute predicted difference in relapse probability is only 5% compared with dimethyl fumarate. In addition, natalizumab is a drug with more serious side effects compared with dimethyl fumarate; hence, the doctor in discussion with the patient might decide to administer dimethyl fumarate.
We want to evaluate whether this personalized prediction model could guide the decision-making process. We will compare the treatment decisions that this model entails (“treat patients according to the prediction model”) to those from “one-size-fit-all” strategies: “treat none,”“treat all patients with natalizumab,”“treat all patients with dimethyl fumarate,” and “treat all patients with glatiramer acetate.”
Methods
In the next section, we describe how treatment recommendations via a prediction model are reached when we have multiple treatment options. In the subsequent section, we introduce the proposed extension of the DCA methodology when considering several competing treatment strategies. In the “Comparing Different Treatment Strategies via DCA” section, we describe the implementation and software used to evaluate the model on predicting the optimal treatment to prevent relapsing within the next 2 y in RRMS.
Threshold Values
Let us consider that there are several treatment options available for a health condition. Each available treatment option is denoted with
Note that specifying
Reaching Treatment Recommendations when We Have Multiple Options via a Model
Let us consider a personalized prediction model for the probability of an event,
We define the threshold value
Reaching the Recommended Treatment, via a Prognostic Model, between 4 Options: Placebo, Glatiramer Acetate, Dimethyl Fumarate, and Natalizumab (Hypothetical Example in Relapsing-Remitting Multiple Sclerosis)
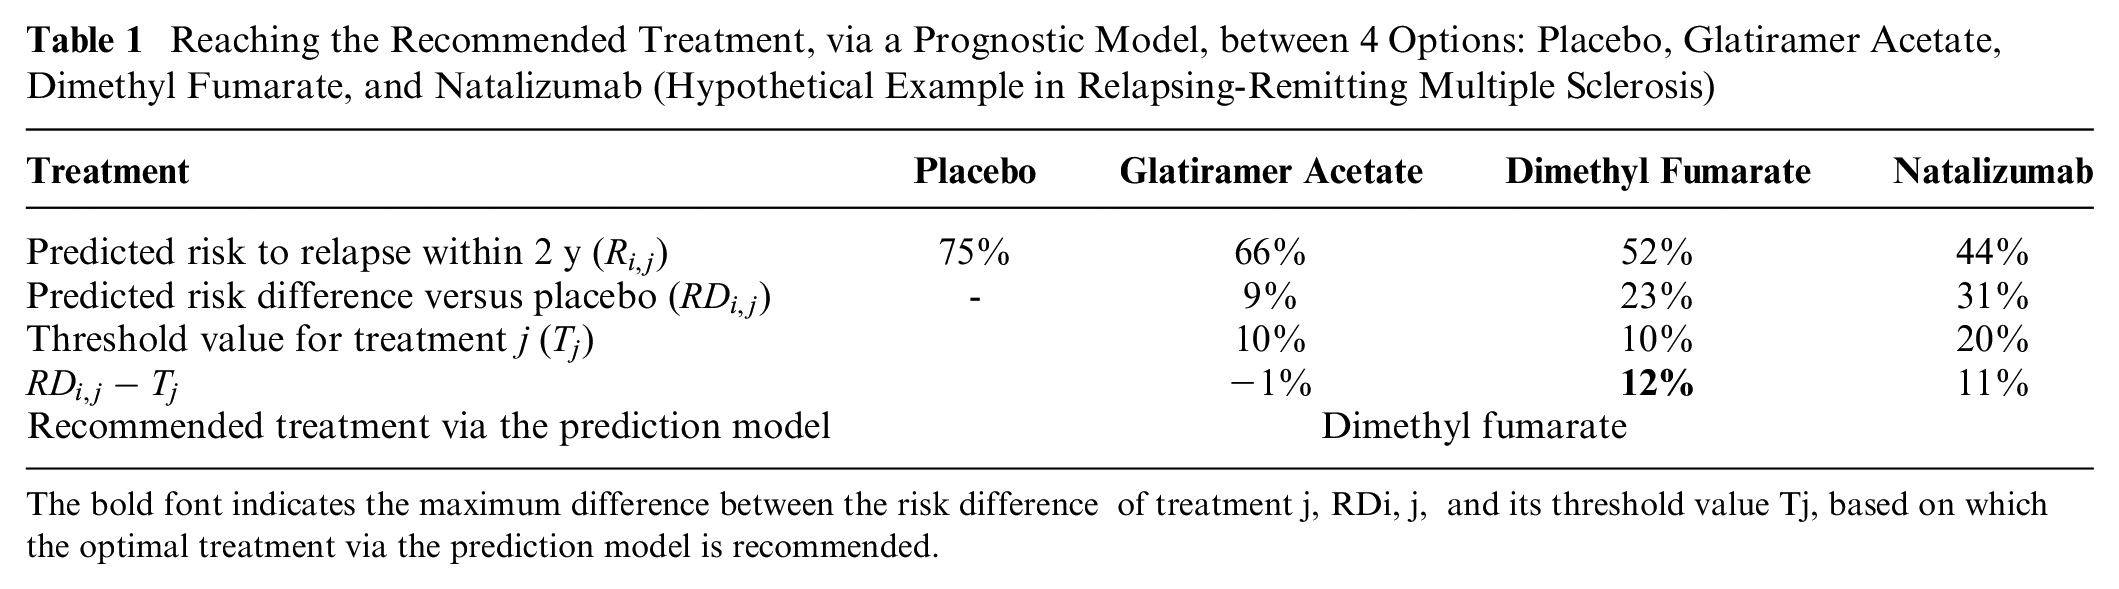
The bold font indicates the maximum difference between the risk difference of treatment j, RDi, j, and its threshold value Tj, based on which the optimal treatment via the prediction model is recommended.
While the model makes personalized predictions under each treatment
Comparing Different Treatment Strategies via DCA
In the case of medical treatments, there are several decision strategies that can be evaluated and compared. Consider a treatment strategy
The measure of performance of each strategy is the NB. The NB is the benefit that a decision entails minus the relevant harms weighted by a tradeoff preference value. In the case of medical treatments, benefit could be measured as the reduction in a harmful health outcome (e.g., relapses) with the treatment. Harms include all disbenefits of treatment, including side effects, risks, financial cost, and inconvenience. Vickers et al. described in detail the DCA methodology and defined the net treatment benefit for a single treatment. 9 The NB estimation involves counterfactuals, the unobserved outcome if a particular strategy is employed. Consequently, the estimation of NB for a model predicting treatment benefit is best estimated using RCT data. 9
We generalize the idea to the NB of a strategy
More specifically, we define the NB of each strategy

where
Estimation of
When data from 1 RCT with placebo are available,
Estimation of
and
The interest now lies in the estimation of
To derive

The quantity
When we have only 1 RCT, then
When we have several RCTs, we first need to perform a meta-analysis of all placebo arms in In case When
When the strategy s is treat all with treatment j = x, with x ≠ 0, the event rate
When the strategy s is “treat none,” then the NB is
Hence, considering the nature of the strategies, the congruent data set,
NB and comparisons of strategies
We define the NB, which can be applied to all strategies and settings (i.e., 1 RCT, several RCTs, single treatment comparison, and several treatment comparisons) as

The
The advantage of any strategy
All of the required steps to calculate the NB for several strategies into an NMA of the RRMS example are presented in detail in Table 2. Following these steps, the NB for each strategy
Detailed Description of the Net Benefit Estimation for “Treat All with Treatment j” and “Treat Patients according to the Prediction Model” Strategies on the Relapsing-Remitting Multiple Sclerosis Example a
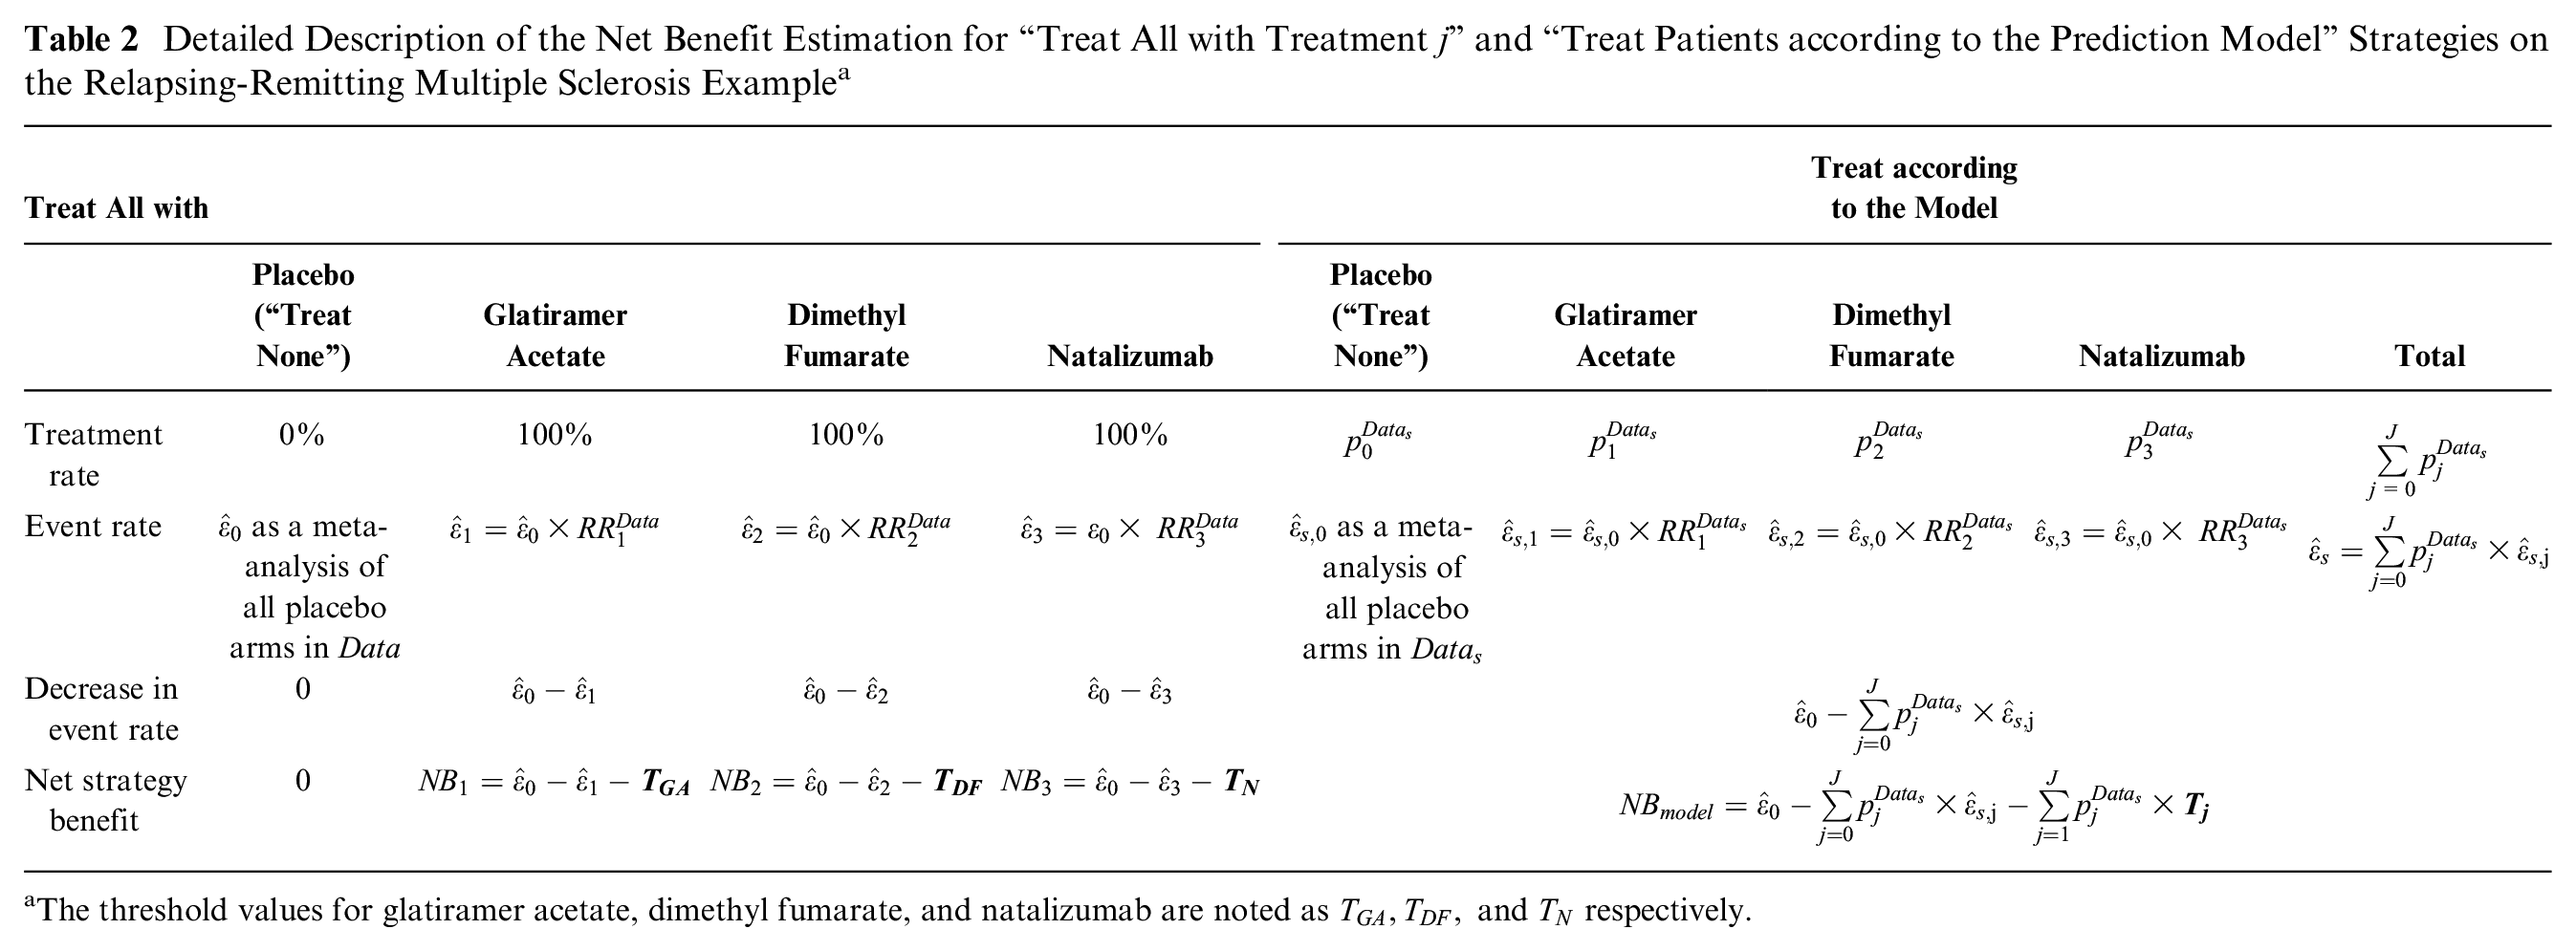
The threshold values for glatiramer acetate, dimethyl fumarate, and natalizumab are noted as
Application in Comparison of Treatment Strategies in RRMS
We used NB to evaluate the clinical usefulness of the 2-stage personalized prediction model (described briefly in the “Case Study” section). As natalizumab is a treatment with serious side effects and is less safe than the other 2 options, patients would be prescribed natalizumab only when their benefit (here the predicted risk difference) is high. Dimethyl fumarate and glatiramer acetate, on the other hand, are similar in terms of side effects and considered safer than natalizumab. In line with 2 consulting MS neurologists (see the acknowledgments), the threshold for natalizumab was set higher than those for dimethyl fumarate and glatiramer acetate.
We first assume a threshold value
All of our analyses were done in R, 31 using version 3.6.2. We made the code available in the following GitHub library: https://github.com/htx-r/Reproduce-results-from-papers/tree/master/DCA_NMA. The analysis code uses the metaprop command to estimate the event rate in control arm and the netmeta command to estimate the relative risk for each active treatment versus placebo.
Results
The results from comparing the 5 competing strategies with treatment thresholds
Net Benefit (NB) Estimation for Each Strategy in the Multiple Sclerosis Example: “Treat None,”“Treat All Patients with Glatiramer Acetate,”“Treat All Patients with Dimethyl Fumarate,”“Treat All Patients with Natalizumab,” and “Treat Patients according to the Prediction Model” a
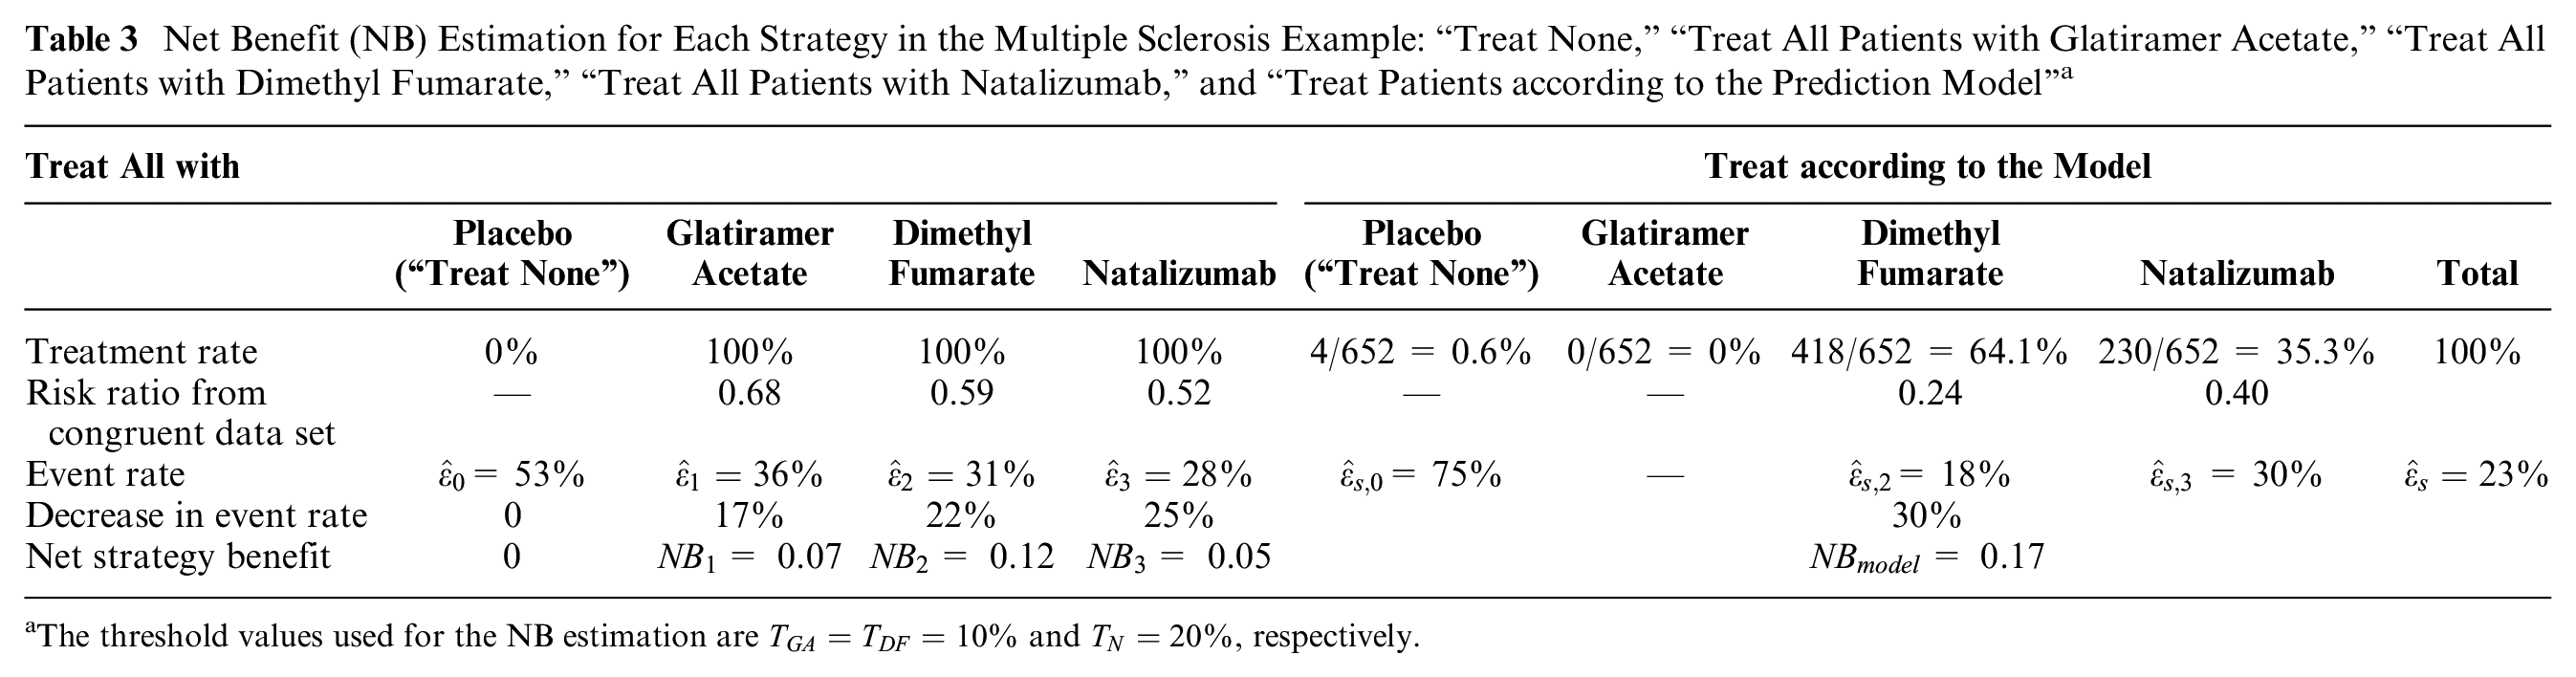
The threshold values used for the NB estimation are
In Figure 3, we present the
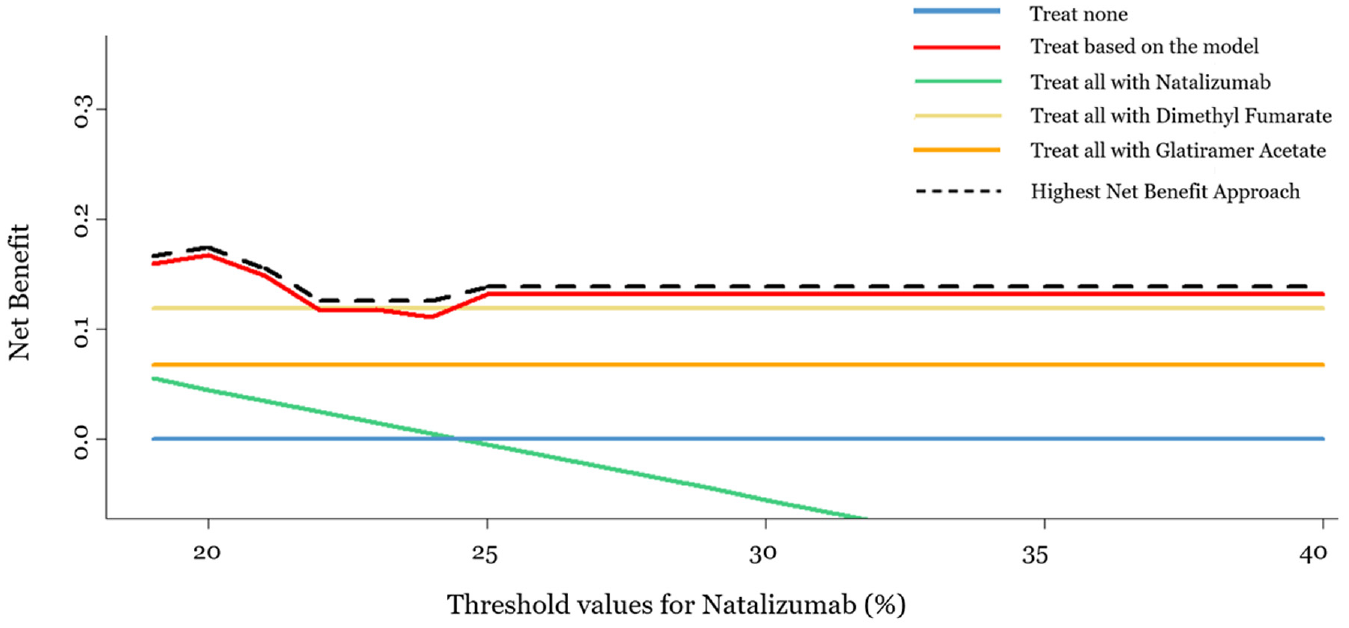
Decision curve analysis plot for a range of threshold values for natalizumab (19%–40%) and equal constant threshold values for dimethyl fumarate and glatiramer acetate (10%). The x-axis represents the range of threshold values for natalizumab, and the y-axis represents the net benefit for each of the 5 strategies: “treat none,”“treat based on the model,”“treat all with natalizumab,”“treat all with dimethyl fumarate,” and “treat all with glatiramer acetate.” The dashed black line represents the highest net benefit.
In Figure 4, we also present a heat plot showing the strategy with the highest
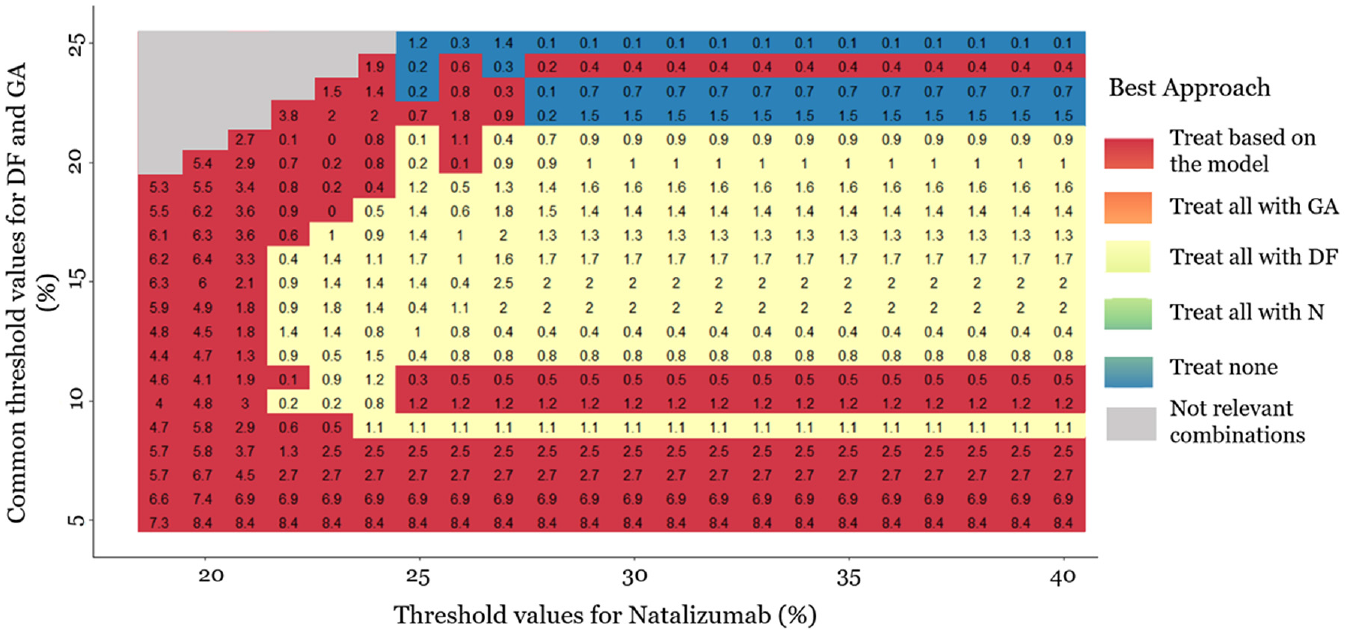
Heat plot for the decision curve analysis, in a range of threshold values. The same threshold is assumed for dimethyl fumarate (DF) and glatiramer acetate (GA) (4%–25%). The threshold values for natalizumab range between 19% and 40%. The plot shows which approach has the highest net benefit between all possible approaches: (a) treat all patients with placebo, (b) treat all patients with natalizumab (N), (c) treat all patients with dimethyl fumarate, (d) treat all patients with glatiramer acetate, and (e) treat patients based on the prediction model. The empty gray cells present the threshold value combinations that are not clinically possible. The numbers in the cells are differences in net benefit (NB) between the 2 strategies. When the “treat patients based on the prediction model” strategy is the best, the number in the cell (i.e., red cells) is the difference between its NB and the NB of the second-best strategy. Otherwise, we present the difference between the NB of the best strategy and the NB of the “treat patients based on the prediction model” strategy. The presented NB estimations are multiplied by 100.
Discussion
We extended the DCA methodology to an NMA framework to evaluate the clinical usefulness of a prediction model that aims at recommending a treatment among many possible options according to individual characteristics.9,32 The personalized prediction models are used to inform patients and decision makers about the most appropriate treatment for each patient and hence contribute to personalized medicine.12,13,33 Such models need to be evaluated for their ability to guide treatment decisions at the point of care. For this purpose, Vickers et al. proposed DCA, which is the tool to evaluate such prediction models by comparing the benefit–risk tradeoffs they entail to those of other default treatment strategies or other available personalized prediction models. 9 The data used to evaluate such prediction models typically come from an RCT that compares 2 treatments: a reference treatment and the treatment of interest. As the treatment options for each condition are numerous and their effects are evaluated in multiple RCTs, the extended proposed DCA approach could contribute to evaluating the ability of the widely used personalized prediction models to guide treatment decisions. We applied our methodology for RRMS to evaluate the strategy of choosing between 3 disease-modifying drugs (natalizumab, dimethyl fumarate, glatiramer acetate) and placebo using a personalized prediction model. 12
The methods and their application in the data set of treatments for RRMS have several limitations. The personalized prediction model compares only 3 active drugs among all available options (more than 15 available). The same approach can be applied to personalized prediction models that compare all relevant competing drugs, assuming that studies that compare them are available. The main limitation of our application is the inefficient data set’s sample size; the estimation of the parameters needed to estimate the NB in our approach needs a large amount of data to ensure that the sample size of the congruent data set will be large enough to conduct NMA. Confidence intervals around the estimated NB could be shown to present uncertainty due to the limited sample size 34 ; however, they are not typically used within a classical decision-making approach. 28
Another technical issue is that it is possible that the congruent data set for some thresholds includes many single-arm studies. In our application, we omitted the single-arm studies from the NMA in the congruent data set to establish causal effects of the treatments, but this resulted in discarding potentially relevant information. When the congruent data set consists of single arms, (network) meta-analysis cannot be conducted at all. Consequently, NBs cannot be estimated for some threshold combinations, and researchers have to calculate the lower and upper bounds for the thresholds examined to ensure that they would lead to enough data to estimate NB. In our application, the lower bounds were outside the range of thresholds indicated by the expert neurologists as relevant. In practice, however, the lack of suitable data to estimate NB for relevant thresholds can limit the applicability of DCA. The issue of single-arm studies in the congruent data set should be the subject of further research. Models that include single-arm studies in the meta-analysis could be considered, although the risk of bias in the estimates they provide is not to be underestimated.35–39 Finally, the strategies need to be evaluated for a relevant range of threshold values for all treatment options, as different patients might weight differently the risk of an event and risks associated with each treatment. 28 In our application, we defined equal threshold values for dimethyl fumarate and glatiramer acetate and higher threshold values for natalizumab according to the expert opinion of 2 MS neurologists based on the drugs’ safety profiles. In practical application, the integration of utilities across a distribution of patients’ preferences might be used to justify the range of relevant threshold values. 28
To our knowledge, this is the first attempt to use DCA to evaluate a prediction model that refers to multiple treatments and, consequently, uses evidence from several studies that compare subsets of the competing treatments, relying on the assumptions underlying NMA and prediction models (transitivity, consistency, correct model specification, etc.).40–43 The proposed approach can be used to compare several treatment strategies, and we show how to estimate the NB of a treatment strategy using causal treatment effects. If the strategy based on the personalized model is shown to be clinically useful compared with the default “treat all patients with X” strategy, this does not necessarily mean that it should be implemented in practice. In many clinical areas, the treating physician evaluates the patient and determines the treatment strategy without using a guiding tool. This state-of-the-art strategy needs to be compared with the strategy based on the model in a randomized clinical trial, to inform about the health benefits, patient experiences, and costs associated with clinical implementation of the decision tool.32,44,45 The original formulations of DCA were intended to supplement, rather than replace, other decision analytic techniques. For instance, a diagnostic test might be evaluated using a decision curve, with utilities determined (implicitly) by a range of threshold probabilities, or by a decision tree, in which utilities are assessed more formally, such as by using data from the literature. A cost-effectiveness analysis would incorporate economic costs obtained by additional research. The advantage of DCA is that it can be implemented without the need for specifying a large number of parameters that must be obtained from sources other than the current data set; the disadvantage is that it depends on the assumption that clinicians are using threshold probabilities that are rational. Comparably, our proposed method aims to supplement, not replace, other decision-analytic methods for evaluating treatments and shares the similar advantage of practicability and disadvantage of the assumption of rational thresholds.
Personalized prediction models for treatment recommendation have recently gained ground, and their popularity will increase with the availability of more data. It is therefore important that such models are evaluated for their performance before they are ready to be used by decision makers. The traditional biostatistical metrics of calibration and discrimination can be useful for analysts to determine how to build and evaluate a model but cannot determine its clinical value.8,9,28 We have contributed to the existing methodological arsenal by providing a method to infer about a prediction model’s clinical utility in a (network) meta-analysis framework. With the proposed approach, and assuming that enough data from several randomized trials would be available, the evaluation of clinical relevance will now be possible for several prediction models comparing many treatment options.
Supplemental Material
sj-docx-1-mdm-10.1177_0272989X221143058 – Supplemental material for Decision Curve Analysis for Personalized Treatment Choice between Multiple Options
Supplemental material, sj-docx-1-mdm-10.1177_0272989X221143058 for Decision Curve Analysis for Personalized Treatment Choice between Multiple Options by Konstantina Chalkou, Andrew J. Vickers, Fabio Pellegrini, Andrea Manca and Georgia Salanti in Medical Decision Making
Footnotes
Acknowledgements
The authors thank Johannes Lorscheider and Jens Kuhle for their expert opinions on the drugs’ safety profiles.
The authors declared the following potential conflicts of interest with respect to the research, authorship, and/or publication of this article: KC, AJV, AM, and GS declare that they have no conflict of interest with respect to this article. FP is an employee of and holds stocks/stock options in Biogen. The authors disclosed receipt of the following financial support for the research, authorship, and/or publication of this article: KC, AM, and GS are funded by the European Union’s Horizon 2020 research and innovation program under grant agreement No. 825162. The HTx project has received funding from the European Union’s Horizon 2020 research and innovation program under grant agreement No. 825162. This dissemination reflects only the author’s view, and the Commission is not responsible for any use that may be made of the information it contains. AJV is funded in part by a Cancer Center Support Grant from the National Cancer Institute made to Memorial Sloan Kettering Cancer Center (P30-CA008748) and a SPORE grant from the National Cancer Institute to Dr. H. Scher (P50-CA092629).
Authors’ Note
Meetings at which this work was presented:
• Conference of the Austro-Swiss Region (RoeS) of the International Biometric Society (Salzburg, Austria, 7–10 September 2021)
• Royal Statistical Society (RSS) international conference 2021 (Manchester, UK, 6–9 September 2021)
• 42nd (virtual) Annual Conference of the International Society for Clinical Biostatistics (ISCB; online event 18–22 July 2021)
Supplemental Material
Data Availability Statement
The data that support the findings of this study were made available from Biogen International GmbH. Restrictions apply to the availability of these data, which were used under license for this study.
References
Supplementary Material
Please find the following supplemental material available below.
For Open Access articles published under a Creative Commons License, all supplemental material carries the same license as the article it is associated with.
For non-Open Access articles published, all supplemental material carries a non-exclusive license, and permission requests for re-use of supplemental material or any part of supplemental material shall be sent directly to the copyright owner as specified in the copyright notice associated with the article.