
Abstract
Background
We evaluate the construct validity of a proposed procedure for eliciting lay preferences among health care policy options, suited for structured surveys. It is illustrated with breast cancer screening, a domain in which people may have heterogeneous preferences.
Methods
Our procedure applies behavioral decision research principles to eliciting preferences among policy options expressed in quantitative terms. Three-hundred women older than 18 y without a history of breast cancer were recruited through Amazon MTurk. Participants evaluated 4 screening options for each of 4 groups of women, with varying risk of breast cancer. Each option was characterized by estimates of 3 primary outcomes: breast cancer deaths, false alarms, and overdiagnosis resulting in unnecessary treatment of cancers that would not progress. These estimates were based on those currently being developed by the Breast Cancer Surveillance Consortium. For each risk group, participants stated how frequently they would wish to receive screening, if the predicted outcomes applied to them.
Results
A preregistered test found that preferences were robust enough to be unaffected by the order of introducing and displaying the outcomes. Other tests of construct validity also suggested that respondents generally understood the task and expressed consistent preferences. Those preferences were related to participants’ age and mammography history but not to measures of their numeracy, subjective numeracy, or demographics. There was considerable heterogeneity in their preferences.
Conclusions
Members of the public can be engaged more fully in informing future screening guidelines if they evaluate the screening options characterized by the expected health outcomes expressed in quantitative terms. We offer and evaluate such a procedure, in terms of its construct validity with a diverse sample of women.
Highlights
A novel survey method for eliciting lay preferences for breast cancer screening is proposed and evaluated in terms of its construct validity.
Participants were generally insensitive to irrelevant task features (e.g., order of presentation) and sensitive to relevant ones (e.g., quantitative estimates of breast cancer risk, harms from screening).
The proposed method elicits lay preferences in terms that can inform future screening guidelines, potentially improving communication between the public and policy makers.
Keywords
Breast cancer is a major cause of death and illness for women and a major cause of worry. 1 Advances in screening may improve the chances of cancers being diagnosed when treatments can be most effective. 2
However, screening comes with potential benefits and harms that vary with screening frequency. In addition to their cost and inconvenience, mammography and other screening and diagnostic procedures are imperfect. As a result, there are “false alarms,” results that suggest cancer but prove not to be after additional testing, while incurring worry, cost, and inconvenience.3,4 Screening can also lead to unnecessary treatment (through overdiagnosis) of cancers that would not affect a woman’s health but cannot be distinguished from cancers that would.4,5 Thus, choosing a screening frequency requires making tradeoffs among changes in the probabilities of breast cancer deaths averted, false alarms, and unnecessary treatment. 6 We introduce and evaluate a procedure for eliciting tradeoffs, focused on these 3 outcomes.
Health care policies reflect tradeoffs made on behalf of the people they affect. Breast cancer screening guidelines have been criticized for rationing screening, effectively ignoring women’s preferences. In 2009, the United States Preventative Services Task Force changed its recommendations from screening all women over 40 every 1 to 2 y to biennial screening for women aged 50 y and older, while having younger women consult their doctor.7,8 That change prompted strong opposition from some breast cancer activists and medical organizations, including the American College of Radiology and the American Cancer Society. 9 The Affordable Care Act of 2010 required private insurers to cover annual screening. 10 Women’s actual screening frequencies changed little over this period.11,12
Studies have found that women differ in their preferences regarding the tradeoffs between the expected benefits and harms of screening. For example, Van den Bruel et al. 13 found that, depending on the estimated reduction in breast cancer mortality, women considered a 15% to 30% chance of unnecessary treatment acceptable. However, 4% to 5% were unwilling to accept any unnecessary treatment, regardless of the reduction in breast cancer mortality. Waller et al. 14 found greater concern about missing breast cancers than about unnecessary treatment. In a discrete choice experiment, Vass et al. 15 found great heterogeneity in elicited tradeoffs. Most such studies compare screening benefits with one harm, either false alarms or unnecessary treatment.13–17 Ghanounia et al. 18 asked women about all 3 outcomes, but without providing quantitative estimates of their probabilities.
To the best of our knowledge, no study has elicited women’s preferences for the choice facing policy makers: what screening frequency to recommend, informed by best-available estimates of the reduction in breast cancer mortality, false alarms, and unnecessary treatment outcomes. We propose a procedure for eliciting screening preferences in terms that can directly inform policy makers’ choices. It asks women what screening frequency they would prefer, if they faced the choices facing each of several groups of women, given current scientific knowledge. It is suited to structured surveys and can be administered to large, representative samples.
When people encounter new and complex information, they may “construct” their preferences based on the provided information and their basic values. 19 As a result, preferences can be manipulated and misinterpreted—especially if the choice is not understood or participants cannot articulate the implications of their basic values well enough to form stable preferences. 20 We assess our success at enabling women to express their preferences for the tradeoffs inherent in decisions about breast cancer screening in terms of construct validity, asking whether their responses are sensitive to relevant differences in conditions (convergent validity) and insensitive to irrelevant ones (discriminant validity).20–24
Our assessment of construct validity includes a preregistered experimental test asking whether preferences are insensitive to an irrelevant difference: the order in which the 3 outcomes are introduced and displayed. A valid procedure should elicit the same preferences with all orders. Respondents should neither anchor on the first outcome nor be unduly influenced by the last, avoiding primacy and recency effects, respectively. We compare preferences with the 3 outcomes presented in all 6 possible orders.
Our assessment of construct validity includes 3 other analyses. First, we ask how sensitive responses are to potentially relevant task features, specifying our assumptions about relevance. Second, we conduct comprehension checks, recognizing that responses reflect how well participants understand both the preference task and the comprehension check questions. Third, we analyze correlations between preferences and plausible individual difference measures (e.g., comprehension score, mammography history).
We elicit responses from a diverse sample, although not one representative of US women eligible for screening, the target population for the screening guidelines. As a result, we focus on how (and how well) participants respond to this task. We discuss what they say to illustrate how such preferences and their policy implications can be interpreted, and as part of the construct validity tests.
Methods
Design
This survey was approved by Carnegie Mellon University’s Institutional Review Board (STUDY2019_00000558). The recruitment and analysis plan was preregistered on the Open Science Framework website prior to data analysis (https://osf.io/ruy4t/?view_only=02d6dbf385ee4f6893980bf02f7b2fb9). Because the study sought to test the procedure’s construct validity for a broad range of individuals, we recruited women as young as 18 y, recognizing that some are younger than typical mammogram users, but might still be consulted regarding the guidelines. We recruited women in the United States without a history of breast cancer through the Amazon Mechanical Turk platform in June 2020. Participants were paid $5 to complete the survey, which took 17 min, on average. We used Amazon’s gender premium qualification, which screened for workers who had reported their gender as female on earlier studies where gender was not a condition for participation.
Participants completed a 27-item survey eliciting their preferences for mammography screening frequency, along with items used to assess the procedure’s construct validity. They were randomized to have the 3 outcomes presented in 1 of 6 possible orders. Supplemental Material A contains an example. The survey was extensively pretested, using interviews and a small survey, and evaluated for technical accuracy.
All 300 women who volunteered provided consent and confirmed that they were at least 18 y of age before completing the survey. Five reported that they had been previously diagnosed with breast cancer and were excluded from the analyses. Participants in the pilot test (N = 20) were not eligible.
Procedure
Following the design principles from behavioral decision research,25,26 our procedure introduces the preference task element by element, in terms meant to be intuitively meaningful while remaining faithful to the scientific evidence. Our final design introduces task elements in the following order: 1) the concept of screening guidelines; 2) the 3 focal outcomes (breast cancer deaths averted, false alarms, unnecessary treatment); 3) the table with outcome statistics, added one by one; and 4) the preference task itself.
Women learned first about the context (screening guidelines) and the 3 potential outcomes. A warm-up outcome table (Figure 1a) was then introduced, column by column. Once the table was complete, participants were asked, “If you were in this group of women, and had the statistics in the table above applied to you, how often would you want screening?” (never, every 3 y, every 2 y, every year). These responses were coded as 0, 1, 2, and 3, respectively. Women then reviewed and evaluated 4 additional tables (Figure 1b–e) in an individually randomized order. Each table appeared on a separate page, with no return option. The statistics in the tables were patterned after those for women with breast cancer risks spanning the range of greatest interest to the professional community formulating the guidelines. In this report, they are labeled very low, low, medium, and high, with respect to the risk of dying from breast cancer in the table. To avoid influencing their preferences, participants saw no labels. The survey concluded with comprehension, numeracy, and demographic questions, including prior mammogram and family breast cancer experiences.
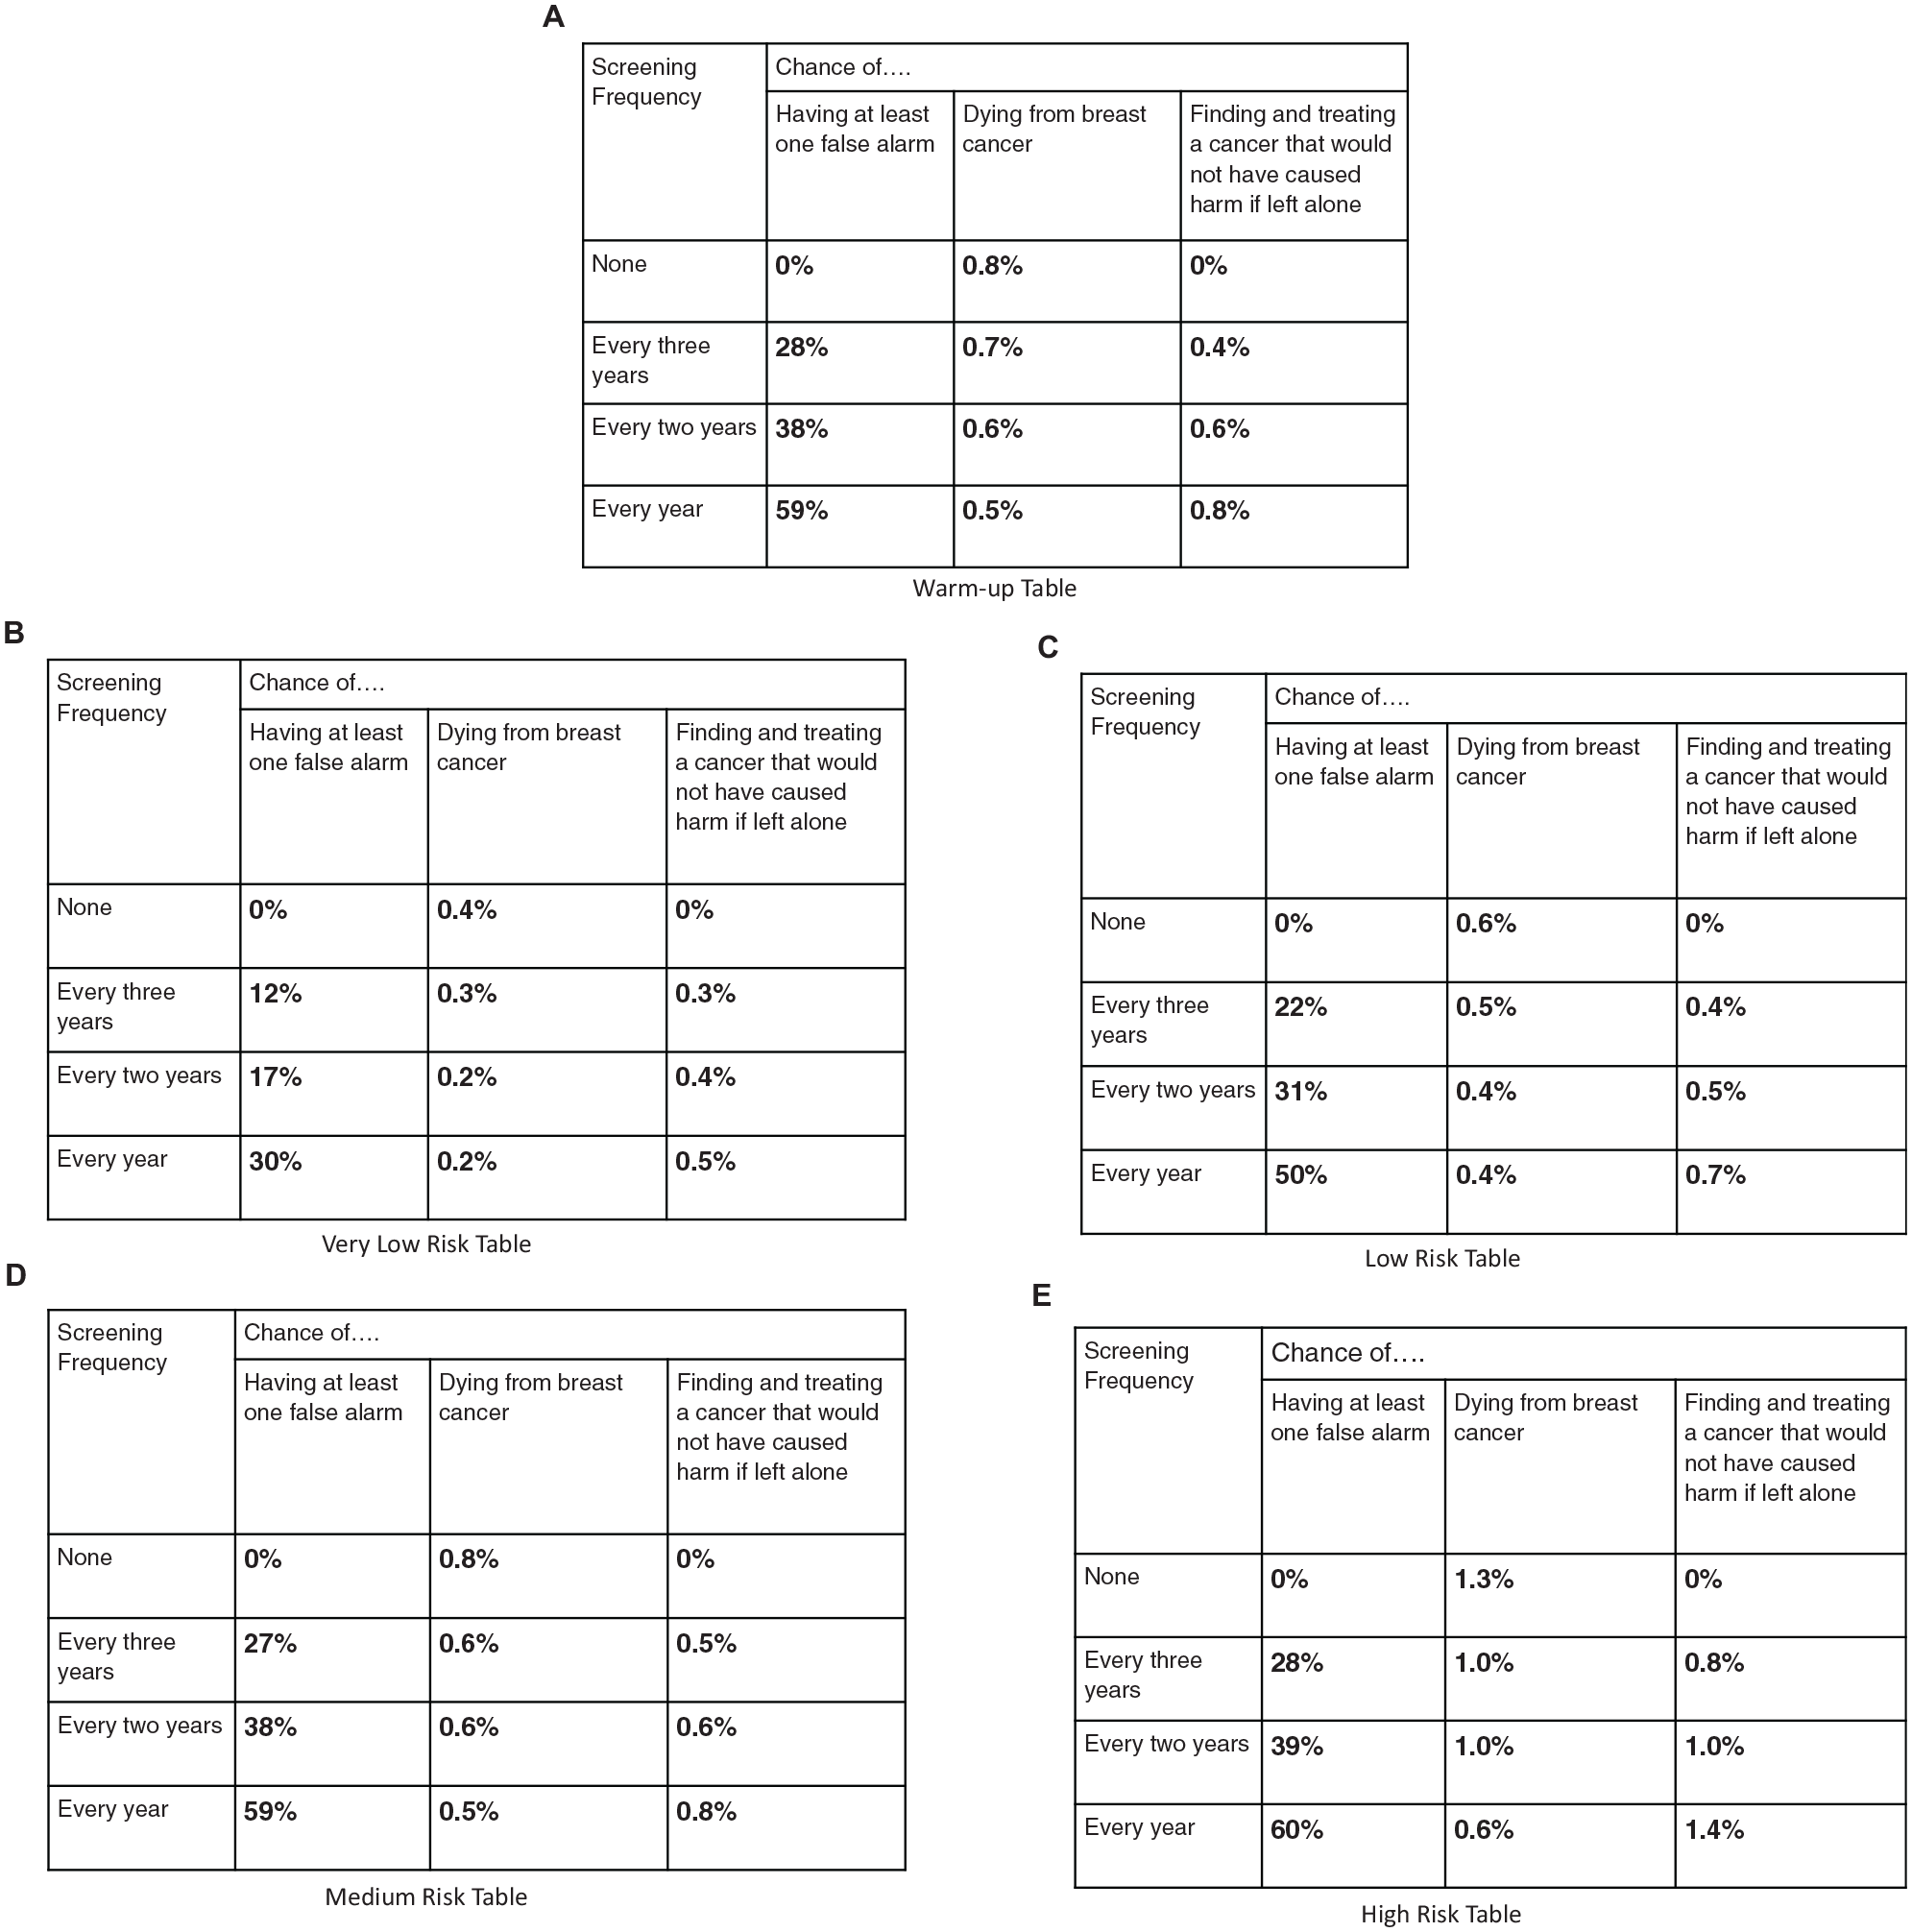
The tables used to display outcome information to elicit women's preferences for frequency of mammography screening. Women received one of six random surveys which differed in the order in which information was presented. The risk tables were presented in a random order for each participant. Note. For the Very Low Risk and Low Risk tables, Every Year was a dominated choice. For the Medium Risk and High Risk tables Every 2 Years was a dominated choice. Dominated choices occur when two rows have the same chance of breast cancer death, but differ in the other outcomes.
Table Outcome Estimates
The warm-up table and 4 risk tables reflected plausible combinations of 2 relative risk levels 27 and 4 breast density categories, as defined by the fifth edition of the American College of Radiology Breast Imaging-Reporting and Data System (BI-RADS): 1) fatty density, 2) scattered density, 3) heterogeneously dense, and 4) extremely dense. The warm-up table had average risks for all women. 28 The high-risk table was the only one with above-average breast cancer risk, about twice that in the warm-up table. In each table, as screening frequency increased, expected deaths from breast cancer decreased, whereas expected false alarms and unnecessary treatment rates increased.
All estimates were for 10 y of mammography screening, starting at age 50 y. We used estimates from Kerlikowske et al. 29 for the chance of having at least 1 false alarm over a 10-y period. For the chance of unnecessary treatment for breast cancer, we multiplied the estimates of Trentham-Dietz et al. 27 for age 50 to 74 y by a factor of 0.3. We used a lower factor than the ratio of 10 y to 24 y because breast cancer diagnoses are less likely in the decade starting at 50 y. We calculated the chance of dying from breast cancer similarly, multiplying the Trentham-Dietz et al. 27 estimates by 0.3.
Other Measures
We measured numeracy with the 3-question psychometrically validated scale reported by Schwartz et al. 30 We included 1 question from the 8-item subjective numeracy scale developed by Fagerlin et al. 31 as a proxy for the full scale. The other measures were created for this study and hence not independently validated.
Analysis
We evaluated our proposed procedure in terms of its construct validity,22,23 asking how well responses follow predicted patterns. Construct validity evaluates procedures and predictions concurrently. Thus, failure to observe a predicted pattern could reflect a flawed procedure or a flawed prediction.
Preregistered analysis of order effects
Our null hypothesis, affirming construct validity, was that women’s screening frequency preferences would be the same for all 6 orders of introducing the 3 outcomes. We used a 6-group Kruskal-Wallis test, with the conventional 0.05 significance level. We analyzed preferences for the warm-up table and each of the 4 risk tables separately. After analyzing the entire sample, we conducted secondary analyses excluding the 7 women whose completion time was 2 standard deviations less than the sample mean, as specified in our preregistration.
Additional analyses of construct validity
We used ordered-logistic regression to examine possible relationships between screening preferences and the covariates in Supplementary Material B Table A1. A stepwise algorithm identified the model that best predicted preferred screening frequencies. We assessed comprehension in 2 ways: 1) with the 3 comprehension questions and 2) by how often participants selected dominated options. Dominated options occur when, due to rounding in breast cancer death estimates, 2 rows with the same value for that outcome (e.g., Figure 1d, rows 3 and 4) have differences in the other 2 outcomes. As a result, one option “dominates” the other—if respondents care about the differences in the other outcomes. Women should not pick a dominated row unless (a) they always prefer the same screening frequency, making all cell entries irrelevant; (b) they care only about breast cancer deaths, making the differences in the other columns irrelevant and the choice between them arbitrary; (c) the difference in false alarm and unnecessary treatment rates is too small to matter (although larger differences might); or (d) they do not trust the estimates and rely on their own beliefs regarding screening outcomes. Our data allowed testing for the first of these possible reasons but not the last three. i We used ordered-logistic regression to see how well covariates predicted whether participants chose dominated options.
Power analysis
To determine sample size, we conducted a power analysis using the G*Power software. An asymptotic relative efficiency factor of 0.955 was used to estimate the sample size needed for a Kruskal-Wallis test, 32 based on the sample size estimate for an analysis of covariance test with 0.9 power to detect a medium effect size 0.25, at the conventional 0.05 alpha error probability, with 10 covariates. Our target sample size was 288 participants. Assuming that some would not meet our inclusion criteria, we recruited 300 participants.
Role of the funding source
The funding source had no role in creating the survey, recruiting participants, or analyzing the data.
Results
Sample Characteristics
Demographics
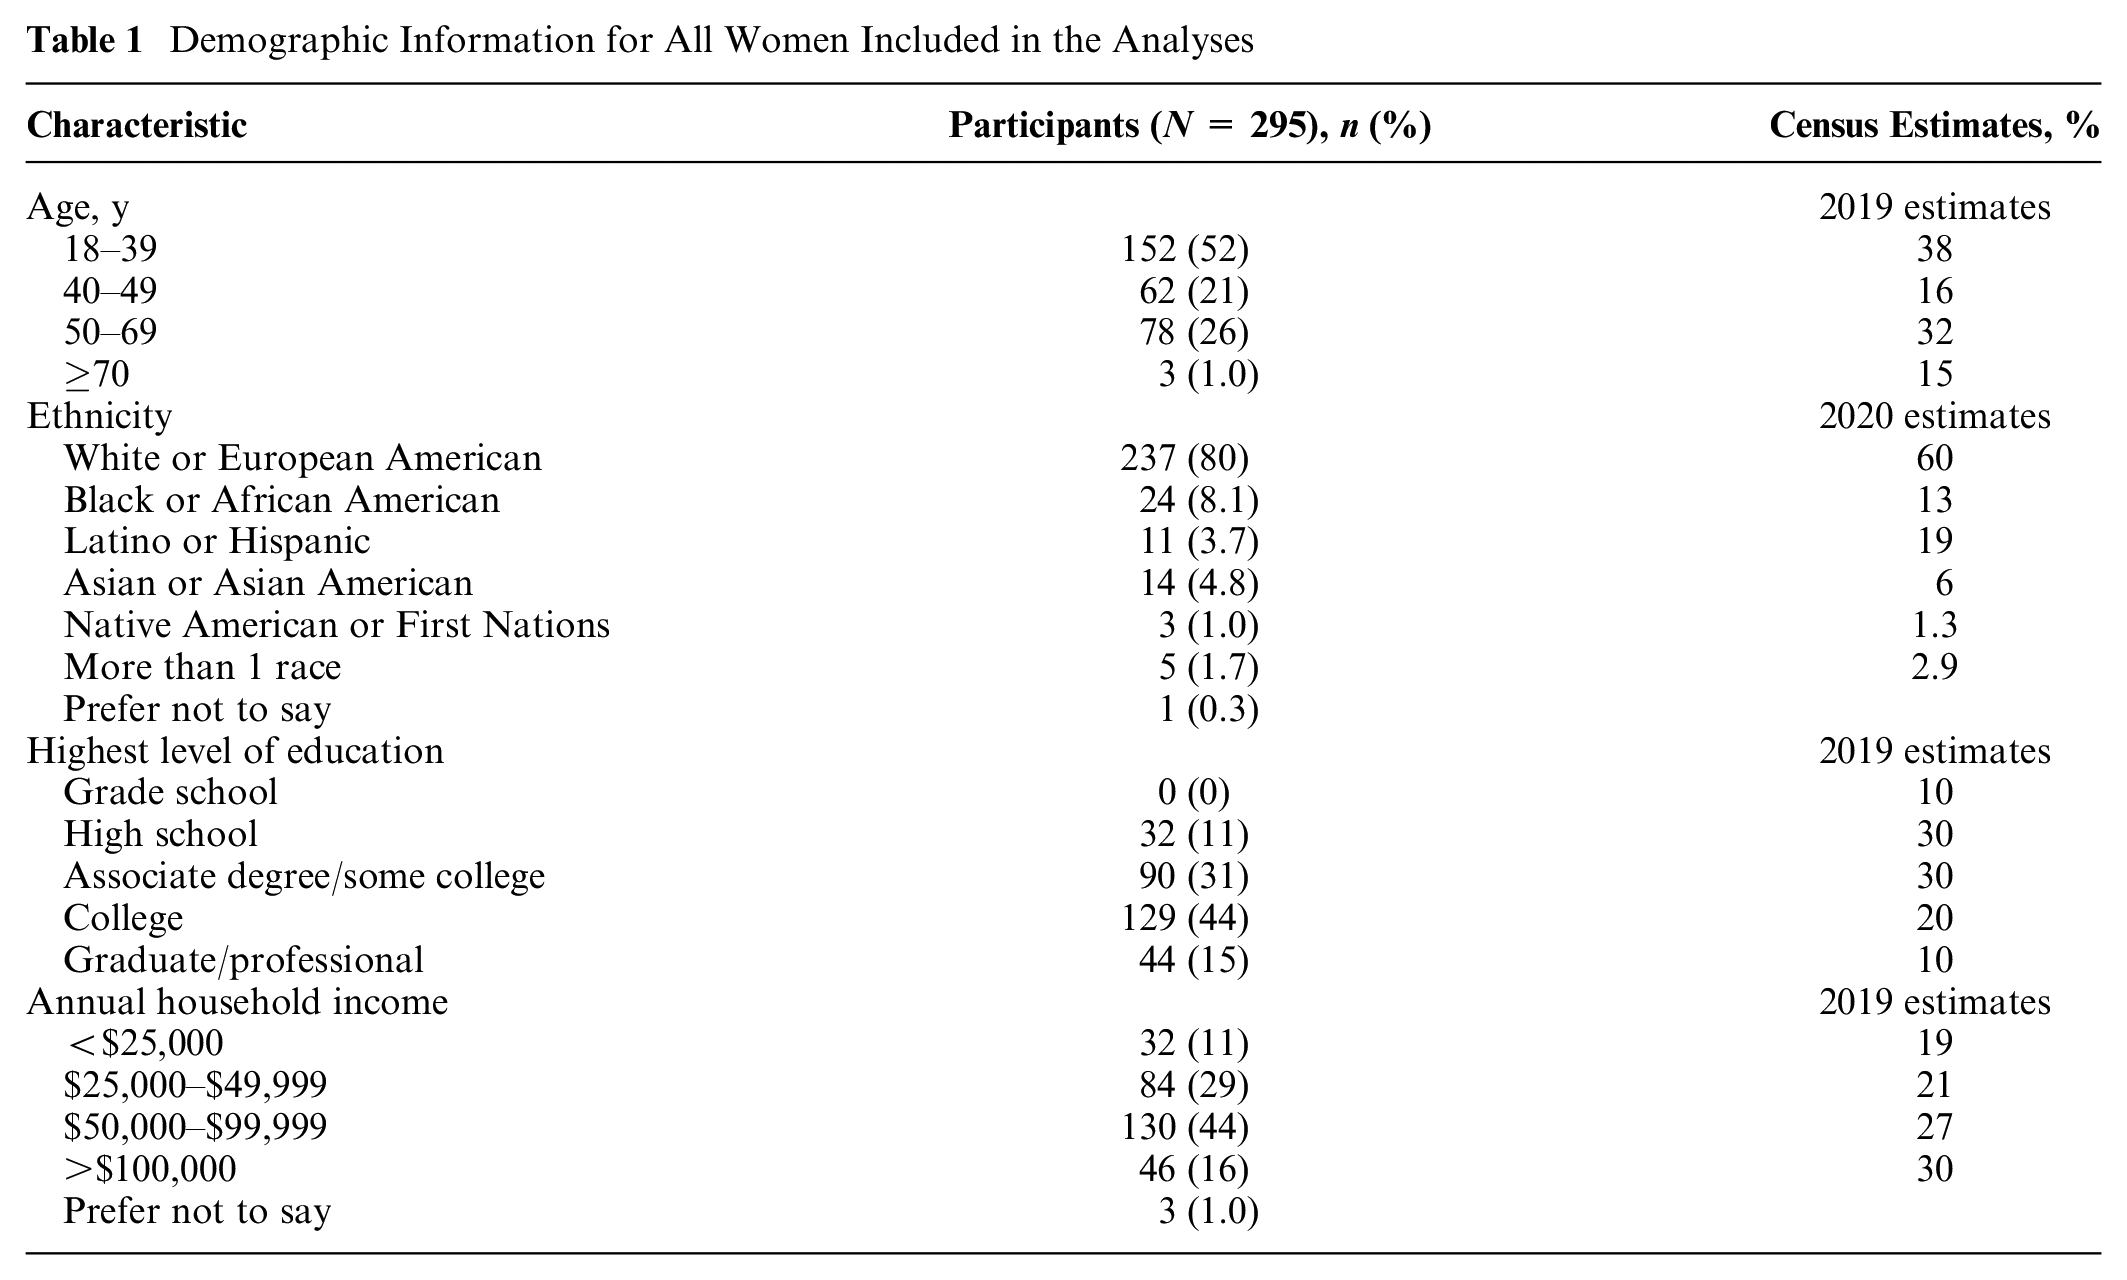
As seen in Table 1, the sample was younger, with more education, higher household income, 33 and a higher proportion of White people than the US population. 34
Demographic Information for All Women Included in the Analyses
Personal and family history
About half the women (47%) reported having had a mammogram, with varied screening frequencies (Supplementary Material B Table 1A). Twelve percent reported having a blood relative diagnosed with breast cancer.
Numeracy and subjective numeracy
Table 2 shows the percentage of women answering each numeracy test question correctly. These percentages are somewhat higher than in studies with similarly sampled participants. 30 The mean subjective numeracy rating was also somewhat higher. 31
Numeracy and Comprehension for All Women Included in the Analyses (N = 295) a
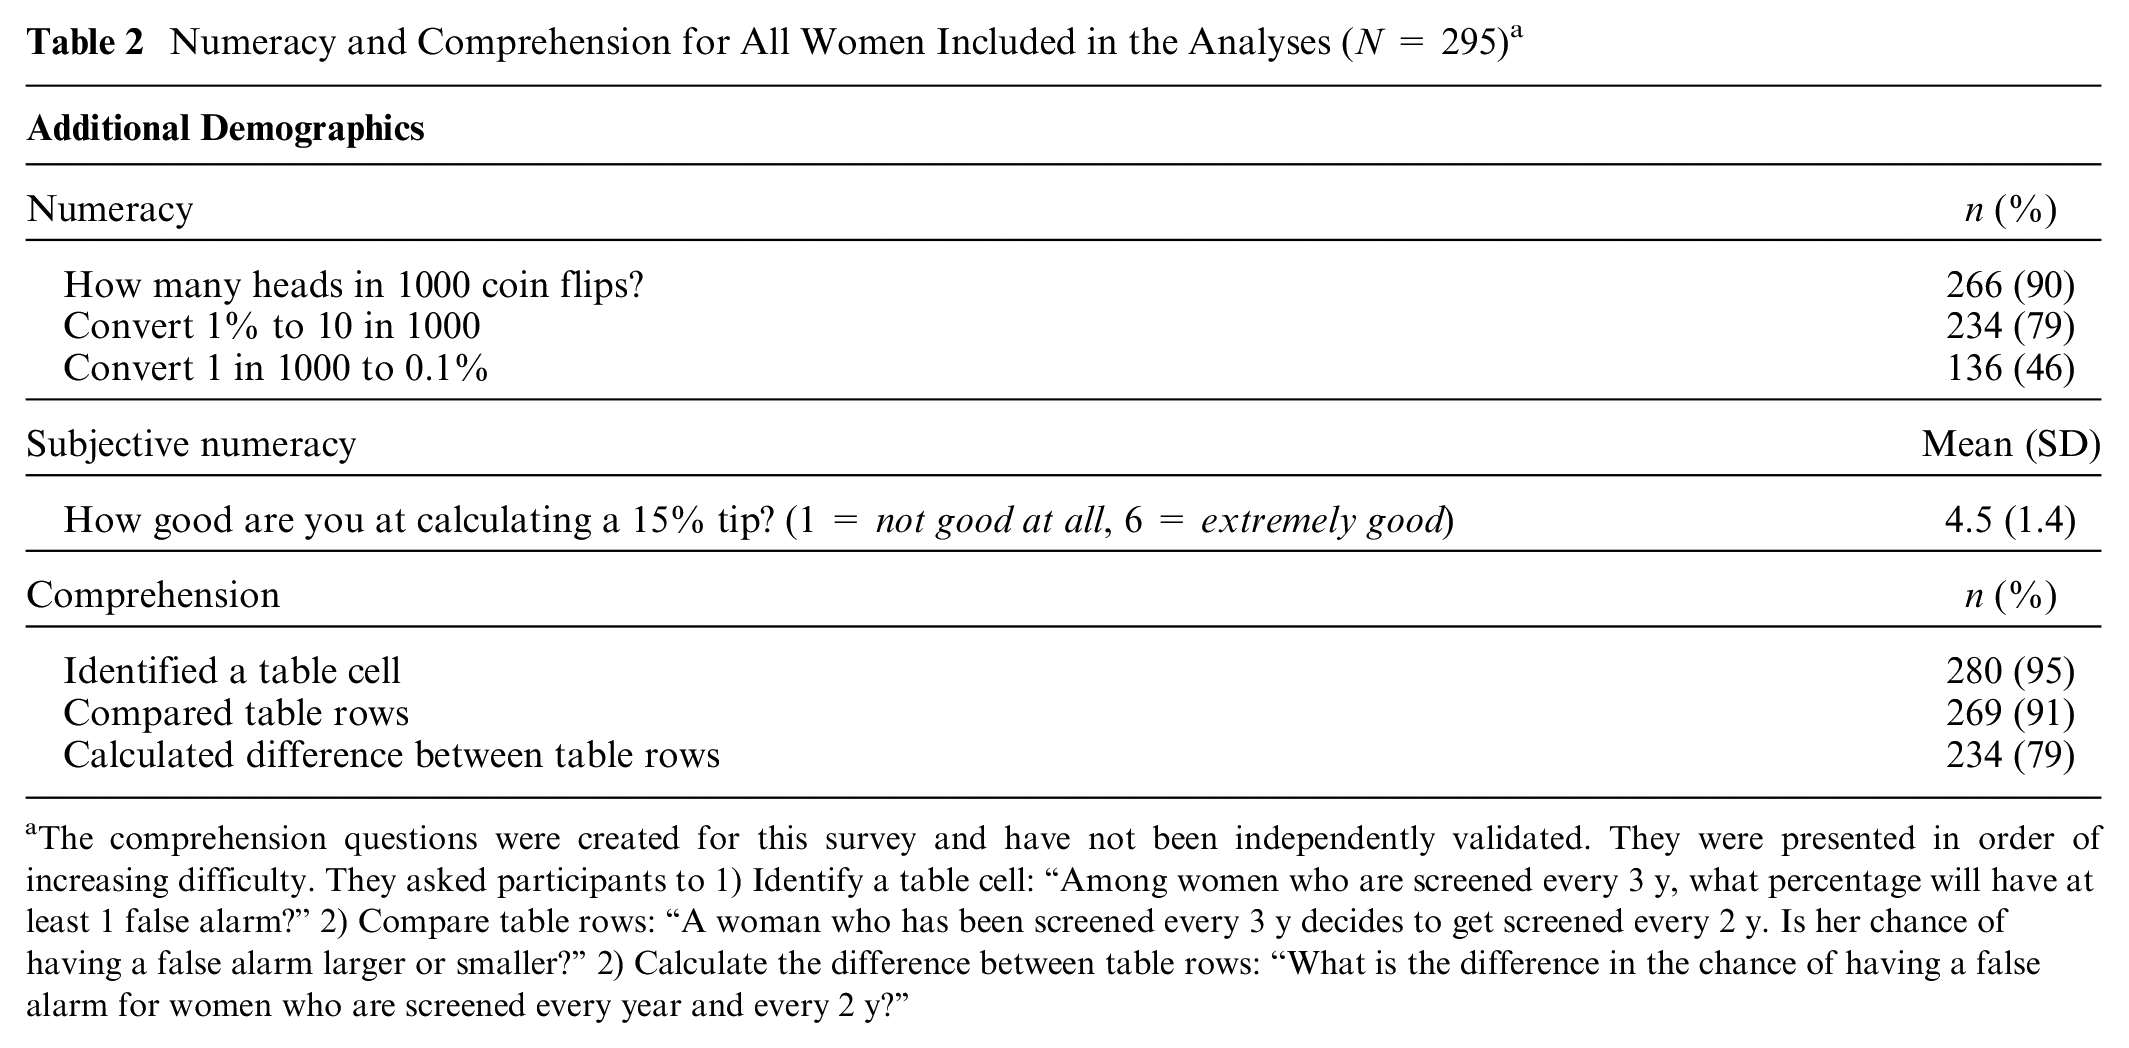
The comprehension questions were created for this survey and have not been independently validated. They were presented in order of increasing difficulty. They asked participants to 1) Identify a table cell: “Among women who are screened every 3 y, what percentage will have at least 1 false alarm?” 2) Compare table rows: “A woman who has been screened every 3 y decides to get screened every 2 y. Is her chance of having a false alarm larger or smaller?” 2) Calculate the difference between table rows: “What is the difference in the chance of having a false alarm for women who are screened every year and every 2 y?”
Comprehension
The comprehension test had 3 questions with increasing difficulty. Almost all participants correctly answered the first 2 questions, asking them to read the number in a cell and compare 2 rows. About 20% did not compute the difference between 2 table entries correctly, reflecting misunderstanding or difficulty with mental arithmetic.
Randomization
The number of participants in the 6 experimental groups ranged from 47 to 53 (see Supplementary Material B Table 2A for details). There were no statistically significant differences between the groups in any sample characteristic, indicating successful randomization.
Order Effect (Preregistered)
A Kruskal-Wallis test revealed no significant differences in the preferences of women who viewed the 3 outcomes in the 6 possible orders. The Kruskal-Wallis effect size, η2[H] = (H − k + 1)/(n − k) indicated that order accounted for no more than 1.4% of preference variation for any table (mean = 0.6%; Supplementary Material B Table 3A). A secondary Kruskal-Wallis test, excluding the 7 participants who completed the survey in 2 standard deviations less time than the mean, produced similar results (Supplementary Material B Table 3B). As mammography screening preferences were similar across the 6 orders, we pooled data for subsequent analyses.
Number and Percentage of Women Preferring Each Screening Frequency for Each Risk Table (N = 295) a
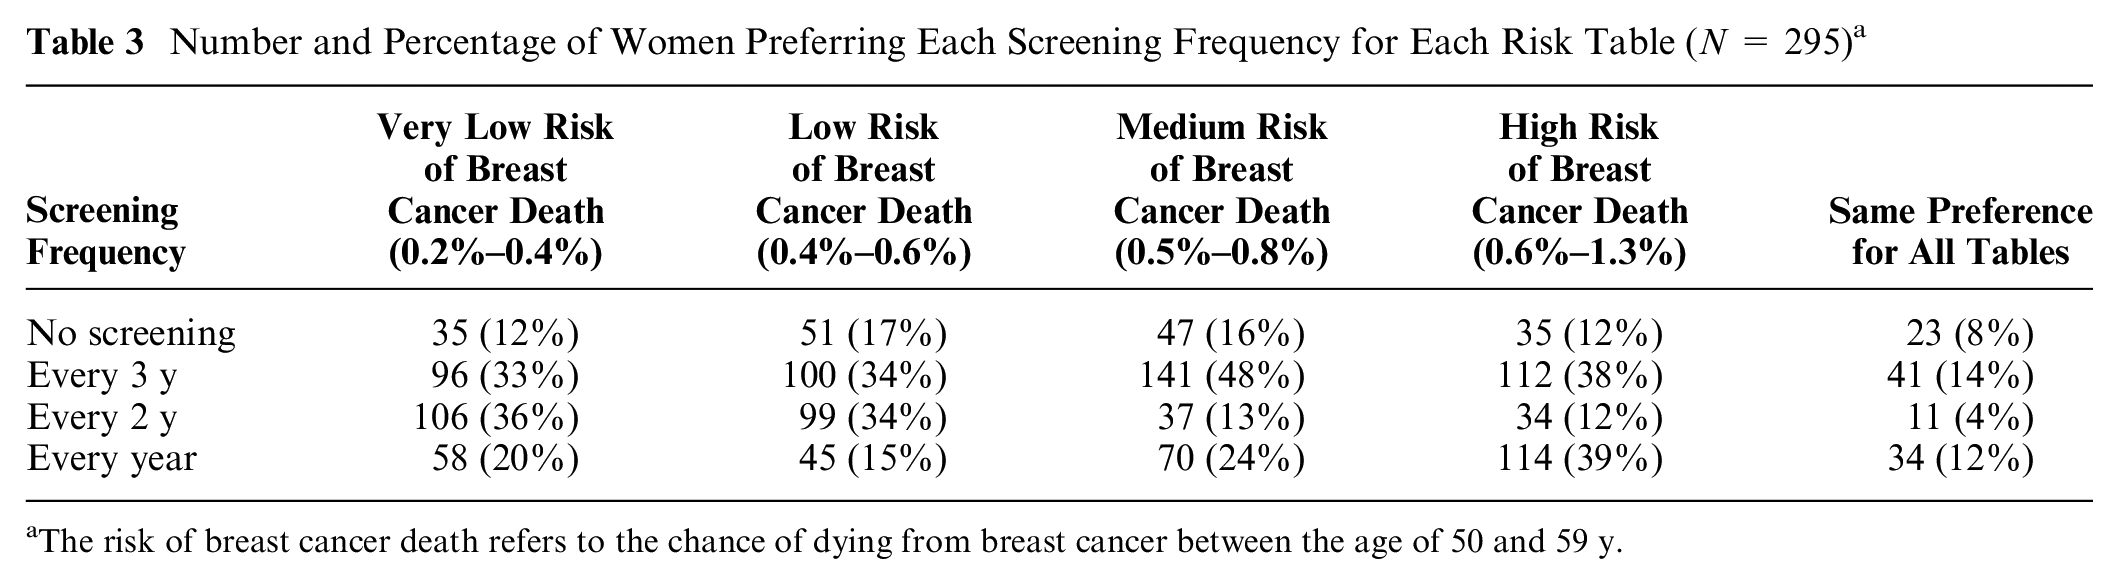
The risk of breast cancer death refers to the chance of dying from breast cancer between the age of 50 and 59 y.
Additional Analyses
The lack of an order effect shows the insensitivity of preferences to an irrelevant task feature. The following analyses ask how sensitive preferences were to potentially relevant features. These patterns of preferences indicate construct validity to the extent that one believes, based on research or clinical experience, that they are consistent with the preferences of women in the sampled population, indicating that they understood the task and could express themselves in this way.
Screening preferences for risk tables
Table 3 shows how many women preferred each screening frequency for each table. The right-hand column shows those who preferred the same frequency for all 4 tables. Comprising 37% of respondents, they most commonly wanted screening every year or every 3 y. We look first at the rows, and then the columns, asking how preferences varied across tables.
At one extreme (top row), 8% of women never wanted screening, with an additional 4% to 9% not wanting it for specific risk tables (for a total that ranged from 12% [very low risk] to 17% [low risk]). At the other extreme (bottom row), 12% of women wanted annual screening for all 4 tables, with the total percentage ranging from 15% (low risk) to 39% (high risk). At least one-third of women wanted screening every 3 y for each table. However, those were somewhat different women, as only 14% wanted that frequency for all 4 tables. Few women (4%) wanted screening every 2 y for all 4 risk tables. The number of additional women wanting screening every 2 y ranged from 8% (high risk) to 32% (very low risk). For very low and low risk, there was roughly a unimodal preference for screening every 2 or 3 y. With medium and high risk, there was a bimodal preference for screening every year or every 3 y.
Screening preference changes
Table 4a–c shows how women’s preferences differed in tables one step apart in breast cancer risk (and chance of benefiting from screening), with the corresponding changes in false alarm and unnecessary treatment rates. As mentioned, women received the tables in random order, on separate screens with no return option. Thus, they could not compare the tables directly. The columns present preferences for the table with greater cancer risks. Entries above the diagonal indicate preferring more frequent screening when cancer risks are greater, implying that the greater benefits of screening outweigh the greater risks of false alarms and unnecessary treatment. Conversely, entries below the diagonal indicate women who wanted less screening, implying that the greater expected harms outweighed the greater expected benefits.
Table 4a shows that most women had the same preferences with very low risk (breast cancer deaths range: 0.2% to 0.4%) and low risk (range: 0.4% to 0.6%), reflected in the large frequencies in the main diagonal (70%). Among participants whose preferences differed, more wanted less screening with low risk than with very low risk, reflected in greater frequencies below the diagonal (66) than above (23). Most shifts were 1-level changes (70), with few 2-level (18) or 3-level (1) ones. Very few participants who wanted no screening in the very-low-risk condition wanted some screening in the low-risk condition (14.3%). About one-third of women who preferred each of the other frequencies with very low risk shifted with low risk: every 3 y (32.3%), every 2 y (31.3%), or every year (34.5%).
Comparing Preferences for Risk Tables (Number Choosing Each Combination of Screening Frequencies) a
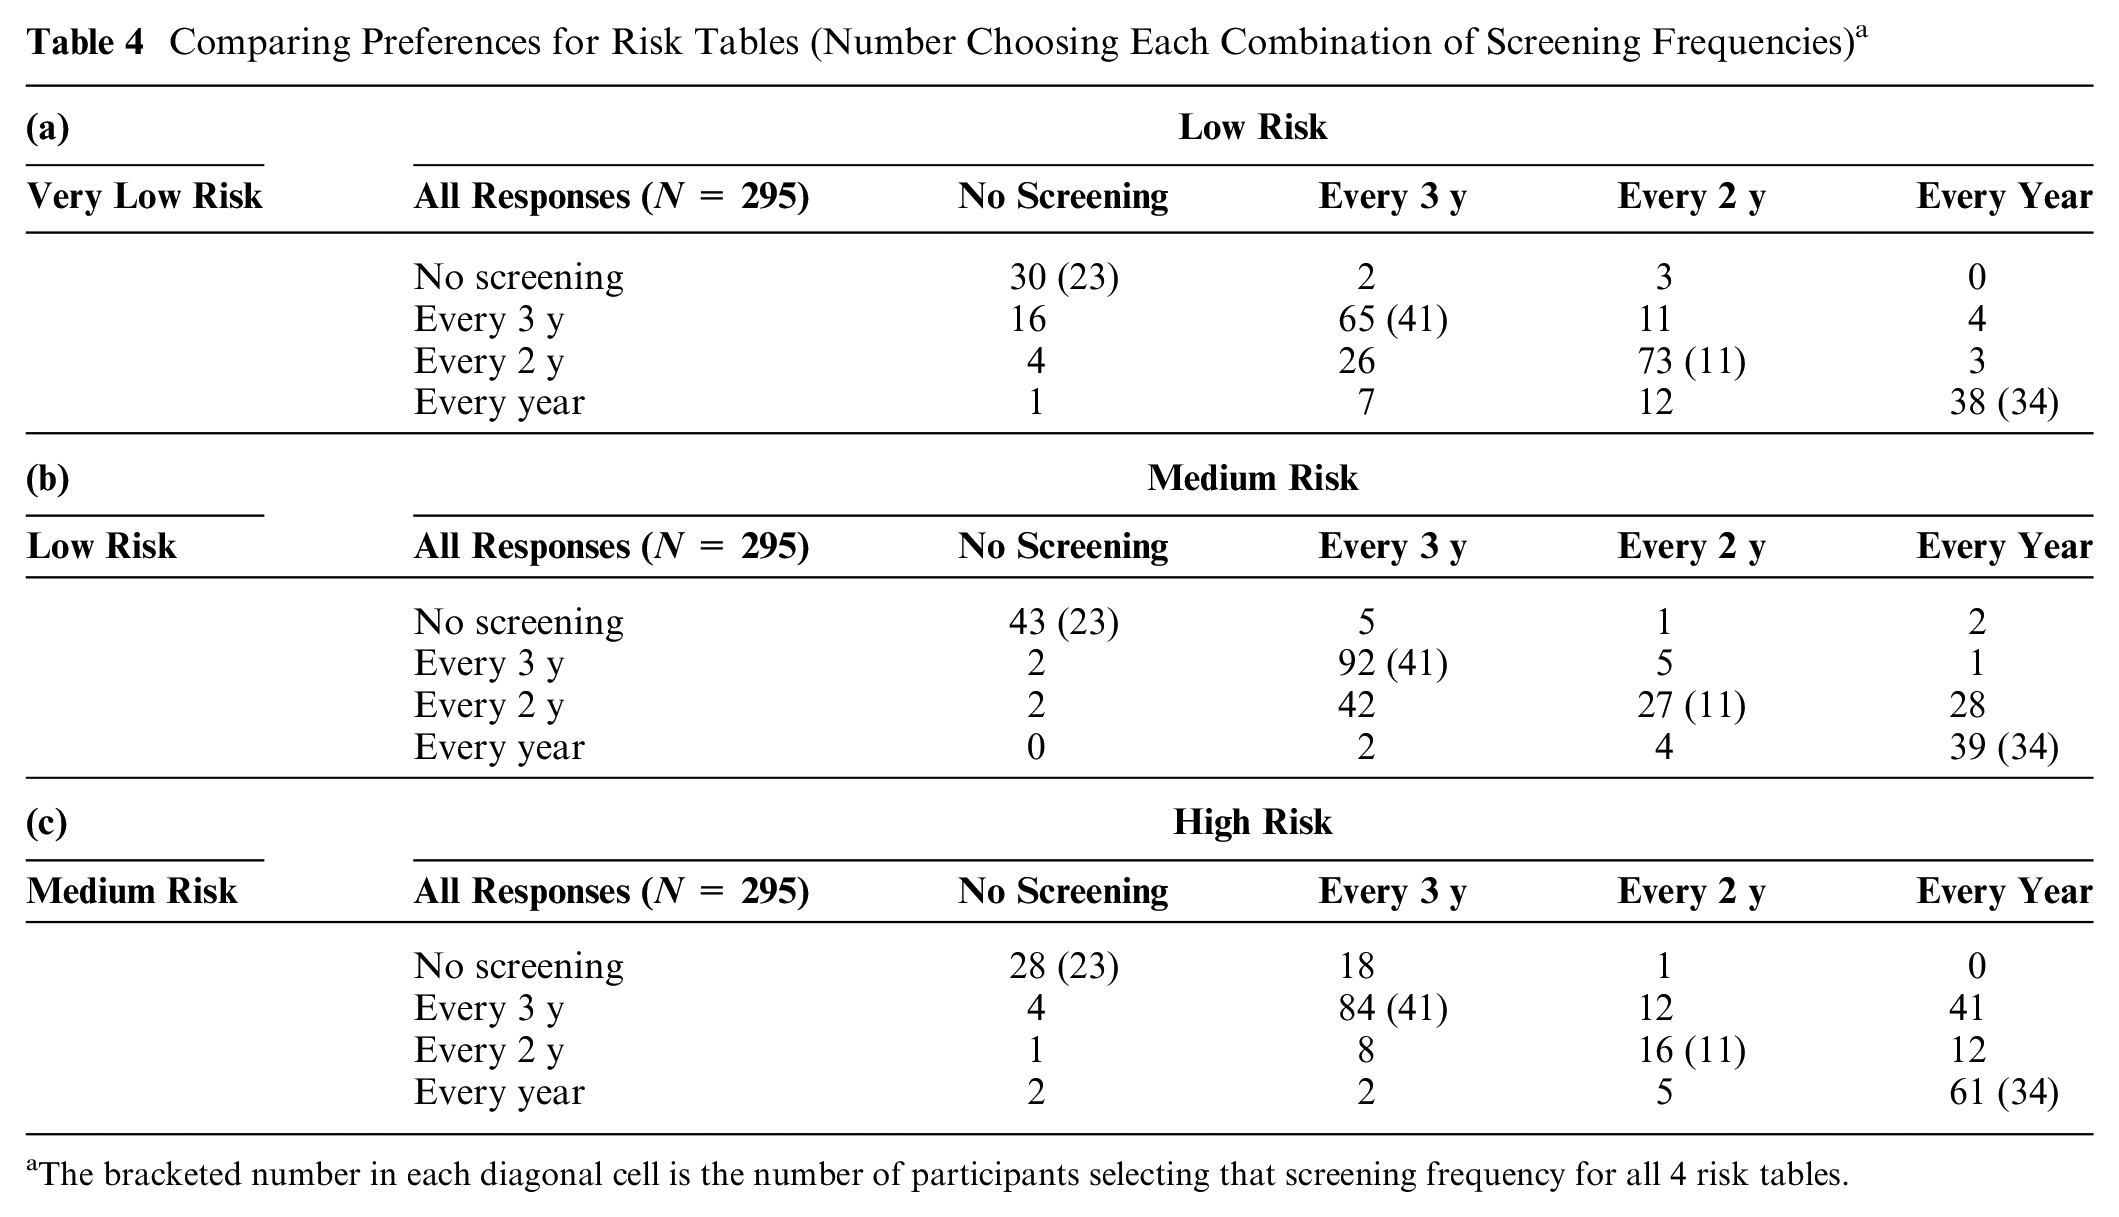
The bracketed number in each diagonal cell is the number of participants selecting that screening frequency for all 4 risk tables.
Table 4b compares preferences with low risk (breast cancer death range: 0.4% to 0.6%) and medium risk (range: 0.5% to 0.8%). Here, too, most women had the same preference in both cases, with most shifts, again, being one level. This time, though, the shifts involved roughly equal numbers of women who preferred more screening with the greater risk (42) and who preferred less (52).
Table 4c shows the opposite pattern, comparing preferences with medium risk (breast cancer death range: 0.5% to 0.8%) and high risk (breast cancer range: 0.6% to 1.3%). There, the greater expected benefit of additional screening with the higher breast cancer risk appeared to outweigh the greater expected harms, as seen in the higher frequencies (84) above the diagonal than below (22). Indeed, among the 141 women who preferred screening every 3 y with medium risk, 41 (29%) preferred annual screening with high risk and another 12 (9%) preferred screening every 2 y. A visual depiction of this pattern can be found in Supplementary Material C.
Predicting screening preferences
Table 5 shows ordered-logistic regression models predicting screening preferences for each of the 4 risk tables. Potential predictors included all variables in Tables 1, 2, Supplementary Material 1A, and outcome order. Predictors appearing in the table emerged through stepwise regression. Thus, these preferences were unrelated to numeracy, subjective numeracy, or any demographic variable; as a result, none appear here (see Supplementary Material D for details).
Predictors of Screening Frequency Preference
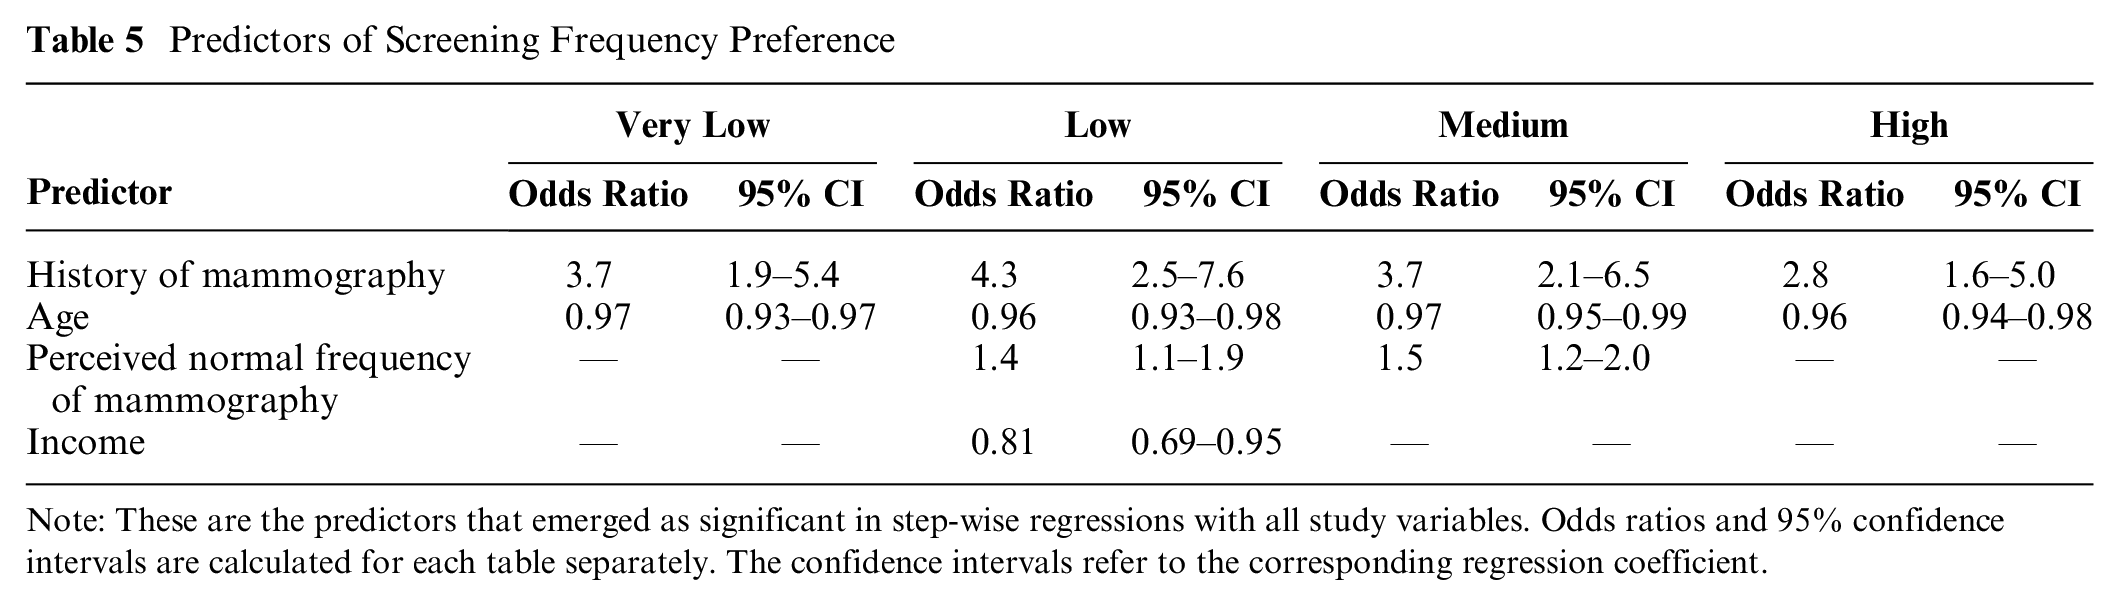
Note: These are the predictors that emerged as significant in step-wise regressions with all study variables. Odds ratios and 95% confidence intervals are calculated for each table separately. The confidence intervals refer to the corresponding regression coefficient.
For each table, women with a history of mammography preferred more screening than did women who reported none. Older women preferred less screening. Although older women are more likely to have a history of screening, that group also includes many who have explicitly opted out of screening. Conversely, although fewer young women have a history of screening, those who do may have some reason for preferring it (e.g., family history). For 2 of the 4 tables, women who perceived higher screening frequency as the norm also preferred higher screening frequency. For the low risk table, women with higher income preferred lower screening frequency.
Dominated choices
Overall, 36% of women chose a dominated option at least once. Of these, 43% always chose that screening frequency, fulfilling condition (a) above, hence not necessarily violating dominance. That left 15% who chose at least 1 dominated choice, unless condition (b), (c), or (d) held, which could not be determined. Ordered logistic regression found that women were more likely to make at least 1 dominated choice if they answered fewer comprehension questions correctly (odds ratio [OR] = 0.60/B =−0.51, P < 0.05). Those who varied their choices over the 4 risk tables were significantly more likely to make one dominated choice if they were less educated (OR = 0.58/B =−0.54, P < 0.05; see Supplementary Material E for details).
Discussion
We propose a procedure for individuals to communicate their preferences among health care policies, using mammography screening preferences as a test case. We present evidence regarding the procedure’s construct validity, with a diverse sample of women. Overall, the procedure appears to elicit plausible, internally consistent preferences, expressed in terms directly related to health care policy choices. The present evidence allows potential users to compare the evidence regarding the construct validity of our procedure with the evidence for alternative procedures, such as discrete choice methods.
The proposed procedure elicits choices among the options facing policy makers, based on quantitative estimates of their expected outcomes (drawing on the Breast Cancer Surveillance Consortium’s latest estimates). Compared with general attitude surveys, the procedure provides more informed responses. Compared with discrete choice studies, the procedure directly addresses policy makers’ choices, rather than requiring intermediate inferences. Compared with interactive decision aids, the procedure is suited to structured surveys that can be administered to large, representative samples.
A preregistered experimental test found evidence of one form of construct validity: preferences were insensitive to an irrelevant task feature, the order in which the outcomes were introduced and displayed.
Additional analyses found patterns suggesting sensitivity to potentially relevant task features. As with all tests of construct validity, the interpretation is a judgment call. To the extent that patterns appear consistent with research and clinical evidence regarding women’s screening preferences, they increase confidence in the elicitation procedure. For this study, the patterns include:
Roughly one-third of women chose the same screening frequency for the 4 risk tables, most commonly preferring screening every year or every 3 y. That consistency may reflect firm commitments, informed by personal experience and physician recommendations, or insensitivity to the outcome statistics.
Among women whose preferences varied across the tables, roughly half changed with each incremental change in breast cancer risk. Those changes had plausible, but not proven, explanations in terms of differences in expected benefits and harms.
Women who were younger and had a history of mammograms tended to prefer more screening, potentially consistent with their experience.
Women’s preferences were unrelated to their scores on measures of numeracy and subjective numeracy, suggesting that the procedure works equally well for women who vary in these ways.
Roughly one-third of women selected a dominated screening frequency for at least 1 of the 4 tables. About 40% of those women chose the same frequency for all 4 tables, potentially making dominance irrelevant for some. Dominated choices were more common among women who answered fewer comprehension questions correctly and were less educated, consistent with their finding the task more difficult.
These patterns appear consistent with previous research.6,35 We used validated general measures (e.g., numeracy) and 2 new measures, specific to this task, but not independently evaluated: comprehension and dominated choices. As a result, we can have more confidence in analyses involving the numeracy measures than the comprehension measures.
The procedure draws on health behavior research for selecting and describing the focal outcomes. It draws on behavioral decision research for communicating and eliciting preferences among them. Our new task-specific measures (comprehension, dominated choices) seem promising but need further validation. The previously validated general measures (numeracy, subjective numeracy) had little predictive value.
The procedure was designed for use with a planned nationally representative sample of women aged 40 to 74 y, whose preferences would inform national guidelines. Although not nationally representative, the present sample was diverse enough to assess the procedure’s robustness across a range of potential survey participants.
One potential limitation is that our sample was somewhat younger, more educated, affluent, more numerate, and less racially diverse than the general population (Table 1). Within the sample’s constraints, we found responses unrelated to these demographic factors. As mentioned, we sought diverse respondents to assess the robustness of the procedure. In replications of well-known studies, MTurk samples have been found to respond similarly to samples recruited with other methods. 36 Nonetheless, using this recruitment method may have affected results.
A second potential limitation is that the concept of unnecessary treatment appeared difficult for some participants. Finding better ways of communicating this potentially critical outcome is an area of active research.5,16,17 We did not explicitly mention other outcomes, such as unnecessary biopsies.
A third potential limitation is that the new comprehension questions could be improved. Almost all women answered the first 2 questions correctly, indicating that they understood those aspects of the task, but providing little basis for discriminating levels of understanding. The third question appeared to confuse some women and was revised for the national survey.
If these patterns of preferences generalize to representative samples, they suggest that women have heterogeneous preferences that guidelines would need to consider. These preferences could be addressed by recommending shared decision making for outcome scenarios in which women have heterogeneous preferences. For unimodal preferences, a single screening frequency could be recommended. Roughly one-third of participants preferred the same frequency whatever the expected benefit (reduced breast cancer deaths) and harms (false alarms, unnecessary treatment). Participants’ desire for screening increased with breast cancer risk, despite the increase in false alarms and unnecessary treatment. Their preferences were robust enough to be unaffected by the order in which outcomes are presented. However, not all participants appeared to understand the task fully or know what choices they want.
We can only speculate about how the procedure would work in clinical practice. Conceivably, individualized risk tables might help structure consultations between patients and health care providers, with opportunities to clarify unclear topics (e.g., unnecessary treatment). More research would be needed to extend this elicitation procedure into a decision aid.
Overall, we believe that our procedure offers a viable method for eliciting preferences, suited to surveys administered to large, diverse samples. Its construct validity tests allow evaluating individual responses. It translates women’s preferences into policy makers’ terms, while suggesting explanations for differences in preferences.
Supplemental Material
sj-docx-1-mdm-10.1177_0272989X211073320 – Supplemental material for A Procedure for Eliciting Women’s Preferences for Breast Cancer Screening Frequency
Supplemental material, sj-docx-1-mdm-10.1177_0272989X211073320 for A Procedure for Eliciting Women’s Preferences for Breast Cancer Screening Frequency by Emily Grayek, Yanran Yang, Baruch Fischhoff, Karen E. Schifferdecker, Steven Woloshin, Karla Kerlikowske, Diana L. Miglioretti and Anna N. A. Tosteson in Medical Decision Making
Footnotes
Acknowledgements
This work was done in collaboration with the Dartmouth Institute for Health Policy and Clinical Practice and sponsored by the Trustees of Dartmouth College.
The authors declared no potential conflicts of interest with respect to the research, authorship, and/or publication of this article.
The authors disclosed receipt of the following financial support for the research, authorship, and/or publication of this article: Financial support for this study was provided in-part by a grant from the Trustees of Dartmouth College and by a grant from the National Cancer Institute (P01CA154292). The funding agreements ensured the authors’ independence in designing the study, interpreting the data, writing, and publishing the report.
Supplemental Material
Notes
References
Supplementary Material
Please find the following supplemental material available below.
For Open Access articles published under a Creative Commons License, all supplemental material carries the same license as the article it is associated with.
For non-Open Access articles published, all supplemental material carries a non-exclusive license, and permission requests for re-use of supplemental material or any part of supplemental material shall be sent directly to the copyright owner as specified in the copyright notice associated with the article.