
Abstract
Background
An established risk model may demonstrate miscalibration, meaning predicted risks do not accurately capture event rates. In some instances, investigators can identify and address the cause of miscalibration. In other circumstances, it may be appropriate to recalibrate the risk model. Existing recalibration methods do not account for settings in which the risk score will be used for risk-based clinical decision making.
Methods
We propose 2 new methods for risk model recalibration when the intended purpose of the risk model is to prescribe an intervention to high-risk individuals. Our measure of risk model clinical utility is standardized net benefit. The first method is a weighted strategy that prioritizes good calibration at or around the critical risk threshold. The second method uses constrained optimization to produce a recalibrated risk model with maximum possible net benefit, thereby prioritizing good calibration around the critical risk threshold. We also propose a graphical tool for assessing the potential for recalibration to improve the net benefit of a risk model. We illustrate these methods by recalibrating the American College of Cardiology (ACC)–American Heart Association (AHA) atherosclerotic cardiovascular disease (ASCVD) risk score within the Multi-Ethnic Study of Atherosclerosis (MESA) cohort.
Results
New methods are implemented in the R package ClinicalUtilityRecal. Recalibrating the ACC-AHA-ASCVD risk score for a MESA subcohort results in higher estimated net benefit using the proposed methods compared with existing methods, with improved calibration in the most clinically impactful regions of risk.
Conclusion
The proposed methods target good calibration for critical risks and can improve the net benefit of a risk model. We recommend constrained optimization when the risk model net benefit is paramount. The weighted approach can be considered when good calibration over an interval of risks is important.
Risk models can help clinicians and patients make health care decisions. Recommendations for specific interventions can be based on comparing patients’ estimated risk of a particular clinical outcome to a predefined risk threshold. In 2013, the American College of Cardiology (ACC) and the American Heart Association (AHA) published guidelines recommending that individuals with an estimated 10-y risk of atherosclerotic cardiovascular disease (ASCVD) greater than 7.5% receive statin therapy. 1 Paired with this guideline, the panel developed the ACC-AHA-ASCVD risk calculator to estimate 10-y ASCVD risk, with recommendations to reassess risk every 4 to 6 y in adults aged 40 to 79 y free of ASCVD.
In such settings, risk model calibration carries heightened importance. The calibration of a risk model refers to the agreement between predicted risks and observed rates of events. There is evidence that the ACC-AHA-ASCVD risk calculator substantially overestimates the risk of ASCVD. 2 Following risk-based treatment guidelines, using overestimated risks implies overtreatment in the population. Hence, miscalibration can have a serious public health impact. 3
When an established risk model is applied to a new population, we are particularly concerned that predicted risks may not be well calibrated. In addition, a well-calibrated model may become miscalibrated over time. 4 Ideally, when miscalibration appears, one can identify and address the cause. However, this is not always possible. Miscalibration can arise for complex reasons or because of fundamental differences between populations. In such instances, it will not be possible to eliminate the source of miscalibration. 5 When a model is poorly calibrated and development of a new model is infeasible or undesirable, then it may be prudent to use statistical methods to recalibrate the risk model. However, existing methods for risk model recalibration do not account for how the risk model will be used in clinical practice. In this work, we propose 2 methods for risk model recalibration when the purpose of the risk model is to recommend for or against an intervention based on a predetermined risk threshold.
Before implementing recalibration methods, researchers may wish to understand whether recalibration has the potential to improve the usefulness of a risk model. We propose a graphical tool to help with this assessment. The tool indicates when specialized methods of recalibration, such as those proposed, have the potential to improve the clinical utility of a risk model beyond standard methods of recalibration.
First, we define terminology and notation and summarizes key background material. Next, we introduce a the graphical device to help researchers assess the potential for recalibration to improve the clinical utility of a risk model. Following this, we propose 2 new methods of recalibration, weighted logistic recalibration and constrained logistic recalibration. We present simulation results and illustrate the use of the graphical tool and apply the proposed methods to recalibration the ACC-AHA-ASCVD risk model within the ethnically diverse Multi-Ethnic Study of Atherosclerosis (MESA) cohort. We close with a discussion of the materials presented.
Methods
Preliminaries
Notation and definitions
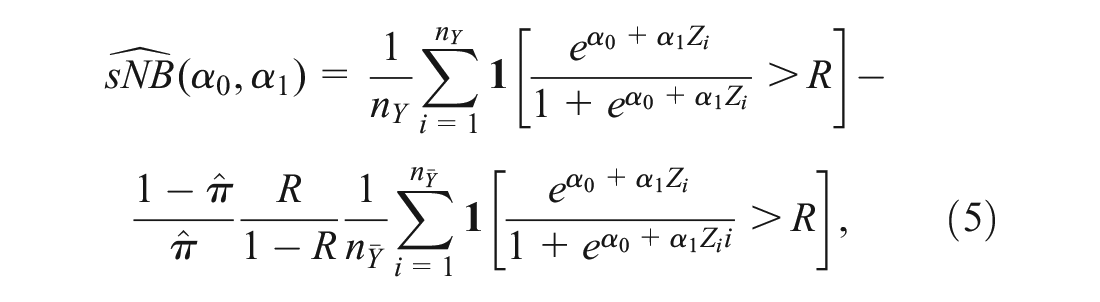
The expected benefit of the intervention to a would-be case is
Let
Here and throughout, we assume a data set is available for recalibrating the risk model
Risk model calibration
Different notions of calibration have appeared in the literature on risk models. Van Calster et al.
6
presented 4 notions of risk model calibration: strong calibration, moderate calibration, weak or logistic calibration, and calibration-in-the-large. These types of calibration are hierarchical: strong calibration implies moderate calibration, moderate calibration implies weak calibration, and weak calibration implies calibration-in-the-large. The definition of calibration in this article is “moderate calibration,” as defined by Van Calster et al.
6
and is formally expressed as follows. For risk model
The calibration of a risk model can be assessed by examining observed event rates in groups with similar predicted risks. In Hosmer-Lemeshow plots, predicted risks are typically grouped by deciles; for each decile, the event rate for the decile is plotted against the average predicted risk in that group. 7 Alternatively, smoothing functions (such as a LOESS smoother) can be used to generate a calibration curve. 8 The calibration curve for a calibrated risk model is the identity line.
Logistic recalibration and other methods
Logistic recalibration, proposed by Cox in 1958, is the most prominent method of recalibration.
9
Under logistic recalibration,
More recently, more flexible methods of recalibration have been proposed.10–14 The greater flexibility of such methods raises the possibility of overfitting. Some alternative methods are not guaranteed to produce a monotone transformation of the original risk score. We consider that a nonmonotone transformation fundamentally changes a risk model and should not strictly be considered a recalibration of the risk model. Some flexible methods of recalibration have been seen to perform poorly for risk models constructed using logistic regression. 15 Although not a presented as a method of recalibration per se, the risk-mapping plot developed under the relative utility framework has potential to produce a recalibrated risk marker through similarly flexible methods, with requirements that ensure monotonicity. 16 The goal of the approaches proposed in this article is to retain the parsimony of Cox’s logistic recalibration while prioritizing calibration near the clinically important risk threshold.
Clinical utility of risk models for treatment decisions based on risk
The clinical utility of a risk model refers to the usefulness of a risk model for its intended clinical application. The standardized net benefit (

where
A key assumption is that the risk threshold
We note that we use the “opt-in” formulation of
Calibration of a risk model and its clinical utility
Van Calster and Vickers
25
give examples using simulated data in which miscalibration reduces the clinical utility of risk-based treatment policies. As the authors note, these results are expected because net benefit is a proper scoring rule.
26
Baker et al.
27
established the connection between the calibration of a risk model, the slope of its receiver-operating characteristic (ROC) curve, and the prevalence,
Graphically Assessing Potential Net Benefit under Recalibration
Before presenting our methods, we introduce a graphical tool to help researchers assess the potential for recalibration to improve the clinical utility of a risk model. Recalibration preserves the rank order of risk scores, meaning that under recalibration, some subset of individuals with similar predicted risks will move from below the risk threshold to above the risk threshold, or vice versa. Given fixed

on the vertical axis against
Figure 1 shows 2 examples. In Figure 1, the horizontal axis gives all possible cutpoints, and the vertical axis gives
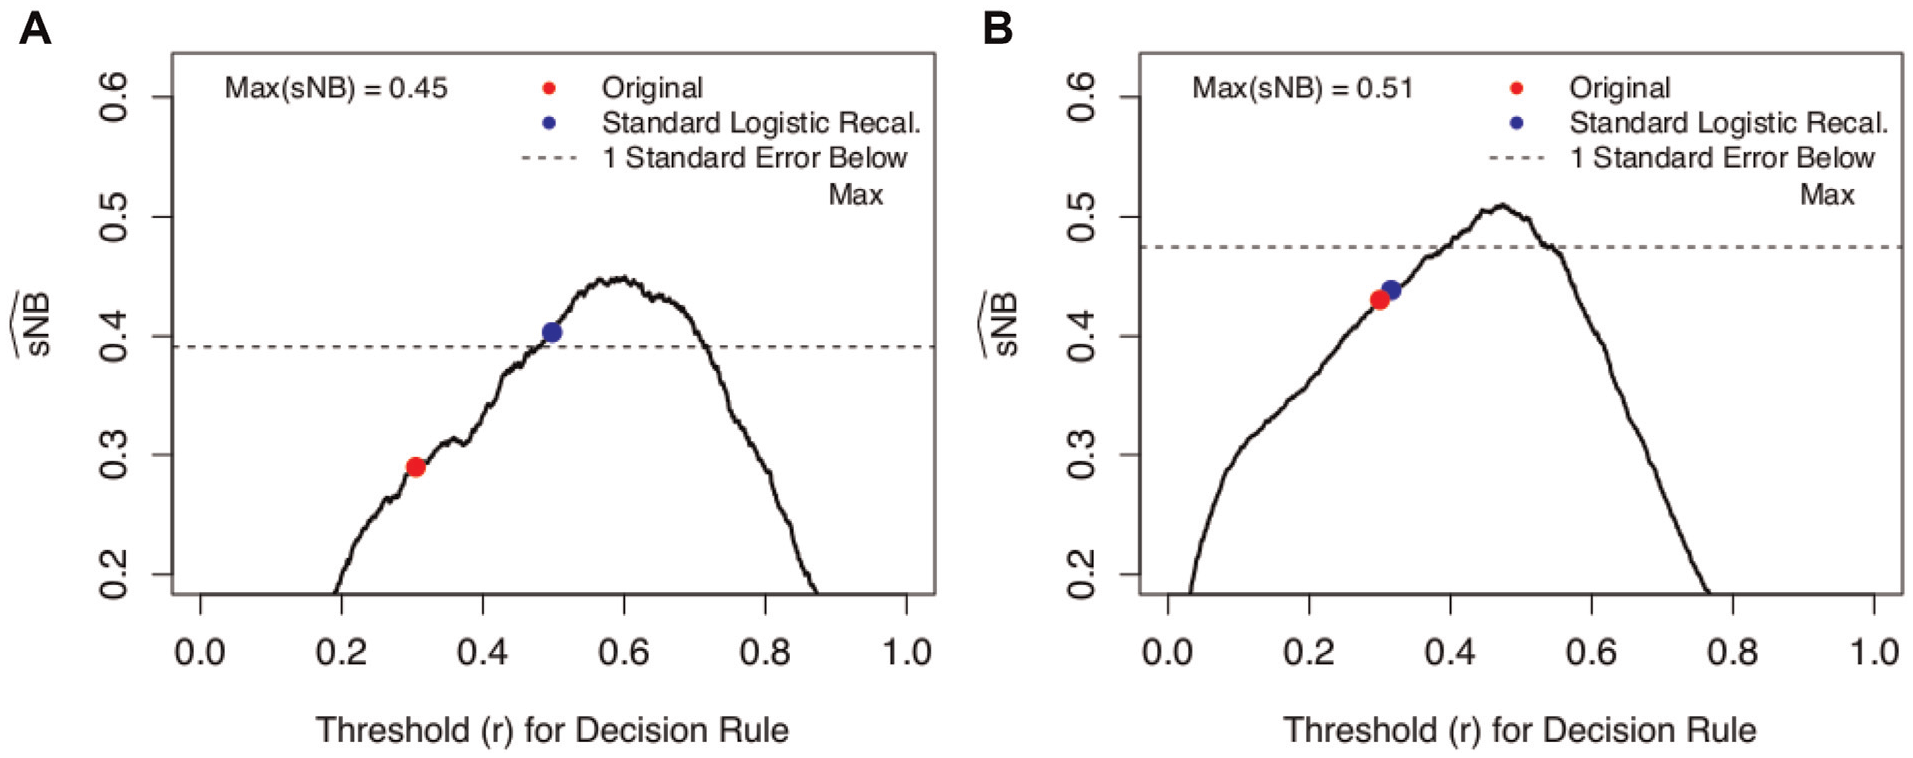
Potential
In light of sampling variability, it may be unclear whether a risk model is “close” to the maximum. Following Friedman et al.,
29
we suggest a “1-standard error” rule to decide if the estimated
In both Figures 1A and 1B, the original risk model has notably lower
Weighted Logistic Recalibration for Improved Clinical Utility
We propose a weighted variant of Cox’s logistic recalibration to prioritize calibration near the risk threshold, which corollary 1 implies should maximize
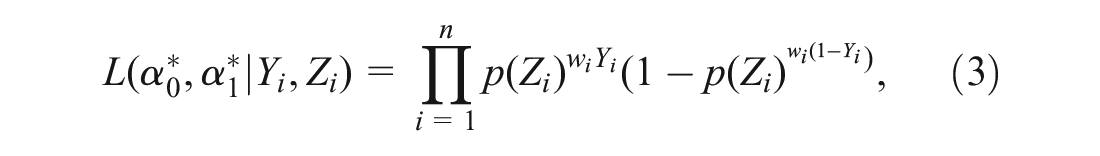
where
where
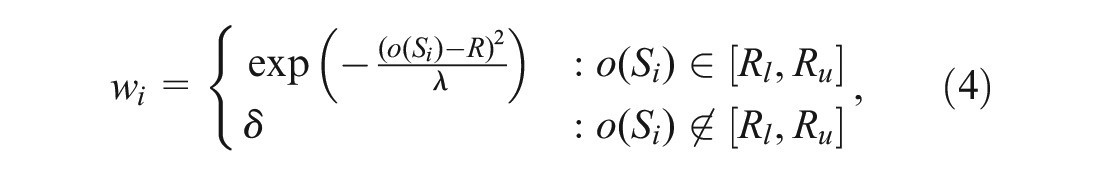
The weight function (4) encompasses 2 useful forms. The first has the form of an exponential decay weight (Figure 2A). Under this weighting scheme, observations with event rates at or near the risk threshold have the largest contribution to the likelihood, which decays exponentially moving away from
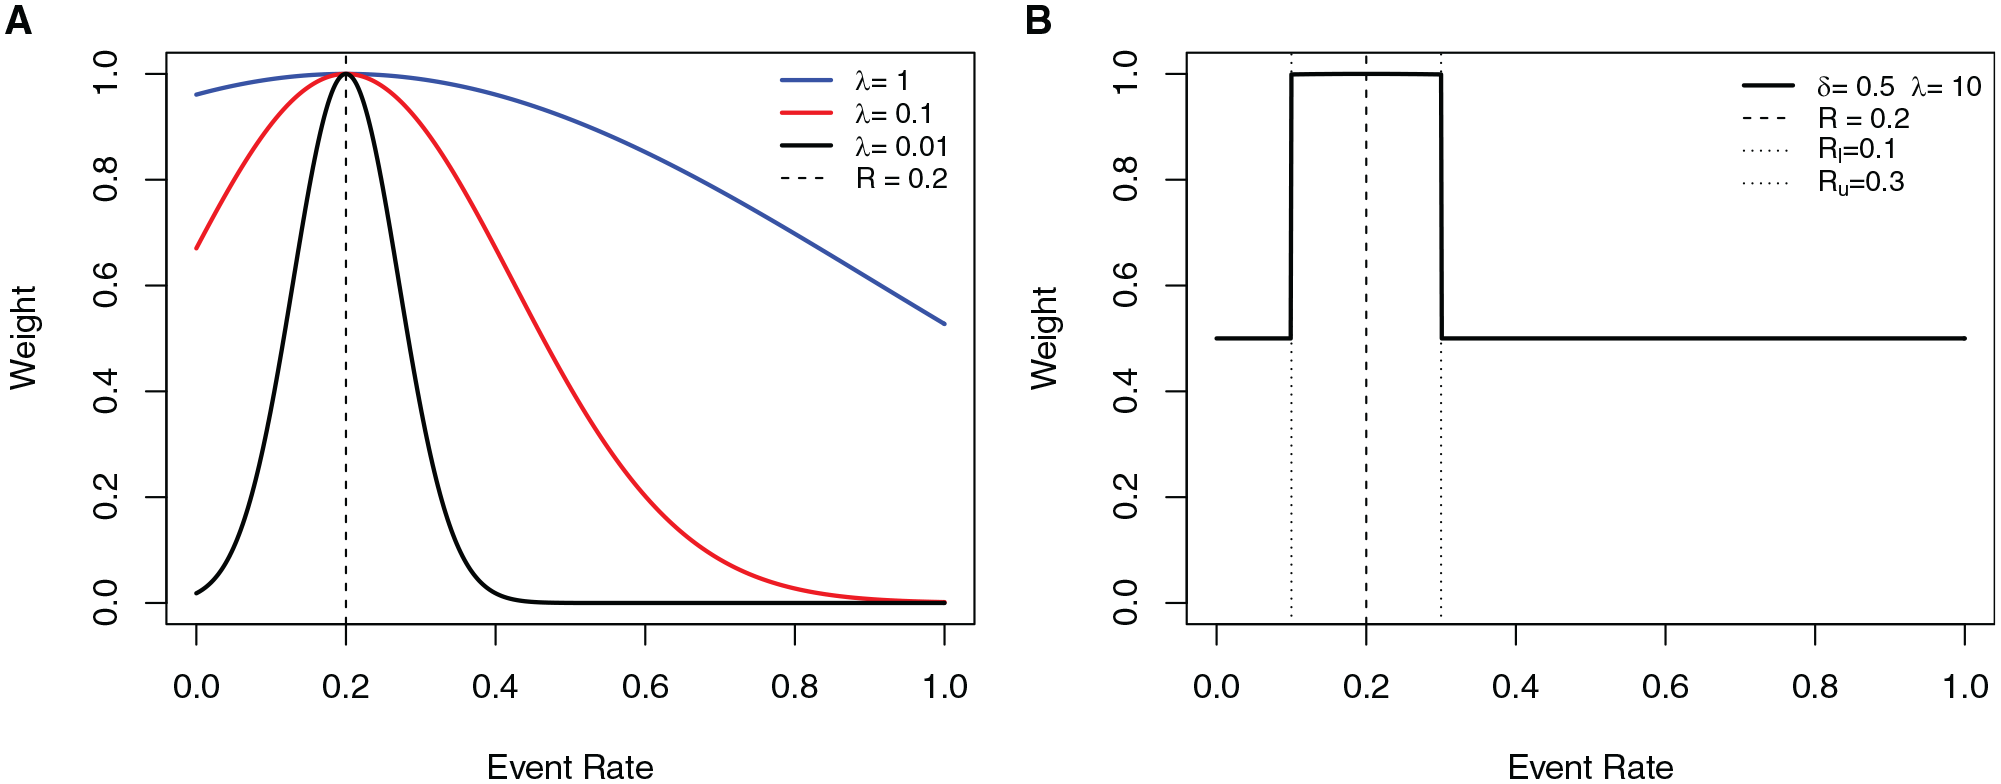
Example of weight functions used in the weighting scheme. The horizontal axis shows the event rate, and the vertical axis gives the weight. (A) Exponential decay weight with
These weighting schemes down-weight, to a greater or lesser degree, observations with smoothed event rate (
Constrained Logistic Recalibration
In our second approach to recalibration, we propose estimating the recalibration intercept and slope by maximizing the logistic likelihood over a restricted parameter space. The restricted space only includes recalibration parameters
Given a risk score
where
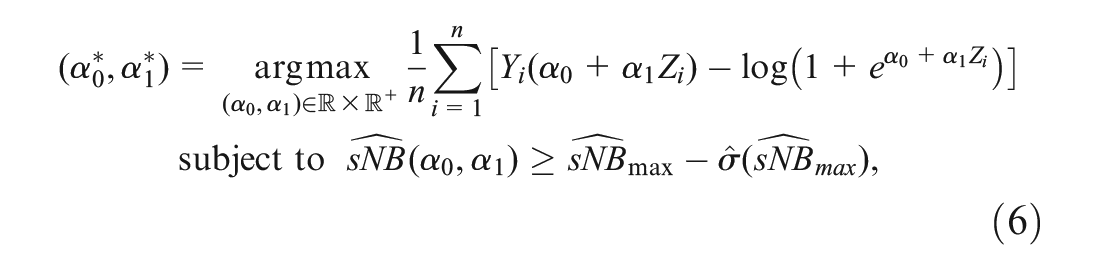
where

That is, we propose estimating

Acknowledging that there is uncertainty in
The constrained logistic recalibration solution differs from the standard logistic recalibration solution when the latter is outside the constrained parameter space. These are exactly the instances in which there is evidence that standard logistic recalibration is inadequate in terms of the clinical utility of the recalibrated risk model. In situations lacking such evidence, the constrained and standard logistic recalibration solutions will be the same.
Results
Simulation Results
In this section, we compare weighted and constrained logistic recalibration to standard logistic recalibration using simulated data. We present 4 different simulation examples representing different types of miscalibration. For all examples, we use the risk threshold
Recalibration parameters are estimated from data sets of size 500, 1000, 5000, and 10,000. We use a large independent validation data set of size
We simulate the data as follows. First, true risks (
We present 4 types of miscalibration: underestimation of risk scores near the risk threshold and overestimation elsewhere (example 1); underestimation of risks for all risk scores (example 2); overestimation of risk scores near the risk threshold and underestimation far from the risk threshold (example 3); and overestimation of risks for all risk scores (example 4). Table 1 shows the
Summary of Simulation Results a
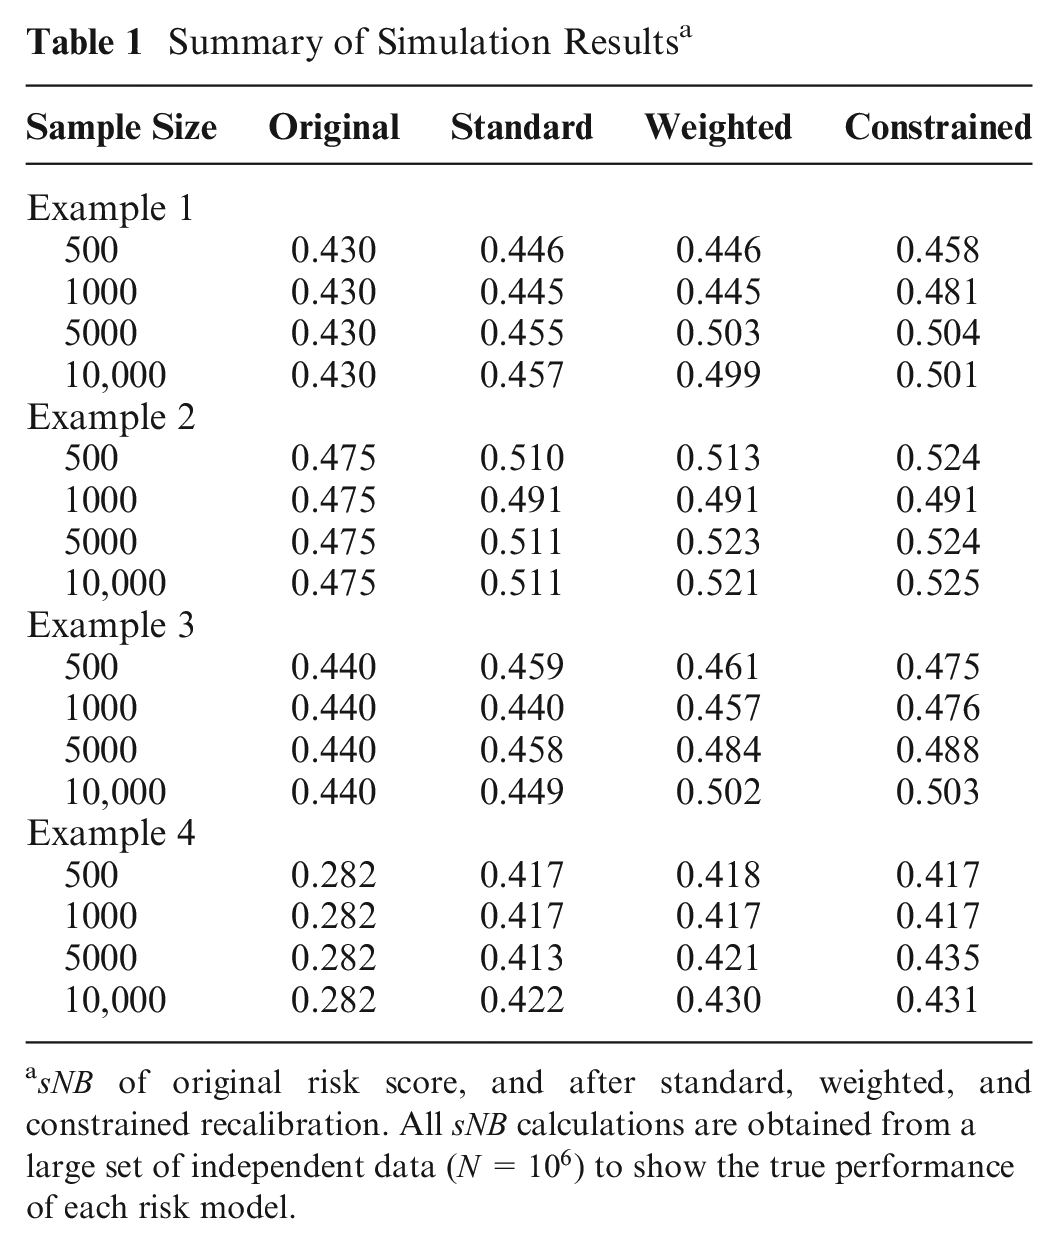
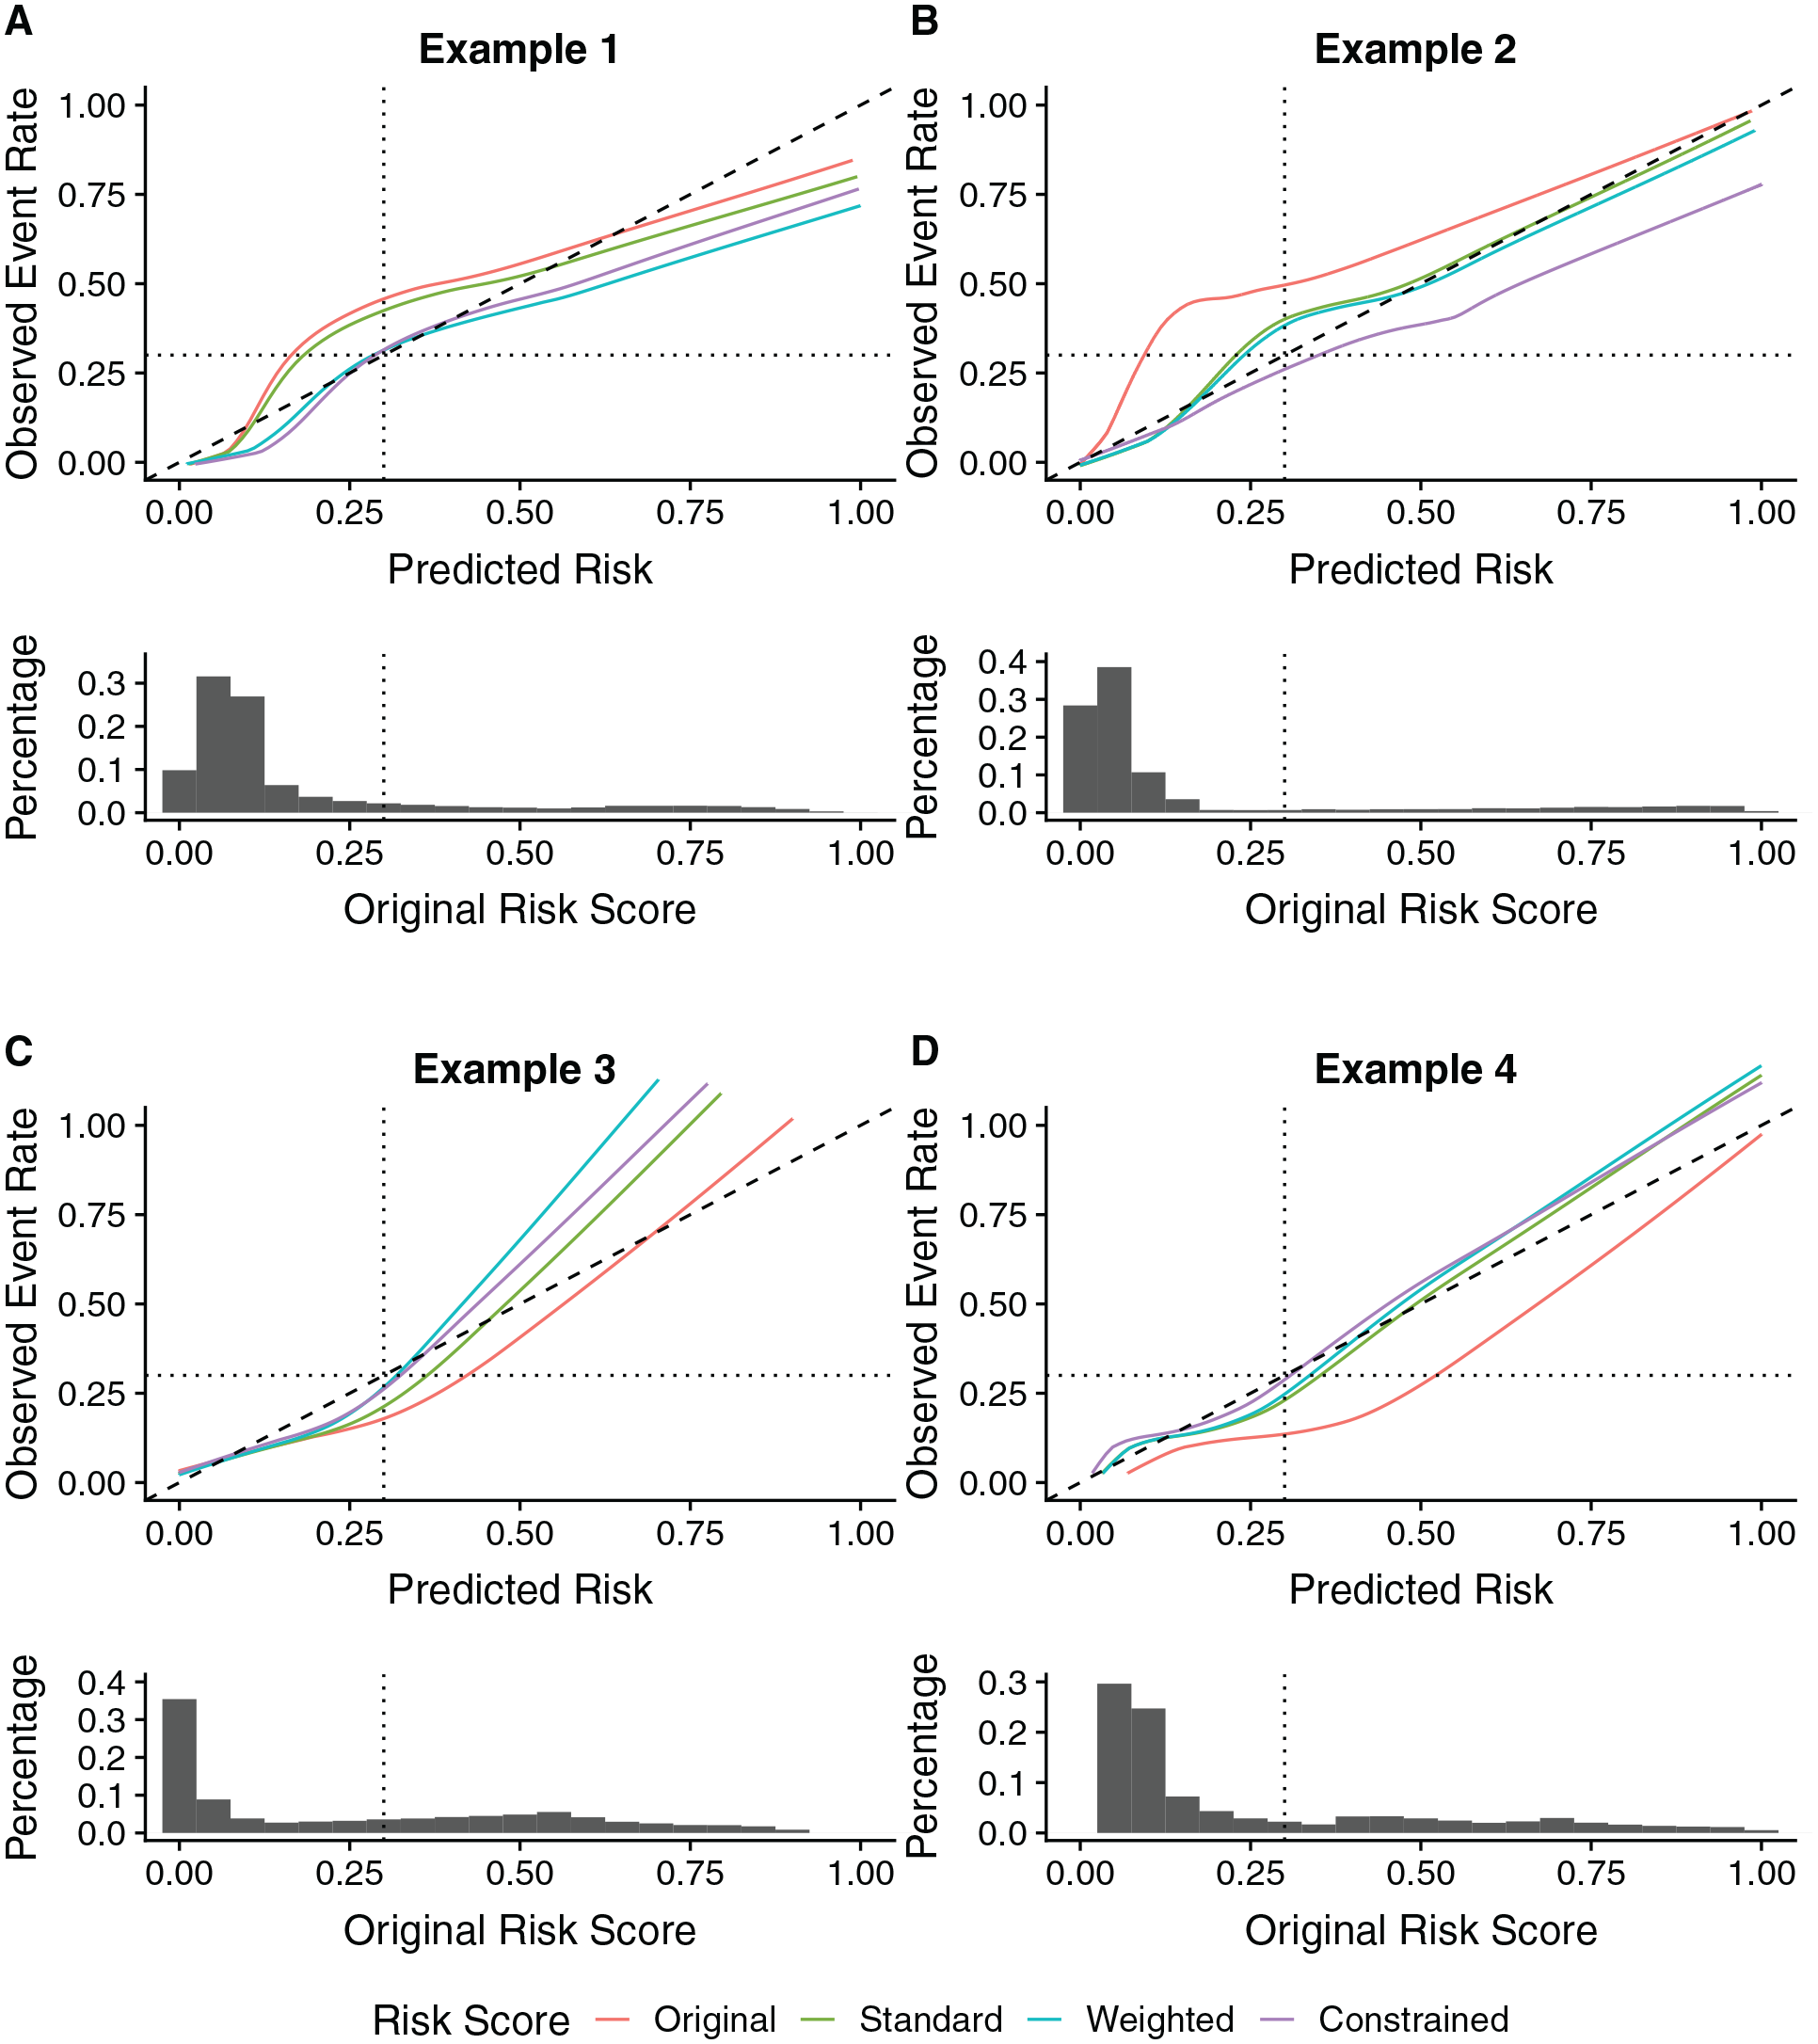
Calibration curves and the distributions of risk scores for examples 1 to 4 and sample size
In example 1, the original risk model underestimates risk at the risk threshold. The calibration curves in Figure 3A show good calibration at the risk threshold under the weighted and constrained approaches. In contrast, after standard recalibration, risks continue to be underestimated at the risk threshold. Weighted and constrained logistic recalibration increase
Next, we consider an example in which risks are underestimated across all predicted risks. The calibration curves shown in Figure 3B show slight improvement in calibration at the risk threshold for the weighted approach compared with standard logistic recalibration when
In this example, when the sample size is small, there are too little data near the risk threshold to support the weighted approach. Therefore, weighted recalibration approaches standard logistic recalibration. Similarly, when
In example 3 (Figure 3C), risks are overestimated at the risk threshold and underestimated for very high and low predicted risks. Both the weighted and constrained recalibration methods produce a recalibrated risk model with higher
Finally, in example 4, standard, weighted, and constrained logistic recalibration all have similar
Recalibration of the ACC-AHA-ASCVD Risk Model
MESA is a large, prospective, nationwide, multiethnic cohort study of cardiovascular disease (CVD) in men and women free of CVD at enrollment.
31
Demographic and clinical data were collected at baseline, and participants were monitored for more than 10 y for cardiovascular clinical events. Recalibrating the ACC-AHA-ASCVD risk model using the MESA cohort and prioritizing good calibration at the treatment threshold of 7.5% could improve the clinical utility of the risk tool for the population. Figure 4 shows the estimated potential
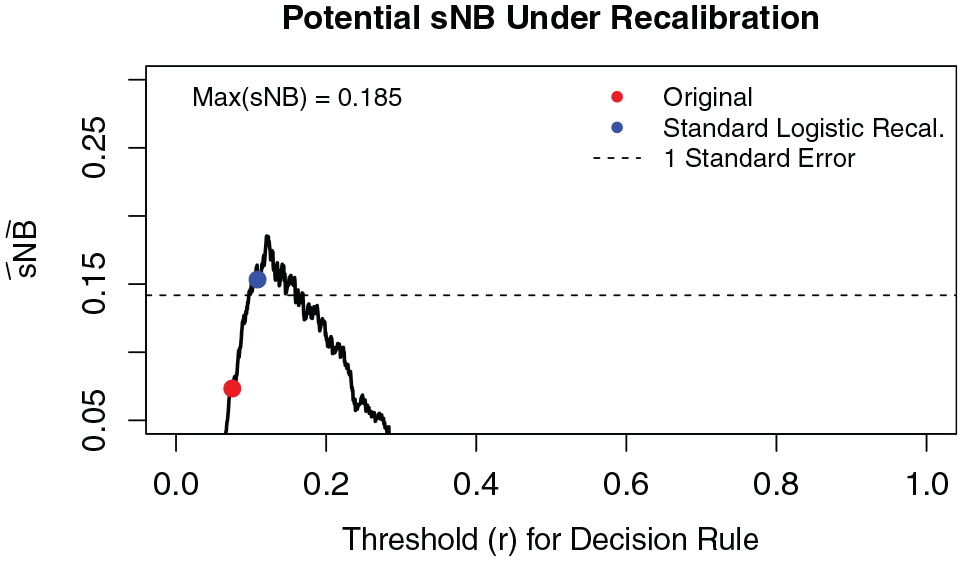
Potential gains in
MESA is an ethnically diverse cohort, and there is interest in evaluating and correcting miscalibration of the ACC-AHA-ASCVD risk score within different subgroups defined by sex and/or ethnicity.
2
Applying the graphical tool to different subgroups in MESA, we found potential for improvement for the Black male cohort (Figure 5). The 10-y event rate of CVD in Black men (within age range and low-density lipoprotein range, and diabetes free,
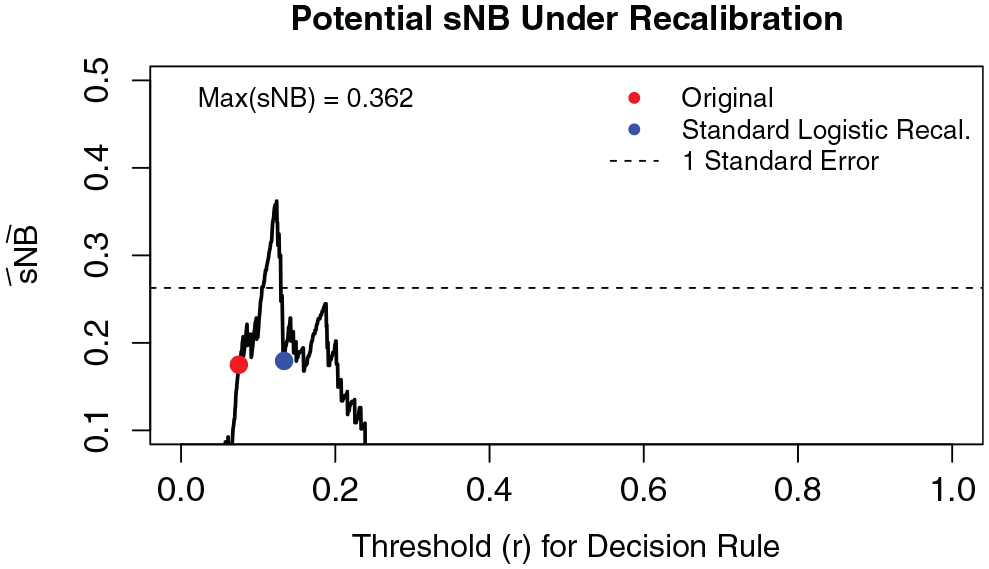
Potential gains in
We applied standard, weighted, and constrained logistic recalibration to the ACC-AHA-ASCVD risk score in the Black, male MESA cohort. Table 2 shows the estimated recalibration parameters
Comparison of Recalibration Methods in the MESA Black, Male Cohort for RAW = 0.01 a
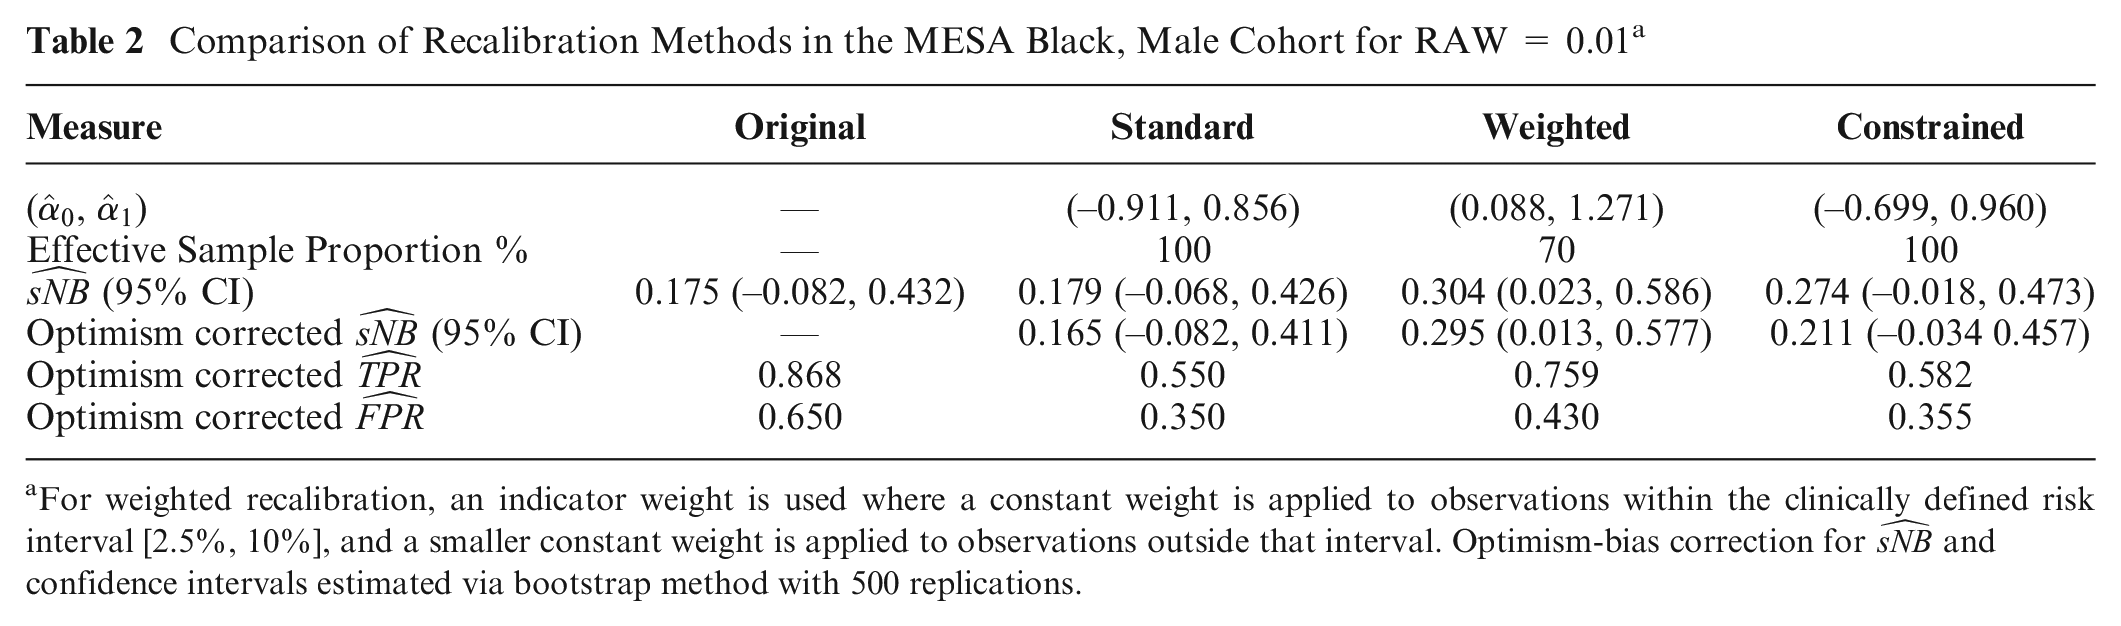
For weighted recalibration, an indicator weight is used where a constant weight is applied to observations within the clinically defined risk interval [2.5%, 10%], and a smaller constant weight is applied to observations outside that interval. Optimism-bias correction for
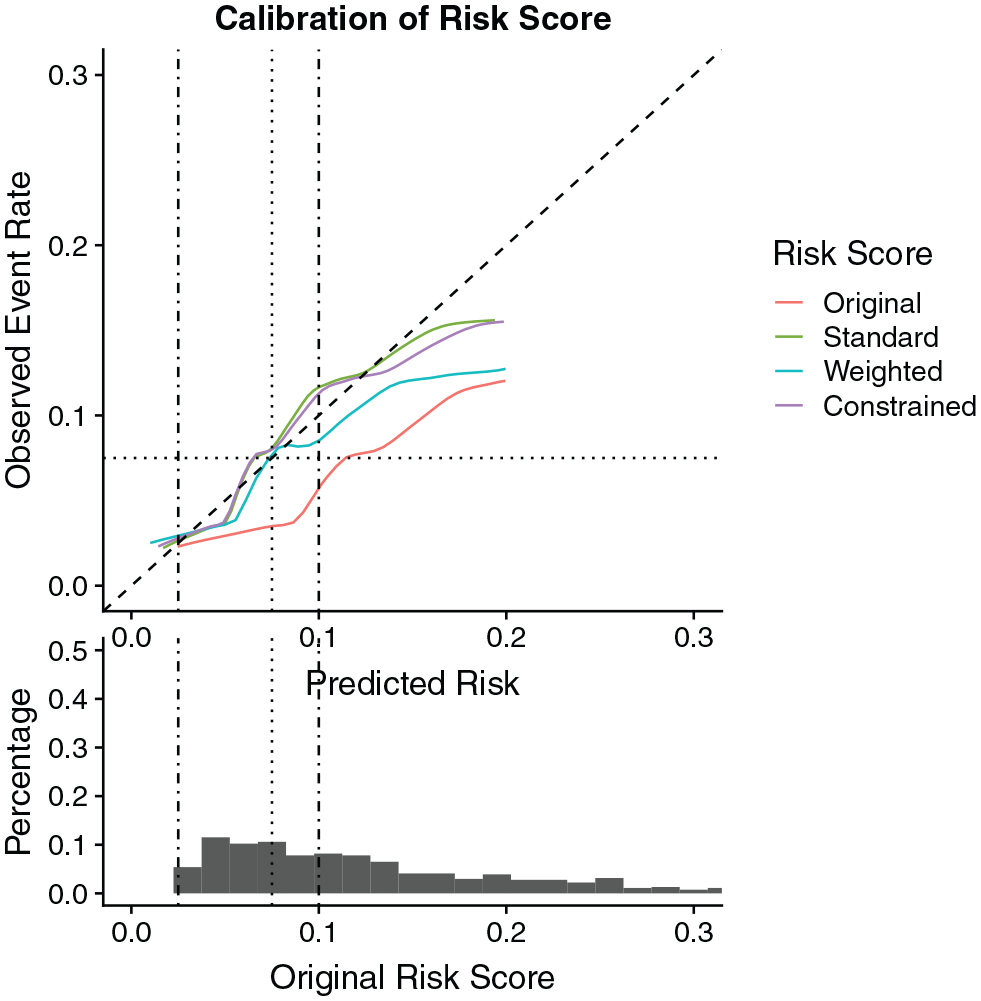
Calibration curves for the original risk score as well as standard, weighted, and constrained recalibrated risk score in the Multi-Ethnic Study of Atherosclerosis Black, male cohort.
We acknowledge wide confidence intervals in these results. The small sample size and resulting uncertainty make it difficult to draw definitive conclusions about improved clinical utility. However, despite the small sample size, both the graphical device and optimism-corrected estimates of
Discussion
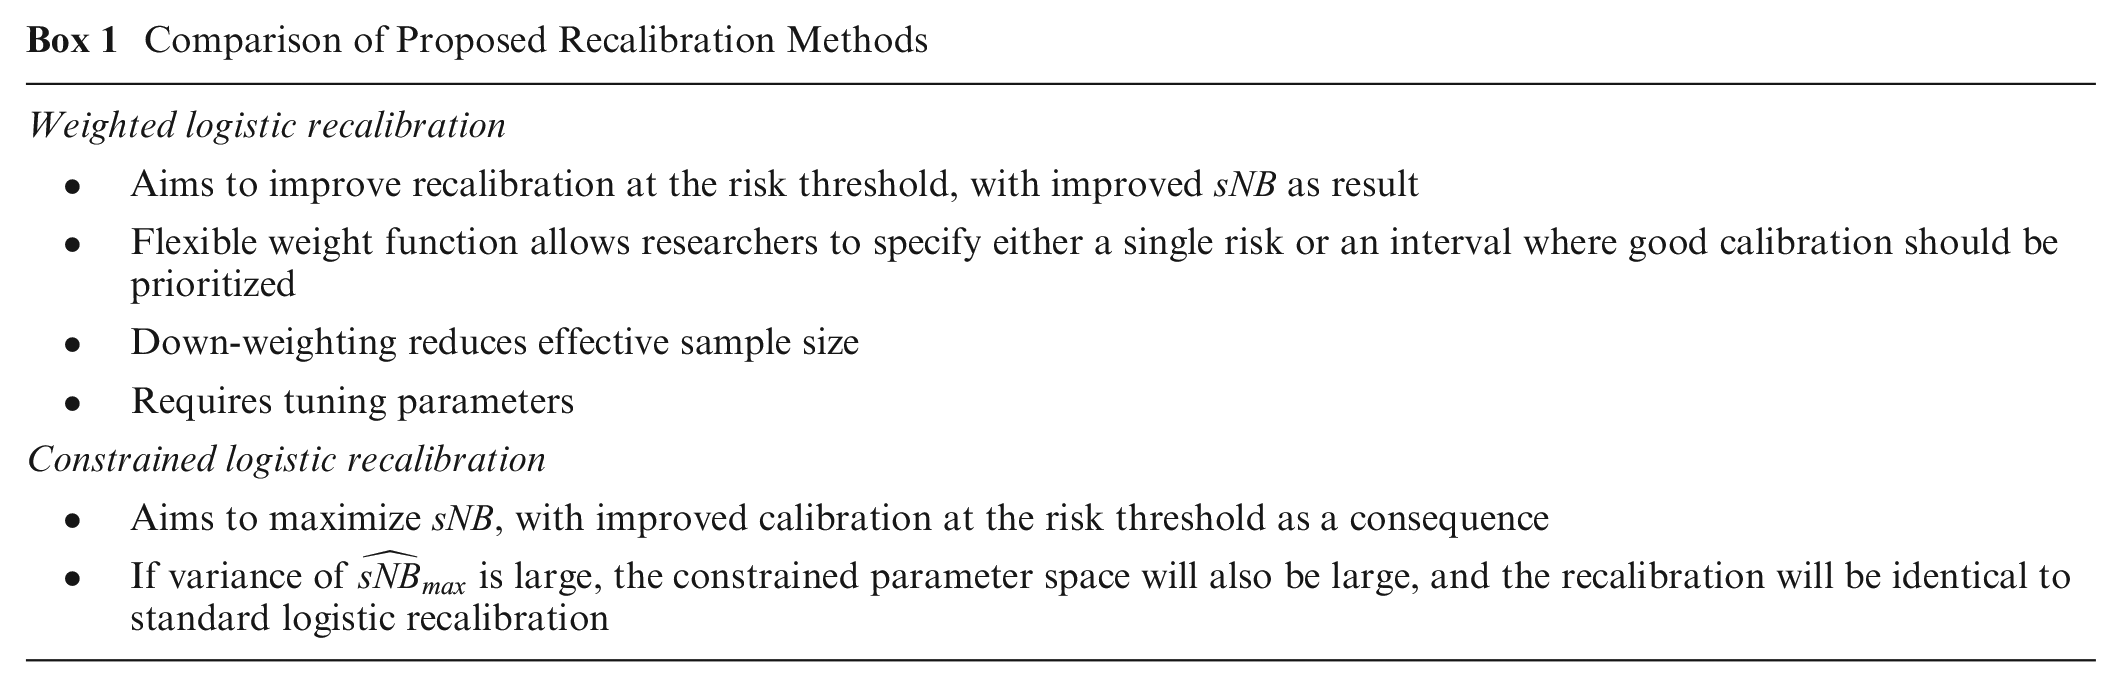
We presented methods for risk model recalibration that aim to optimize a risk model’s clinical utility for making risk-based decisions. Box 1 compares the 2 proposed methods, which are both generalizations of standard logistic recalibration. Moreover, both methods can be expected to approximate or reproduce standard logistic recalibration when it produces good calibration at the critical risk threshold. We consider this feature a strength of these approaches.
Comparison of Proposed Recalibration Methods
We additionally proposed a graphical device to help researchers assess the potential for recalibration to improve the clinical utility of a risk model. For a predefined risk model, we also provided methods to estimate its maximum possible net benefit and its variance. These results enable researchers to evaluate whether specialized methods of recalibration, such as the 2 we propose, are likely to be advantageous. Both methods and the graphical tools are in the R package ClinicalUtilityRecal. 32
As discussed, this work assumes all conditions required for net benefit metrics to be meaningful. We also emphasize that we do not think recalibration should be an automatic response to observing miscalibration. Miscalibration can indicate issues, such as measurement or population heterogeneity, that might be resolved in other ways. When possible, identifying the source of miscalibration can provide researchers with a better understanding of avenues for correction, as well as indications of complex changes in populations. Moreover, if there are adequate data to develop a new risk model, refitting may be preferred over recalibration. Other work has compared standard logistic recalibration to refitting methods.33–35 However, even when refitting is possible, investigators might prefer recalibration to maintain a connection with the original model. In this article, we presume a context in which investigators have decided that recalibration is their best course of action.
Standard logistic recalibration is a parsimonious method to address miscalibration. In settings where the miscalibration pattern at the risk threshold is similar to the pattern for the bulk of the data (e.g., systematic under- or overestimation) or settings where there is under- or overfitting, standard logistic recalibration may adequately improve calibration at the risk threshold. In settings where standard logistic recalibration does not adequately correct miscalibration at the risk threshold, alternative recalibration methods are useful to ensure risk-guided clinical decisions are made appropriately. However, it may be unappealing to use methods that increase the number of recalibration parameters estimated, particularly if this leads to overfitting. Our methods leverage the parsimony of standard logistic recalibration while allowing researchers to focus on the regions where good calibration matters most. Furthermore, we note that our methods could naturally be applied with other families of recalibration functions, such as the 3-parameter family proposed by Kull et al. 36 The methods we propose are not intrinsically tied to the logistic recalibration family.
Statistical software may return elements of statistical inference (standard errors, confidence intervals, P values) when estimating the recalibration intercept and slope. These elements might be useful when the model is fit to detect miscalibration, but we do not find them to be useful for the actual process of recalibration. Instead, there are 2 instances in which elements of statistical inference play a key role in our proposed methods. First, we propose a 1-standard-error rule for assessing the potential for recalibration to improve clinical utility using our proposed graphical device. Second, we suggest that investigators use a 1-standard-error rule when implementing constrained logistic recalibration.
Weighted logistic recalibration requires tuning parameters to specify the weighting scheme. We envision using the weighting scheme in 1 of 2 special forms, each requiring a single tuning parameter. The computational burden of cross-validation is a disadvantage of the weighted method. When there are few events, heavy down-weighting may be undesirable. In these instances, the cross-validation procedure paired with a 1-standard-error rule will indicate that the data do not support the weighted approach, and weighted logistic recalibration will approximate standard logistic recalibration. In general, we recommend reporting the effective sample proportion to gauge the impact of weighting.
As risk prediction becomes more ubiquitous with the increase in both data availability and more sophisticated prediction methods, opportunities to observe miscalibration are also more common. A recent article describes and classifies reasons for “data set drift” and implications for the performance of artificial intelligence systems. 5 A risk model’s miscalibration has been called “clinically harmful” if it reduces the net benefit of using the risk model below that of the uniform treatment policies (treat all and treat none). 25 However, Kerr et al. 37 give an example in which the net benefit of a miscalibrated risk model is higher than both uniform treatment policies, but addressing the miscalibration could substantially improve the model’s net benefit to the relevant population. This is a situation in which we consider miscalibration to be clinically harmful. It is important to assess calibration even if a risk model outperforms treat-all and treat-none rules. Investigators should consider recalibrating a risk model whenever there is evidence that its clinical utility could be meaningfully improved.
Supplemental Material
sj-pdf-1-mdm-10.1177_0272989X211044697 – Supplemental material for Recalibration Methods for Improved Clinical Utility of Risk Scores
Supplemental material, sj-pdf-1-mdm-10.1177_0272989X211044697 for Recalibration Methods for Improved Clinical Utility of Risk Scores by Anu Mishra, Robyn L. McClelland, Lurdes Y. T. Inoue and Kathleen F. Kerr in Medical Decision Making
Footnotes
Acknowledgements
The authors declared no potential conflicts of interest with respect to the research, authorship, and/or publication of this article.
The authors disclosed receipt of the following financial support for the research, authorship, and/or publication of this article: The research was supported by National Institutes of Health grant R01HL085757 to fund the Transnational Research Investigating Biomarker Endpoints in AKI (TRIBE-AKI) Consortium (KFK). Additional support is provided by contracts HHSN268201500003I, N01-HC-95159, N01-HC-95160, N01-HC-95161,N01-HC-95162, N01-HC-95163, N01-HC-95164, N01-HC-95165, N01-HC-95166, N01-HC-95167,N01-HC-95168, and N01-HC-95169 from the National Heart, Lung, and Blood Institute and by grants UL1-TR-000040, UL1-TR-001079, and UL1-TR-001420 from the National Center for Advancing Translational Sciences (NCATS). The funding agreement ensured the authors’ independence in designing the study, interpreting the data, writing, and publishing the report.
References
Supplementary Material
Please find the following supplemental material available below.
For Open Access articles published under a Creative Commons License, all supplemental material carries the same license as the article it is associated with.
For non-Open Access articles published, all supplemental material carries a non-exclusive license, and permission requests for re-use of supplemental material or any part of supplemental material shall be sent directly to the copyright owner as specified in the copyright notice associated with the article.