
Abstract
This study estimated the distribution of willingness to accept (WTA) for a physical activity behavior change intervention entailing the completion of 10,000 steps/day to shed light on which levels of incentives trigger a change in behavior for different proportions of the population and for more at-risk subgroups. An online contingent valuation (CV) survey was administered to 1130 respondents in the Basque Autonomous Community, Spain. The survey queried respondents about their physical activity levels and intention to engage in physical activity before presenting the WTA questions. Nonparametric WTA values were estimated for the whole sample and for subsamples of active, inactive, and overweight and obese people. One-quarter of respondents would engage with the hypothetical program even without payment, but if a monetary incentive was offered them, they would take it. The median WTA for committing to complete 10,000 steps/day is €0.23 for the full sample, €0.21 for active, €0.25 for inactive, and €0.23 for overweight and obese people. The WTA at 75th percentile is €4 for the full sample, €1.70 for active, €10.80 for inactive, and €5 for overweight and obese respondents. WTA is positively affected by a person’s lack of disposable time to increase their physical activity and, for inactive people, by their poor intention to become physically active.
Keywords
There is growing interest in the use of financial incentives to promote health behavior change.1–5 Several randomized controlled trials (RCTs) have shown that offering financial rewards for reaching activity goals can be an effective strategy for encouraging greater activity.6–12 A recent systematic review and meta-analysis determined that modest financial incentives ($1.40/day) increased physical activity in the short and long term and continued to do so after incentives were removed. 13
Assessing the level of a financial incentive to increase individuals’ physical activity requires researchers to estimate people’s monetary value for giving up part of their disposable time to engage in additional physical exercise. As there is no market where people can trade off an increase in physical activity with money, nonmarket valuation techniques can be used to estimate the required incentives.14,15
Contingent valuation (CV) is a survey-based nonmarket valuation technique, based on stated preferences, which has been extensively used to estimate the monetary value of health care services and public health programs.16–25 The CV method asks people to state their willingness to pay (WTP) to obtain a good or service not owned by respondents or their willingness to accept (WTA) to give up a good or service owned by respondents. 26 Therefore, WTA is the preferred framework to estimate the monetary value of a hypothetical program that aims at persuading individuals to use more of their disposable time to increase their physical activity.
Once the CV data have been collected, the next step is to provide the summary statistics to guide policy making. WTP studies usually report the mean and the median WTP, as the median is the value at which a public program would be funded under a referendum, affecting the whole population. With WTA studies, providing guidance on the outcome of the analysis is more complex. Estimating the median WTA to trigger a behavior change would provide information to policy makers on the value that would lead to the desired behavior for only half of the population. Hence, it is important to present policy makers with the distribution of WTA and to examine which monetary values would lead to a change in behavior in which percentiles of the sample and in which groups of society. Previous studies have shed some light on the efficacy of financial incentives for behavior change,6,11,12,27 but none of these studies has explored the distribution.
The aim of this study is to use CV to provide evidence on the distribution of WTA for a behavior change initiative in an adult sample representative of the population of the Basque Autonomous Community (BAC), Spain. We focus on an initiative to stimulate people to achieve higher levels of walking and explore the distribution of WTA for the whole sample, as well as for different high-risk groups—overweight, obese, inactive people. We also explore the internal validity of our WTA data28,29 (e.g., we check that WTA depends on income in the ways predicted by economic theory and investigate the determinants of WTA heterogeneity).
Methods
A CV questionnaire was developed to assess the WTA for doing 10,000 steps a day in the BAC. The questionnaire was administered online to a sample of 1,130 respondents aged 18 years or older in the BAC. The data were collected by the market research company Netquest. This company was chosen because at the time of the survey, July to August 2018, with more than 120,000 panelists, it had access to the largest pool of online respondents in Spain and had agreed to set quotas on completed interviews for age and gender to approximate the Basque census demographics. Netquest was also chosen because of their incentive compatible mechanism to reward panelists. Survey respondents were rewarded for completing questionnaires with “points,” redeemable with gift vouchers, with the amount of points increasing exponentially with the length of the survey to keep respondents’ motivation and engagement.
Before the CV questions, respondents were queried about their physical activity, including whether they met or intended to meet the World Health Organization’s (WHO’s) recommended guidelines for physical activity. After the payment questions, a debriefing question asked respondents what motivated their answers to the financial incentives questions to assess the quality of the answers to the CV questions, as suggested by the NOAA Panel on Contingent Valuation, 30 and to explore the importance of the availability of time for an increase in physical activity.
The Contingent Valuation Questions
We followed recent guidelines on stated preference methods 31 and used the double-bounded CV (DBCV) questions format.32–34 The DBCV, initially developed by Carson et al., 35 consists of asking subjects to answer “yes” or “no” to doing the 10,000 steps at an initial bid price; different respondents are offered different bid prices. If the individuals answer “yes,” they are asked a follow-up question offering a lower bid price. If they answered “no,” the follow-up question offers a higher bid price. The DBCV mechanism collects 2 observations from each respondent36–38 and, therefore, improves the statistical efficiency of the estimates of mean and median WTA compared with the single-bounded mechanism, which would ask only 1 CV question.
We asked respondents their WTA for a public program that would offer a financial incentive for people to achieve 10,000 steps a day. This goal was selected primarily as the 10,000 steps message has been used in tailored intervention efforts aimed at promoting physical activity.6,39–43 The 10,000 steps goal has many advantages, in that it is easy to remember and provides individuals with a concrete goal for increasing physical activity levels. The hypothetical scenario read as follows: To encourage more people to become physically active, as well as reducing traffic congestion, imagine that the government introduced a Fitness Payment Scheme which paid you for each day you walked 10,000 steps. The government would monitor your steps using a mobile phone pedometer app. The money would be added to your mobile phone credit and can be used for paying your bills.
As DBCV questions may lead to strategic behavior from respondents if they are not fully informed in advance of the number of CV questions,
44
we informed respondents that there would be 2 dichotomous choice questions with different bid prices. This approach has shown to eliminate the single-bounded/double-bounded anomaly in WTP studies,
44
which refers to considerably higher WTP estimates produced by a single-bounded analysis compared to the double-bounded analysis. Moreover, to reduce hypothetical bias, we adapted the recommendations of Cummings and Taylor
45
on “Cheap Talk” design for the CV method by reminding respondents not of their budget constraint but of their time constraint, as it is more relevant to our scenario. Therefore, the hypothetical scenario continued as follows: We will ask about a higher and a lower amount for doing 10,000 steps per day. Please answer truthfully and treat each question independently. Before answering, consider the effort and time it takes to do 10,000 steps each day and the payment you would receive if you did 10,000 steps each day. Would you be willing to do 10,000 steps every day if the reward for doing it was €x?
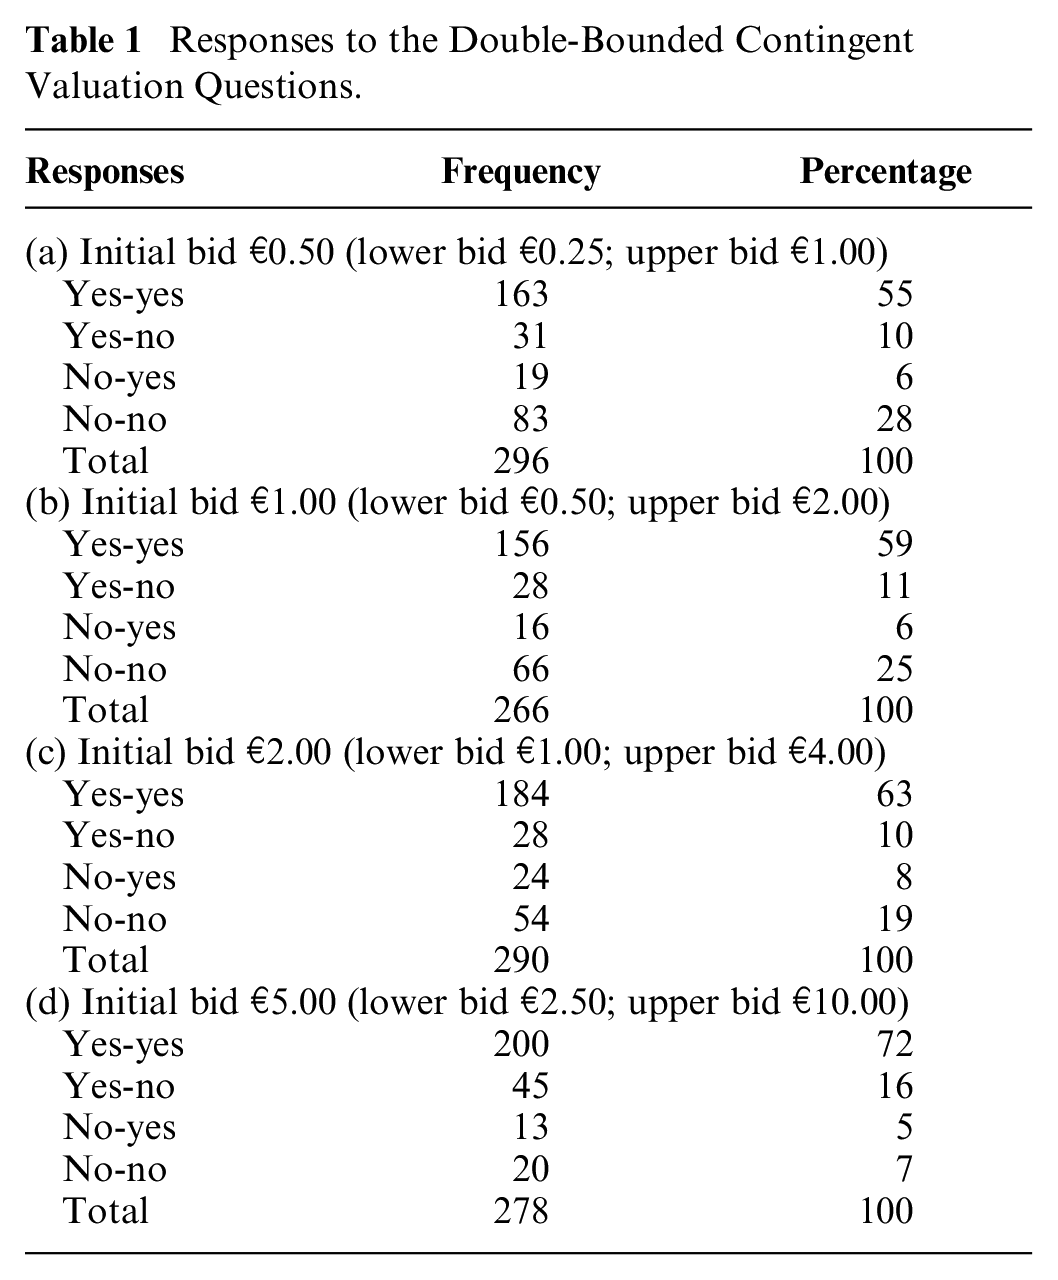
Respondents were randomly allocated to 1 of 4 versions—(a), (b), (c) and (d)—with different initial bid and follow-up values. As shown in Table 1, the initial bid values were €0.50, €1.00, €2.00, and €5.00. If a respondent answered “yes” (“no”) to the initial WTA question, a lower (higher) amount was then offered in the follow-up WTA question. The follow-up bids were €0.25, €0.50, €1.00, and €2.50 following an initial “yes” answer and €1.00, €2.00, €4.00, and €10.00 following an initial “no” answer to the first WTA question. For each version of the questionnaire, the answers to the DBCV questions inform the analyst that a respondent’s WTA falls within 1 of 4 bid intervals, considering the 4 possible sequence of answers: “yes-yes,”“yes-no,”“no-yes,” and “no-no,” as shown in Table 1. For example, if a respondent was allocated to version (a) and answered “yes” to €0.50 and “no” to €0.25, the researcher would conclude that her WTA would fall within the €0.25 to €0.50 interval.
Responses to the Double-Bounded Contingent Valuation Questions.
The bid amounts were selected based on focus groups and on similar studies that offered daily financial rewards to respondents for behavior change initiatives.46,47 The DBCV questions were followed by an open-ended CV question, which simply asked how much the respondent would need to be paid to walk 10,000 steps per day; the open-ended question was designed to produce more statistically efficient WTA data compared to the DBCV questions. 48 The usefulness of open-ended data may be limited if they are affected by starting point bias, 49 that is, if the initial bid value offered in the DBCV questions biases the open-ended CV data. An English translation of the questionnaire is available as supplemental material.
Analysis of the Contingent Valuation Questions
The WTA answers were analyzed using a nonparametric estimator, adapting the Turnbull lower bound estimator 50 for DBCV WTP questions 51 to WTA questions. The Turnbull estimator calculates, for each bid interval j, the proportion of respondents whose WTP falls within that interval. The mean WTP is then calculated by multiplying this proportion of respondents by the lower bound of the interval and summing over all intervals. The Turnbull estimator assumes that CDFj < CDFj+1, which means that the proportion of “yes” answers for any bid interval j decreases with an increase in the bid value. However, with random sampling, practitioners often observe nonmonotonic distribution functions. If this monotonicity is violated for the intervals j and j+1, the Turnbull estimator pools forward the observations of j with j+1 and calculates CDFj*, which is equal to the sum of the number of “yes” for the intervals j and j+1, divided by the number of people who were asked to pay the bids included in the intervals j and j+1.
To apply the Turnbull estimator to WTA answers, we calculated mean WTA by first calculating the proportion of respondents whose WTA fell within each interval and multiplied it by the upper bound of that interval and summing over all intervals. For respondents who answered “yes” (“no”) to the first amount and “no” (“yes”) to the second lower (higher) follow-up amount offered, we assumed that their WTA fell within those 2 bids. For respondents who answered “yes” to the first amount and “yes” to the lower follow-up amount offered, we assumed that the lower bound of the WTA interval was zero. For respondents answering “no” to the first WTA question and “no” to the second higher WTA question, we assumed that the upper bound was equal to €20. This is the value that we assume drives the probability of acceptance to 1. While arbitrarily setting the upper limit of the distribution affects the mean WTA estimate, it does not have an impact on the percentile estimates of the distribution, as long as the bid vector captures well the distribution of WTA. This is an empirical issue that we addressed following standard practice in CV studies by first collecting and analyzing 10% of the sample data to explore whether the bid vector needed to be updated.29,33,34,36 Similar to the Turnbull estimator for DBCV WTP, the WTA estimator assumes the monotonicity in the cumulative distribution function (CDF) values: as the bid levels increase, the proportion of “yes” is assumed to increase. When the monotonicity between 2 adjacent intervals is violated, the observations from the 2 intervals are pooled forward until the monotonicity assumption holds.
Percentile estimates—25th percentile, median, and 75th percentile—on the distribution were calculated following Vaughan et al. 52 through linear interpolation between the bids attached to the cumulative frequencies (CDF values) above and below the interested percentile. The median was calculated as follows: median = a+k(a,b) * (b – a), where a and b are the lower and upper bound, respectively, of the interval containing the median, and k approximates where the 50% point lies inside the CDF values at the lower and upper bounds. For the median, k is equal to (0.5 – CDF a )/(CDF b – CDF a ), where CDF a and CDF b are the proportions of respondents whose WTA values are smaller than or equal to a and b, respectively. Suppose the median WTA falls within an interval of €1 and €2, the proportion of individuals whose WTA is smaller than or equal to €1 is 0.25, and the proportion of individuals with WTA smaller than or equal to €2 is 0.55, the median WTA is equal to 1 + ((0.5 – 0.25)/(0.55 – 0.25)) * (2 – 1) = €1.83.
To explore the distribution of WTA in groups most at risk, we estimated first quartiles, medians, and third quartiles for different subsamples of respondents—overweight and obese, active, inactive, and inactive overweight and obese people. We then used Mood’s median test to test the null hypothesis that the medians of the 2 subsamples for active and inactive respondents are identical. In this test, first, the median for the full sample with all the observations from the 2 groups was computed. Next, for each subsample, each observation was allocated to 1 of 2 groups, considering whether they were above or below the full sample median. A Pearson chi-squared test was then used to determine whether the observed frequencies in each subsample differed from the expected frequencies derived from the distribution combining the 2 groups.
Results
Descriptive Statistics
The survey yielded a representative random sample of 1,366 respondents, with a response rate of 91%. To deal with potentially disengaged or inattentive participants, we excluded responses from “speeders,” classified as respondents who took less than 6 minutes to complete the survey, and responses with missing observations. Following these criteria, 1,130 responses were retained and used in the study, representing a response rate of 75%. Descriptive statistics for our survey compare to official statistics53,54 reported in parentheses as follows: percentage of males is 56% (49%), average age is 43.14 (41.29) years, the unemployment rate is 12% (7%), the percentage of respondents with secondary or above level of education is 50% (51%), and personal monthly income is between €1,500 and €2,499 (€1,664).
More than half of our sample (56%) reported meeting the WHO’s recommended guidelines for combined moderate and vigorous-intensity physical activity of at least 150 minutes each week, with the remaining 44% classed as inactive. These 2 groups are quite heterogeneous. Among the active respondents, 497 have met the WHO’s guidelines for physical activity for more than 6 months and only 136 for less than 6 months. Among the inactive respondents, 187 expected to meet the WHO’s guidelines for physical activity within the next 30 days, 195 within the next 6 months, and the remaining 115 had no intention of meeting the WHO’s targets. Participants’ self-reported body mass index (BMI) was classified according to the clinical guidelines for overweight and obesity in adults by the WHO. 55 Half of our sample comprised overweight (35%) and obese respondents (15%), with 47% being normal weight and the remaining 3% being underweight. These figures compare well with official statistics for the BAC that report that 14% of men and 11% of women are obese and 47% of men and 30% of women are overweight. 56
Willingness to Accept
The open-ended WTA analysis showed evidence of starting point bias (i.e., the initial bid offered in the DBCV questions affected respondents’ open-ended WTA values), suggesting that the analysis of the DBCV data is preferable to the open-ended data analysis, which is reported in the supplemental material.
Table 1 reports the percentages of answers in the 4 bid intervals—“yes-yes,”“yes-no,”“no-yes,” and “no-no”—for each of the 4 initial bid prices. Our WTA data conform well with economic theory: people’s willingness to join the walking program increases (decreases) with an increase (decrease) in the value of the monetary reward offered. 50 Our bid vector captures well the upper part of the WTA distribution, with only 7% of respondents offered the €5 initial bid having a WTA higher than €10. We do find, however, that our lowest bid value of €0.25 was accepted by 55% of respondents who were offered an initial bid price of €0.5. While this may lead to overestimating mean WTA if using parametric models, nonparametric models generate robust WTA estimates even with truncated distributions. 57
Our survey allows us to identify 9 points on the CDF, as shown in Table 2, ranging from €0.25 to greater than €10. Applying the nonparametric estimator, we calculated that 55% of people would be willing to accept €0.25 to walk the 10,000 steps, and 62% were willing to walk if the incentive was €0.50. At our upper bid of €10, our conservative nonparametric estimator shows that 80% of people would join the program. For the full sample, the median WTA is €0.23 = €0.00 + ((0.5 – 0.00)/(0.55 – 0.00)) * (€0.25 –€0.00).
Distribution of Willingness to Accept.
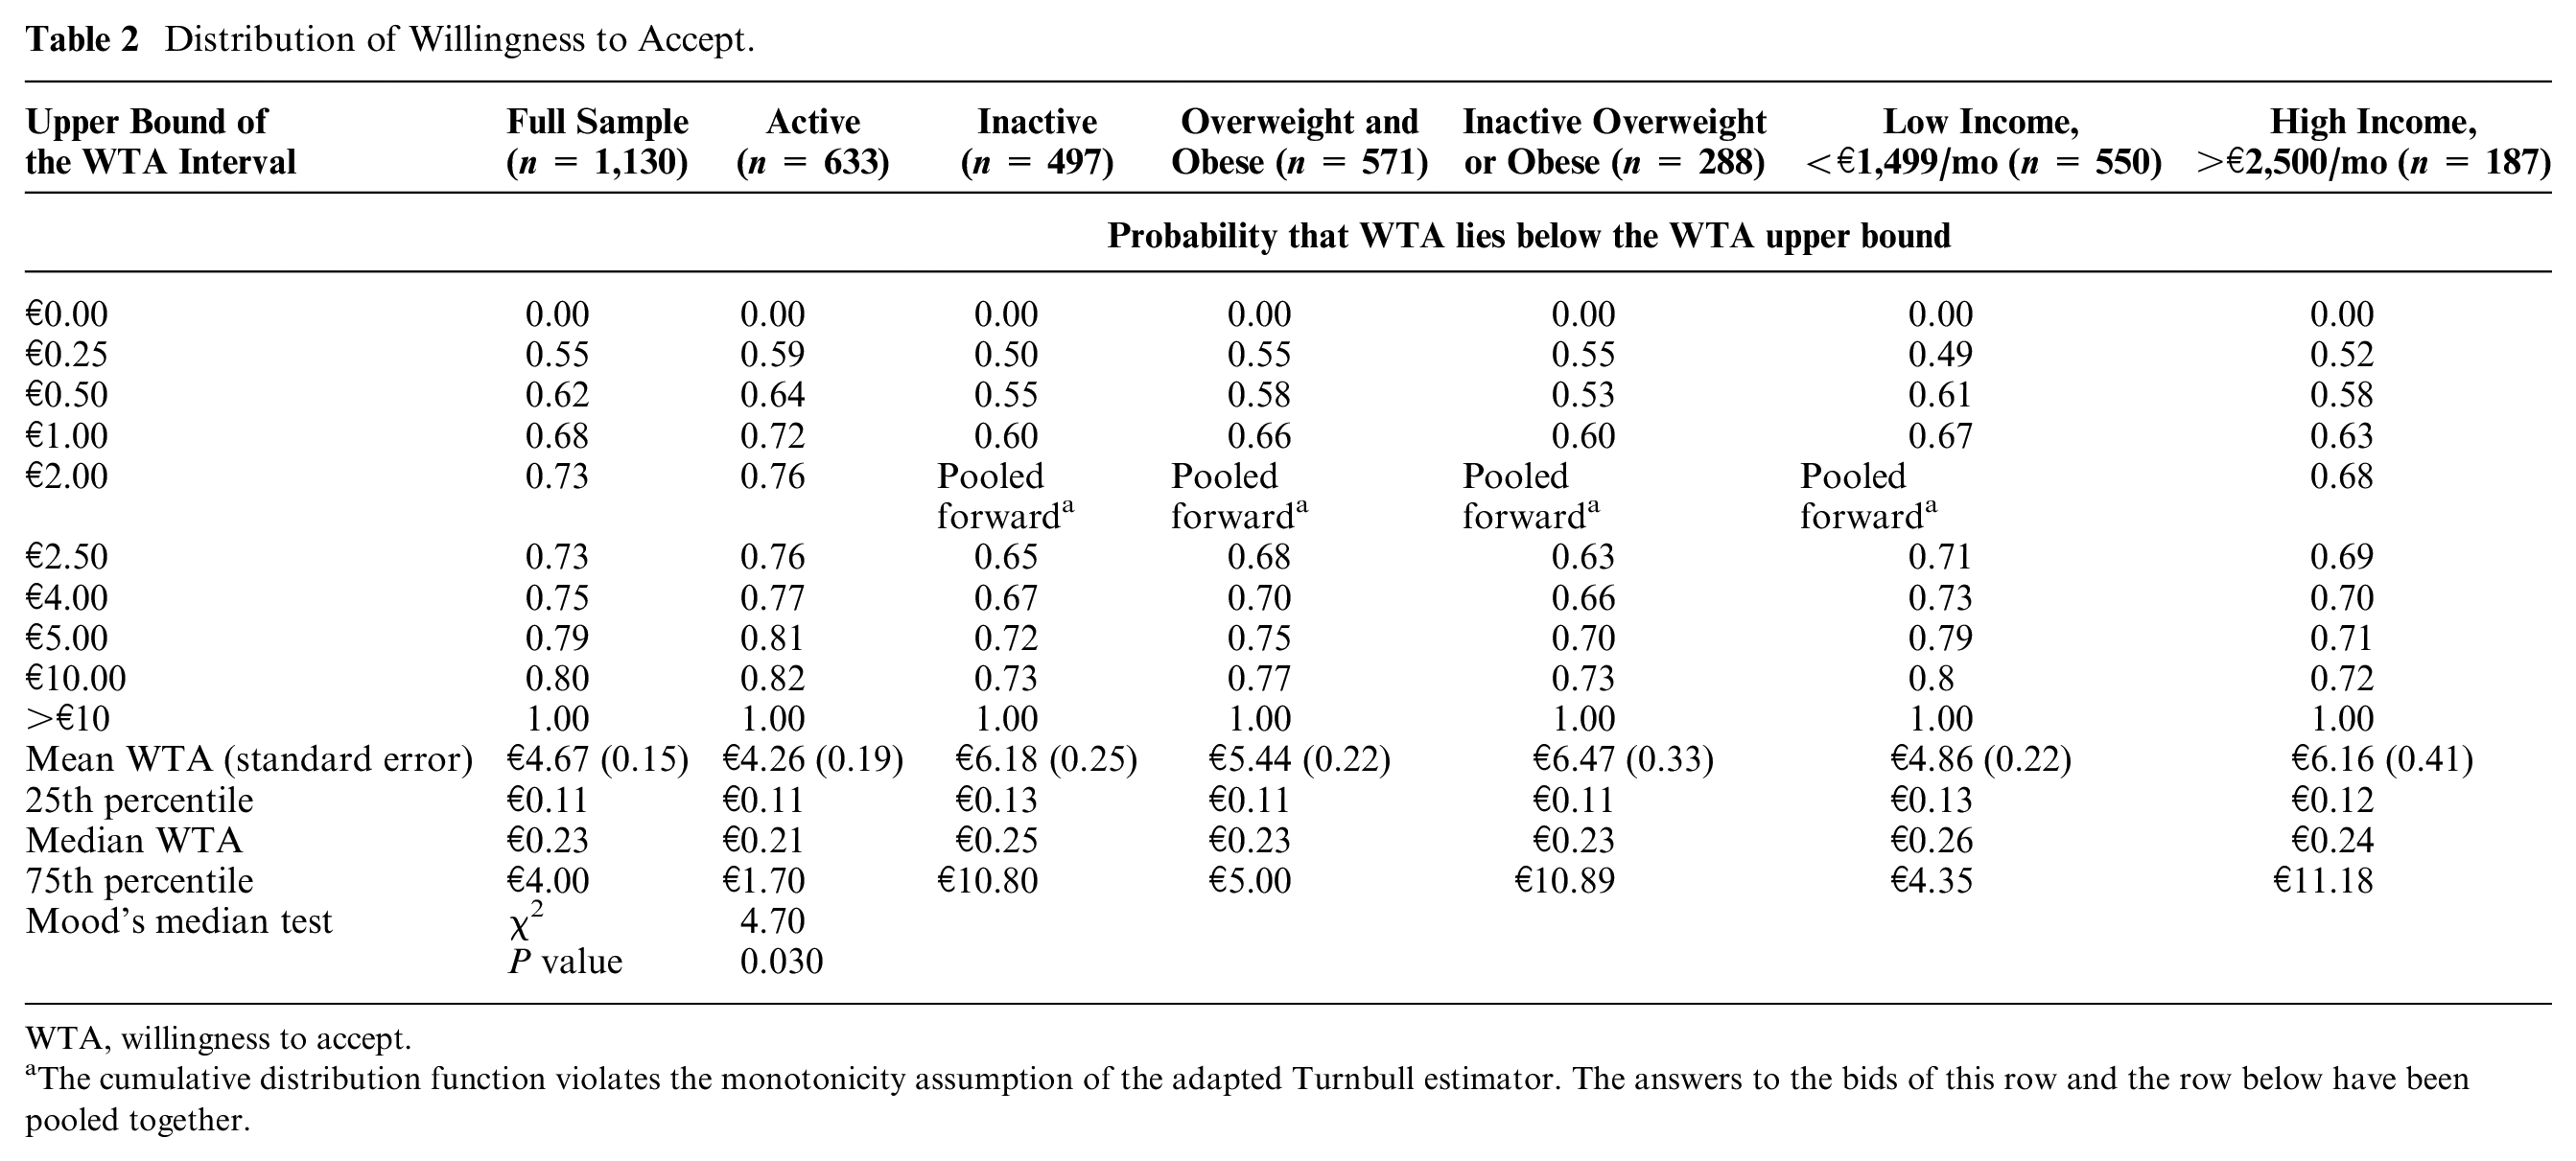
WTA, willingness to accept.
The cumulative distribution function violates the monotonicity assumption of the adapted Turnbull estimator. The answers to the bids of this row and the row below have been pooled together.
Inactive, Overweight, and Obese Respondents
Table 2 reports the mean, median, and 25th and 75th percentile WTA estimates for specific subsamples, according to respondents’ BMI levels and physical activity levels. Median WTA values for active and inactive respondents—with inactive respondents classified as those not meeting the WHO’s guidelines on physical activity levels—are equal to €0.21 and €0.25, respectively. A Mood’s test for the equality of the medians between these 2 groups shows that they are statistically different (P = 0.030).
To persuade three-quarters of inactive people to embrace the physical activity program, the financial incentive would have to be €10.80, about €9 more than what would be needed to convince three-quarters of active respondents to join the program. For overweight and obese respondents (BMI ≥25), we found the median and the 75th percentile equal to €0.23 and €5, respectively. For this latter group, we notice that an incentive of €10 would lead to only 2% more people joining the program compared to the number of people joining the program at €5. Figure 1 shows how a small incentive of €0.23 is enough to engage the majority of our respondents to embrace the hypothetical program. The shape of the CDF becomes flatter, and the financial incentive has to increase rapidly to persuade larger proportions of respondents to join the hypothetical program.
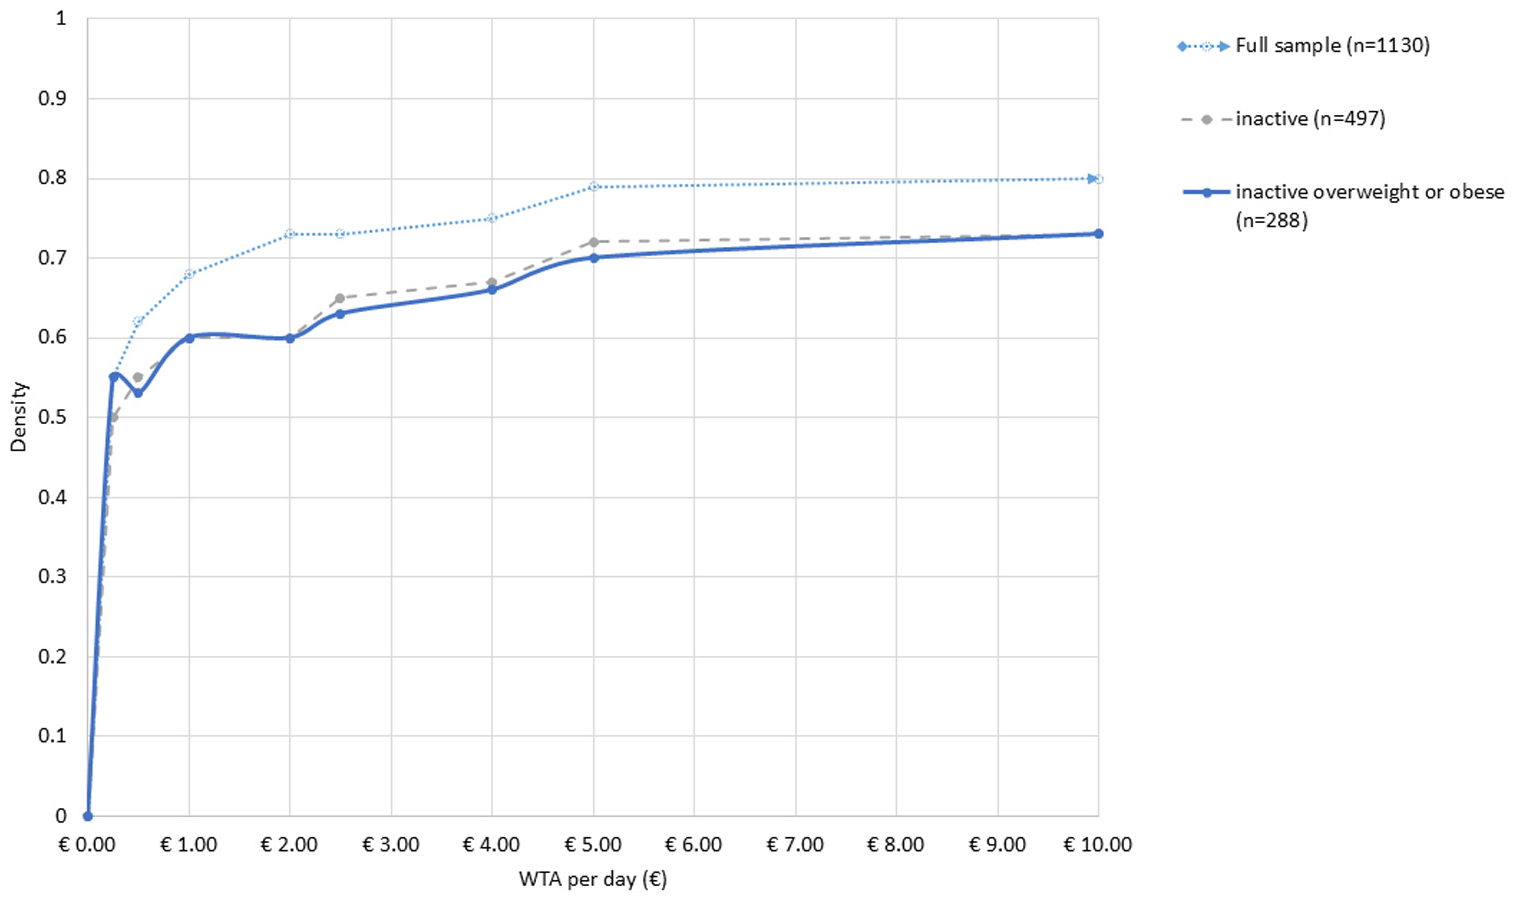
Cumulative distribution function of willingness to accept (WTA).
Internal Validity of the Willingness to Accept Answers
We explored the internal validity of WTA questions to examine if WTA depends on income in the ways predicted by economic theory by estimating split sample models for high income (>€2,500/month) and low income (<€1,499/month) respondents. The last 2 columns of Table 2 show that high-income respondents require a larger incentive level to embrace the walking program, consistent with economic theory predictions. In the supplementary material, we have also reported the results of further models to explore the impact of 2 endogenous nonmonetary incentives to walking—dog ownership and car ownership—and differences between age groups and gender. We found that lower financial incentives are required by dog owners and by residents in areas with a low car ownership rate. We also found that males require larger financial incentives than women to achieve 10,000 steps/day and that younger respondents’ WTA is lower than the WTA of older respondents at the median value but higher at the 75th percentile level.
As a final robustness check of our WTA survey, we found that about 8% of respondents stated that the government should not use taxpayers’ money to fund the walking program, and only about 3% did not believe that the hypothetical scenario was realistic, indicating that our hypothetical scenario was well received by respondents.
In the next sections, we explore why we found little differences in median WTA between active, inactive, overweight, and obese respondents by looking at the intention to engage in physical activity and at the time constraints that limit a person’s ability to increase their physical activity.
Intention to Engage in Physical Activity
Table 3 reports the WTA distribution for active and inactive respondents, divided into subgroups according to their engagement or intention to engage with the WHO’s recommended guidelines for physical activity. We found important differences between 1) respondents who had been physically active for more than 6 months (their median WTA = €0.20, and 75th percentile = €1.52), 2) inactive people who planned to become active in the next 6 months (median WTA = €0.28, and 75th percentile = €11.59), and 3) inactive people who did not plan to become physically active in the next 6 months (median WTA = €0.30, 75th percentile = €14.01). In other words, respondents who have been physically active for some time, or who plan to become physically active within the next 4 weeks, require a much lower incentive to reach 10,000 steps a day compared to participants who have recently become active, plan to become active much later on, or have no intention in the near future to become physically active. This result indicates that the intention to engage in physical activity and how long a person has been physically active for are important determinants of a person’s WTA. It also supports the finding that the WTA distribution for inactive respondents is more highly skewed than that for active respondents.
Distribution of WTA for Different Intentions to Meet the World Health Organization’s Guidelines for Physical Activity.
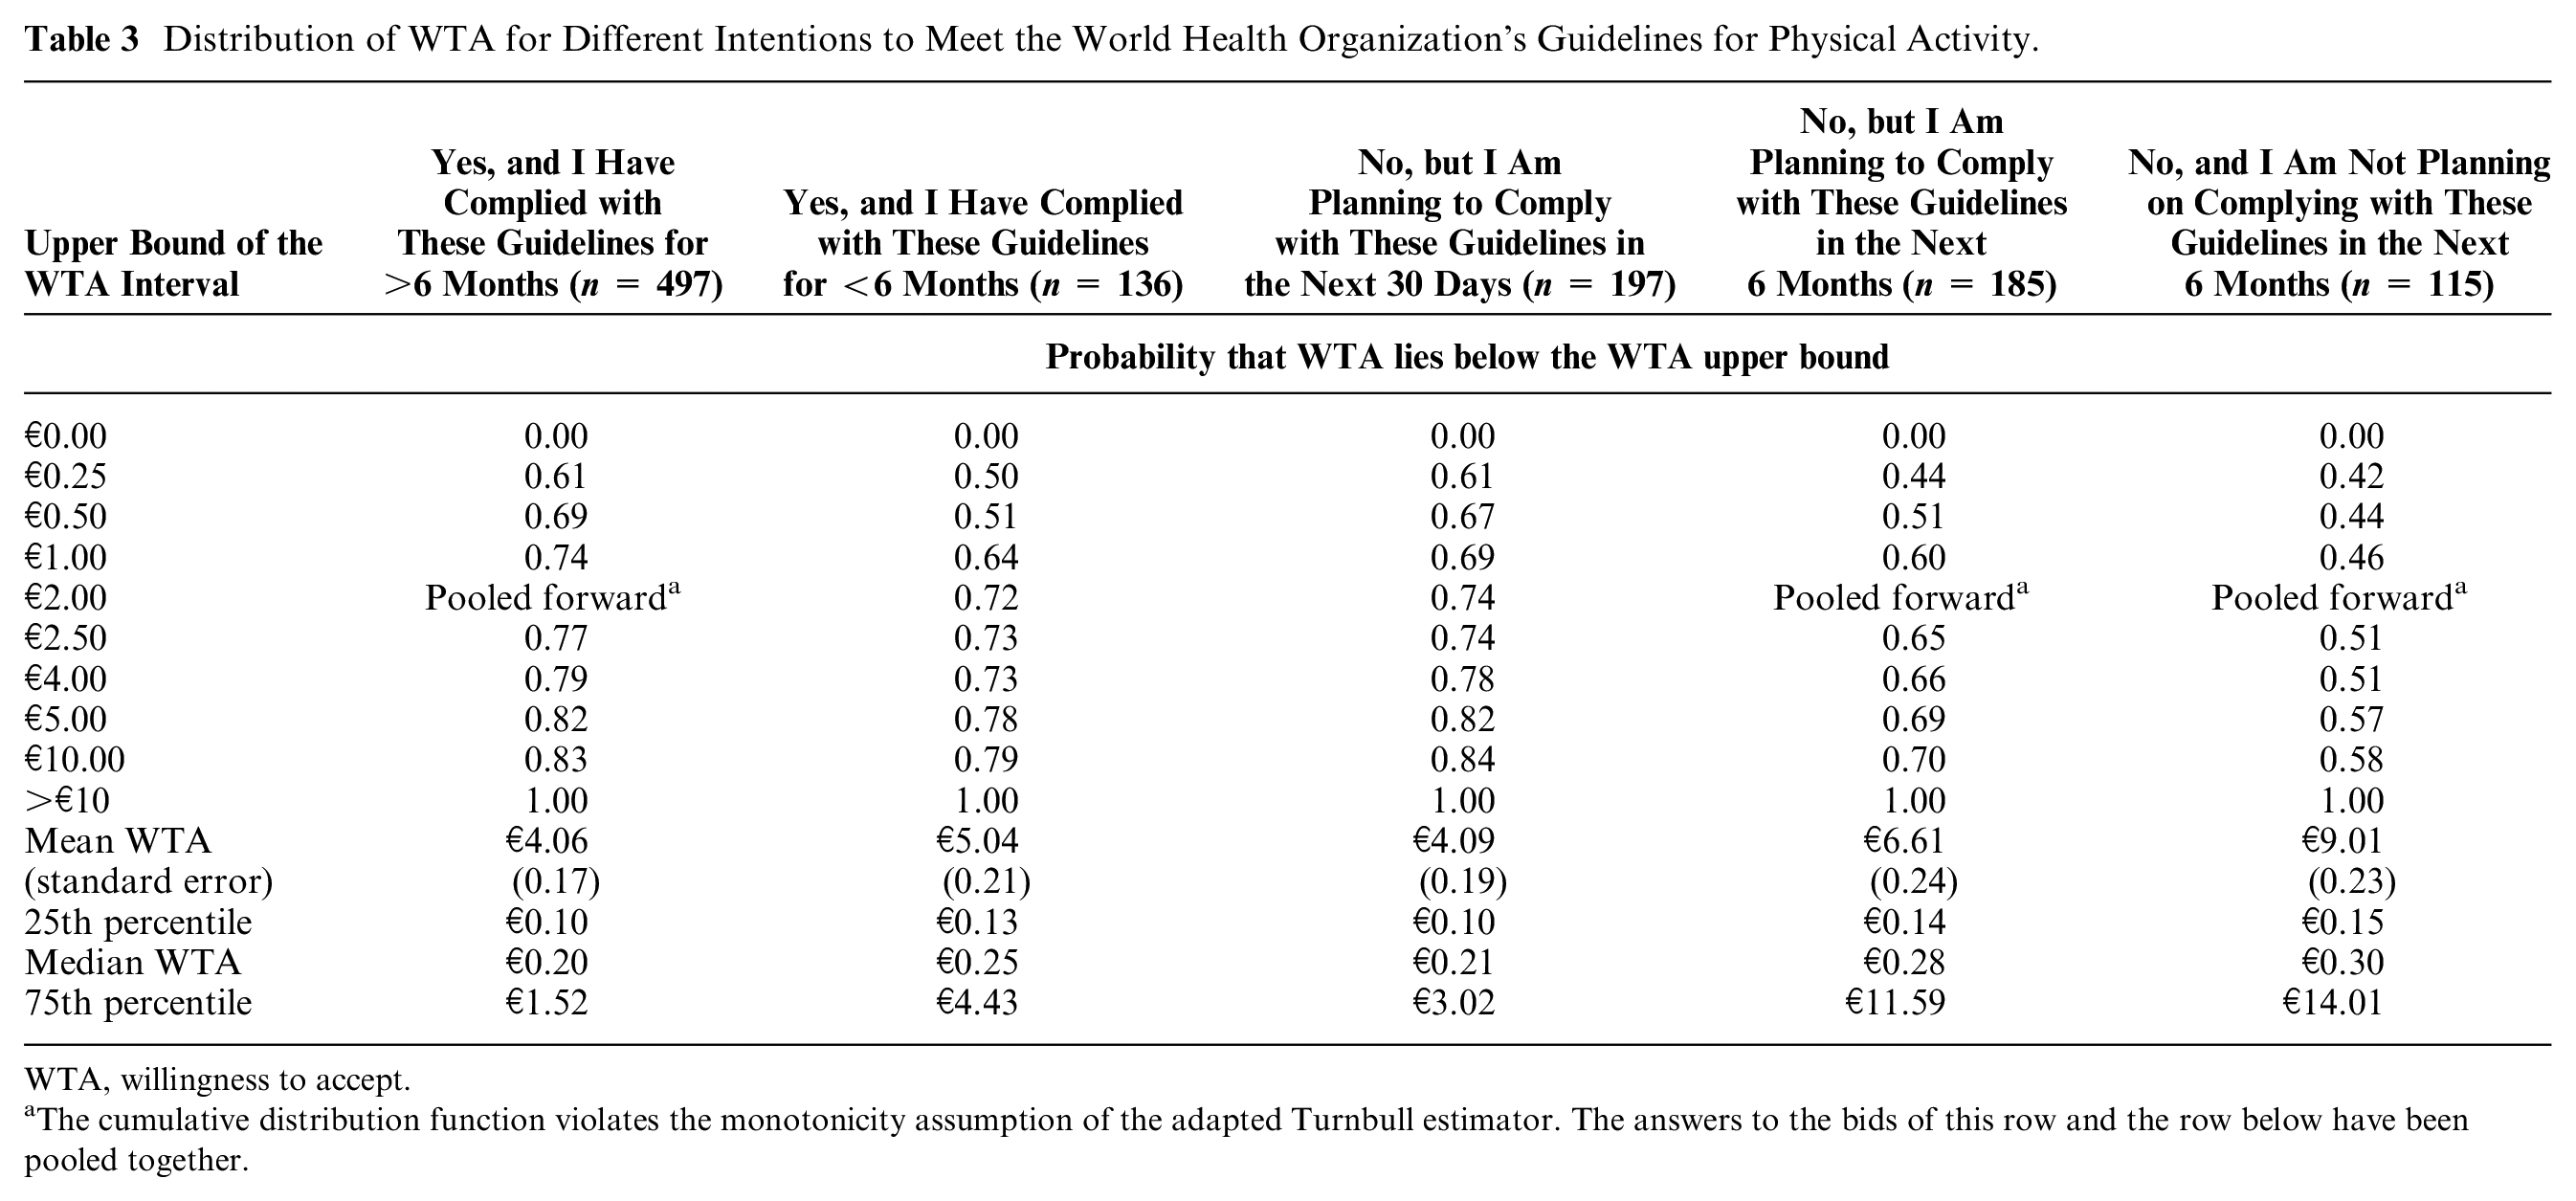
WTA, willingness to accept.
The cumulative distribution function violates the monotonicity assumption of the adapted Turnbull estimator. The answers to the bids of this row and the row below have been pooled together.
A Model of Time
Completing 10,000 steps per day requires an effort of between 1 and 2 hours, depending on the speed of the walk and a person’s age, gender, and health status.58–60 For people with higher BMIs and for less physically active persons, completing 10,000 steps may be more time-consuming than for a fit person.
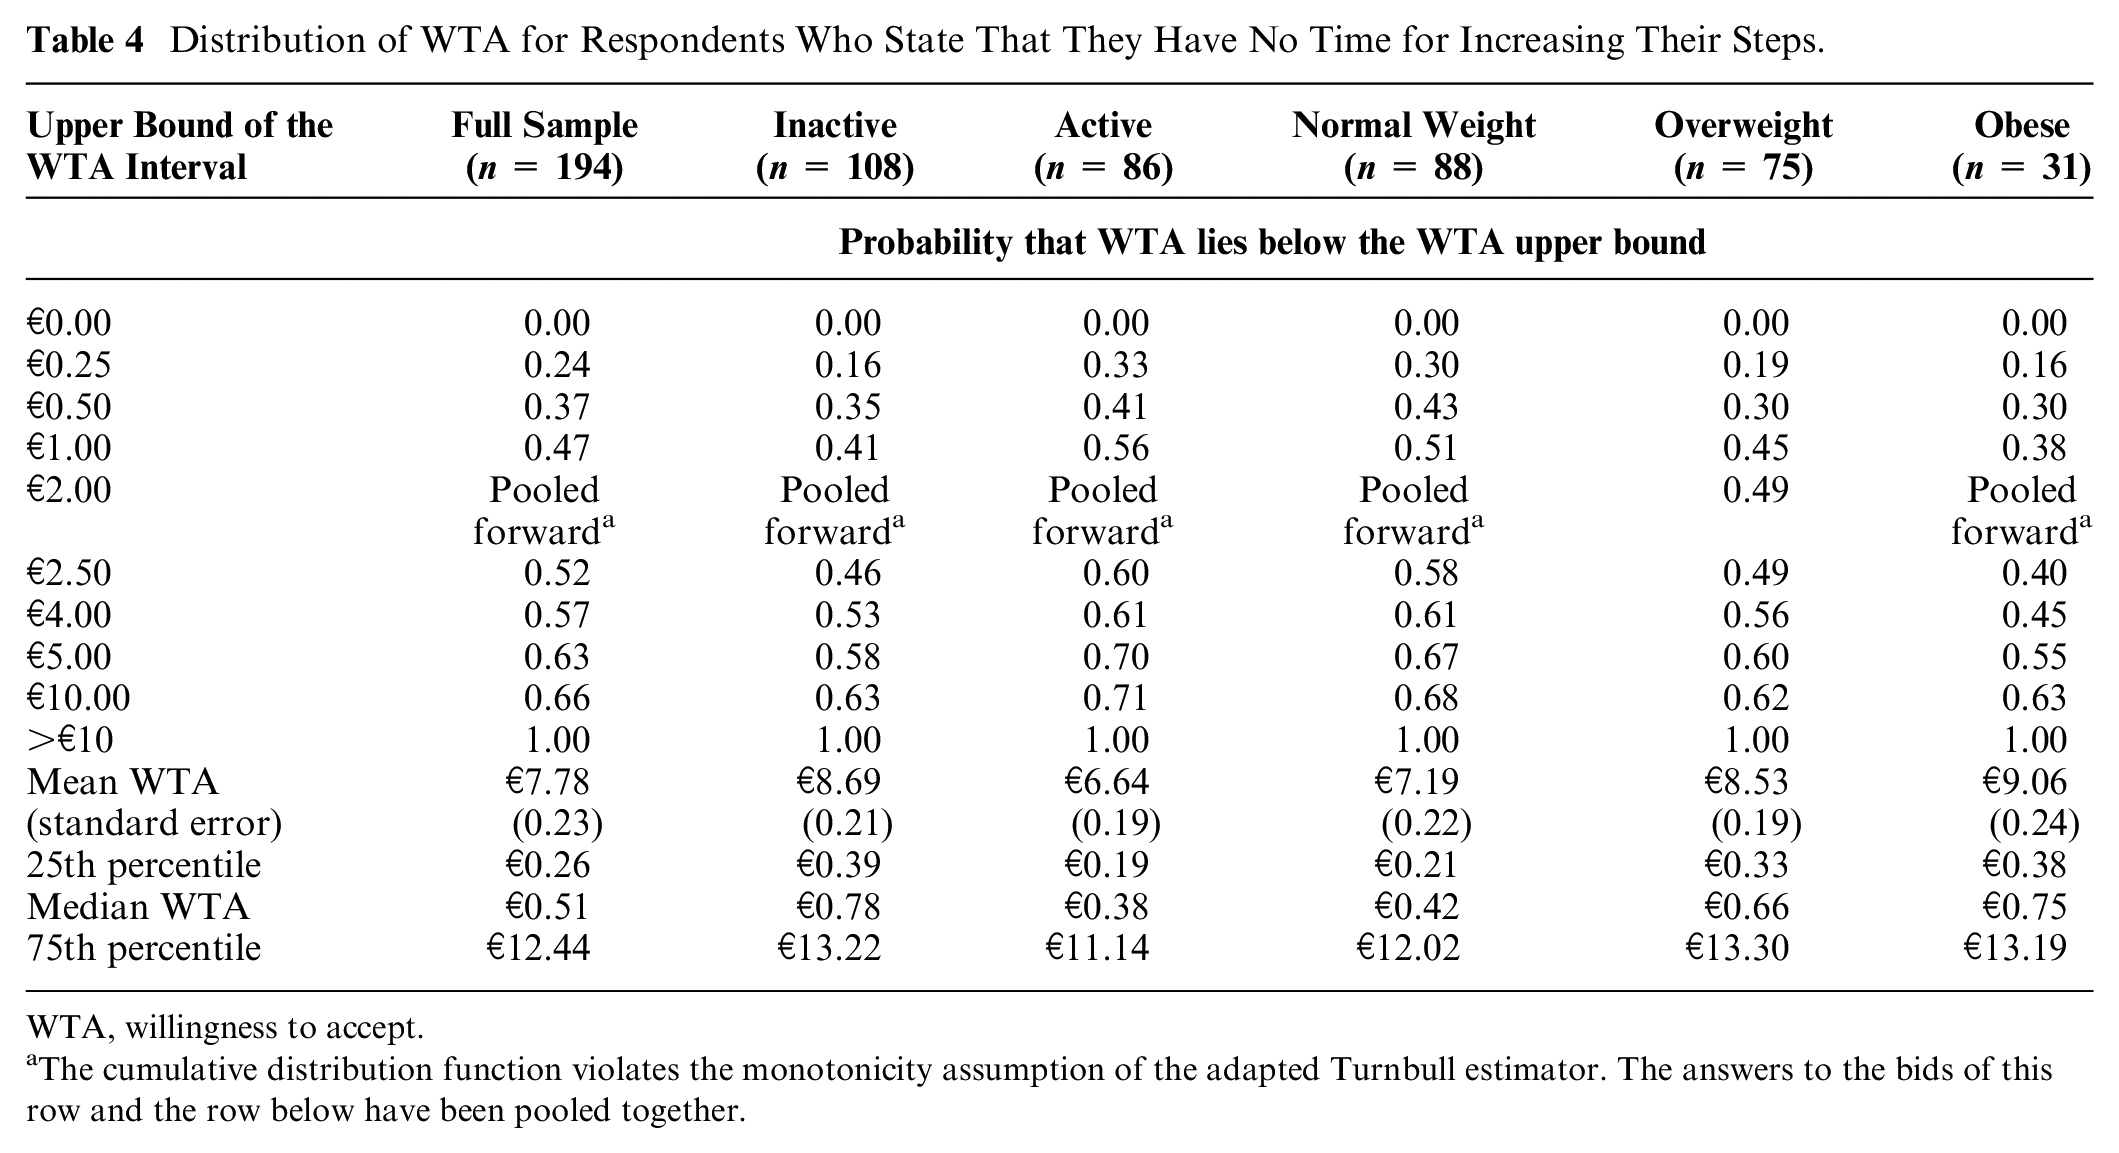
In our debriefing questions, we identified 194 respondents who stated that they had no time for doing more steps. As indicated in Table 4, these people reported a median WTA of €0.51, more than double what we found in the full sample. Among this subgroup, we also noticed that inactive, overweight, and obese respondents had particularly high median WTAs of €0.78, €0.66, and €0.75, respectively, indicating that the median WTA for inactive, obese, and overweight respondents is heterogeneous.
Distribution of WTA for Respondents Who State That They Have No Time for Increasing Their Steps.
WTA, willingness to accept.
The cumulative distribution function violates the monotonicity assumption of the adapted Turnbull estimator. The answers to the bids of this row and the row below have been pooled together.
Does Everybody Need a Financial Incentive?
From the debriefing questions to the WTA questions, we identified 269 respondents, 24% of the sample, who stated they would be willing to complete the 10,000 steps/day even without payment. This is consistent with what we observe in real life, where a good proportion of people are physically active even without any monetary incentive and where even some inactive people may be willing to increase their physical activity without payment. These data indicate that for almost one-quarter of our sample, offering a financial incentive would not affect their levels of physical activity. Yet, if these people were offered a financial incentive, they would be willing to take it—they stated a positive WTA—as any rational individual would do. In other words, offering a financial incentive to these people would be a waste of public funding, as their behavior would not be affected by the financial incentive.
It is noticeable that among this subgroup, there were 107 inactive respondents. When we investigated the characteristics of this group, we found that 79% of them believed to be in good health, indicating that they seemed to lack a motivation to increase their physical activity.
Discussion
While our data show a modest monetary incentive of €0.23 is enough to persuade the median person to achieve 10,000 steps a day, the results are more complex if the objective is to achieve larger groups of the population to reach the physical activity target. In particular, the financial incentives need to grow much larger, to €4.00/day, to have three-quarters of the population embrace our hypothetical policy. Payment would need to be set at €10.80/day to encourage three-quarters of currently inactive people to join the program.
While we found little differences in median WTA for the majority of respondents across subgroups, there is a minority of inactive and overweight and obese respondents who require much larger monetary incentives to change their behavior: for these respondents, their WTA distributions are even more highly skewed than those for normal-weight and active respondents. For these subgroups, the lack of availability of time and individuals’ poor intentions to meet the WHO’s targets for physical activity are strong determinants for high WTA values.
Of the 194 people who stated that they had no time to increase their physical activity, the median WTA values for overweight (€0.66), obese (€0.75), and inactive (€0.78) respondents are almost twice those for active (€0.38) respondents. We found that 115 of 497 inactive respondents did not intend to comply with the WHO’s guidelines for physical activity in the next 6 months. This group showed a median WTA of €0.30 and a 75th percentile of €14.01 to complete the 10,000 steps per day. Among respondents who had met the WHO’s guidelines for more than 6 months, the median WTA is €0.20 and the 75th percentile is €1.52.
The results further indicate that, while a modest incentive of €0.23 is enough to engage half our sample to complete 10,000 steps per day, about one-quarter of respondents would engage in the hypothetical program even without payment, but if a payment was offered to them, they would accept it. These respondents would contribute to increasing the total cost of the public program but not its public benefits.
Considering that 37% of the adult population in Spain is sedentary 61 and that the total population of the BAC is 2.1 million people, an incentive of €0.25 per 10,000 steps per day offered only to inactive people, which would persuade only half of them, the total daily cost for the BAC would be about €97,000/day, or about €25 million a year, if the incentives were given 5 days per week. If the government wanted to increase the program to benefit three-quarters of inactive people, the incentive would have to be set at €10.80/day, with a daily cost of about €6 million and an annual cost of €1.6 billion. These are substantial expenditures that should be compared with the annual cost of physical inactivity, which are estimated at €308 million for the BAC. 62 It is therefore important that other initiatives are implemented to help those for whom the financial incentive is too small to change their behavior or for whom a financial incentive would not affect their behavior.
We note that a 10,000 steps/day goal may not be universally appropriate. For example, Lee et al. 63 have shown that in a large sample of 16,741 older women, setting a target of 10,000 steps a day would not be ideal for reducing mortality rates, as it was found that with 4,400 steps/day, there was a significantly lower mortality rate compared with approximately 2,700 steps/day. Mortality rates leveled off at about 7,500 steps/day. Similarly, Inoue et al. 64 found that women who are overweight, are obese, or have hypertension would reach substantial health benefits when walking 5,000 steps per day, with further increases in steps/day only accompanied by modest health improvements.
We conclude that there is no “one size fits all” with financial incentives for behavior change, and it is important to examine the distribution of WTA to design an incentive scheme that triggers the behavior change for the groups that policy makers are interested in. Policy makers should also be aware that a monetary incentive scheme for rewarding physical activity will attract people who would exercise without the incentive, increasing the public cost of the program but not its benefits.
Supplemental Material
sj-docx-1-mdm-10.1177_0272989X211011606 – Supplemental material for One Size Does Not Fit All
Supplemental material, sj-docx-1-mdm-10.1177_0272989X211011606 for One Size Does Not Fit All by Alberto Longo, Eileen Mitchell, Anil Markandya and Ibon Galarraga in Medical Decision Making
Footnotes
The author(s) declared no potential conflicts of interest with respect to the research, authorship, and/or publication of this article.
The author(s) disclosed receipt of the following financial support for the research, authorship, and/or publication of this article: Financial support for this study was provided entirely by a grant from Bizkaia Talent. The funding agreement ensured the authors’ independence in designing the study, interpreting the data, writing, and publishing the report.
References
Supplementary Material
Please find the following supplemental material available below.
For Open Access articles published under a Creative Commons License, all supplemental material carries the same license as the article it is associated with.
For non-Open Access articles published, all supplemental material carries a non-exclusive license, and permission requests for re-use of supplemental material or any part of supplemental material shall be sent directly to the copyright owner as specified in the copyright notice associated with the article.