
Abstract
Microsimulation models are increasingly being used to estimate the long-term population effects of cervical cancer screening programs. Collaborative modeling can enhance the rigor of modeling research through the use of multiple independent models, with standardized model inputs, to answer the same research or policy questions. The US National Cancer Institute–funded Cancer Intervention and Surveillance Modeling Network (CISNET) was established in 2000 to use collaborative modeling to improve our understanding of the impact of cancer prevention, screening, and treatment dissemination on population trends in cancer incidence and mortality. 1 The CISNET Cervical Cancer Working Group started in 2015 and includes 5 modeling teams. Prior to CISNET, each model was independently developed for 3 different countries (i.e., the United States, Australia, and the Netherlands) and is unique in its structure, assumptions, and methods of synthesizing data. Consequently, they are unique in how they project the impact of screening and treatment on cervical cancer incidence and mortality. Results that are similar across multiple models, despite differences in assumptions and modeling approach, enhance the credibility of the findings and are more likely to be robust than conclusions obtained from a single model; results that are different across models reveal areas of uncertainty and priorities for future research.
While country-specific factors (e.g., cost-effectiveness thresholds, disease burden) may contribute to relevant variations in policy conclusions, it is important to understand how different model structures and combinations of assumptions contribute to these differences. Detailed model descriptions are necessary and contribute to model transparency. Although all inputs of a model should always be reported, assumptions on natural history parameters, such as the dwell time (i.e., the period in which the asymptomatic disease could be caught by screening) and their implications, remain difficult to assess even with comprehensive documentation.
In the absence of screening, cervical cancers will only be diagnosed as a result of clinical symptoms (i.e., clinical incidence). Clinical incident cancer cases and cancer-specific deaths that occur after screening have 3 possible origins: 1) the disease was not present at the time of screening, 2) the disease was present but not detected by screening (i.e., limitations in test sensitivity), or 3) preclinical disease (precancerous lesions and preclinical cancers) was not completely removed or recurrence of that lesion occurred. The maximum clinical incidence reduction (MCLIR) method can be used to examine and disentangle the relative contributions of these 3 origins of different screening models. The MCLIR method is able to isolate the unobservable effects of lesion onset and duration, screening test sensitivity, and precancerous lesions and cancer treatment by comparing model results before and after imposing a one-time screening intervention under varying assumptions about screening performance and treatment effectiveness. These effects are unobservable because of limited knowledge of underlying natural history processes and parameters, and they include parameters for which traditional epidemiologic studies would be impossible or unethical to conduct. Previously, the MCLIR method has been applied to 3 CISNET colorectal 2 and 6 breast cancer 3 models to delineate the effects of natural history assumptions and model structure on colorectal and breast cancer predictions. In this study, we applied the MCLIR method to understand how differences among the CISNET cervical cancer models affect predictions for screening effectiveness by projecting the clinical incidence and mortality reductions after a one-time screening test at age 45 years among women without prior screening. The results are intended to provide a greater understanding of how the CISNET cervical models depict unobservable processes (such as the progression of underlying disease and the missed detection of existing disease) and how those representations may systematically affect conclusions about screening impact on incidence and mortality.
Methods
We used 4 well-established CISNET-Cervical microsimulation models (Harvard, 4 Microsimulation Screening Analysis [MISCAN]–Cervix, 5 Policy1-Cervix [CCNSW], 6 and University of Minnesota [UMN]–HPV Cancer [CA] 7 ) to project outcomes for a hypothetical cohort of individual women. This analysis was conducted prior to standardization of each model to the US population and screening performance.
Each of the 4 CISNET-Cervical models simulates the underlying natural history of human papillomavirus (HPV)–induced cervical cancer but differs with respect to the type and number of health states, HPV genotypes included, cycle length, and data sources used to parameterize the baseline model prior to model fitting (i.e., calibration) to the observed data (Box). In general, all 4 models simulate a large study population with individual life histories, in which women can acquire HPV infections, develop precancerous lesions, and, in some cases, develop cervical cancer. Death can occur from background causes or cervical cancer among those with disease. Infections can clear or progress to cervical intraepithelial lesions that may regress. Women can acquire multiple infections during a lifetime, each with its own clinical course. The models produce age-specific outputs of disease incidence and mortality over time. Screening can affect the life histories of individual women. These changes constitute the effects of the intervention and are represented by the numbers of events and the stage of cancer that is detected or prevented.
Key Attributes of the 4 Microsimulation Screening Models of the Cervical Working Group of Cancer Intervention and Surveillance Modeling Network (CISNET): Harvard, MISCAN (Erasmus MC Rotterdam), Policy1-Cervix (CCNSW), and UMN-HPV CA
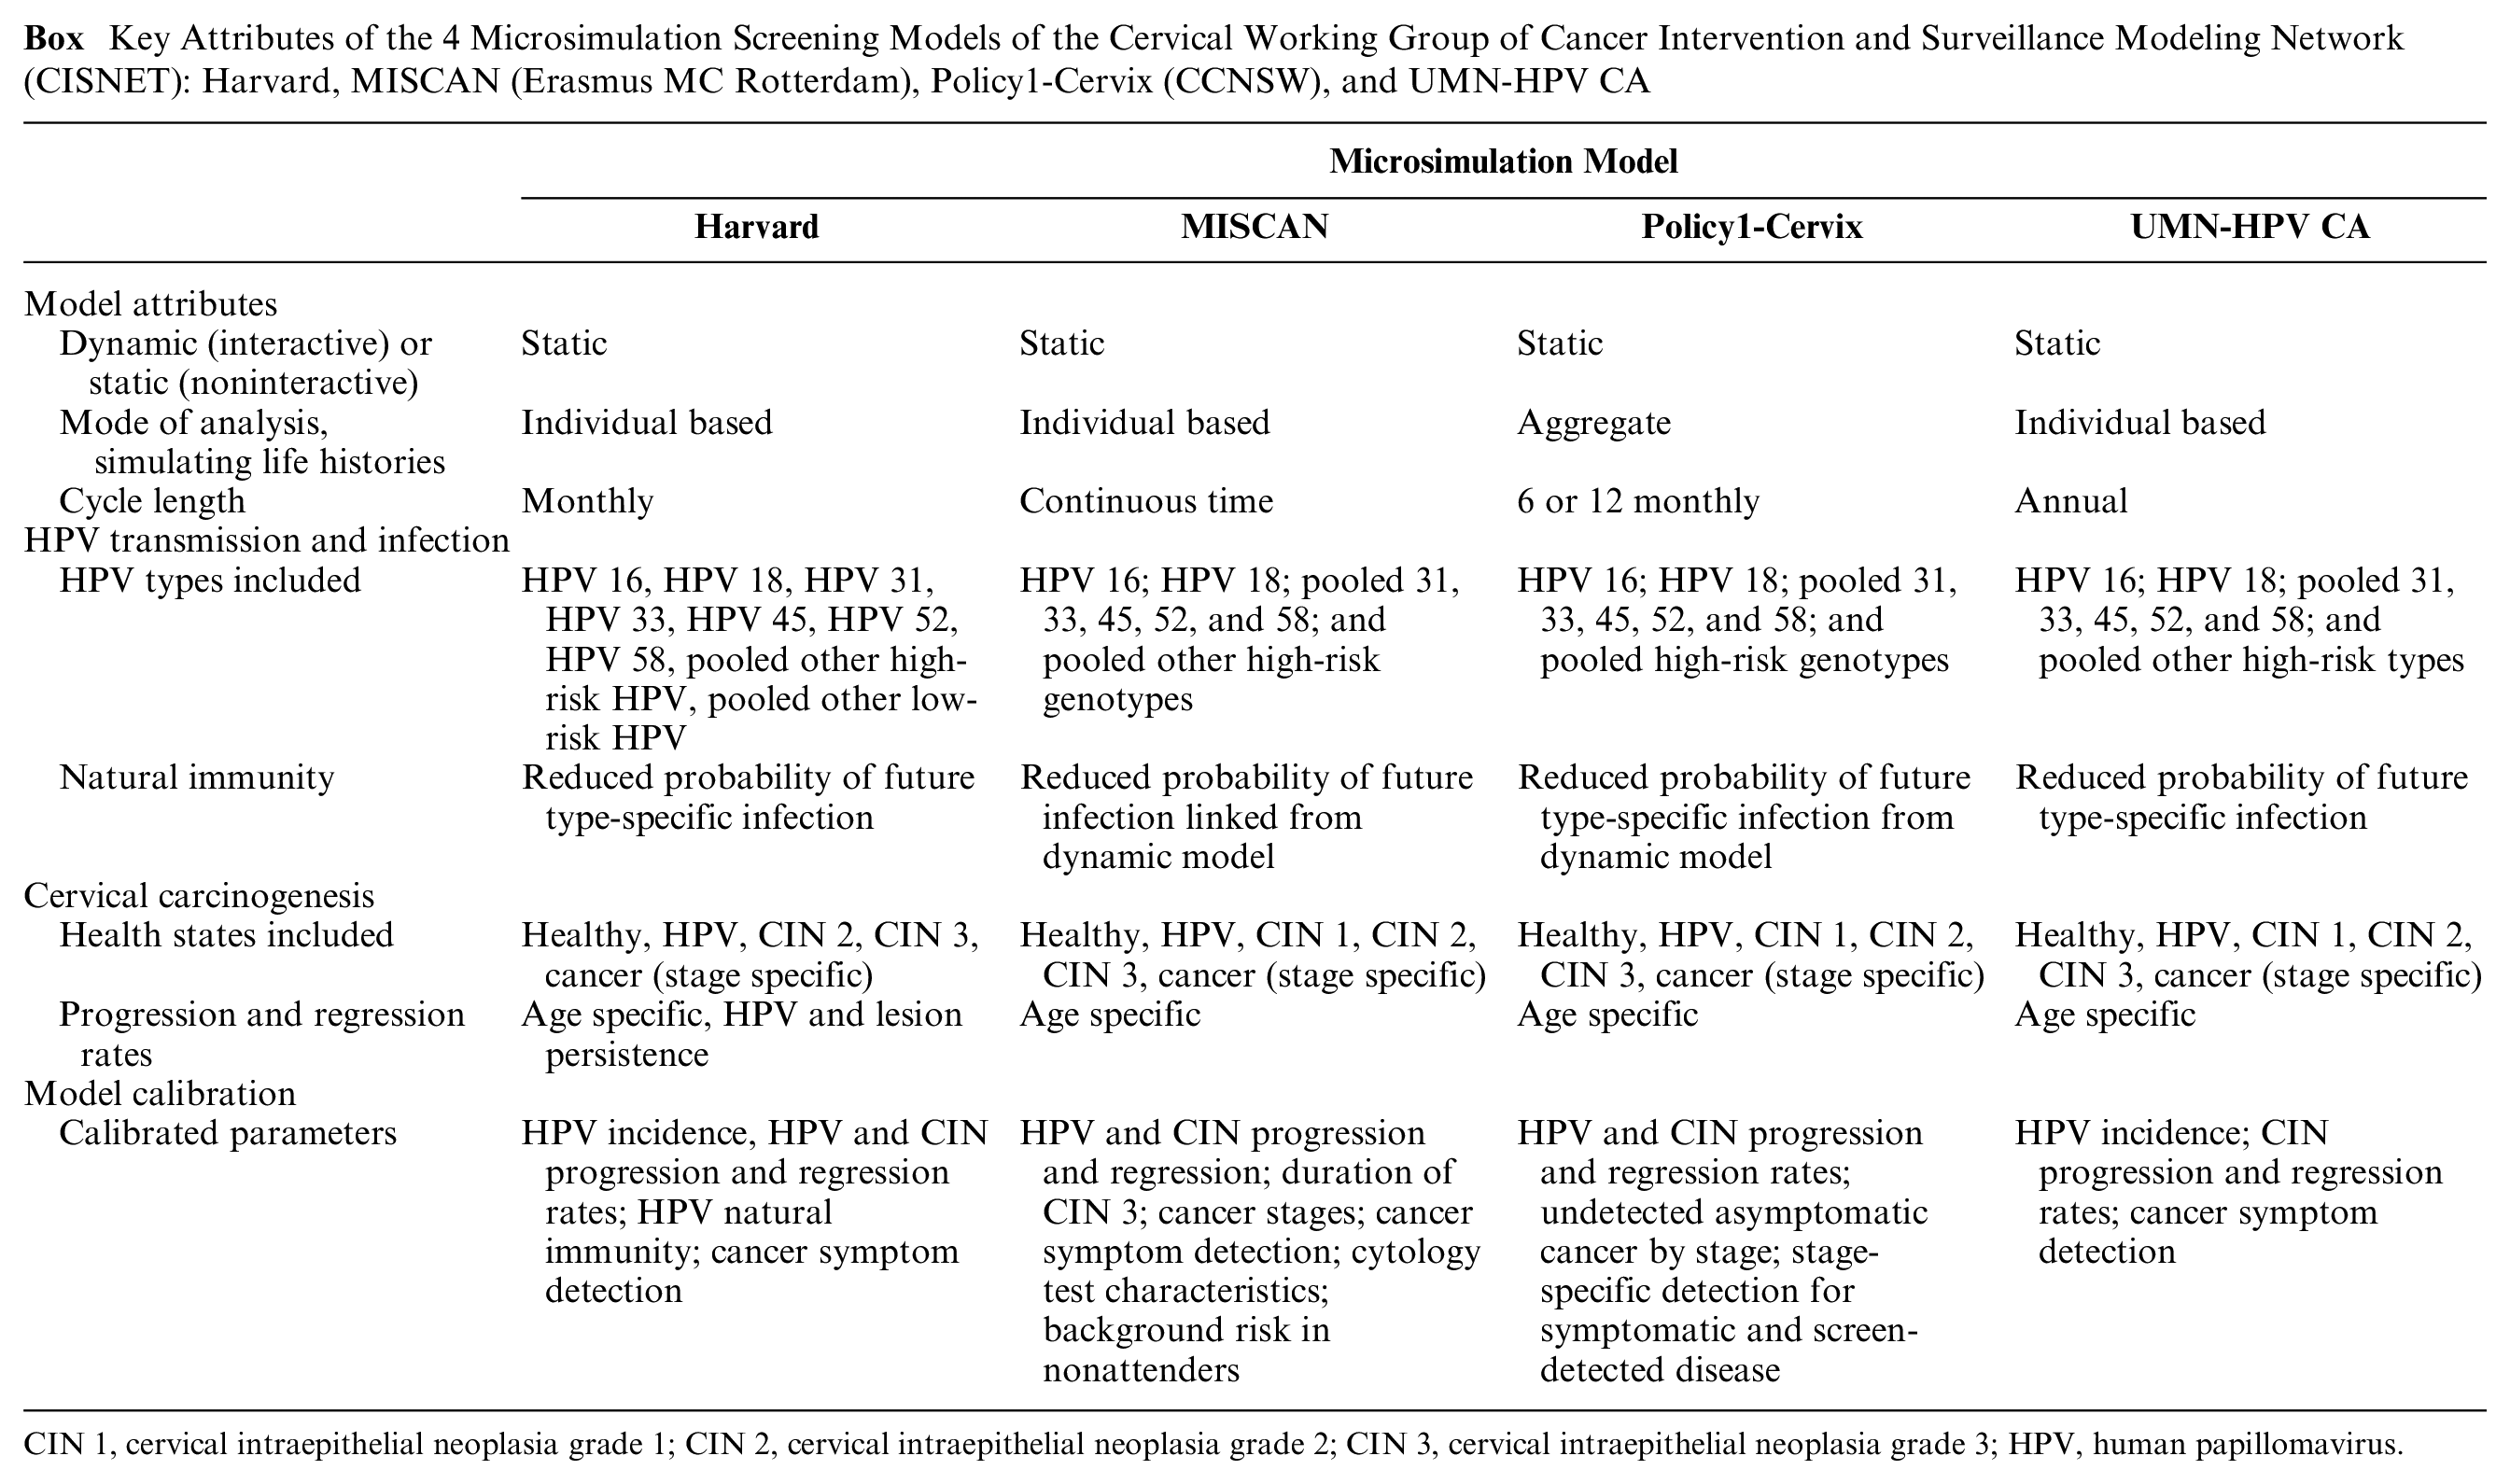
CIN 1, cervical intraepithelial neoplasia grade 1; CIN 2, cervical intraepithelial neoplasia grade 2; CIN 3, cervical intraepithelial neoplasia grade 3; HPV, human papillomavirus.
Standardized profiles of each model’s structure and underlying model parameters and assumptions, with additional references, are available at http://cisnet.cancer.gov/profiles/. Additional model specifications and key parameters are provided in Table 1.
Assumptions for Realistic Cytological Screening and Realistic Treatment in the 4 Models
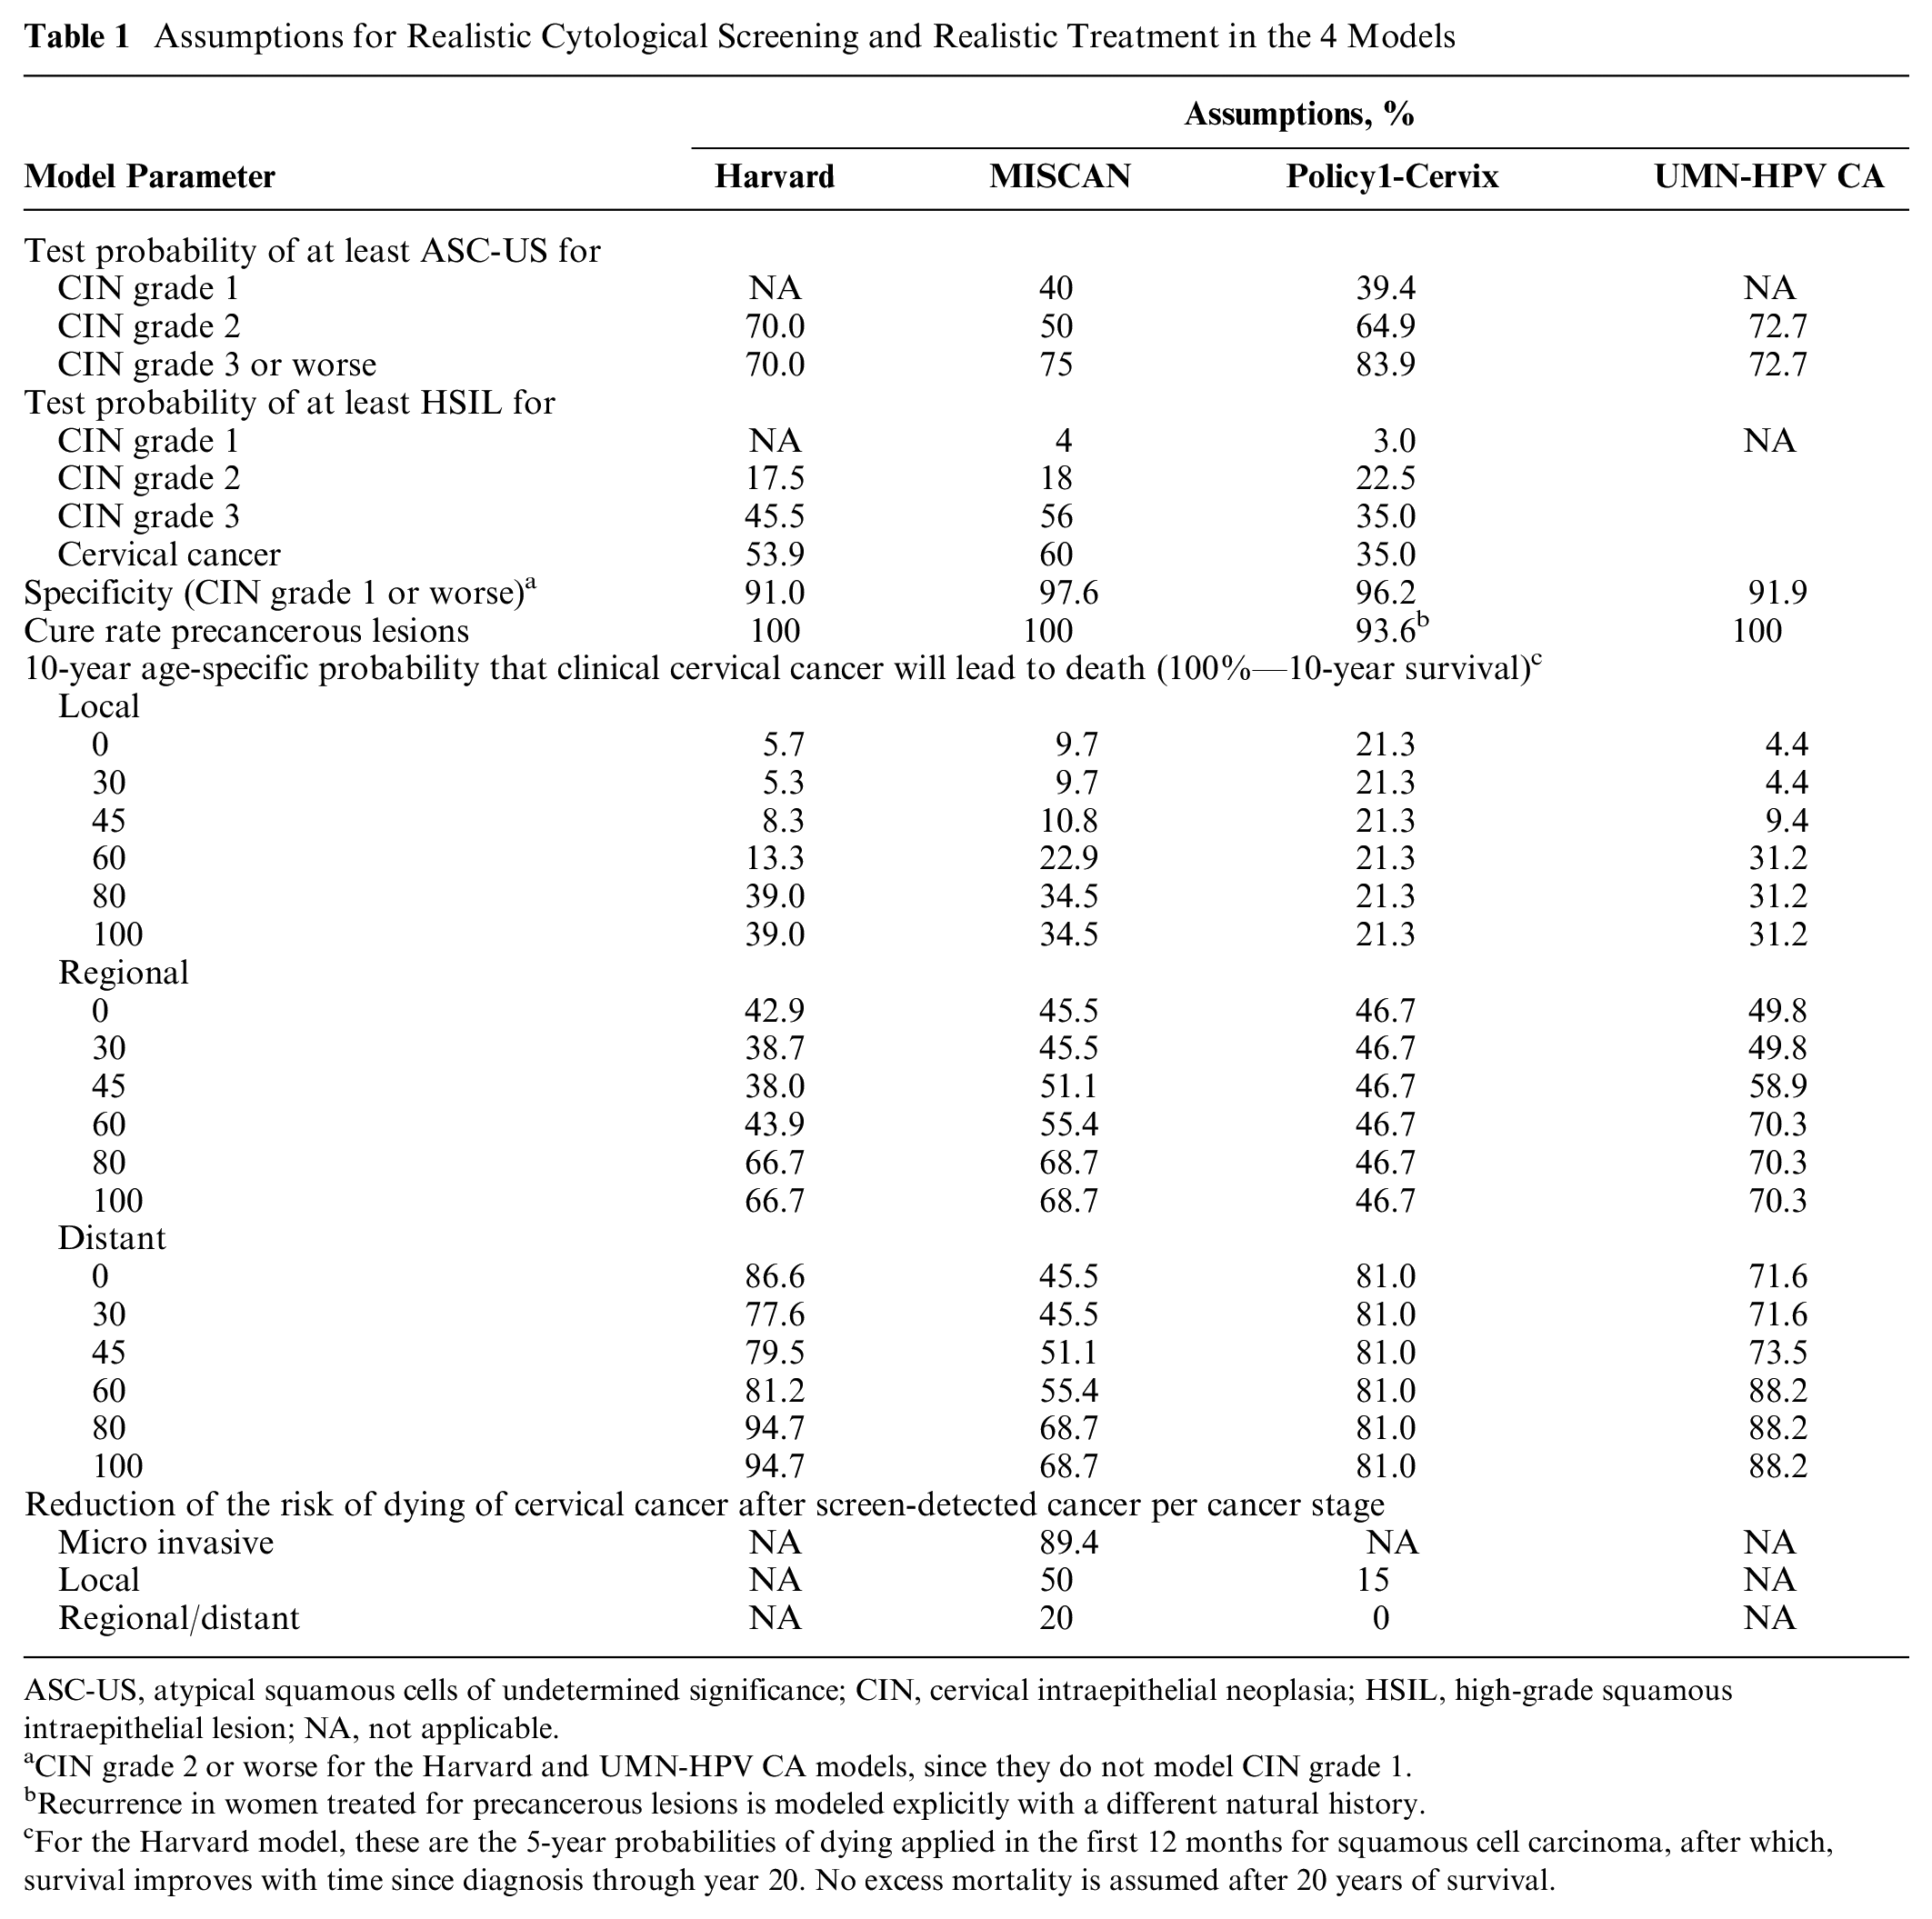
ASC-US, atypical squamous cells of undetermined significance; CIN, cervical intraepithelial neoplasia; HSIL, high-grade squamous intraepithelial lesion; NA, not applicable.
CIN grade 2 or worse for the Harvard and UMN-HPV CA models, since they do not model CIN grade 1.
Recurrence in women treated for precancerous lesions is modeled explicitly with a different natural history.
For the Harvard model, these are the 5-year probabilities of dying applied in the first 12 months for squamous cell carcinoma, after which, survival improves with time since diagnosis through year 20. No excess mortality is assumed after 20 years of survival.
MCLIR Analysis
To illustrate the effects of model structure and assumptions about lesion development, lesion progression, screening test ability to detect lesions, and precancerous lesion treatment on cervical cancer incidence and mortality predictions, the MCLIR analysis consists of comparisons between 4 scenarios. Three scenarios involve a one-time screening test at age 45 years, and the remaining scenario of no screening serves as a comparator. The study population for each scenario is a cohort of average-risk women born in 1980 who have never been screened or diagnosed with cervical cancer prior to age 45 years. Age 45 years was selected to illustrate model differences because it is in the middle of the start and stop ages of recommended screening guidelines, 8 and there is sufficiently high incidence of cervical cancer at this age to illustrate model differences. Women were followed for 5 years (i.e., up to age 50) and 15 years (i.e., up to age 60) to capture the short- and longer-term effects of the intervention. Model outcomes included cervical cancer incidence and mortality by age.
MCLIR Scenarios
To disentangle the impacts of the 3 possible sources of residual cancer following one-time screening, the MCLIR method compares changes in the number of clinically detected cervical cancer cases and deaths between 4 simplified scenarios (Figure 1): 1) no-screening; 2) one-time perfect cervical screening at age 45 years, which detects all existing precancerous lesions and assumes perfect treatment of all screen-detected lesions (i.e., lesion completely removed and no recurrent disease); 3) one-time realistic-sensitivity cytological screening at age 45 years, which assumes imperfect detection of precancerous lesions and perfect treatment of all screen-detected lesions; and 4) one-time realistic-sensitivity cytological screening at age 45 years and realistic-effectiveness treatment of all screen-detected lesions. Assumptions for realistic cytological screening and realistic treatment of all screen-detected lesions differed between the models (Table 1).
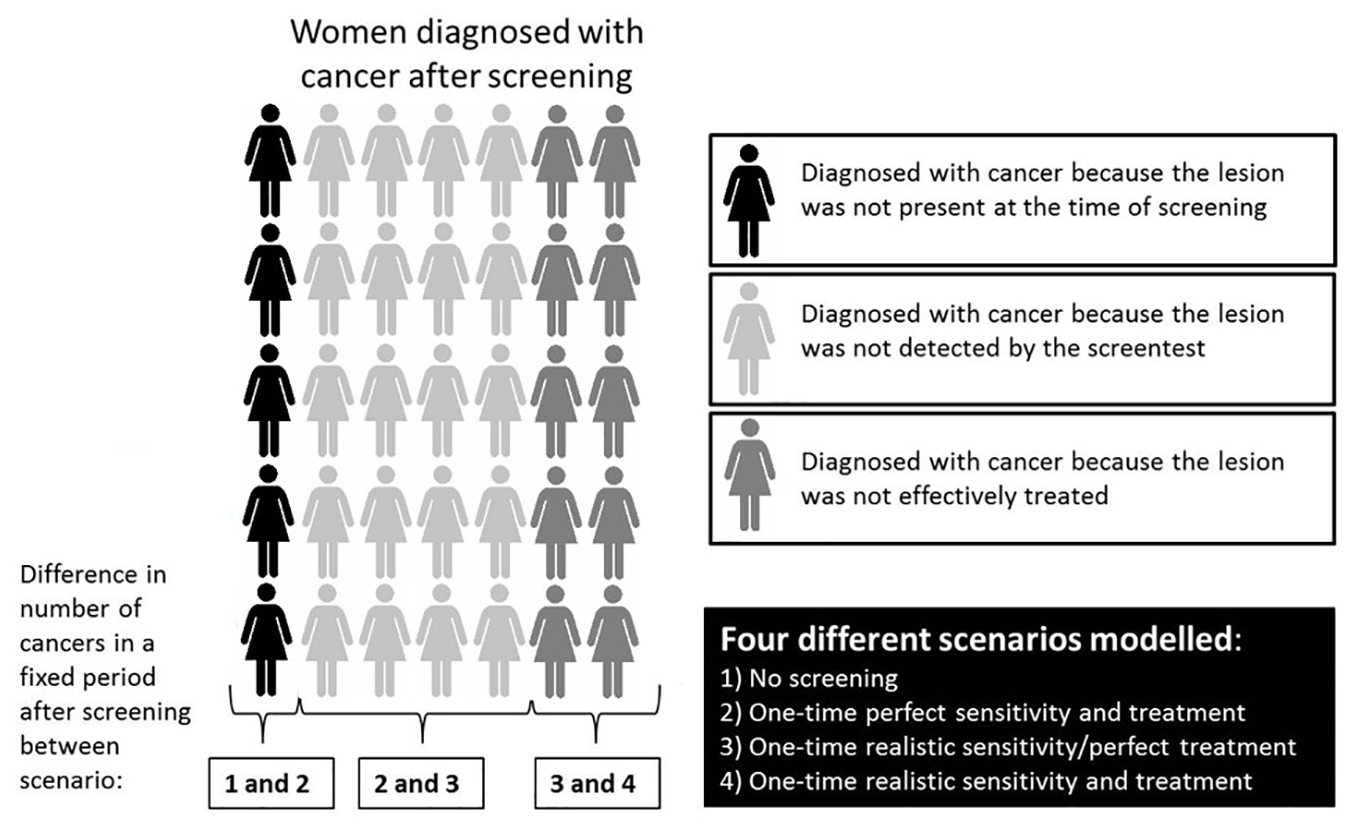
A schematic presentation how the impact of 3 contributors to cancer (mortality) after screening can be disentangled with modeling.
We calculated the attributable fraction (i.e., origin) of cervical cancer incident cases and deaths in the 4 CISNET models, 5 years and 15 years after screening at age 45 years. We did this by dividing the difference in number of cancers/deaths between the different modeled scenarios (see Figure 1) with the number of cancers in the no-screening scenario. Because in some models, women were not all screened exactly on their 45th birthday but within the 45th year of life, we excluded the first follow-up year when calculating the attributional fractions.
Results
Figure 2 shows how the attributable fractions (Table 2) are calculated, using cervical cancer mortality in the Harvard model as an example.
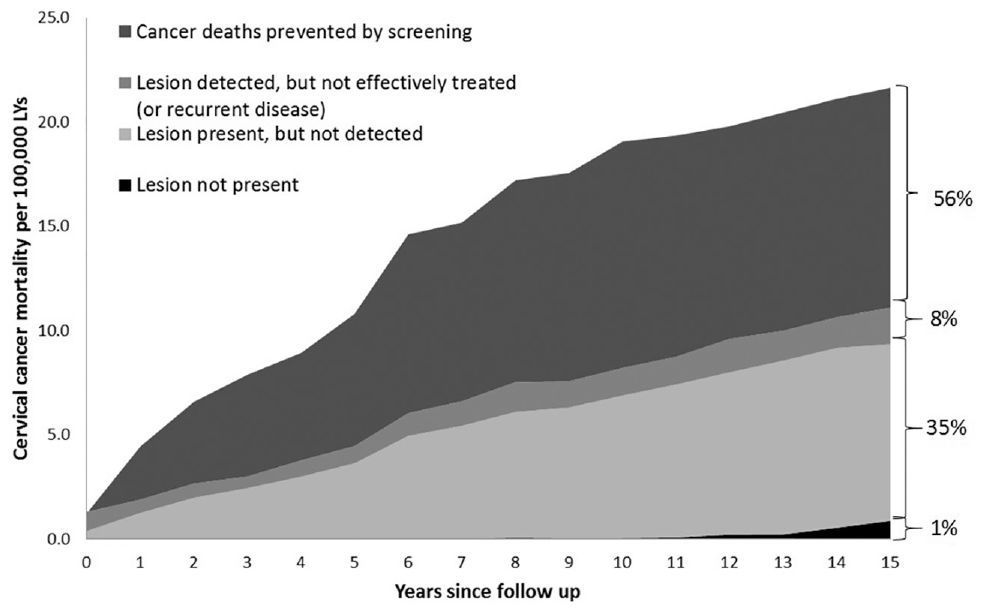
Illustrative example using the Harvard model: cervical cancer mortality rate, divided by explanation (“contributor”) of the mortality, after 1 screening round at age 45 years. Each area in the graph represents a comparison between numbers of cancer deaths in one scenario v. another scenario (see Figure 1). The colors of the graph match the colors of the “women” in Figure 1, and the percentages refer to the attributional fractions presented in Table 2 (mortality in the Harvard model after 15 years of follow-up). The dark gray area (“cancer deaths prevented”; i.e., the difference between “no screening” and “realistic sensitivity and treatment”) is the screening effect (Figure 3 and Table 3).
Incidence Reduction Predictions
Short-term (5-year) effects of screening
When we assumed realistic screening at age 45 years, we found that after 5 years, the proportion of cancer cases prevented differed between the models, ranging from 65% to 81% (Table 2). The short-term differences in prevented clinical cancer cases were primarily caused by differences in assumed test sensitivity; for example, 19% of the prevalent lesions that caused cancer within 5 years were not detected in the Policy1-Cervix model, compared to 26% in MISCAN, 27% in the UMN-HPV CA model, and 32% in the Harvard model.
Attributable Fraction of Cervical Cancer Incident Cases and Deaths by Model a
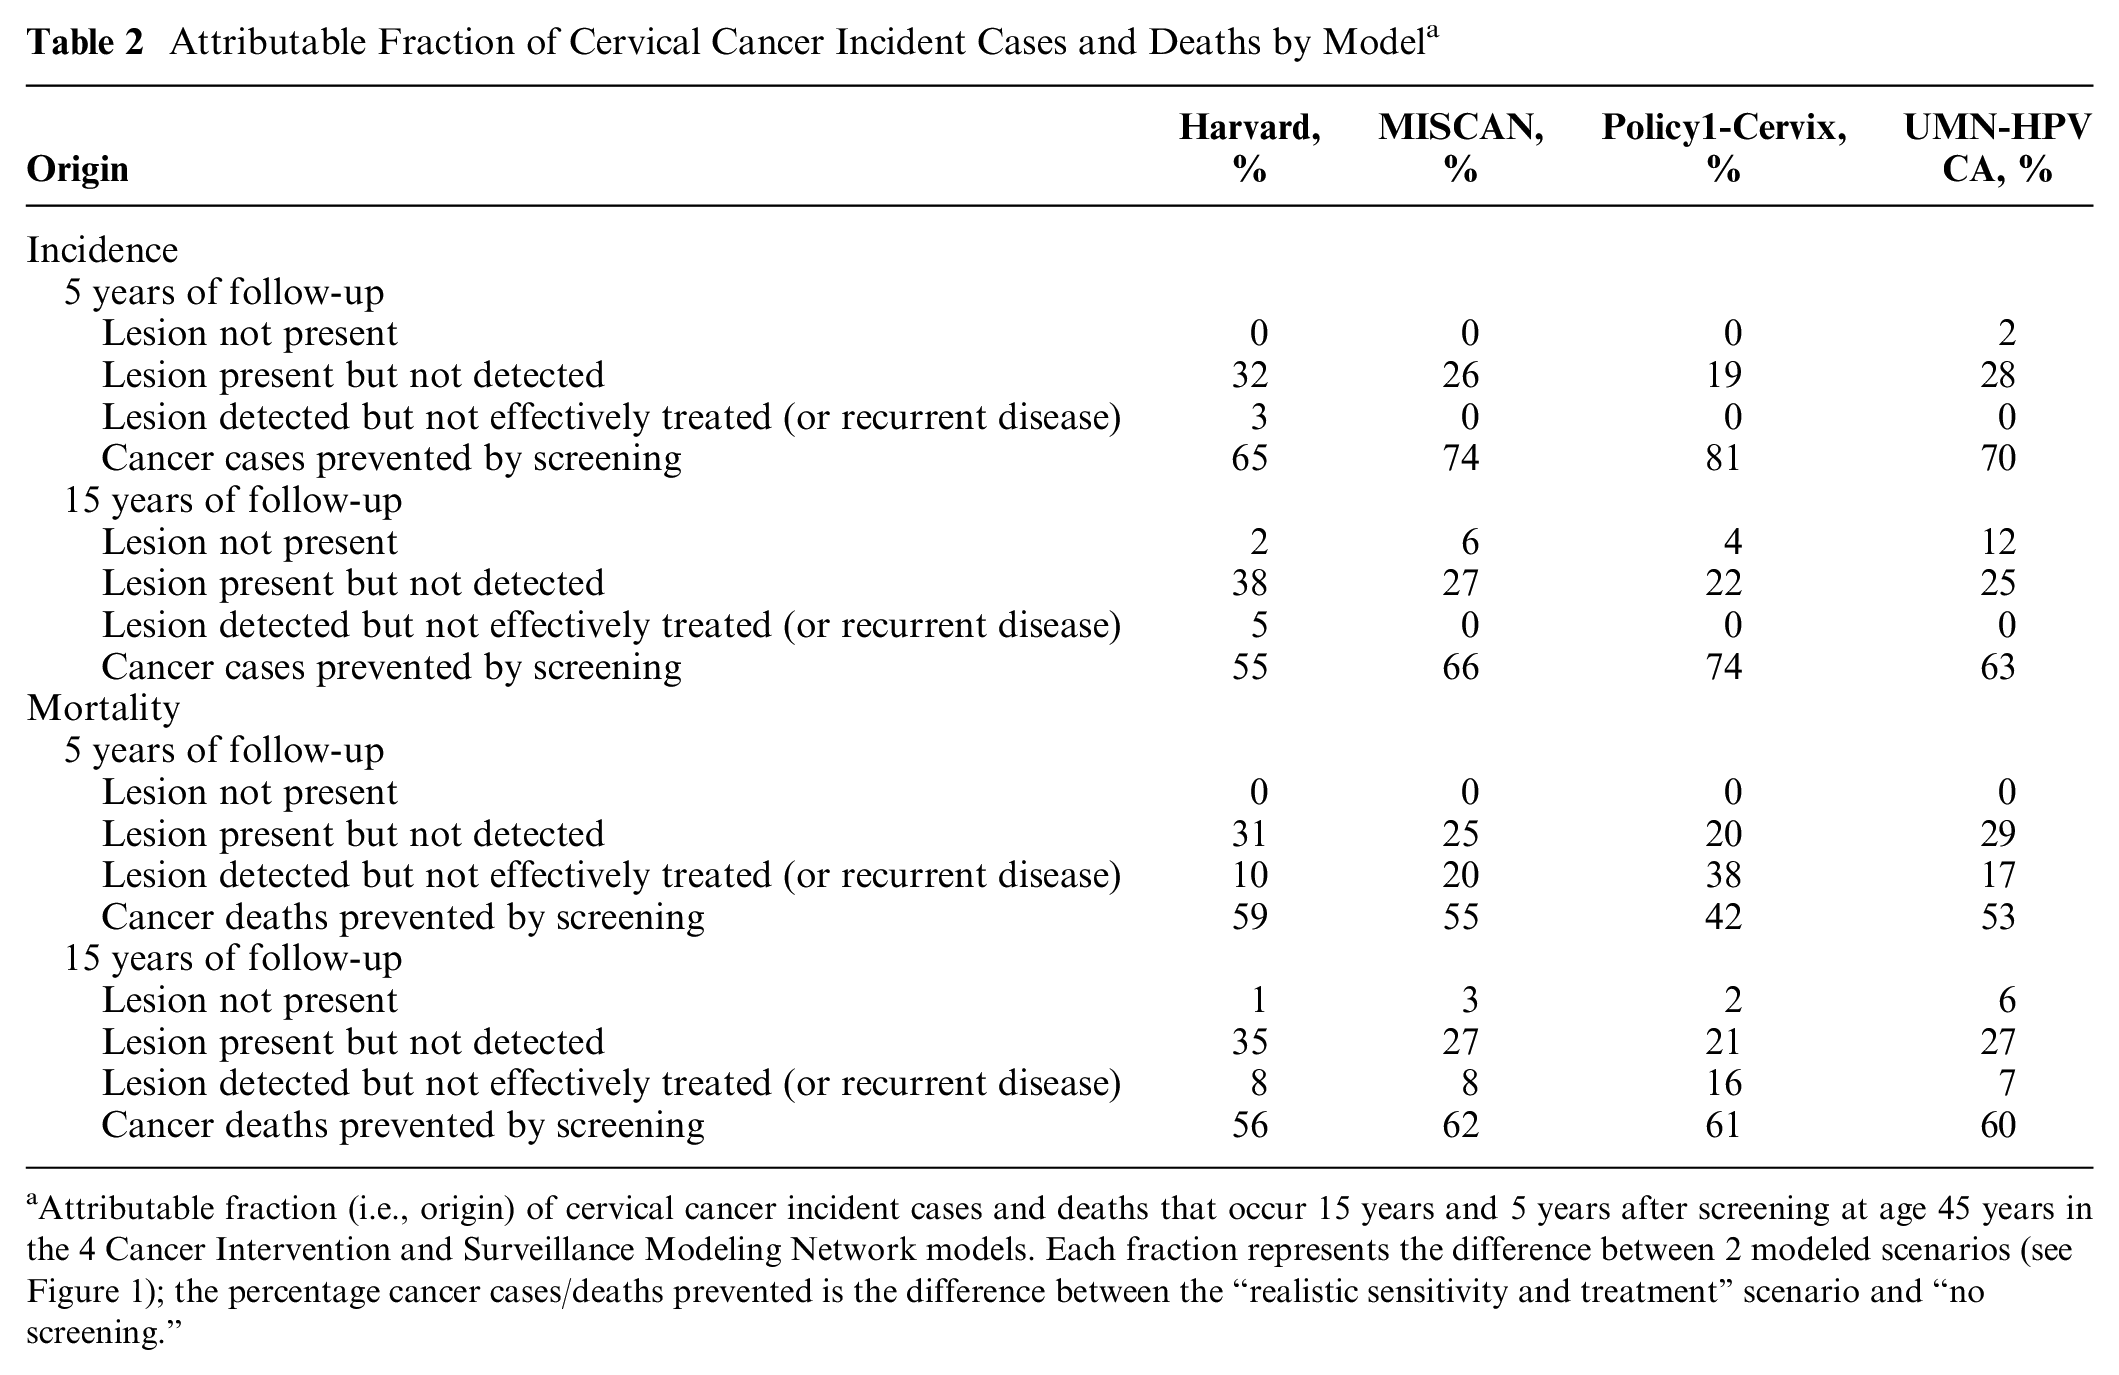
Attributable fraction (i.e., origin) of cervical cancer incident cases and deaths that occur 15 years and 5 years after screening at age 45 years in the 4 Cancer Intervention and Surveillance Modeling Network models. Each fraction represents the difference between 2 modeled scenarios (see Figure 1); the percentage cancer cases/deaths prevented is the difference between the “realistic sensitivity and treatment” scenario and “no screening.”
Long-term (15-year) effects of screening
After 15 years, the proportion of cancer cases prevented ranged from 55% to 74% across the models (Table 2). The long-term differences in the percentages of prevented cancer cases were caused by differences in all 3 possible sources of residual cancer following one-time screening: the lesion that caused cancer prior to age 60 years was not present at age 45 years in 12% of the cases in the UMN-HPV CA model, compared to 6% in MISCAN, 4% in the Policy1-Cervix, and 2% in the Harvard model. Furthermore, the percentage of the lesions present, but not detected, ranged from 22% to 38%. In the Harvard model, 5% of the precancerous lesions that were detected at age 45 years were not treated effectively and caused cancer before the age of 60 (compared to 0% in the other models).
Screening effects over time
The proportion of clinical cancer cases prevented by realistic screening after age 45 years decreased after the screening age in all models (Figure 3). The difference between the models in the reduction of cancer as a result of screening was stable over time.
Mortality Reduction Predictions
Short-term (5-year) effects of screening
After 5 years, the proportion of deaths prevented by screening in each model ranged from 42% to 59% (Table 2). This difference was primarily caused by differences in the effectiveness of treatment (or probability of recurrent disease) of detected lesions (proportion of deaths ranging from 38% to 10%).
Long-term (15-year) effects of screening
After 15 years, the proportion of deaths prevented by screening in each model was comparable and ranged from 56% to 62% (Table 2). In all models, the most important contributor to cancer death after screening was imperfect test sensitivity: in the Harvard model, of the lesions that were present at age 45 years and resulted in a cervical cancer death before age 60 years, 35% were not detected with screening at age 45 years, compared to 21% in the Policy1-Cervix model, 27% in MISCAN, and 26% in the UMN-HPV CA model. Of the detected lesions that resulted in a cervical cancer death before age 60 years, 16% could not be successfully treated (or recurrent disease occurred) in the Policy1-Cervix model, compared to only 8% in MISCAN and Harvard and 7% in UMN-HPV CA.
Screening effects over time
The proportion of cancer deaths prevented by realistic screening after age 45 years increased rapidly after the screening age in all models (Figure 3); however, in the Harvard model, the maximum preventable proportion was reached more rapidly (after approximately 3 years) compared to the other models (approximately 10 years for UMN-HPV CA, 9 years for Policy1-Cervix, and 5 years for MISCAN). As a result, the attributable fractions of cervical cancer death for the different origins vary in time between the 4 different CISNET models (Table 2).
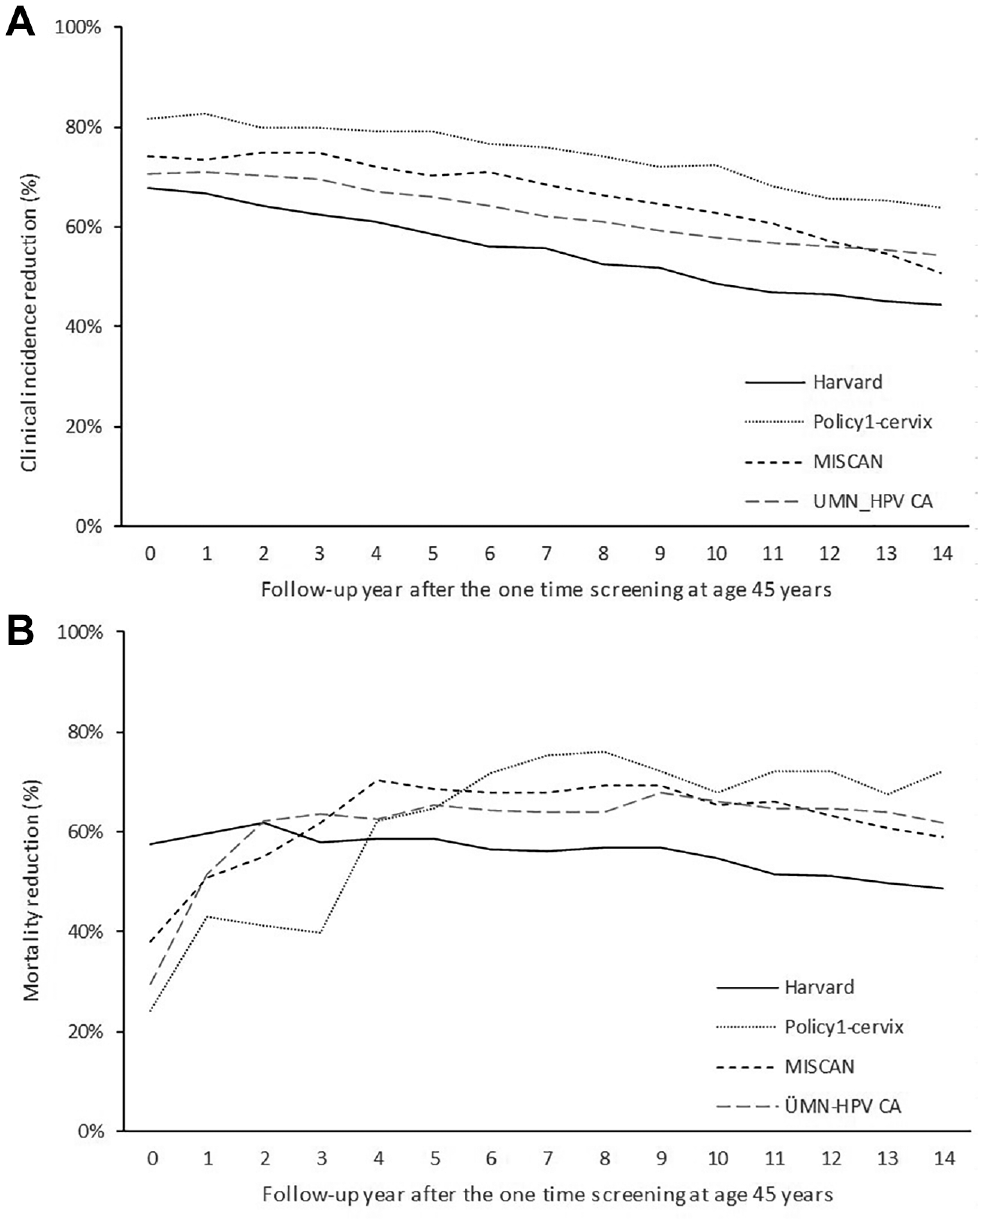
Screening effects in 4 different models (refers to dark gray area in Figure 2, the illustrative example): reduction in clinical incidence (A) and incidence-based mortality (B) after one-time realistic screening at age 45 years for the 4 different models.
Discussion
This study is the first to apply the MCLIR method to illustrate how model structure and assumptions affect cervical cancer incidence and mortality predictions. To understand variations in model estimates of screening effects, the analysis decomposed the relative contributions of model-specific structures and assumptions regarding the preclinical duration of cervical lesions, the ability of a screening test to detect lesions, and the role of treatment of cervical lesions and their subsequent recurrence after treatment as contributors to cervical cancer incidence and mortality predictions.
The independently developed models showed similar long-term reductions in cervical cancer incidence and mortality after a one-time screening test at age 45 years. We found that these reductions were primarily caused by the probability of detecting a present lesion and by the effectiveness of treatment of detected lesions, although the attributional fraction of the 2 was different across the 4 models. Differences across models in the probability to detect a lesion can be explained by the sensitivity of the screening test per health state (which ranges from 70.0% for cervical intraepithelial neoplasia type 3 or worse in the Harvard model, compared to 83.9% in Policy1-Cervix, for example) but also by the prevalence of the different health states at the time of screening. The latter can differ across models because of differences in natural history assumptions. The fraction of cancer cases (and deaths) that occurred within 15 years after screening (i.e., were not yet present at the time of screening) also differed across the models (from 2% to 12%). This difference can be explained by assumptions on durations of the different health states. In separate CISNET analysis, we showed that the median time from HPV acquisition to cancer detection ranged from 18.0 to 26.0 years across the 4 models. 9 Furthermore, we found that the short-term reductions in cervical cancer deaths were different across the models. This variation is mainly explained by differences in the effectiveness of treatment of detected cancers (attributional fraction ranged from 10% to 38%), which is the effect of the stage distributions of cancers detected without screening (clinically) and with screening, as well as the different survival probabilities per stage (Table 1).
Uncertainty on Unobservable Model Inputs and Structures
There is limited knowledge of certain model inputs and structures, because the underlying natural history processes and parameters are unobservable in the real world. First, the absolute test sensitivity of cytological screening has never been examined in a randomized clinical trial in a high-income country, and Pap characteristics have been shown to be highly heterogeneous across settings. 10 Furthermore, since opportunistic cervical cancer screening was already introduced decades ago in most countries, including the United States, 11 information on national cervical cancer incidence and mortality before the introduction of screening is lacking in most high-income countries. As a result, the effect of cervical cancer screening on cervical cancer incidence and mortality is somewhat uncertain. Second, the preclinical duration for lesions that caused cervical cancer incident cases and deaths (i.e., dwell times) cannot be observed using epidemiological data. To estimate the preclinical durations, statistical models have been used. An evaluation of British Columbia data 12 showed that, after correcting for lead time bias, a median duration of 15 years was estimated from carcinoma in situ to invasive cancer. 13 More recently, longer durations were estimated using statistical models that included HPV.14,15 Third, the rate of successful treatment and recurrence after treatment for detected cervical lesions depends on the grade of the lesion as well as the assumptions on loss to follow-up of diagnosed women, sensitivity of diagnostic colposcopy, and type of treatment modality. Most models assumed a 100% success rate for treatment of precancerous lesions, but some assume a certain risk of recurrence. Survival for invasive lesions is based on observed survival rates from cancer registries (Table 1).
Because it is highly unlikely that new data on these 3 issues will become available, the way to handle uncertainties in model estimates is to perform sensitivity analyses to investigate the robustness of the results.
Limitations
Usually, models are characterized by describing the modeling approach, model inputs, and assumptions. In this study, we examined model outcomes to provide insight into the mechanics of incidence and mortality predictions. Several caveats should be considered in evaluating this method. First, the effect of a single screen on cervical cancer incidence and mortality is not the same as the effect of repeated screening over decades, nor does it capture a common context for evaluations in high-income countries, which involves evaluating the impact of changes to screening (e.g., the introduction of HPV testing) in the context of long-established stable cytology programs. The results in this study are therefore not directly translatable to projections of the effects of a routine screening program on overall cervical cancer incidence and mortality. Second, we chose to present the MCLIR for a single screen at age 45 years because this is approximately in the middle of the recommended cervical screening age range (25–65 years in many high-income countries). However, the relative contributions of the different origins may vary by age. Future work evaluating the MCLIR scenarios at different ages might provide insight into age-specific and between-model differences in lesion inception, progression, and test characteristics and the impact of these on cervical cancer incidence and mortality.
Conclusion and Recommendation
CISNET collaborative modeling predictions are increasingly used by policymakers to inform screening guidelines.16–19 How different models arrive at their predictions of the harms and benefits of screening and treatment may be perceived as opaque due to the complexity of the models. A previous study proposed to include the projected MCLIR as a prediction measure in the description of screening models. 2 A complete description of the structure and inputs of a model is still necessary, but the knowledge about the models generated with MCLIR analyses can help explain model differences in predictions of screening effectiveness.
We showed that 4 independently developed CISNET models showed similar long-term reductions in cervical cancer incidence and mortality, but the relative contributions of the 3 possible factors varied across the models. The differences among the 4 cervical cancer screening models reflect genuine uncertainty on unobservable model inputs and structures. Further sensitivity analyses should be carried out to understand the impact of variability in modeling these uncertainties.
Footnotes
The author(s) declared the following potential conflicts of interest with respect to the research, authorship, and/or publication of this article: IdK, EB, SN, JK, KS, SK, EG, SS, JK, and MvB have no conflict of interests to report.
KC is co–principal investigator of an unrelated investigator-initiated trial of cervical cytology and primary human papillomavirus screening in Australia (“Compass”), which is conducted and funded by the VCS Foundation, a government-funded health promotion charity. The VCS Foundation has received equipment and a funding contribution for the Compass trial from Roche Molecular Systems and Ventana, Inc. However, neither KC nor her institution on her behalf (Cancer Council NSW) receives direct funding from industry for this or any other project. The author(s) disclosed receipt of the following financial support for the research, authorship, and/or publication of this article: Financial support for this study was provided entirely by a grant from the National Cancer Institute as part of the Cancer Intervention and Surveillance Modeling Network (CISNET), grant U01CA199334. The funding agreement ensured the authors’ independence in designing the study, interpreting the data, writing, and publishing the report. Its contents are solely the responsibility of the authors and do not necessarily represent the official views of the National Cancer Institute.