
Abstract
Cost-effectiveness analyses often rely on cohort state-transition models (cSTMs). The cohort trace is the primary outcome of cSTMs, which captures the proportion of the cohort in each health state over time (state occupancy). However, the cohort trace is an aggregated measure that does not capture information about the specific transitions among health states (transition dynamics). In practice, these transition dynamics are crucial in many applications, such as incorporating transition rewards or computing various epidemiological outcomes that could be used for model calibration and validation (e.g., disease incidence and lifetime risk). In this article, we propose an alternative approach to compute and store cSTMs outcomes that capture both state occupancy and transition dynamics. This approach produces a multidimensional array from which both the state occupancy and the transition dynamics can be recovered. We highlight the advantages of the multidimensional array over the traditional cohort trace and provide potential applications of the proposed approach with an example coded in R to facilitate the implementation of our method.
Keywords
State-transition models (STM) are decision models commonly used in cost-effectiveness analysis (CEA) to estimate economic and health outcomes of different strategies over time in discrete time cycles.1,2 In a cohort state-transition model (cSTM), the disease dynamics are captured by distributing a closed cohort among a mutually exclusive and collectively exhaustive set of health states.2–4 The cohort trace is the primary outcome of cSTMs, which comprises the proportion of the cohort in each health state over time (i.e., it summarizes state occupancy).1,5 A limitation of the cohort trace is that it does not keep track of the transitions among health states over time (i.e., the transition dynamics of the cohort). As a consequence, it can only be used to capture outcomes that result from residing in a state for a full cycle by applying the so-called state rewards and does not contain a mechanism to assign transition rewards, which are applied only when specific transitions occur. It also limits the type of epidemiological outcomes that can be obtained from cSTMs. For example, obtaining incidence of a disease requires knowledge of the proportion of the population transitioning from a subset of states without disease to the state(s) representing the disease of interest. 6
To overcome the limitations of the cohort trace, we propose a multidimensional array–based approach that serves as a full summary of cSTM dynamics that complements the already useful cohort trace. The proposed approach, called the dynamics-array approach, allows modelers to efficiently calculate all measures of interest that rely on transition dynamics and at the same time to aggregate all model dynamics into a standard cohort trace.
We start by providing a formal definition of cSTM components and the cohort trace. We complement this standard notation with a description of the detailed transition dynamics. Then, we introduce the multidimensional array structure and show how it can be easily generated. In addition, we illustrate its use to compute a measure of interest that depends on transitions among health states. Finally, we demonstrate the dynamics-array approach with an illustrative example of a cSTM programmed in R7,8 and compare this implementation with the traditional cohort trace approach in a simulation study. The R code is provided in the Supplementary Material and in GitHub (https://github.com/DARTH-git/state-transition-model-dynamics).
Traditional Cohort Trace Approach
We denote the distribution of the cohort across

where the initial state vector
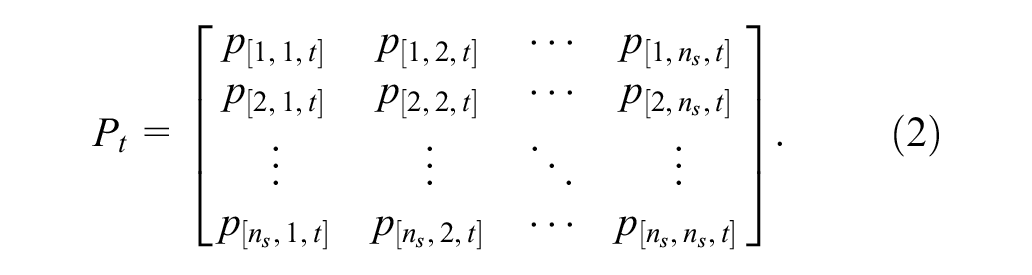
For any
The state vector at cycle

Stacking the state vectors by rows for all
Together, the state vectors
Dynamics-Array Approach
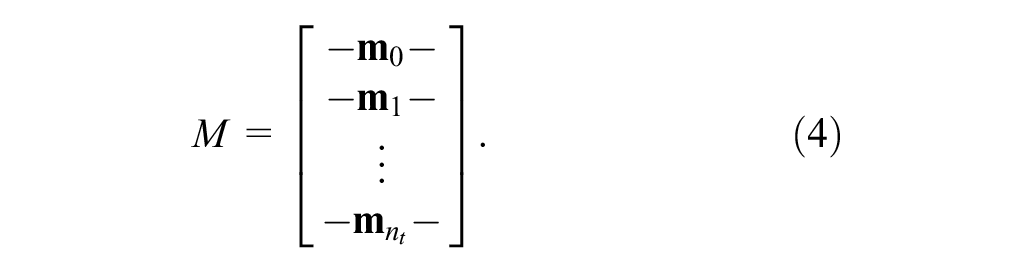
The trace matrix
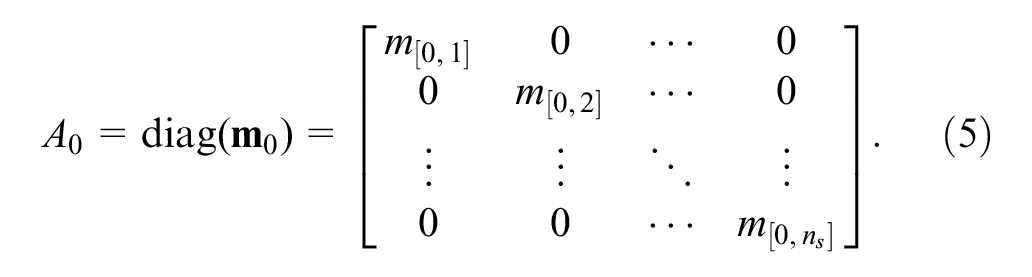
Each subsequent

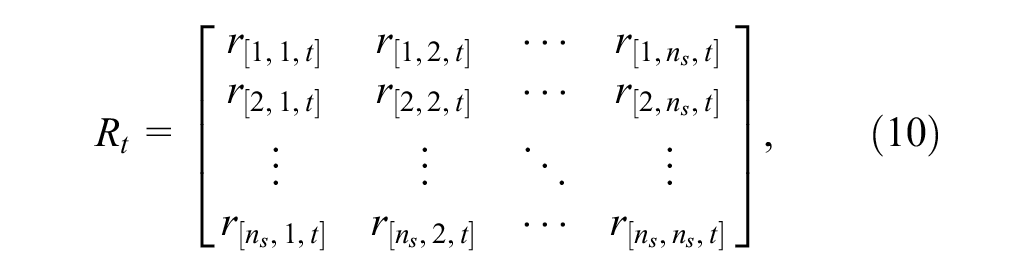
The resulting elements of the tth slice of
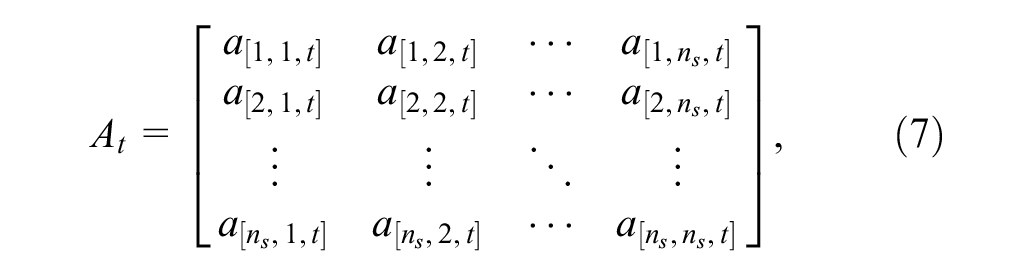
where

where
Figure 1 presents graphically the computation involved in both (a) the traditional cohort trace approach and (b) the dynamics-array approach and shows the structures of (c) the resulting cohort trace
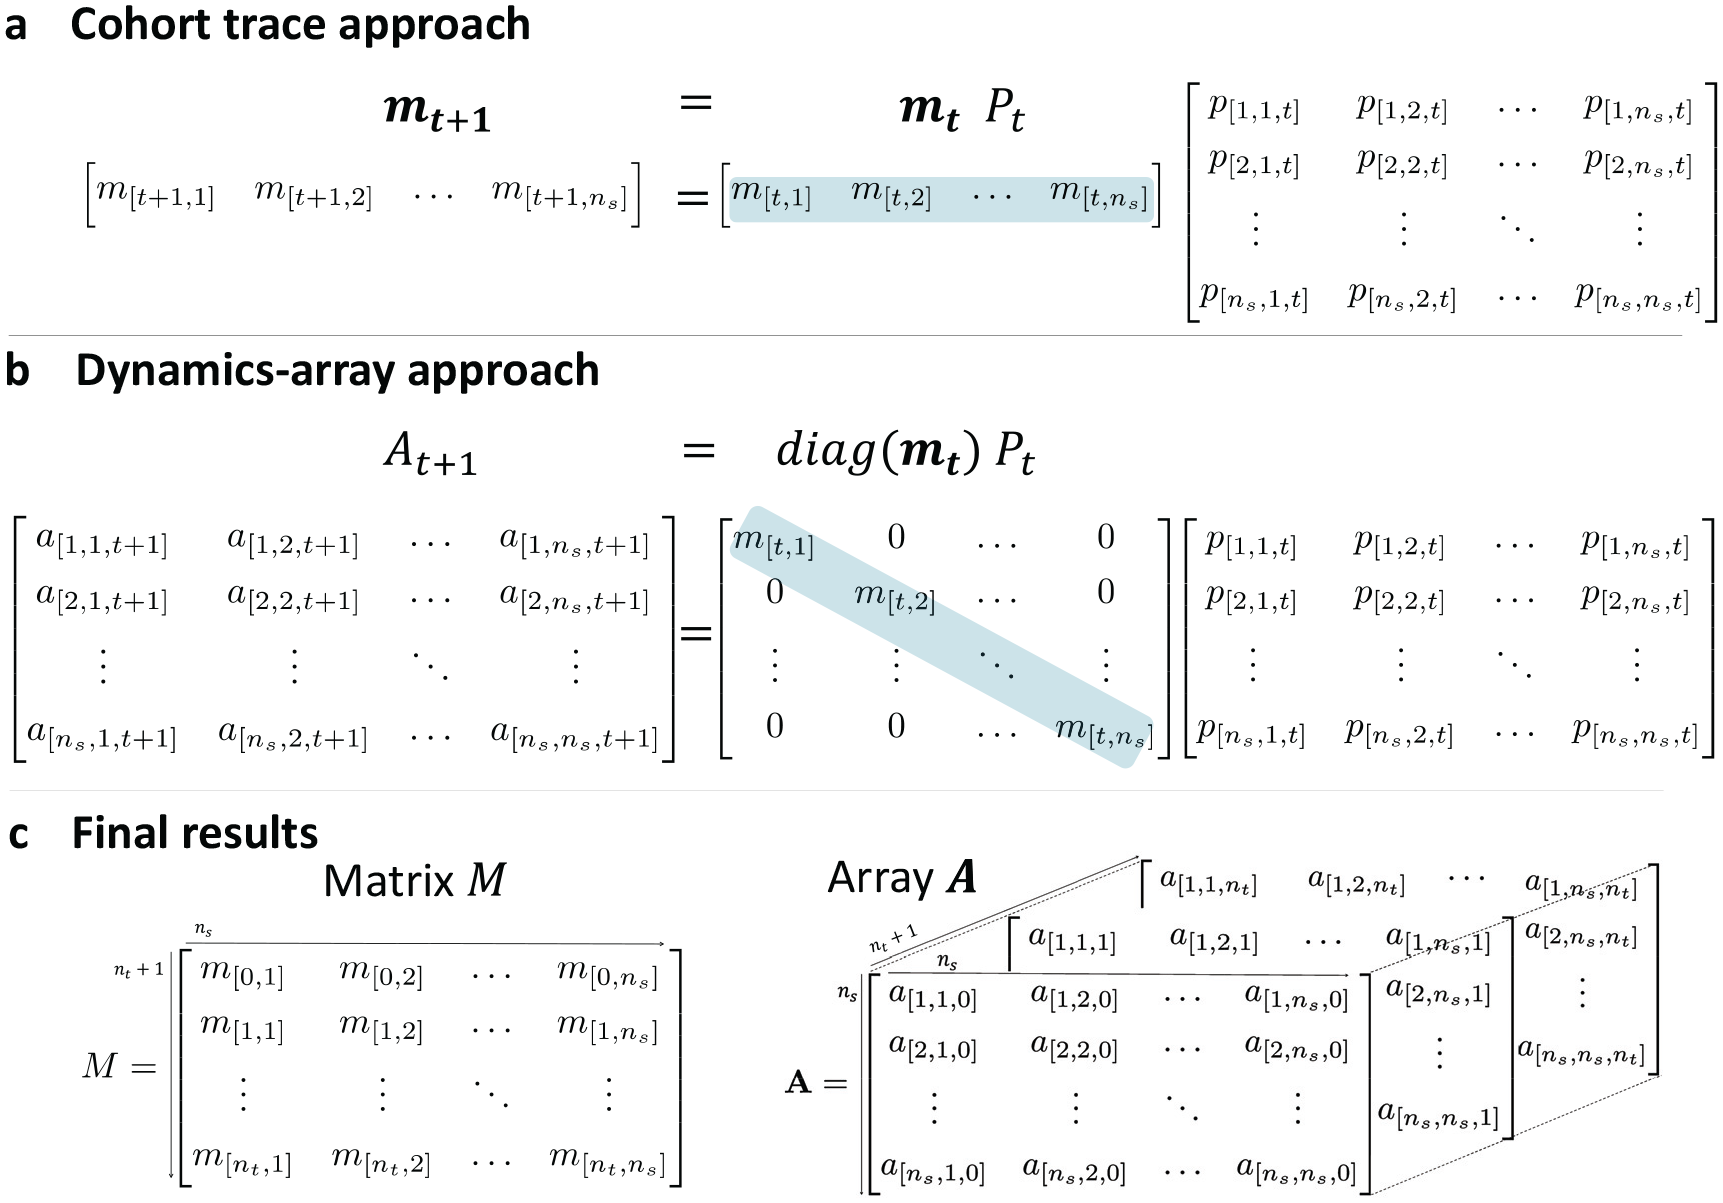
(a) The cohort trace approach computes each row vector
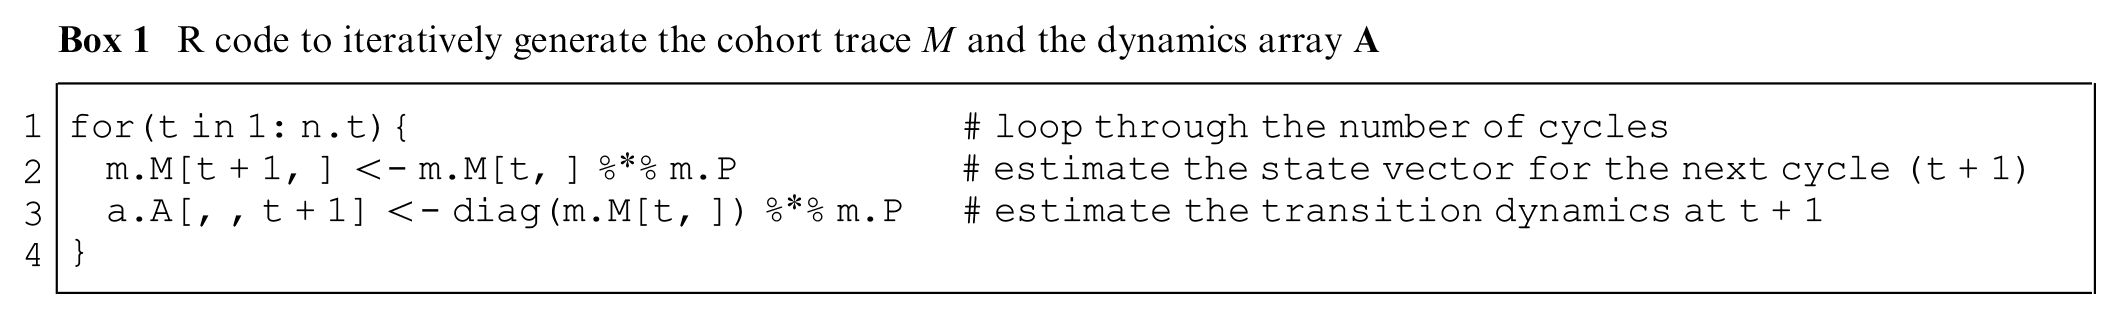
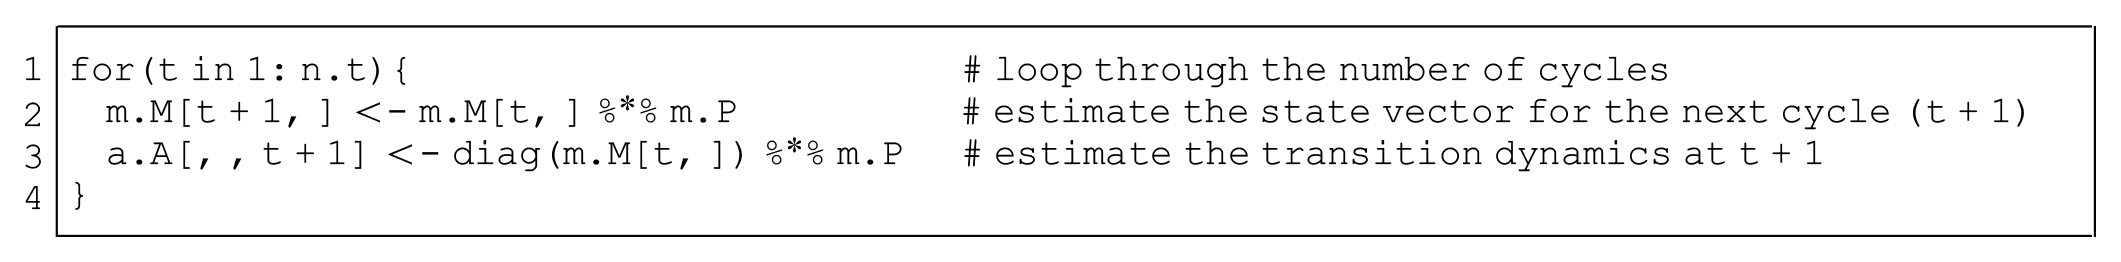
In R, it takes only a few lines of code to generate
R code to iteratively generate the cohort trace
The cohort trace
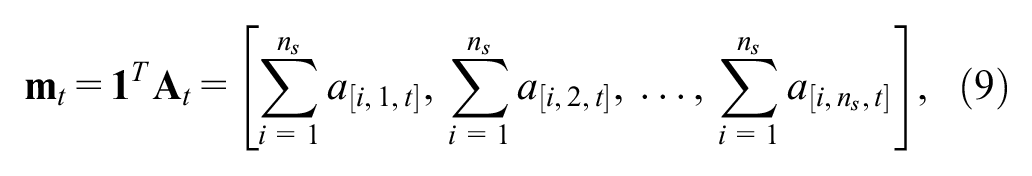
where
Applying State and Transition Rewards
One of the main advantages of
where
The state and transition rewards can be applied to the model dynamics by element-wise multiplication between

With this approach, the state rewards are accounted for at the beginning of the cycle and the transition rewards—assumed to happen at the end of the cycle—are accounted for at the next cycle.
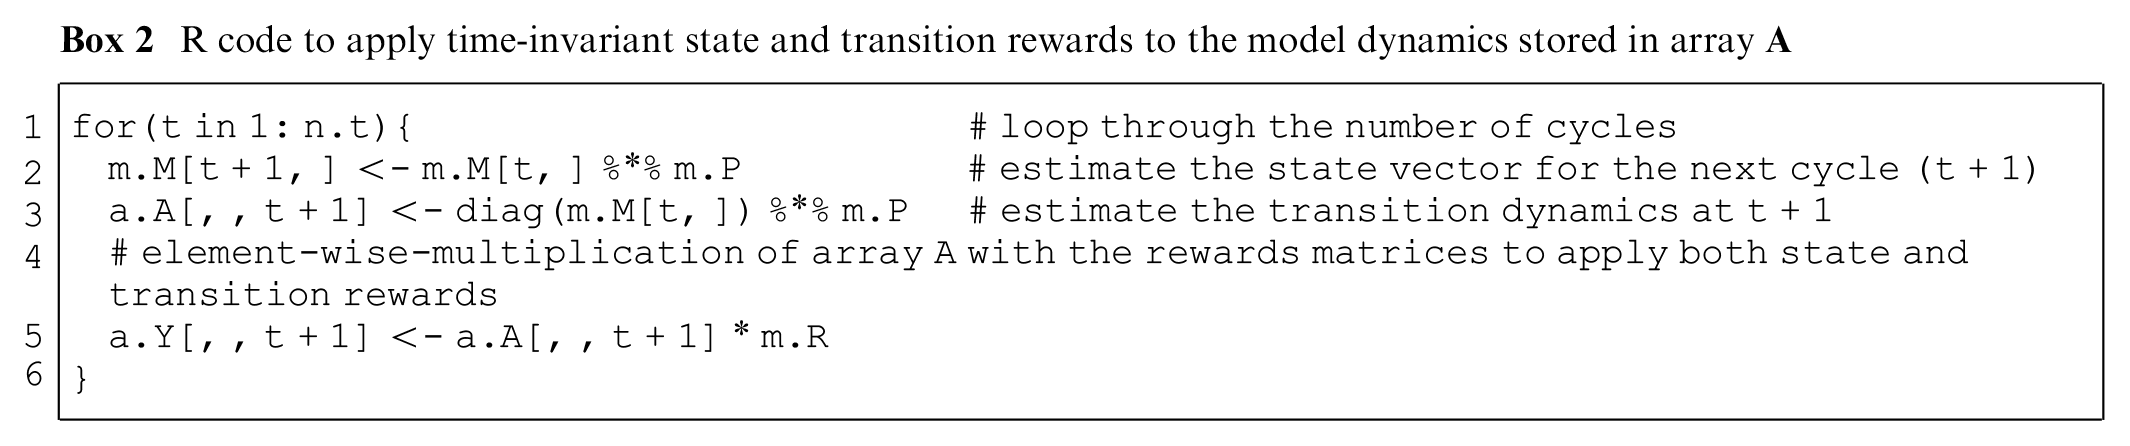
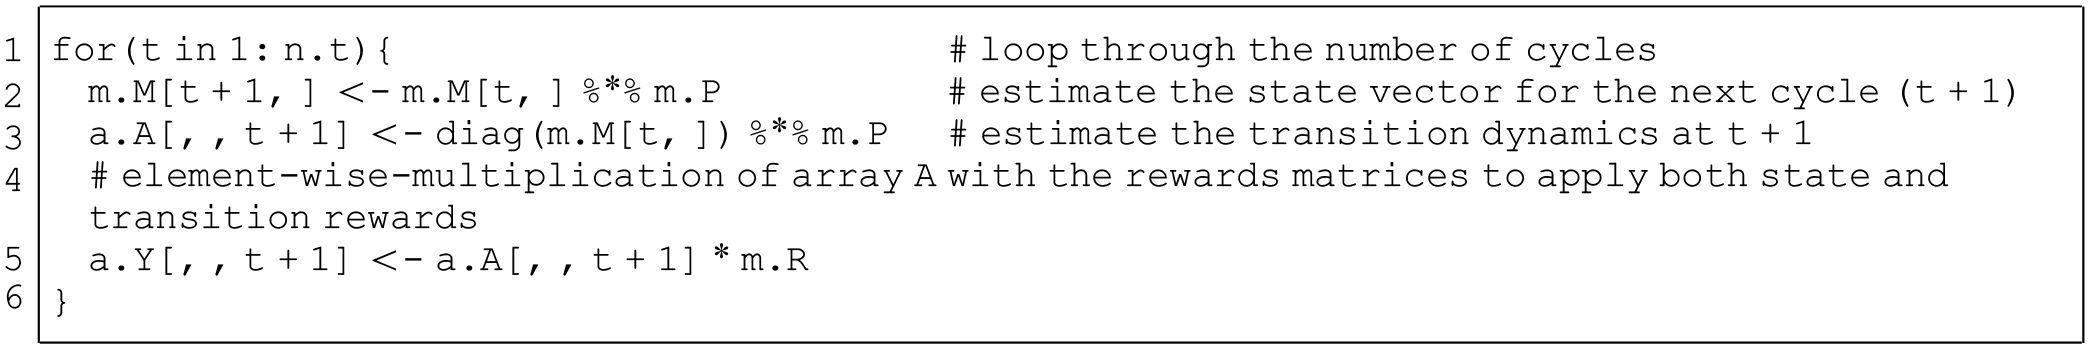
In R, applying these rewards required 1 additional line of code compared with Box 1, as shown in line 5 of Box 2.
R code to apply time-invariant state and transition rewards to the model dynamics stored in array
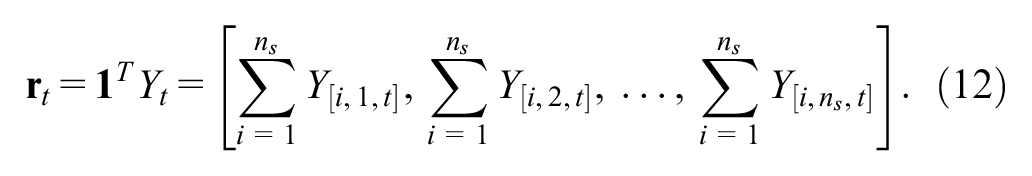
The total rewards for each health state at cycle
Implementation in R Using an Illustrative Example
To facilitate the implementation of the dynamics-array approach, we demonstrate its use with a stylistic healthy-sick-dead 3-state time-homogeneous cSTM example coded in R. 8 The model is used to simulate a cohort of 70-year-old individuals to compute their expected costs and quality-adjusted life years (QALYs) accrued over their remaining lifetime accounting for several transition rewards. Accounting for transition rewards with the traditional cohort trace approach is possible; however, this requires creating additional temporary health states that keep track of the transitions. For our simple 3-state model, this already requires 2 additional temporary states. In more complex models, accounting for transition rewards will result in state explosion, and consequently, it is more likely to make errors while coding these models. The explanation of the state expansion and the R code for the traditional cohort trace approaches for our stylistic model can be found in the Supplementary Material and on GitHub (https://github.com/DARTH-git/state-transition-model-dynamics). GitHub also provides some code that shows that both approaches give identical results.
Comparison of Methods Using a Simulation Study
We conducted a simulation study to compare the computation time and memory requirements of the dynamics-array and traditional cohort trace approaches. We created a full factorial
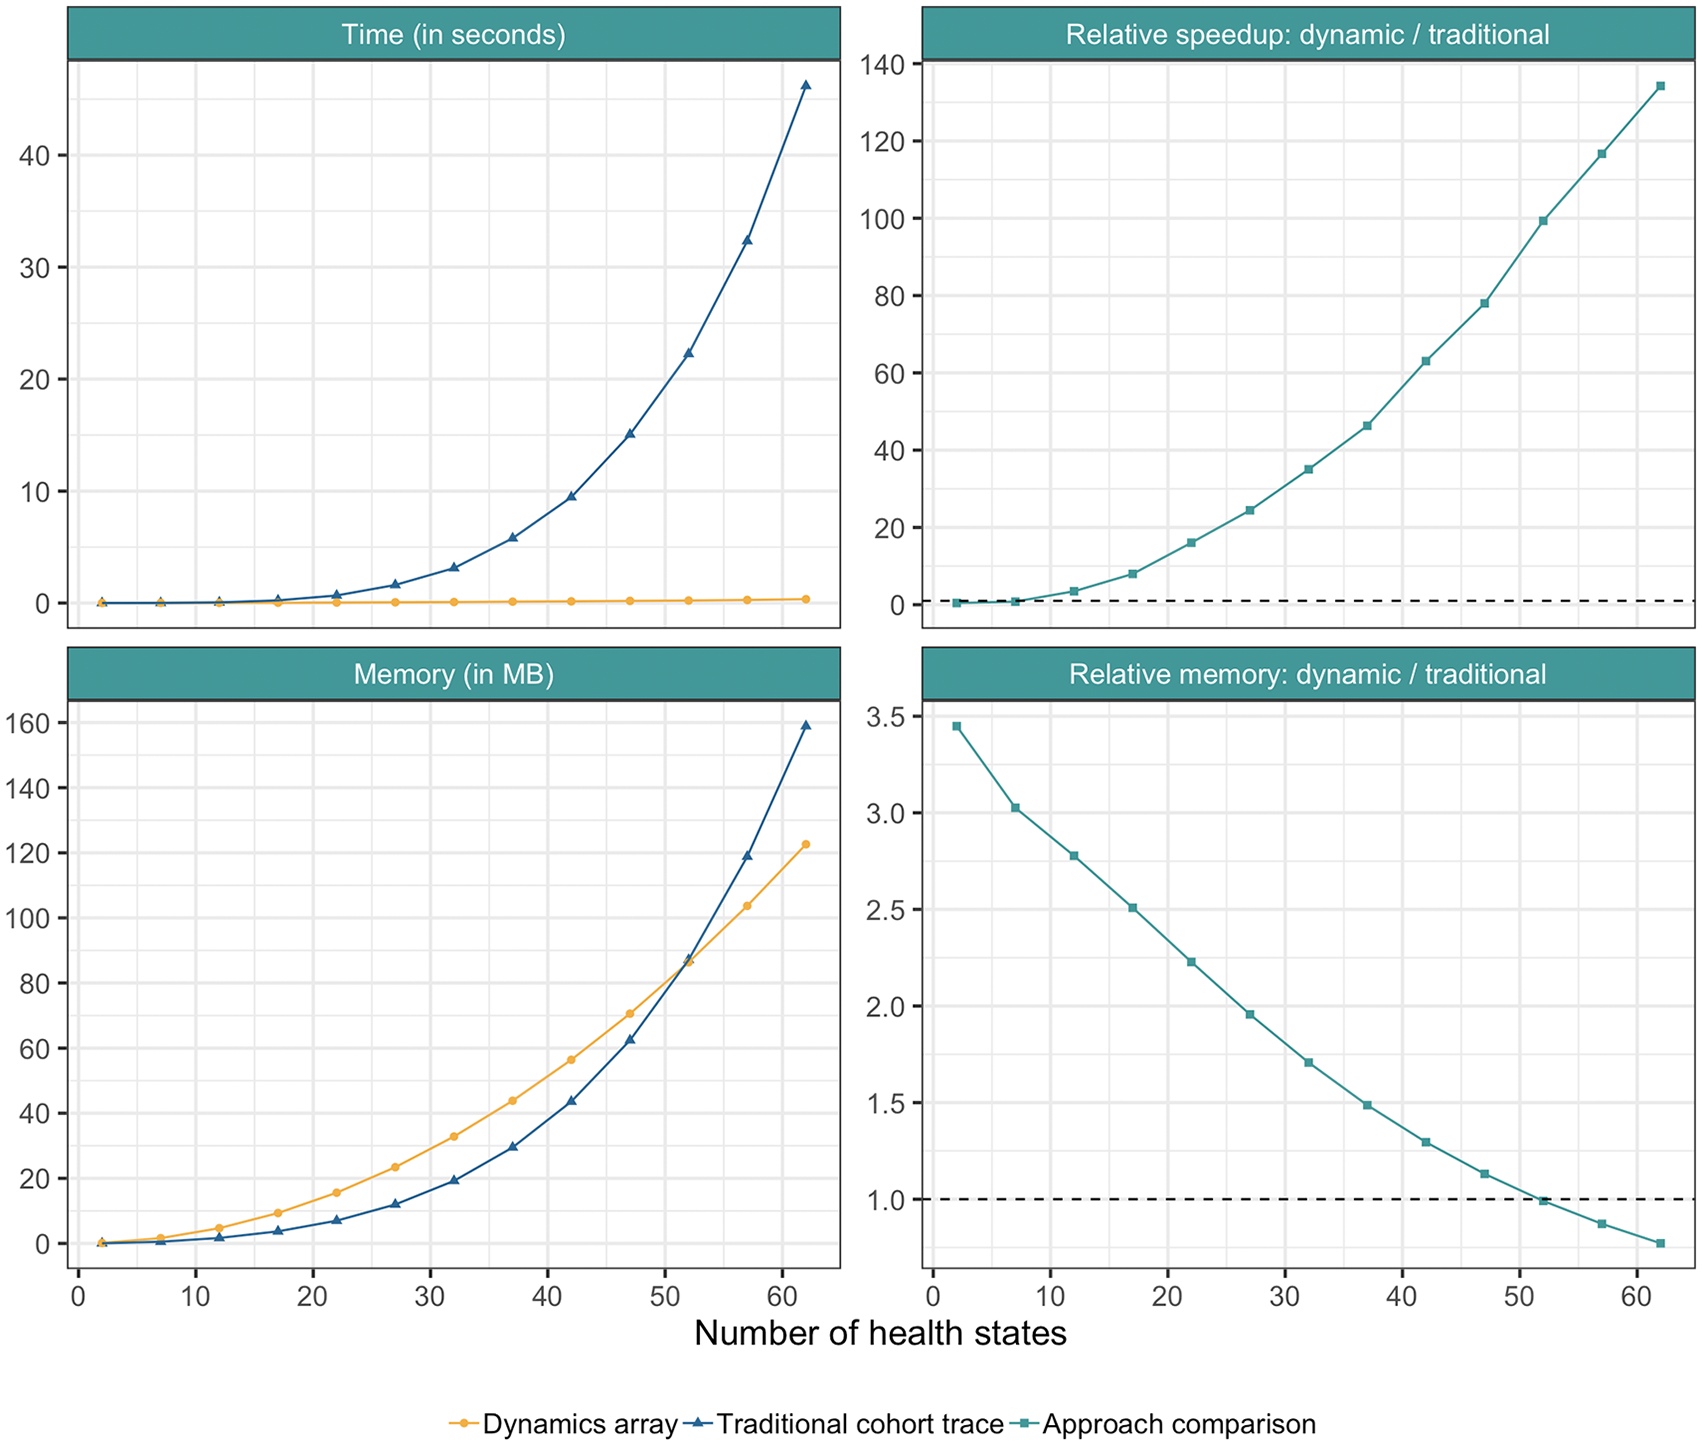
Computation time and memory storage of the 2 approaches as a function of the number of states when running the model for 1320 cycles. The top left panel shows the absolute computation time in seconds of both approaches. The top right panel shows the relative speedup of the dynamics-array approach compared with the traditional cohort trace approach. The horizontal line at y-axis equals 0 indicating that the 2 approaches are equally fast. The bottom left panel shows the absolute memory storage in megabytes (MB) of the 2 approaches, while the bottom right panel shows the relative required memory of the dynamics-array approach compared with the traditional cohort trace approach. The horizontal line at y-axis equals 1 indicates that both approaches required the same memory storage. Above the line the traditional cohort trace requires less memory, while below the line the dynamics-array approach requires less memory. All results are based on the average of 10 simulations. This was done to smooth out the variations caused by the computation time of R.
Estimation of Epidemiological Measures
By obtaining
Consider a cSTM with
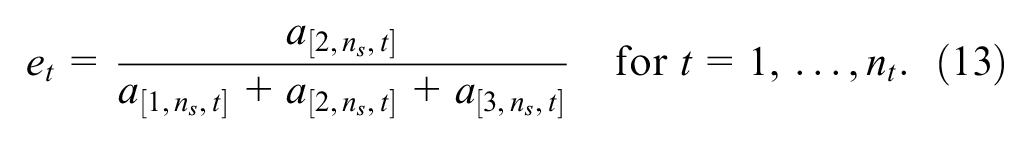
With the traditional cohort trace approach, calculating this ratio would require adding 3 temporary health states to distinguish those that transition to
Discussion
We propose a multidimensional array approach to overcome a limitation of the cohort trace produced by cSTM in not being able to store transition dynamics. The practical application of our approach involves adding a simple step to the traditional cohort trace approach that stores all transitions among health states over time in multidimensional array
Traditionally, researchers have dealt with this limitation of the cSTM cohort trace by creating temporary health states that collect the state-to-state transition information. However, as we showed in our “Comparison of Methods Using a Simulation Study” section, this solution can quickly complicate a model and result in an explosion of the number of health states. Using an individual-based microsimulation STM is another alternative, 1 with considerable implications on computational time. 9
Another method that explicitly keeps track of state-to-state transitions is through a discretely integrated condition-event (discretely integrated condition event [DICE]) simulation.10,11 DICE is a modeling technique that can free up some of the Markov restrictions that makes it possible to explicitly include many events occurring at various times. Although DICE simulation is a well-structured method, and the authors of the DICE papers provided very useful supplementary files to apply the method, we see the dynamics-array approach as a relatively simpler method to compute than DICE to overcome the limitation of the cohort trace on applying transition rewards and generating all the epidemiological outcomes of interest.
A potential limitation of the use of
In conclusion, structuring the output of cSTMs using the dynamics-array approach is an efficient, simple, and convenient method of summarizing the model dynamics. This simple structure allows applying state and transition rewards and obtaining epidemiological measures while still being able to obtain and display the conventional cohort trace.
Supplemental Material
2D_time_memory_relative – Supplemental material for A Multidimensional Array Representation of State-Transition Model Dynamics
Supplemental material, 2D_time_memory_relative for A Multidimensional Array Representation of State-Transition Model Dynamics by Eline M. Krijkamp, Fernando Alarid-Escudero, Eva A. Enns, Petros Pechlivanoglou, M.G. Myriam Hunink, Alan Yang and Hawre J. Jalal in Medical Decision Making
Supplemental Material
3D_memory – Supplemental material for A Multidimensional Array Representation of State-Transition Model Dynamics
Supplemental material, 3D_memory for A Multidimensional Array Representation of State-Transition Model Dynamics by Eline M. Krijkamp, Fernando Alarid-Escudero, Eva A. Enns, Petros Pechlivanoglou, M.G. Myriam Hunink, Alan Yang and Hawre J. Jalal in Medical Decision Making
Supplemental Material
3D_time – Supplemental material for A Multidimensional Array Representation of State-Transition Model Dynamics
Supplemental material, 3D_time for A Multidimensional Array Representation of State-Transition Model Dynamics by Eline M. Krijkamp, Fernando Alarid-Escudero, Eva A. Enns, Petros Pechlivanoglou, M.G. Myriam Hunink, Alan Yang and Hawre J. Jalal in Medical Decision Making
Supplemental Material
arxiv – Supplemental material for A Multidimensional Array Representation of State-Transition Model Dynamics
Supplemental material, arxiv for A Multidimensional Array Representation of State-Transition Model Dynamics by Eline M. Krijkamp, Fernando Alarid-Escudero, Eva A. Enns, Petros Pechlivanoglou, M.G. Myriam Hunink, Alan Yang and Hawre J. Jalal in Medical Decision Making
Supplemental Material
STM_diagram_array – Supplemental material for A Multidimensional Array Representation of State-Transition Model Dynamics
Supplemental material, STM_diagram_array for A Multidimensional Array Representation of State-Transition Model Dynamics by Eline M. Krijkamp, Fernando Alarid-Escudero, Eva A. Enns, Petros Pechlivanoglou, M.G. Myriam Hunink, Alan Yang and Hawre J. Jalal in Medical Decision Making
Supplemental Material
STM_diagram_cohort_approach – Supplemental material for A Multidimensional Array Representation of State-Transition Model Dynamics
Supplemental material, STM_diagram_cohort_approach for A Multidimensional Array Representation of State-Transition Model Dynamics by Eline M. Krijkamp, Fernando Alarid-Escudero, Eva A. Enns, Petros Pechlivanoglou, M.G. Myriam Hunink, Alan Yang and Hawre J. Jalal in Medical Decision Making
Supplemental Material
STM_diagram_traditional_approach – Supplemental material for A Multidimensional Array Representation of State-Transition Model Dynamics
Supplemental material, STM_diagram_traditional_approach for A Multidimensional Array Representation of State-Transition Model Dynamics by Eline M. Krijkamp, Fernando Alarid-Escudero, Eva A. Enns, Petros Pechlivanoglou, M.G. Myriam Hunink, Alan Yang and Hawre J. Jalal in Medical Decision Making
Footnotes
The author(s) declared no potential conflicts of interest with respect to the research, authorship, and/or publication of this article.
The author(s) disclosed receipt of the following financial support for the research, authorship, and/or publication of this article: Dr Alarid-Escudero was supported by a Grant from the National Cancer Institute (U01-CA-199335) as part of the Cancer Intervention and Surveillance Modeling Network (CISNET). Dr Enns was supported by a Grant from the National Institute of Allergy and Infectious Disease of the National Institutes of Health under award no. K25AI118476. Dr Jalal was supported by a Grant from the National Institute of Health (KL2 TR0001856). The content is solely the responsibility of the authors and does not necessarily represent the official views of the National Institutes of Health. The funding agencies had no role in the design of the study, interpretation of results, or writing of the manuscript. The funding agreement ensured the authors’ independence in designing the study, interpreting the data, writing, and publishing the report.
References
Supplementary Material
Please find the following supplemental material available below.
For Open Access articles published under a Creative Commons License, all supplemental material carries the same license as the article it is associated with.
For non-Open Access articles published, all supplemental material carries a non-exclusive license, and permission requests for re-use of supplemental material or any part of supplemental material shall be sent directly to the copyright owner as specified in the copyright notice associated with the article.