
Abstract
Preference studies are increasingly being used to support health policy decision making with regulatory agencies recently expressing interest in preference-based benefit-risk assessment.1–3 Discrete choice experiments (DCEs) are the most commonly used method for eliciting benefit-risk tradeoffs in the health domain. 4 In a DCE, benefit-risk tradeoffs are inferred from a series of choice questions in which participants are asked to choose between 2 or more hypothetical treatment profiles. The utility that a participant obtains from a treatment profile is assumed to be a random variable whose expected value is expressed as a function of the attribute levels that constitute that treatment profile. The regression coefficients of this function are the parameters of interest for the DCE and can be used to calculate attribute weights that express the marginal rate of substitution between 2 attributes.
Because of the limited amount of information that is obtained with each discrete choice question, DCEs often require hundreds of answers for estimating the preference parameters (i.e., the benefit-risk tradeoffs, possibly conditional on a set of explanatory covariates) sufficiently accurately. 5 Moreover, the maximum number of attributes respondents can handle in DCEs is limited; the exact number is context dependent, 6 but most recently published health DCEs have used between 4 and 9 attributes. 7 Finally, although more complex statistical models allow distinguishing and characterizing preference heterogeneity, 8 DCEs rarely allow estimating individual-level utility functions with high precision. 9
Other preference elicitation and modeling methods have been developed to overcome these challenges. Instead of assuming that utility is a latent variable, multicriteria decision analysis is based on normative models of rational choice that state that a subject’s preference structure can be represented by means of a utility function if that subject’s choice behavior satisfies certain basic rationality axioms, such as completeness and transitivity. Several direct valuation methods have been developed to elicit the parameters of this function, which has an additive structure when the attributes under consideration are preferentially independent for the decision maker. The parameters of interest for the additive value model are the attribute weights and the marginal gain or loss in utility from increasing attribute values (i.e., the so-called partial value or utility functions).
Swing weighting and other direct valuation methods can handle a larger number of attributes, and their questioning procedures are designed in such a way that they completely identify an individual’s utility function. However, when direct valuation methods are used, and the analyst wants to generalize from the sample to the population, a statistical model for the data-generating process needs to be specified. Various authors have proposed using the Dirichlet distribution for modeling the distribution of the attribute weights in the population.10–12 The Dirichlet distribution is particularly compelling for this purpose, given its support is the simplex (i.e., the full feasible space of attribute weights when they are normalized to sum to unity). However, there is limited empirical evidence on the use of the Dirichlet distribution to model population preferences, including an understanding of the convergence of the parameter estimates with sample sizes commonly encountered in health preference studies.
This article aims to fill this evidence gap by evaluating the use of the Dirichlet distribution for modeling population preferences. We compare the Dirichlet distribution to the multinomial logit model (MNL) commonly used for modeling preferences as captured with a DCE, by conducting computational experiments with data collected in a previous preference study. We also fit a mixed logit (MXL) model to the data and discuss the differences between the MXL and Dirichlet approaches.
Methods
We conducted a simulation study to compare how the Dirichlet and MNL models differ in their convergence to stable estimates of the population preferences.
We based our computational experiments on an existing study 13 that used an online questionnaire with choice-based matching questions to elicit the preferences of 560 patients with multiple myeloma for hypothetical cancer treatments. The treatments were described in terms of the following 3 attributes: probability of being progression free for 1 year or longer (index: 1; levels: 50%, 60%, 70%, 80%, and 90%), risk of moderate but chronic toxicity (index: 2; levels: 45%, 55%, 65%, 75%, and 85%), and risk of severe toxicity (index: 3; levels: 20%, 35%, 50%, 65%, and 80%). The source data consisted of a set of N = 560 weight vectors (1 for each patient) that were derived from the patients’ responses to the choice-based matching questions. Using these real data, instead of simulated data, may provide better evidence on the methods’ convergence in a realistic setting.
For the Dirichlet model, the utility that a random patient i obtains from a hypothetical treatment j with attribute values
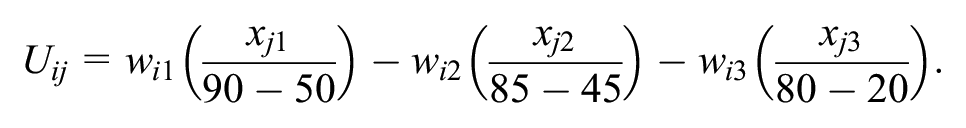
Here, the attribute weights
For comparison purposes, we also fit an MNL model and MXL model to the outcomes of a simulated DCE in the same sample of 560 patients. To obtain discrete choice data sets for fitting the 2 models, we simulated a DCE with the following design. First, we generated an orthogonal design using the
Here,
To determine a suitable scale value
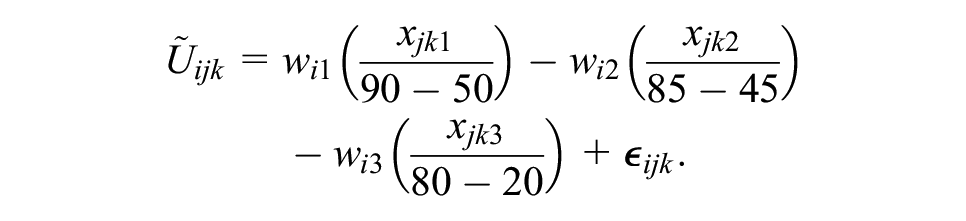
To fit the MNL and MXL models to the outcomes of the simulated DCE in the sample of 560 patients, we used linear models with continuous level encoding to estimate only the coefficients that express marginal rates of substitution between the attributes:

Here, the vector of preference weights
To assess the goodness of fit of the 3 models, the mean normalized attribute weights from the fitted models were compared with the sample mean of the attribute weights in the source data. Standard errors and 95% confidence intervals (CIs) for the mean attribute weights of the MNL and MXL models were obtained using the delta method. 18 The 95% CI for the sample mean and the mean attribute weights of the Dirichlet model were obtained through bootstrapping. For the Dirichlet and MXL model, the fitted distribution of the attribute weights was also visually compared with the actual distribution of the attribute weights in the source data.
To assess the convergence of the MNL and Dirichlet models to the previously fitted population models
By measuring convergence to the (normalized) means of the previously fitted population models rather than to the sample mean of the attribute weights in the source data, we are able to assess convergence under ideal circumstances, where no bias is caused by misspecification of the preference model. In addition to the Euclidean distance, we evaluated the MNL model coefficients’P values to understand when the hypothetical analyst could consider the results to be sufficiently accurate. Finally, we measured maximum acceptable risks of the adverse event (AE) attributes to assess whether the results in terms of key behavioral outputs are different from the results of individual model parameters.
All simulations were implemented in R. The MXL model was estimated using 5000 Halton draws. All program code and the full-source data set are available online. 19
This research has received no external funding.
Results
The fitted Dirichlet, MNL, and MXL population models as well as the sample mean of the attribute weights in the source data are presented in Table 1. All models approximated the sample mean well, and the MNL and MXL models had reasonably good fits (adjusted R2 = 0.12 and 0.13).
Estimates of Population Means of Normalized Attribute Weights Based on the Sample Mean and the Fitted Dirichlet, MNL, and MXL Models, as Well as the Maximum Acceptable Risks of AEs to Increase the Probability of 1-Year PFS by 1%
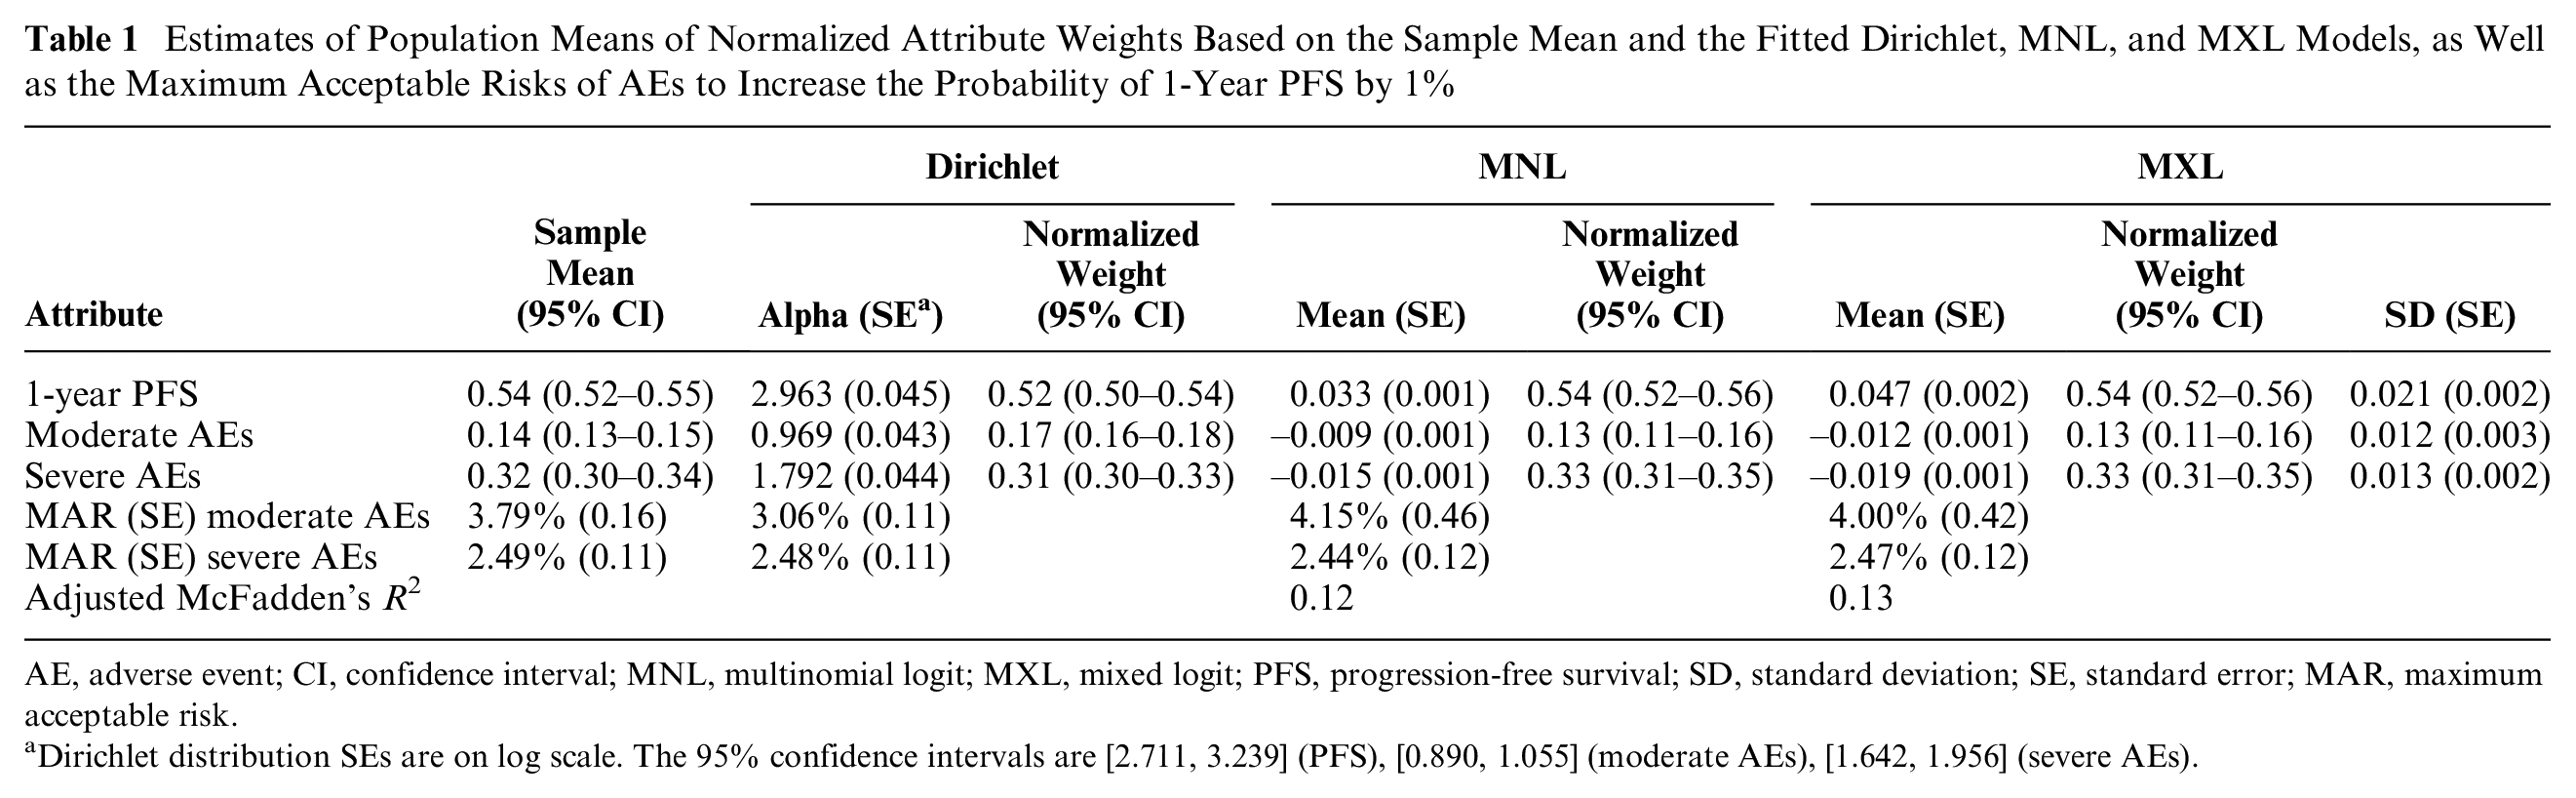
AE, adverse event; CI, confidence interval; MNL, multinomial logit; MXL, mixed logit; PFS, progression-free survival; SD, standard deviation; SE, standard error; MAR, maximum acceptable risk.
Dirichlet distribution SEs are on log scale. The 95% confidence intervals are [2.711, 3.239] (PFS), [0.890, 1.055] (moderate AEs), [1.642, 1.956] (severe AEs).
Figure 1 presents the results from the computational experiments assessing model convergence. For both the Dirichlet and MNL models, the estimated mean normalized attribute weights converged toward the population mean values in Table 1. The Dirichlet model seems to converge better than the MNL model: the mean attribute weights of the fitted Dirichlet models converged to within 0.05 distance of the mean of
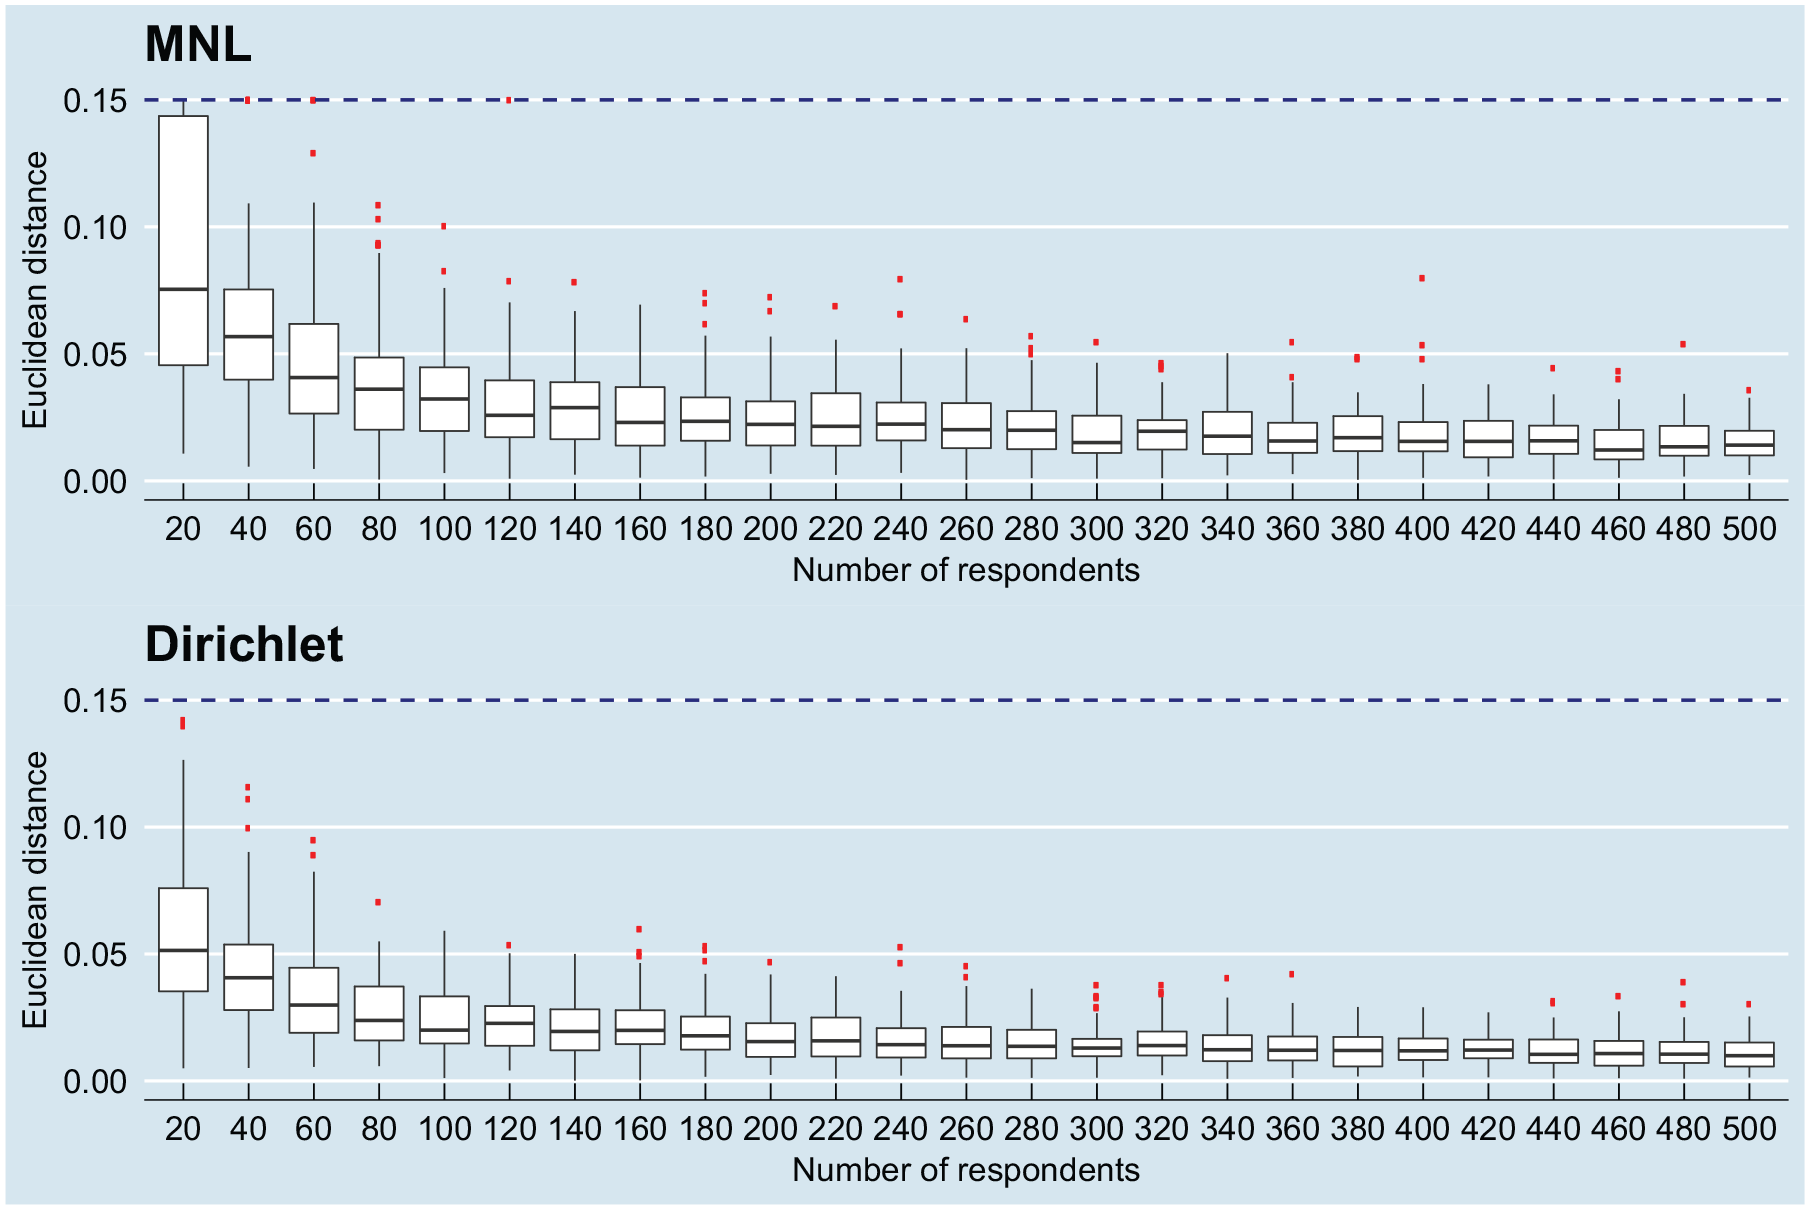
Box plots of convergence of the multinomial logit (MNL; top) and Dirichlet (bottom) models to the fitted population models with varying sample sizes; the dashed blue line indicates the Euclidean distance 0.15 that has been used to truncate the data set.
Figure 2 presents convergence of the MNL model with respect to the P value of the least important attribute (moderate AEs). The results indicate that the MNL model consistently produced significant (P < 0.05) estimates with a sample size of 100 or higher. With sample sizes of 60 to 80, there were some simulations in which the analyst would not be able to conclude the significance of the estimate.
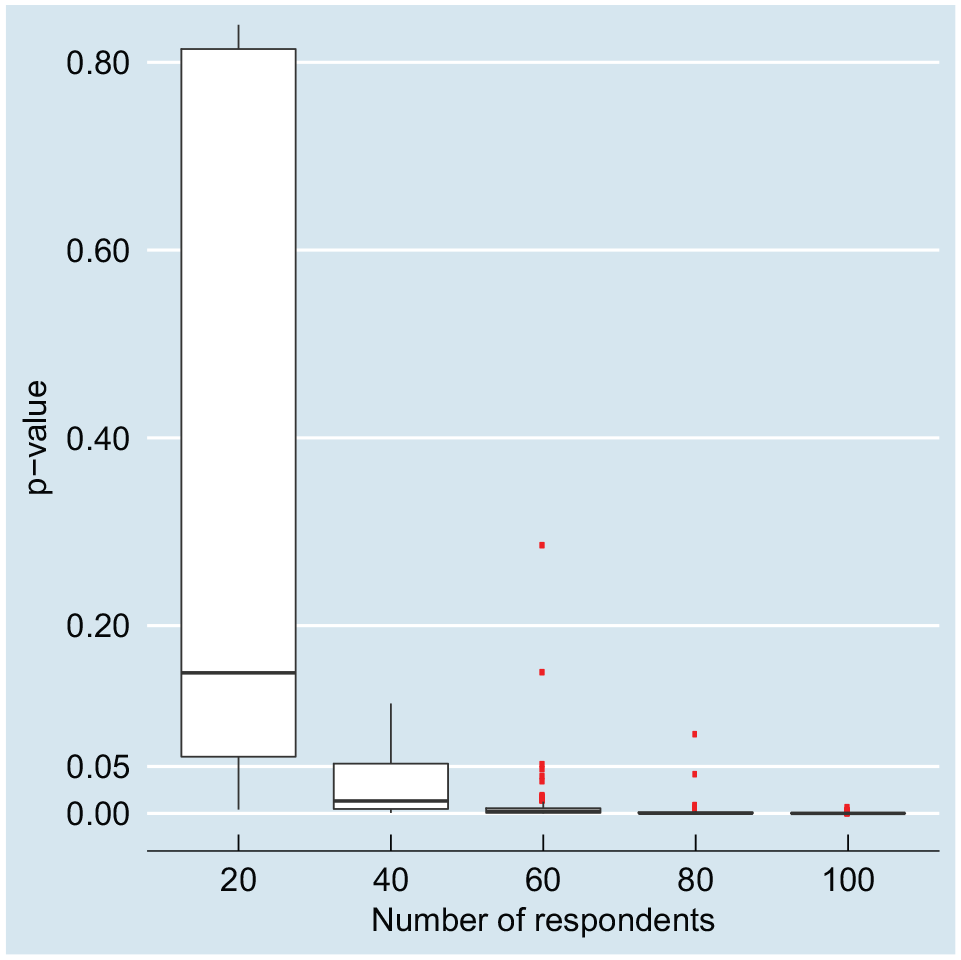
Significance (P value) of the least-important attribute (moderate adverse effects) in the multinomial logit model, with sample size varying from 20 to 100; the P value was <0.05 in all simulations in which the number of respondents was >100.
Figure 3 compares the distribution of the attribute weights in the original study with the distribution of the attribute weights for the fitted Dirichlet and MXL models. Samples drawn from the fitted MXL and Dirichlet models have similar spread over the preference space, although the Dirichlet model seems to have a slightly higher dispersion than the MXL model. Both models seem to describe the source data reasonably well.
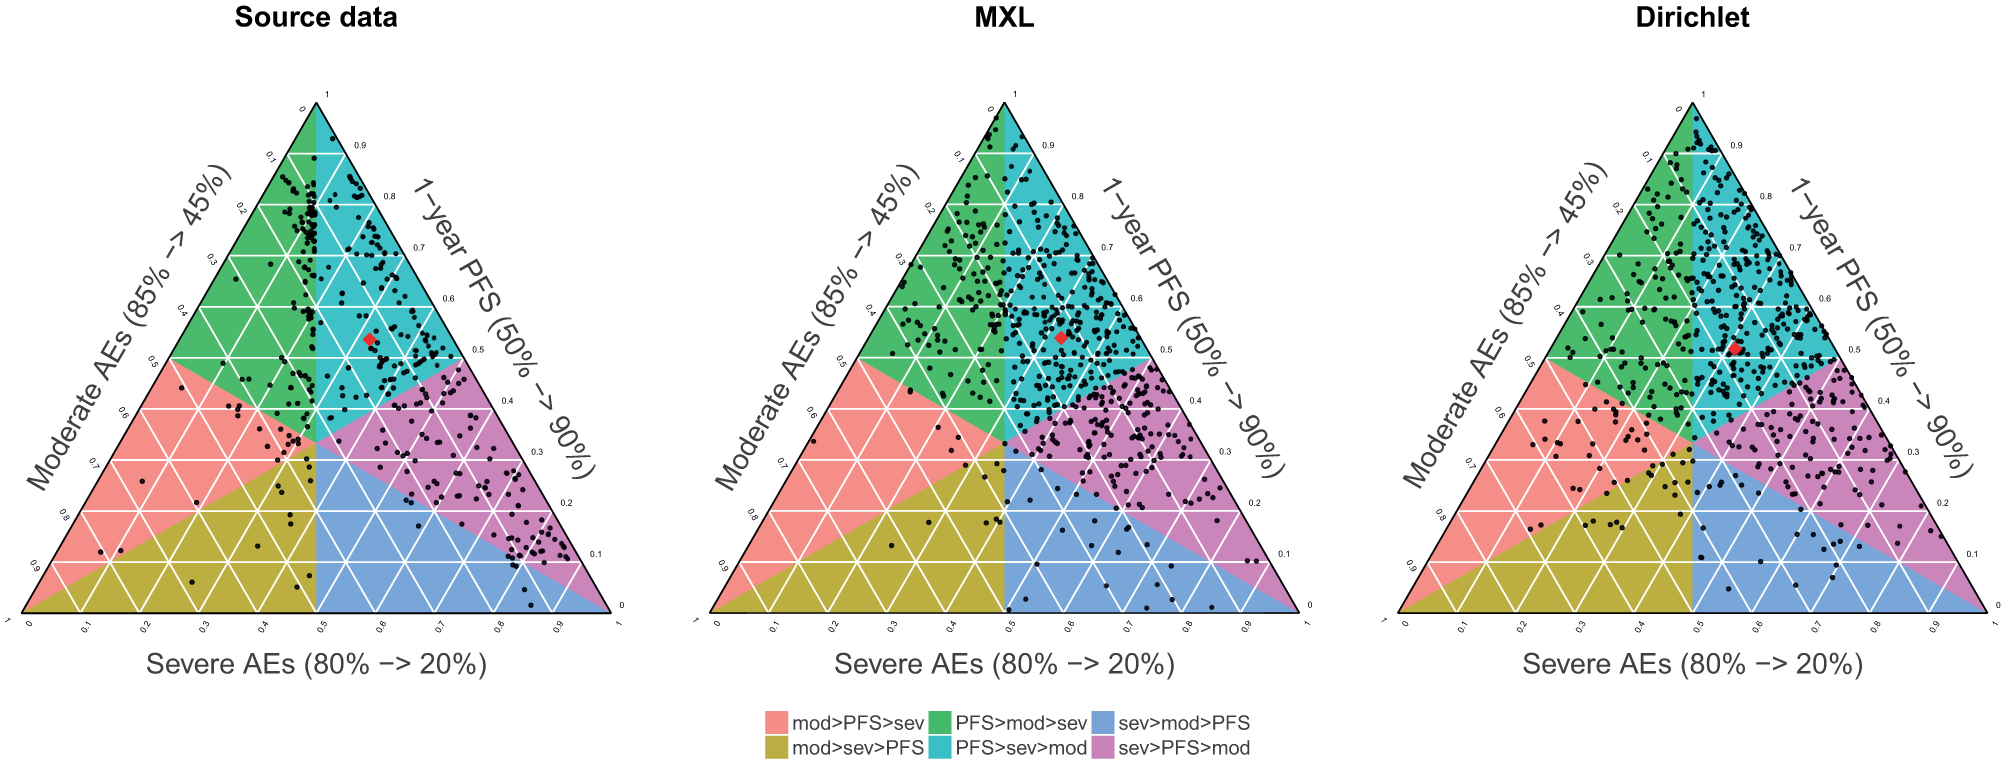
Weights from the original study (left) and the same number of samples (N = 560) from the MXL model (center) and Dirichlet model (right); red dots indicate sample mean (source data) and distribution means (MXL and Dirichlet). AE, adverse event; MXL, mixed logit; PFS, progression-free survival.
Discussion
Our computational experiments demonstrated that the Dirichlet model is likely to have smaller sample size requirements than the MNL model in modeling population benefit-risk preferences. Although we have no quantitative evidence of differences between the Dirichlet and MXL approaches, the full-sample preference distributions seemed similar, which indicates that the Dirichlet distribution may also be appropriate for modeling preference heterogeneity in benefit-risk tradeoffs. Importantly, our results indicate that the Dirichlet distribution is able to represent the population benefit-risk tradeoffs once they are captured using an elicitation technique, such as the choice-based matching that was applied in the source data study. This implication has direct practical relevance for treatment benefit-risk analyses using methods that apply the Dirichlet distribution20,21: our results demonstrate that the full distribution, including the concentration parameter that has previously been undefined, can reliably be estimated with reasonably small sample sizes.
Fitting a Dirichlet distribution with a standard maximum likelihood procedure requires per-respondent tradeoff weights to be available in complete format. These are usually obtained with a direct elicitation procedure, which is generally thought to be more demanding to complete than indirect procedures such as DCEs, as they require preferences to be expressed in precise cardinal terms. Therefore, direct elicitation procedures often require facilitation, making their application a resource-intensive exercise with larger samples. 22 However, once the per-respondent preferences are available, understanding their distribution requires less modeling than what is needed to analyze discrete choice data.
This study has some important limitations. First, we conducted experiments on only a single data set that contained 3 attributes. Most health preference studies are conducted on larger sets of benefit, risk, and process attributes. However, the Dirichlet distribution is well understood, and we would not expect the estimate precision to suffer more from an increase in dimensionality than the MNL model. Furthermore, using only a three-attribute data set has the additional advantage of the preference space being 2 dimensional, and therefore, it can be easily visualized. Future research should assess the Dirichlet approach in studies with more attributes. Second, we did not compare the Dirichlet and MXL models in the experiments because 1) MXL estimation is much more time-consuming than MNL estimation and 2) specifying preferences that adhere to the MXL distributional assumptions would have added an extra layer of complexity to the experiments. Third, we considered the Dirichlet model only for the case in which respondent preferences are available in a complete format. In practice, there may be partial or incomplete preference data for some respondents, such as ranking of the attribute scale swings instead of the exact tradeoff weights. Future research should consider estimation and convergence of the Dirichlet model in such cases.
Supplemental Material
Supplementary_Fig-S1.rjf_online_supp – Supplemental material for From Individual to Population Preferences: Comparison of Discrete Choice and Dirichlet Models for Treatment Benefit-Risk Tradeoffs
Supplemental material, Supplementary_Fig-S1.rjf_online_supp for From Individual to Population Preferences: Comparison of Discrete Choice and Dirichlet Models for Treatment Benefit-Risk Tradeoffs by Tommi Tervonen, Francesco Pignatti and Douwe Postmus in Medical Decision Making
Supplemental Material
Supplementary_Fig-S2.rjf_online_supp – Supplemental material for From Individual to Population Preferences: Comparison of Discrete Choice and Dirichlet Models for Treatment Benefit-Risk Tradeoffs
Supplemental material, Supplementary_Fig-S2.rjf_online_supp for From Individual to Population Preferences: Comparison of Discrete Choice and Dirichlet Models for Treatment Benefit-Risk Tradeoffs by Tommi Tervonen, Francesco Pignatti and Douwe Postmus in Medical Decision Making
Supplemental Material
Supplementary_Fig-S3.rjf_online_supp – Supplemental material for From Individual to Population Preferences: Comparison of Discrete Choice and Dirichlet Models for Treatment Benefit-Risk Tradeoffs
Supplemental material, Supplementary_Fig-S3.rjf_online_supp for From Individual to Population Preferences: Comparison of Discrete Choice and Dirichlet Models for Treatment Benefit-Risk Tradeoffs by Tommi Tervonen, Francesco Pignatti and Douwe Postmus in Medical Decision Making
Footnotes
Acknowledgements
We thank Sebastian Heidenreich (Evidera) for his helpful suggestions on simulating MNL responses and Vibha Shukla (Evidera) for editorial support.
The authors declared no potential conflicts of interest with respect to the research, authorship, and/or publication of this article.
The authors received no financial support for the research, authorship, and/or publication of this article.
Disclaimer
The views presented here are those of the authors and not of their organizations.
References
Supplementary Material
Please find the following supplemental material available below.
For Open Access articles published under a Creative Commons License, all supplemental material carries the same license as the article it is associated with.
For non-Open Access articles published, all supplemental material carries a non-exclusive license, and permission requests for re-use of supplemental material or any part of supplemental material shall be sent directly to the copyright owner as specified in the copyright notice associated with the article.