
Abstract
Prostate cancer is the second most frequently diagnosed cancer in men worldwide. 1 In prostate cancer screening programs, many of the diagnosed tumors are clinically insignificant (overdiagnosed). 2 To avoid further overtreatment, patients diagnosed with low-grade prostate cancer are commonly advised to join active surveillance (AS) programs. In AS, invasive treatments such as surgery are delayed until cancer progresses. Cancer progression is routinely monitored via serum prostate-specific antigen (PSA) measurements, a protein biomarker; digital rectal examination (DRE) measurements, a measure of the size and location of the tumor; and biopsies.
While larger values for PSA and/or DRE may indicate cancer progression, biopsies are the most reliable cancer progression examination technique used in AS. When a patient’s biopsy Gleason score becomes larger than 6 (positive biopsy, cancer progression detected), AS is stopped, and the patient is advised treatment. 3 However, biopsies are invasive, painful, and prone to medical complications.4,5 Hence, they are conducted intermittently until a positive biopsy. Consequently, at the time of a positive biopsy, cancer progression may be observed with a delay of unknown duration. This delay is defined as the difference between the time of the positive biopsy and the unobserved true time of cancer progression. Thus, the decision to conduct biopsies requires a compromise between the burden of biopsy and the potential delay in the detection of cancer progression.
In AS, a delay in the detection of cancer progression of about 12 to 14 months is assumed to be unlikely to substantially increase the risk of adverse downstream outcomes.6,7 However, for biopsies, there is little consensus on the time gap between them.8–10 Many AS programs focus on minimizing the delay in the detection of cancer progression, by scheduling biopsies annually for all patients. A drawback of annual biopsies, and other currently practiced fixed/heuristic schedules,8–10 is that they ignore the large variation in the time of cancer progression of AS patients. While they may work well for patients who progress early (fast progressing) in AS, for a large proportion of patients who do not progress, or progress late (slow progressing) in AS, many unnecessary burdensome biopsies are scheduled. To mediate the burden between the fast and slow progressing patients, the world’s largest AS program, the Prostate Cancer Research International Active Surveillance 11 (PRIAS), schedules annual biopsies only for patients with a low PSA doubling time. 3 For everyone else, PRIAS schedules biopsies at the following fixed follow-up times: year 1, 4, 7, and 10 and every 5 years thereafter. Despite this effort in PRIAS, patients may get scheduled for 4 to 10 biopsies over a period of 10 years. Therefore, compliance for biopsies is low in PRIAS. 3 This can lead to a delay in the detection of cancer progression and reduce the effectiveness of AS.
We aim to better balance the number of biopsies (more are burdensome) and the delay in the detection of cancer progression (less is beneficial) than currently practiced schedules. We intend to achieve this by personalizing the decision to conduct biopsies (see Figure 1). These decisions are made at a patient’s prescheduled follow-up visits for DRE and PSA measurements. To develop the personalized decision-making methodology, we use the data of the patients enrolled in the PRIAS study. We model these data and develop the personalized approach using joint models for time-to-event and longitudinal data.12,13 To compare the personalized approach with current schedules, we conduct an extensive simulation study based on a replica of the patients from the PRIAS program.
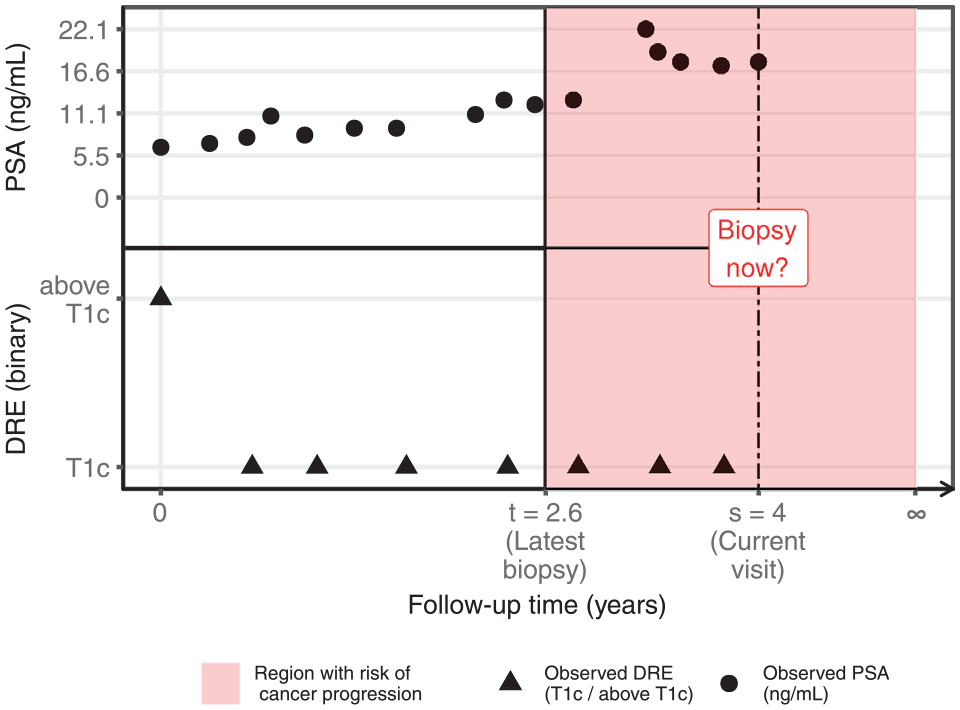
The personalized decision-making problem: available data of a patient
Methods
Study Population
To develop our methodology, we use the data of prostate cancer patients from the world’s largest AS study called PRIAS 11 (see Table 1). More than 100 medical centers from 17 countries worldwide contribute to the collection of data, using a common study protocol and a web-based tool, both available at www.prias-project.org. We use data collected over a period of 10 years, between December 2006 (beginning of the PRIAS study) and December 2016. The primary event of interest is cancer progression detected upon a positive biopsy. The time of cancer progression is the interval censored because biopsies are scheduled periodically. Biopsies are scheduled as per the PRIAS protocol (see the introduction section). There are 3 types of competing events, namely, death, removal of patients from AS on the basis of their observed DRE and PSA measurements, and loss to follow-up. We assume these 3 types of events to be censored observations (see Supplementary Appendix A.5 for details). However, our model allows removal of patients to depend on observed longitudinal data and baseline covariates of the patient. Under the aforementioned assumption of censoring, Figure 2 shows the cumulative risk of cancer progression over the study follow-up period.
Summary Statistics for the PRIAS Data Set
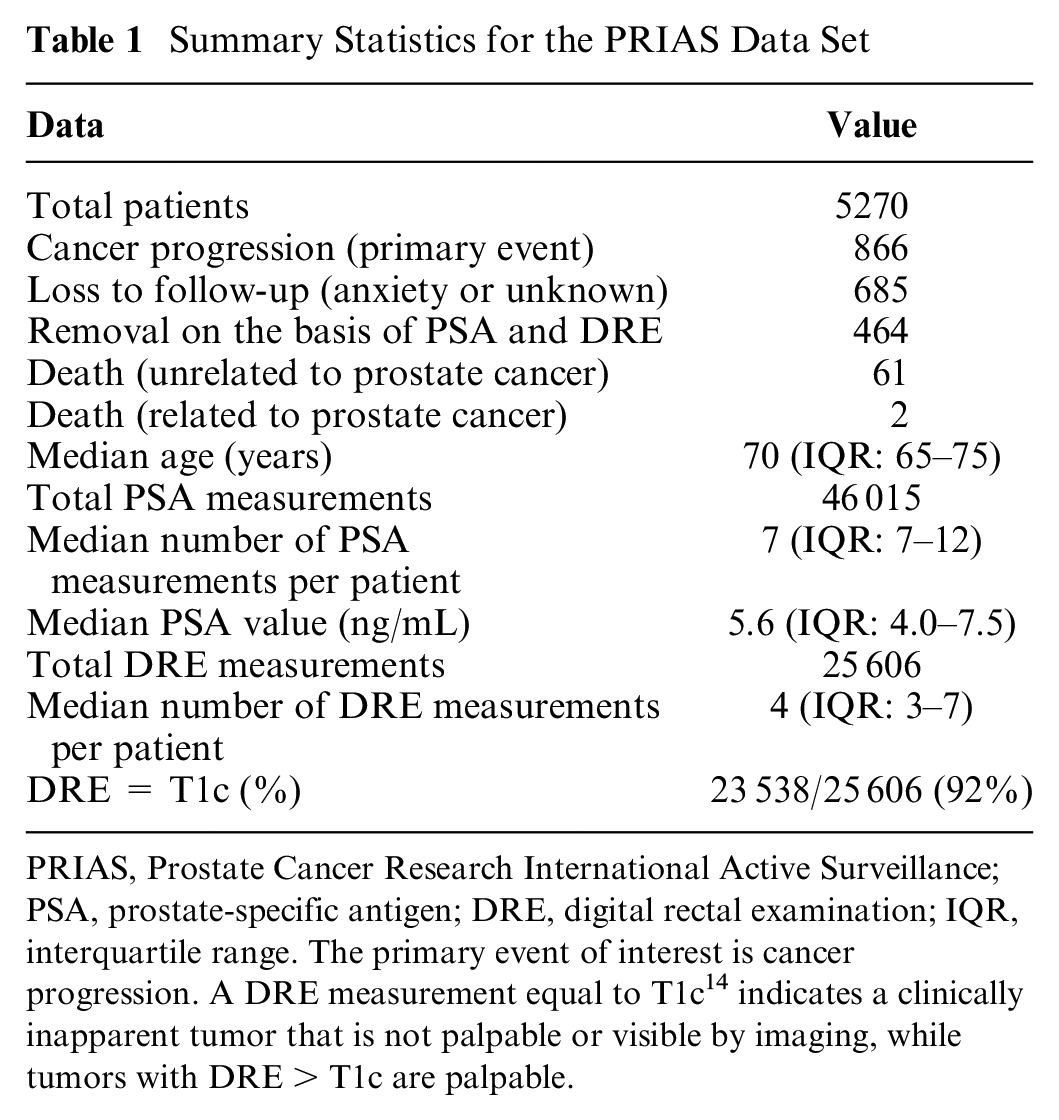
PRIAS, Prostate Cancer Research International Active Surveillance; PSA, prostate-specific antigen; DRE, digital rectal examination; IQR, interquartile range. The primary event of interest is cancer progression. A DRE measurement equal to T1c 14 indicates a clinically inapparent tumor that is not palpable or visible by imaging, while tumors with DRE > T1c are palpable.
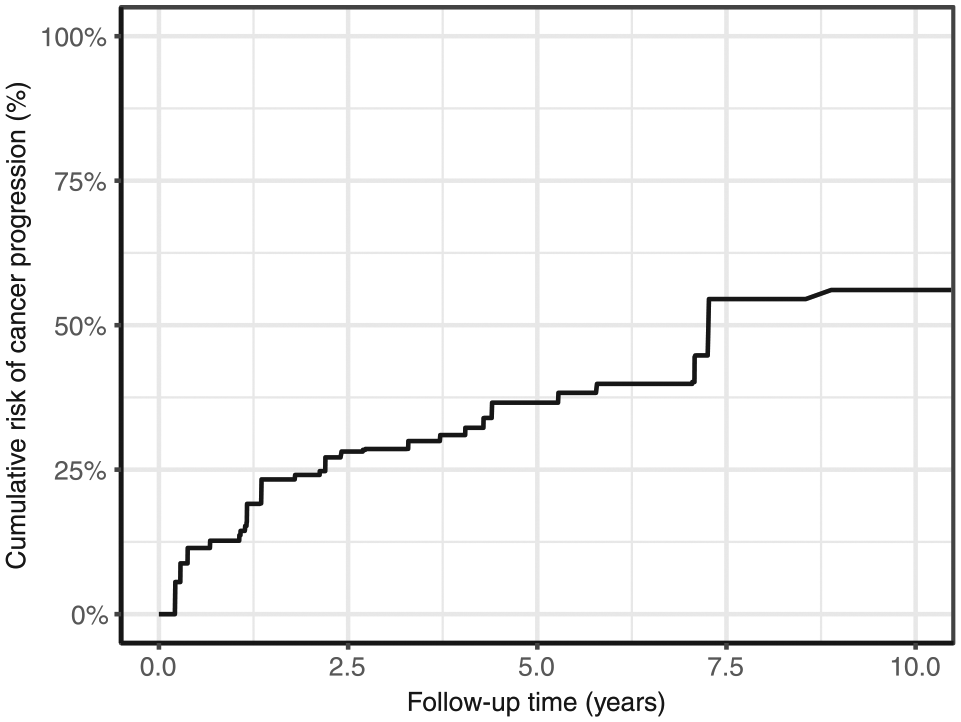
Estimated cumulative risk of cancer progression in active surveillance (AS) for patients in the Prostate Cancer Research International Active Surveillance (PRIAS) data set. Nearly 50% of patients (slow progressing) do not progress in the 10-year follow-up period. Cumulative risk is estimated using nonparametric maximum likelihood estimation, 15 to account for interval censored cancer progression times observed in the PRIAS data set. Censoring includes death, removal from AS on the basis of observed longitudinal data, and patient dropout.
For all patients, PSA measurements (ng/mL) are scheduled every 3 months for the first 2 years and every 6 months thereafter. The DRE measurements are scheduled every 6 months. We use the DRE measurements as DRE = T1c versus DRE > T1c. A DRE measurement equal to T1c 14 indicates a clinically inapparent tumor that is not palpable or visible by imaging, while tumors with DRE > T1c are palpable.
Data accessibility
The PRIAS database is not openly accessible. However, access to the database can be requested on the basis of a study proposal approved by the PRIAS steering committee. The website of the PRIAS program is www.prias-project.org.
A Bivariate Joint Model for the Longitudinal PSA, DRE Measurements, and Time of Cancer Progression
Let
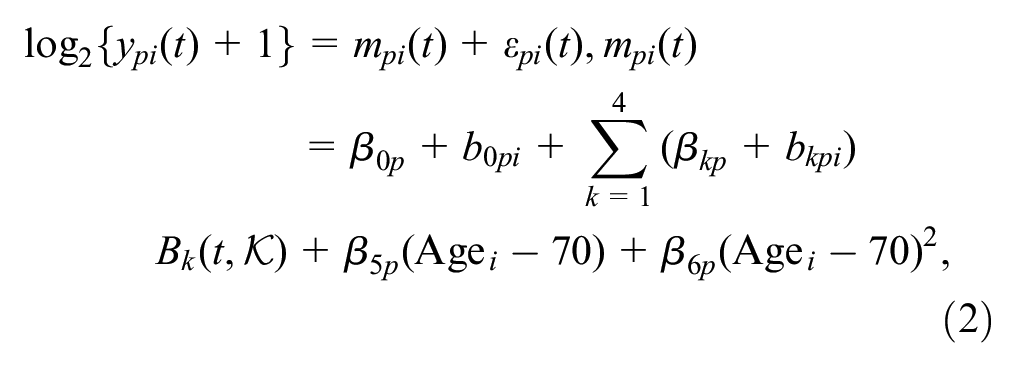
In our joint model, the patient-specific DRE and PSA measurements over time are modeled using a bivariate generalized linear mixed-effects submodel. The submodel for DRE is given by (see Figure 3A)
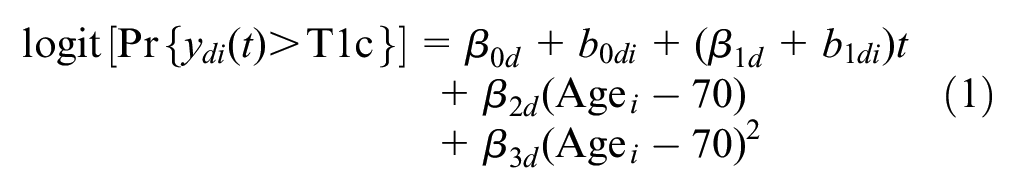
where
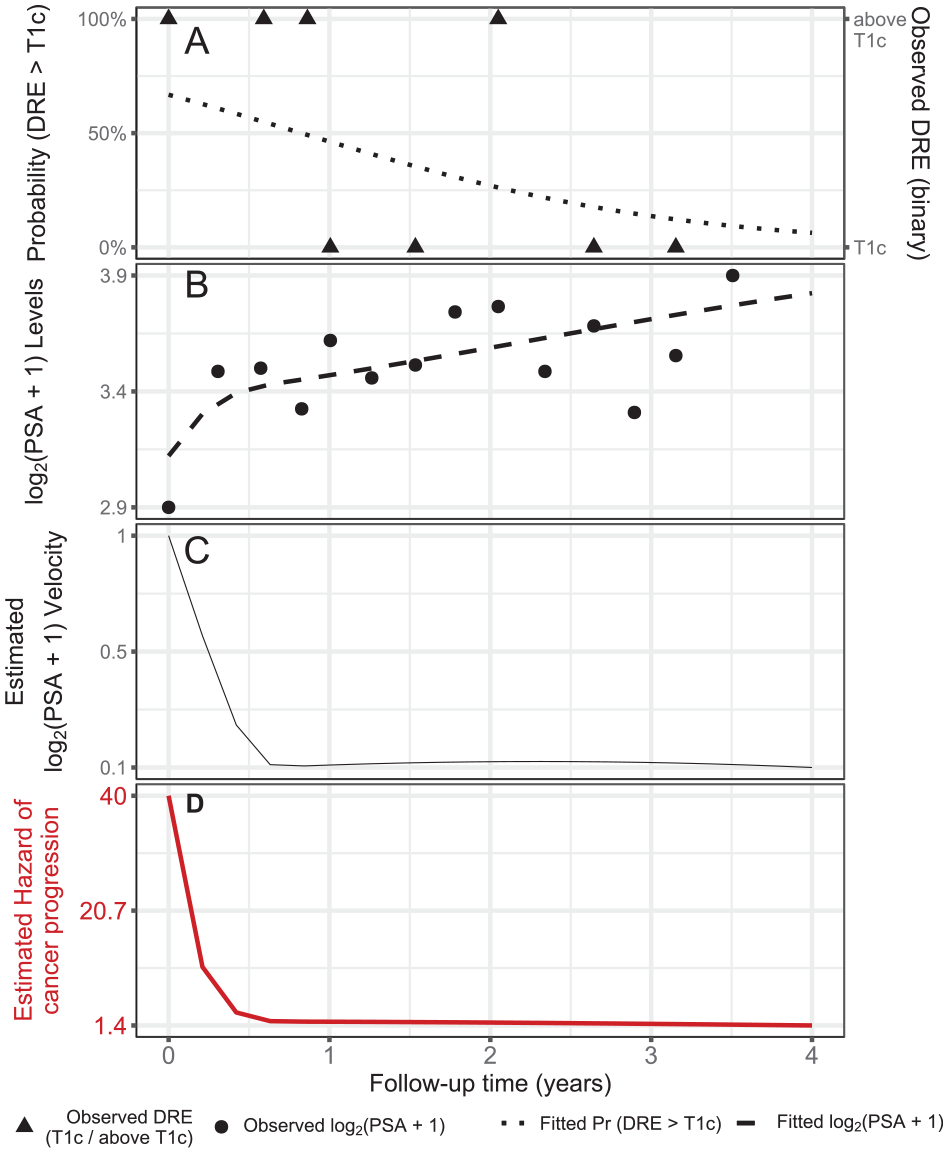
Illustration of the joint model fitted to the Prostate Cancer Research International Active Surveillance data set. (A) Observed digital rectal examination (DRE) measurements and the fitted probability of obtaining DRE > T1c (equation [1]) for the
The mixed-effects submodel for PSA is given by (see Figure 3B):
where
To account for the correlation between the DRE and PSA measurements of a patient, we link their corresponding random effects. More specifically, the complete vector of random effects
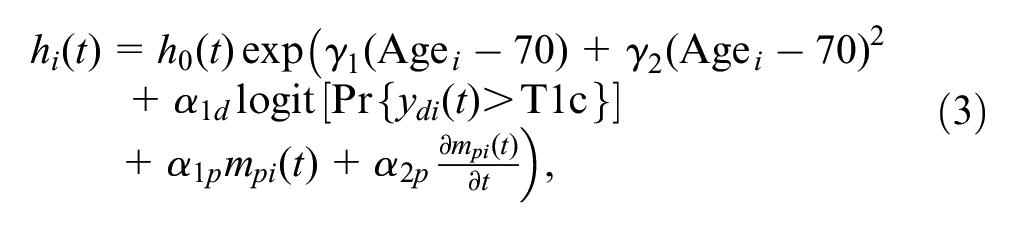
To model the impact of DRE and PSA measurements on the risk of cancer progression, our joint model uses a relative risk submodel. More specifically, the hazard of cancer progression
where
Personalized Decisions for Biopsy
Let us assume that a decision of conducting a biopsy is to be made for a new patient

The distribution
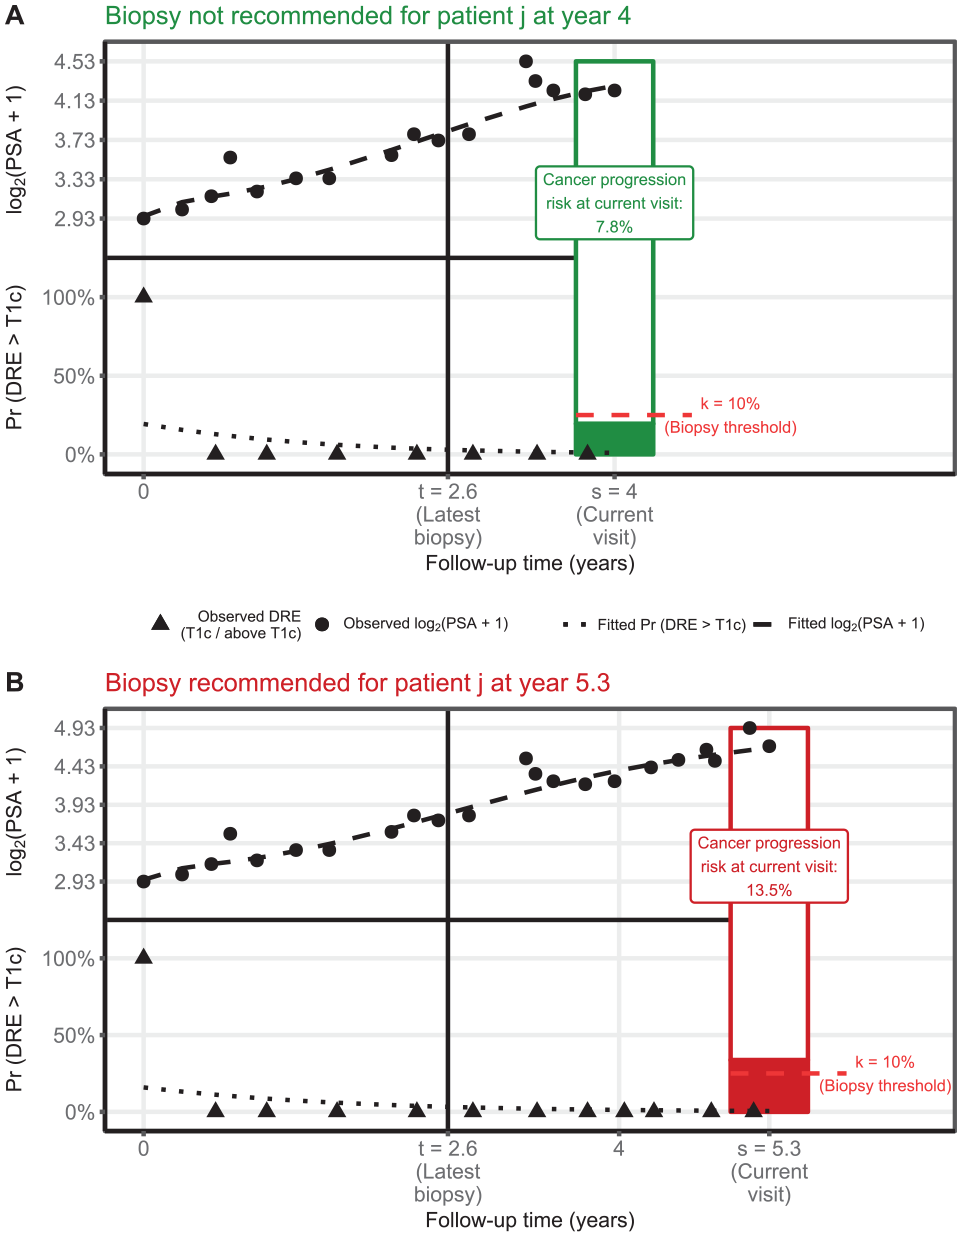
Illustration of the personalized decision of biopsy for patient
A key ingredient in the decision of conducting a biopsy for patient

A simple and straightforward approach to decide upon conducting a biopsy for patient
The choice of the risk threshold dictates the schedule of biopsies and has to be made on each subsequent follow-up visit of a patient. In this regard, a straightforward approach is choosing a fixed risk threshold, such as 5% or 10% risk, at all follow-up visits. Fixed risk thresholds may be chosen by patients and/or doctors according to how they weigh the relative harms of doing an unnecessary biopsy versus a missed cancer progression (e.g., 10% threshold means a 1:9 ratio) if the biopsy is not conducted.
22
An alternative approach is that at each follow-up visit a unique threshold is chosen on the basis of its classification accuracy. More specifically, given the time of latest biopsy
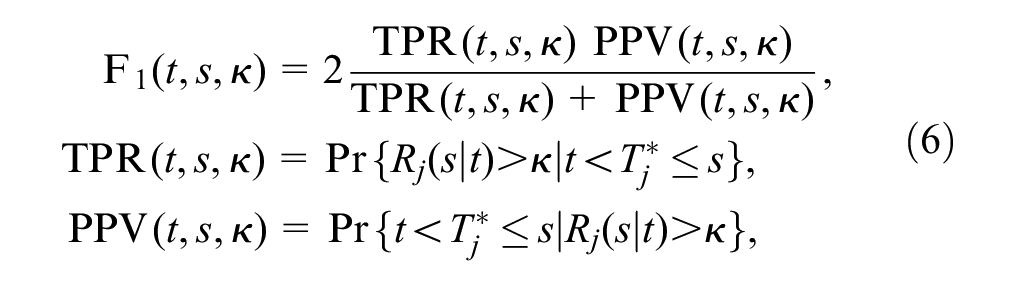
where
Simulation Study
Although the personalized decision-making approach is motivated by the PRIAS study, it is not possible to evaluate it directly on the PRIAS data set. This is because the patients in PRIAS have already had their biopsies as per the PRIAS protocol. In addition, the true time of cancer progression is interval or right censored for all patients, making it impossible to correctly estimate the delay in detection of cancer progression due to a particular schedule. To this end, we conduct an extensive simulation study to find the utility of personalized, PRIAS, and fixed/heuristic schedules. For a realistic comparison, we simulate patient data from the joint model fitted to the PRIAS data set. The simulated population has the same 10-year follow-up period as the PRIAS study. In addition, the estimated relations between DRE and PSA measurements and the risk of cancer progression are retained in the simulated population.
From this population, we first sample 500 data sets, each representing a hypothetical AS program with 1000 patients in it. We generate a true cancer progression time for each of the 500×1000 patients and then sample a set of DRE and PSA measurements at the same follow-up visit times as given in PRIAS protocol. We then split each data set into training (750 patients) and test (250 patients) parts and generate a random and noninformative censoring time for the training patients. We next fit a joint model of the specification given in equations (1), (2), and (3) to each of the 500 training data sets and obtain Markov chain Monte Carlo samples from the 500 sets of the posterior distribution of the parameters.
In each of the 500 hypothetical AS programs, we use the corresponding fitted joint models to develop cancer progression risk profiles for each of the 500 × 250 test patients. We make the decision of biopsies for patients at their prescheduled follow-up visits for DRE and PSA measurements (see the Study Population section), on the basis of their estimated personalized cumulative risk of cancer progression. These decisions are made iteratively until a positive biopsy is observed. A recommended gap of 1 year between consecutive biopsies 3 is also maintained. Subsequently, for each patient, an entire personalized schedule of biopsies is obtained.
We evaluate and compare both personalized and currently practiced schedules of biopsies in this simulation study. Comparison of the schedules is based on the number of biopsies scheduled and the corresponding delay in the detection of cancer progression. We evaluate the following currently practiced fixed/heuristic schedules: biopsy annually, biopsy every 1 years, biopsy every 2 years, and biopsy every 3 years. We also evaluate the biopsy schedule of the PRIAS program (see the introduction section). For the personalized biopsy schedules, we evaluate schedules based on 3 fixed risk thresholds: 5%, 10%, and 15%, corresponding to a missed cancer progression being 19, 9, and 5.5 times more harmful than an unnecessary biopsy,
22
respectively. We also implement a personalized schedule in which for each patient, visit-specific risk thresholds are chosen using the
Results
From the joint model fitted to the PRIAS data set, we found that both
Comparison of Various Approaches for Biopsies
From the simulation study, we obtain the number of biopsies and the delay in detection of cancer progression for each of the 500 × 250 test patients using different schedules. Figure 5 shows that the personalized and PRIAS approaches fall in the region of better balance between the median number of biopsies and the median delay than fixed/heuristic schedules. We next evaluate these schedules on the basis of both the median and interquartile range (IQR) of the number of biopsies and delay (see Figure 6). For brevity, only the most widely used annual and PRIAS schedules, the proposed personalized approach with fixed risk thresholds of 5% and 10%, and visit-specific threshold chosen using the
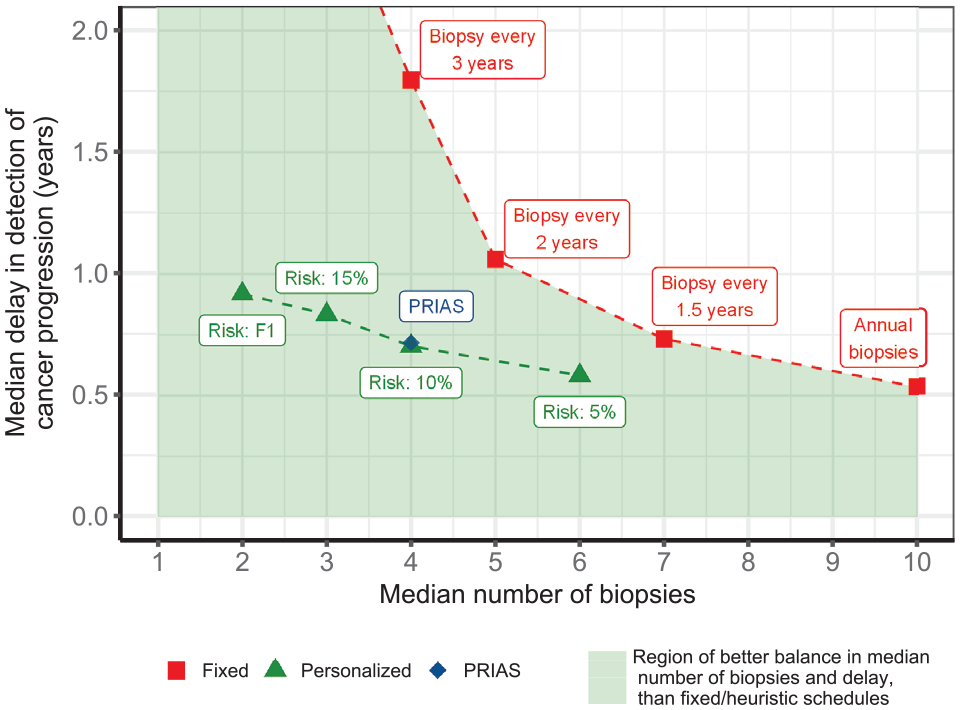
Burden-biopsy frontier: Median number of biopsies (x-axis) and median delay in detection of cancer progression (in years, y-axis), estimated from the simulation study. Results for currently practiced fixed/heuristic biopsy schedules are shown by red squares, for Prostate Cancer Research International Active Surveillance schedule by a blue rhombus, and for personalized schedules by green triangles. Types of personalized schedules: risk 15%, risk 10%, and risk 5% approaches, schedule a biopsy if the cumulative risk of cancer progression at a visit is more than 15%, 10%, and 5%, respectively. Risk: F1 works similar as previous, except that for each patient, a visit-specific risk threshold is chosen by maximizing the
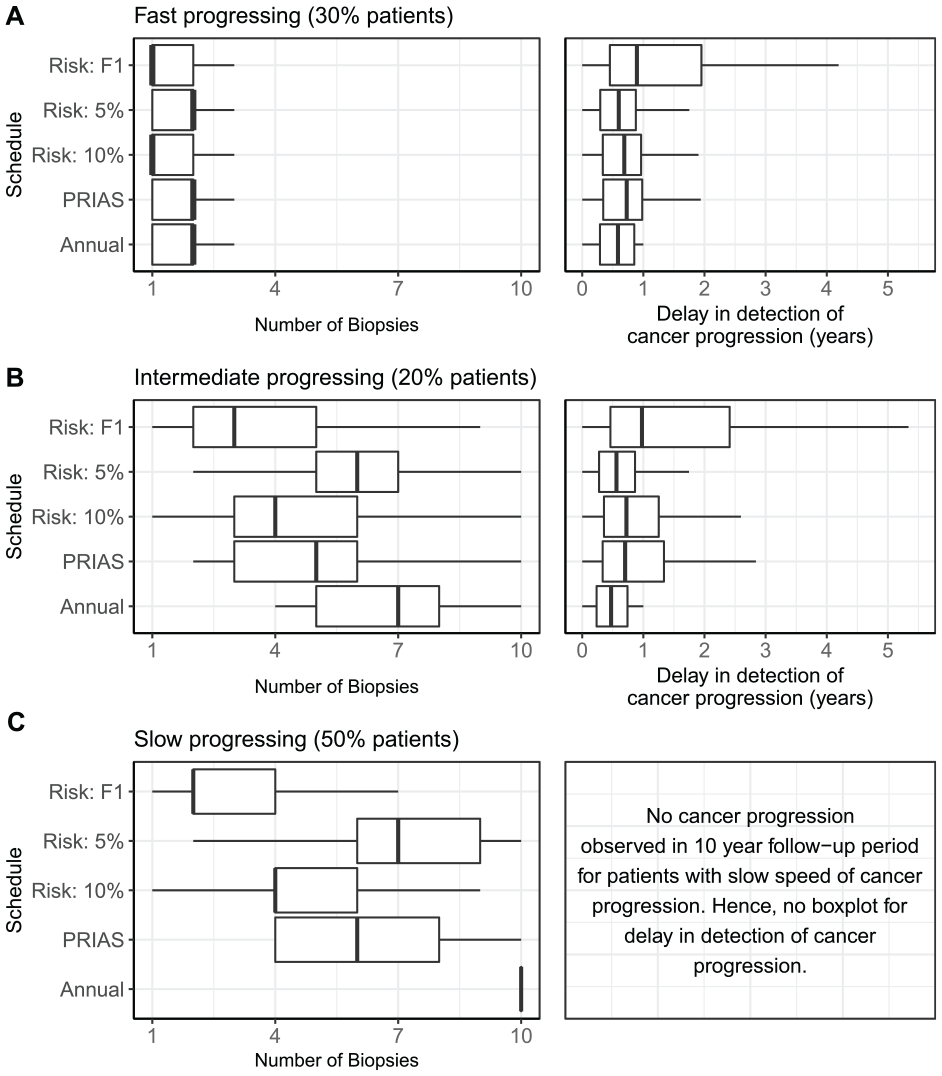
Boxplot showing variation in the number of biopsies and the delay in detection of cancer progression, in years (time of positive biopsy – true time of cancer progression) for various biopsy schedules. Biopsies are conducted until cancer progression is detected. (A) Results for simulated patients who had a faster speed of cancer progression, with progression times between 0 and 3.5 years. (B) Results for simulated patients who had an intermediate speed of cancer progression, with progression times between 3.5 and 10 years. (C) Results for simulated patients who did not have cancer progression in the 10 years of follow-up. Types of personalized schedules: risk 10% and risk 5% approaches, schedule a biopsy if the cumulative risk of cancer progression at a visit is more than 10% and 5%, respectively. Risk: F1 works similar as previous, except that a visit-specific risk threshold is chosen by maximizing the
Since patients have varying cancer progression speeds, the impact of each schedule also varies with it. To highlight these differences, we divide the results for 3 types of patients, as per their time of cancer progression. They are fast, intermediate, and slow progressing patients. Although such a division may be imperfect and can be done only retrospectively in a simulation setting, we show results for these 3 groups for the purpose of illustration. Roughly 50% of the patients did not obtain cancer progression in the 10-year follow-up period of the simulation study. We assume these patients to be slow progressing patients. We assume that fast progressing patients are the ones with an initially misdiagnosed state of cancer 24 or high-risk patients who choose AS instead of immediate treatment upon diagnosis. These are roughly 30% of the population, having a cancer progression time of less than 3.5 years. We label the remaining 20% patients as intermediate progressing patients.
For fast progressing patients (Figure 6A), we note that the personalized schedules with a fixed 10% risk threshold and visit-specific threshold chosen using the
For intermediate progressing patients (Figure 6A), we note that the delay (years) due to a personalized schedule with fixed 5% risk threshold (median: 0.6, IQR: 0.3–0.9) is comparable to that of annual schedule (median 0.5, IQR: 0.2–0.7). However, it schedules fewer biopsies (median: 6, IQR: 5–7) than the annual schedule (median: 7, IQR: 5–8). The delays (years) for PRIAS (median: 0.7, IQR: 0.3–1.3) and personalized schedule with a fixed 10% risk (median: 0.7, IQR: 0.4–1.3) are similar, but the personalized approach schedules 1 fewer biopsy for 50% of the patients. Although the approach with a visit-specific risk threshold chosen using the
The patients who are at the most advantage with the personalized schedules are the slow progressing patients. These are a total of 50% patients who did not progress during the entire study. Hence, the delay is not available for these patients (Figure 6C). For all of these patients, an annual schedule leads to 10 (unnecessary) biopsies. The schedule of the PRIAS program schedules a median of 6 biopsies (IQR: 4–8). In comparison, the biopsies scheduled by the personalized schedules using a fixed 10% risk threshold (median: 4, IQR: 4–6) and visit-specific risk chosen using the
Overall, we observed that the personalized schedule that uses a 10% risk threshold at all follow-up visits is dominant over the PRIAS schedule, biennial schedule of biopsies, and biopsies every 1 years (see Supplementary Appendix C for the latter 2 schedules). This personalized schedule not only schedules fewer biopsies than the aforementioned currently practiced schedules, but the delay in detection of cancer progression is also either equal or less. The personalized schedule that uses a risk threshold chosen on the basis of classification accuracy (
Discussion
We proposed a methodology that better balances the number of biopsies and the delay in detection of cancer progression than the currently practiced biopsy schedules for low-risk prostate cancer patients enrolled in AS programs. The proposed methodology combines a patient’s observed DRE and PSA measurements and the time of the latest biopsy into a personalized cancer progression risk function. If the cumulative risk of cancer progression at a follow-up visit is above a certain threshold, then a biopsy is scheduled. We conducted an extensive simulation study, based on a replica of the patients from the PRIAS program, to compare this personalized approach for biopsies with the currently practiced biopsy schedules. We found personalized schedules to be dominant over many of the current biopsy schedules (see the Results section).
The main reason for the better performance of personalized schedules is that they account for the variation in cancer progression rate between patients and also over time within the same patient. In contrast, the existing fixed/heuristic schedules ignore that roughly 50% of the patients never progress in the first 10 years of follow-up (slow progressing patients) and do not require biopsies. The fast progressing patients require early detection. However, existing methods of identifying these patients, such as the use of PSA doubling time in PRIAS, inappropriately assume that PSA evolves linearly over time. Thus, they may not correctly identify such patients. The personalized approach, however, models the PSA profiles nonlinearly. Furthermore, it appends information from PSA with information from DRE and previous biopsy results and combines them into a single cancer progression risk function. The risk function is a finer quantitative measure than individual data measurements observed for the patients. In comparison to decision making with flowcharts, the risk as a single measure of a patient’s underlying state of cancer may facilitate shared decision making for biopsies.
Existing work on reducing the burden of biopsies in AS primarily advocates less frequent heuristic schedules of biopsies 6 (e.g., biopsies biennially instead of annually). To our knowledge, risk-based biopsy schedules have barely been explored in AS.9,10 The part of our results pertaining to the fixed/heuristic schedules is comparable with corresponding results obtained in existing work, 6 even though the AS cohorts are not the same. Thus, we anticipate similar validity for the results pertaining to the personalized schedules.
A limitation of the personalized approach is that the choice of risk threshold is not straightforward, as different thresholds lead to different combinations of the number of biopsies and the delay in detection of cancer progression. An approach is to choose a risk threshold that leads to personalized schedule dominant (e.g., 10% risk) over the currently practiced schedules, for a given delay. Since personalized biopsy schedules are less burdensome, they may lead to better compliance. A second limitation is that the results that we presented are valid only in a 10-year follow-up period, whereas prostate cancer is a slow progressing disease. Thus, more detailed results, especially for slow progressing patients, cannot be estimated. However, very few AS cohorts have a longer follow-up period than PRIAS. 9 In a screening setting, often the ethno-racial background of the patient and the history of cancer in first-degree relatives are checked. Our model does not take into account either of these. The reason is that the history of cancer in relatives been found to be predictive of cancer progression only in African American patients.25,26 This is also evident by the fact that PRIAS and many other surveillance programs do not use this information in their biopsy protocols.10,11 In addition, patients who have a higher risk of an aggressive form of cancer are usually not recommended AS. Hence, the proposed model is relevant only for low-risk prostate cancer patients eligible for AS. An exception is the AS patients who are old and/or have comorbid illnesses. Currently, such patients may be removed from AS and are instead offered the less intensive watchful waiting 11 option. It is also possible to model watchful waiting as a competing risk in our model. However, this falls outside the scope of the current work because cancer progression as detected via biopsy is the standard trigger for treatment advice. Lastly, our results are not valid when the patient data are missing not at random.
There are multiple ways to extend the personalized decision-making approach. For example, biopsy Gleason grading is susceptible to interobserver variation. 27 Thus, accounting for it in our model will be interesting to investigate further. To improve the decision-making methodology, future consequences of a biopsy can be accounted for in the model by combining Markov decision processes with joint models for time-to-event and longitudinal data. There is also a potential for including diagnostic information from magnetic resonance imaging (MRI), such as the volume of the prostate tumor as a longitudinal measurement in our model. The resulting predictions can be used to the decide the time of the next MRI as well as to make a decision about biopsy. The same holds true for the quality-of-life measures. However, given the scarceness of both MRI and quality-of-life measurements in the data set, including them in the current model may not be feasible. We intend to further validate our results in a multicenter AS cohort and subsequently develop a web application to assist in making shared decisions for biopsies.
Supplemental Material
Appendix_online_supp – Supplemental material for Personalized Decision Making for Biopsies in Prostate Cancer Active Surveillance Programs
Supplemental material, Appendix_online_supp for Personalized Decision Making for Biopsies in Prostate Cancer Active Surveillance Programs by Anirudh Tomer, Dimitris Rizopoulos, Daan Nieboer, Frank-Jan Drost, Monique J. Roobol and Ewout W. Steyerberg in Medical Decision Making
Footnotes
Acknowledgements
The first and last authors would like to acknowledge support by Nederlandse Organisatie voor Wetenschappelijk Onderzoek (the national research council of the Netherlands) VIDI grant No. 016.146.301 and Erasmus University Medical Center funding. The authors also thank the Erasmus University Medical Center’s Cancer Computational Biology Center for giving access to their information technology infrastructure and software that was used for the computations and data analysis in this study. Lastly, we thank Joost Van Rosmalen from the Department of Biostatistics, Erasmus University Medical Center, for feedback on the manuscript.
The authors declared no potential conflicts of interest with respect to the research, authorship, and/or publication of this article.
Financial support for this study was provided entirely by VIDI grant No. 016.146.301 from Nederlandse Organisatie voor Wetenschappelijk Onderzoek, which is the national research council of the Netherlands, and Erasmus University Medical Center funding. The funding agreement ensured the authors’ independence in designing the study, interpreting the data, writing, and publishing the report.
References
Supplementary Material
Please find the following supplemental material available below.
For Open Access articles published under a Creative Commons License, all supplemental material carries the same license as the article it is associated with.
For non-Open Access articles published, all supplemental material carries a non-exclusive license, and permission requests for re-use of supplemental material or any part of supplemental material shall be sent directly to the copyright owner as specified in the copyright notice associated with the article.