
Abstract
Health utilities are commonly used in cost-utility analysis of drugs and interventions in health care. 1 They provide the quality weight in the quality-adjusted life year (QALY) model and are usually measuring preferences for hypothetical health states derived from instruments such as the SF-6D, EQ-5D, or the Health Utility Index (HUI).2–4 Differences between countries have been observed in valuations of health utilities by the general public.5,6 In particular in the EQ-5D valuation system, for severe health states, the differences between countries can be as large as 0.4. 7 Similarly, differing amounts of health states considered worse than dead have been observed, which are health states that are assigned negative utilities. For example, the 2016 value set for England has 5% of its health states valued worse than dead, while the 2017 Indonesian value set has 35% of its health states valued worse than dead.8,9
Differences between countries persist despite efforts to harmonize valuation studies. Several sources may contribute to these differences such as the sociodemographic backgrounds of the respondents, different valuation methods, and differing cultural values between countries. First, sociodemographic factors such as age, sex, education, and marital status have been shown to be related to utilities for health states, albeit weakly.10,11 Also, respondents’ self-reported health and self-description are related to the valuation of health states.12–14 Second, different methods of valuation might also affect the outcomes of valuation studies. There are a variety of methods to value health states, such as the standard gamble (SG), visual analog scale (VAS), discrete choice experiments (DCEs), and, most commonly used, the time tradeoff (TTO).15,16 The results of valuation studies differ systematically by valuation method. 1 Also, a variety of other methodological factors affect utilities, such as layouts, indifference procedures, scale anchors, and transformations of values for worse than dead health states.17,18 If these factors explain differences in health state valuations within studies, they might also explain differences in health state valuations between countries.
Cultural values have also been hypothesized to explain differences in utilities between studies.5,6 Cultural values can be defined as what should be judged as good or evil by a group. 19 Cultural values have been operationalized by pioneers such as Hofstede and Inglehart.20–22 There is some evidence that cultural values are related to health; for instance, the cultural values of Inglehart were shown to be related to self-reported health. 23 Furthermore, it was shown that utility differences between countries were related to Hofstede’s cultural values. 24 The aim of this study is to test whether the variation in utilities is caused by differences in sociodemographic background, methodological factors, or cultural values. Our research question is as follows: What is the effect of country, sociodemographic profile, methodological factors, and cultural values on differences in health utilities?
Methods
General Approach
We are interested in the determinants of variation in health utilities between countries, which we aim to explain by sociodemographic background, methodological factors, and cultural values. We focus on differences between utilities for mild and severe health states for reasons explained in the analyses section.
Valuation Instrument Used in Various Countries
The preference-based valuation instrument that will be used in this study is the EQ-5D, developed by the EuroQol Group. This tool assesses utilities for health states. 25 The EQ-5D-3L is a health state classification system with 3 levels and 5 dimensions that span the domains of mobility, self-care, usual activities, pain/discomfort, and anxiety/depression, in that order. On each of these dimensions, one can have 1) no problems, 2) some problems, or 3) extreme problems. A score of 11321 on the EQ-5D-3L indicates that a hypothetical person has no problems with mobility and self-care, has extreme problems with performing usual activities, some problems with pain or discomfort, and no problems with anxiety or depression.
The EQ-5D-5L was developed to improve the sensitivity of the EQ-5D and to reduce ceiling effects present in the EQ-5D-3L. 26 In addition to the usual 3 levels of severity, 2 intermediate levels are introduced. One can now have 1) no problems, 2) slight problems, 3) moderate problems, 4) severe problems, and 5) extreme problems.
Utility weights are assigned to EQ-5D health states through valuation studies. The EQ-5D instrument assigns utility to health states by employing the TTO or composite TTO (cTTO) methods.
27
For states better than dead, the TTO and cTTO methods allow respondents to choose between 10 years in good health v. 10 years in the health state to be valued. If 10 years in good health is preferred, the respondent is faced with the choice between 10 years in the health state or, for example,
Data Collection
Valuation data were collected from existing EQ-5D valuation studies. Principal investigators (PIs) of EQ-5D valuation studies were contacted through email, to ask for their data. Reminders were sent if the PIs did not respond after a few weeks, and more reminders were sent if necessary. PIs were also contacted at 3 EuroQol Meetings in 2016 and 2017.
Measures
Sociodemographic variables
We selected variables that were assumed to be related to
Methodological variables
Methodological variables were extracted from the research papers of the included valuation studies. We initially considered known methodological factors that affect the outcomes of utility assessments as a basis for the inclusion of methodological variables. 18 However, EQ-5D-3L studies were fairly homogeneous, as the methodology of most 3L studies was derived from the original Measurement and Valuation of Health (MVH) study conducted in Britain. 3 With the introduction of the EQ-5D-5L, the methodology of the valuation studies was standardized, reducing methodological differences within the 5L studies. 29 A major difference between 3L and 5L studies is that in 5L studies, the cTTO was introduced. Hence, a variable representing whether a study is 3L or 5L was used in our analyses, which captures, among other differences, whether TTO or cTTO is used or whether DCE was done complementary to the cTTO.
Cultural variables
There are several theories on cultural values, for example, the approach of Hofstede and the approach of Inglehart.20,22 The approach by Inglehart is based on the World Values Survey in which large representative target samples are obtained. Therefore, we use their theory to derive national levels of cultural values on 2 dimensions: traditional v. rational/secular values and survival v. self-expression values.20,21,30 Traditional values are indicated by a negative score on the traditional/rational-secular dimension and are related to religion (importance of God), authority, national pride, lower levels of tolerance toward homosexuality and abortion, and stronger family ties, while rational-secular values imply the opposite and are indicated by a positive score on the traditional/rational-secular dimension. Survival values are indicated by a negative score on the survival/self-expression dimension and are indicated by low levels of trust, low levels of political activism, and low levels of tolerance for abortion and homosexuality, while self-expression values imply the opposite.
Analyses
General Approach
The dependent variable was
Another reason for using
Classification of Mild, Moderate, and Severe States
As we focus on the difference between mild and severe states, it was necessary to make a classification of which states are considered mild, moderate, or severe. There is, to our knowledge, no universal protocol to do so. For EQ-5D-3L health states, we followed the procedure of Luo et al. 31 Mild states had at most “moderate problems” or a “2” on 2 domains. Severe states had “extreme problems” or “3s” on at least 2 of the health domains. All other health states were considered moderate. For the EQ-5D-5L, we employed a similar procedure. Mild states contained at most 2 “3s” (moderate problems on a maximum of 2 domains), severe states contained at least two “5s” (extreme problems on at least 2 domains), and all other states were considered moderate.
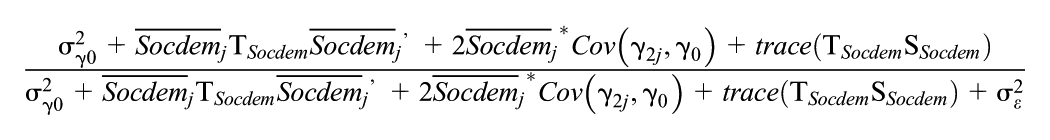
Dependent Variable: Utility Differences between Mild and Severe States
Independent Variables
correcting for stimulus differences
Health states are the stimuli presented to respondents in valuation tasks. The sets of health states differ between countries and respondents, which made it necessary to control for these differences. Consequently,
Sociodemographic, methodological, and cultural variables
Age was standardized to have a mean of 0 and a standard deviation of 1, using the overall mean of all included respondents, while sex was coded as male (0) and female (1) and education was coded low (1), middle (2), and high (3). The respondent’s own EQ-5D self-description was transformed to a single variable and rescaled to [0,1] by summing up the levels on each dimension, subtracting 5, and dividing by 10 (in the case of 3L) or 20 (in the case of 5L). For each study, a dummy indicating whether a study was 3L (0) or 5L (1) was included.
The 2 cultural variables, traditional/rational-secular and survival/self-expression, ranged between –2 and 2, and were taken from the World Values Survey. The World Values Survey currently has data available for 6 study waves, conducted in different time periods. Means for the 2 cultural dimensions can be calculated by wave. Cultural data were matched on year of collection of the EQ-5D data. If this was not possible, the wave that is closest to the date of collection of the EQ-5D data was used.
Data Structure and Models
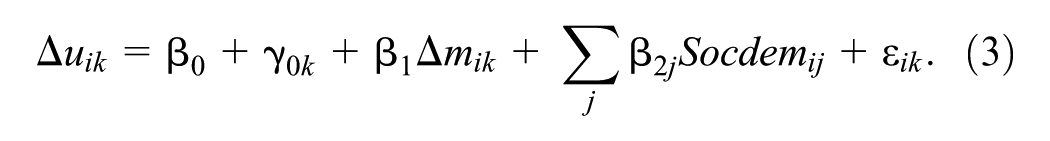
In our analyses, we were interested in
To establish baseline variations of


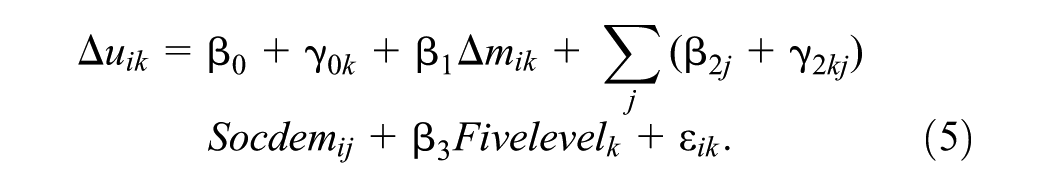
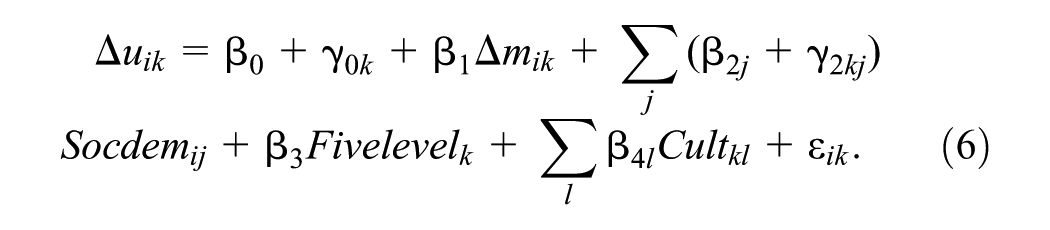
Last, a dummy indicating whether a study is 3L or 5L was added, followed by the cultural variables. These models are presented in equations (5) and (6).
Assessing Explained Variation between Countries with Intraclass Correlation
We were interested in the variation of

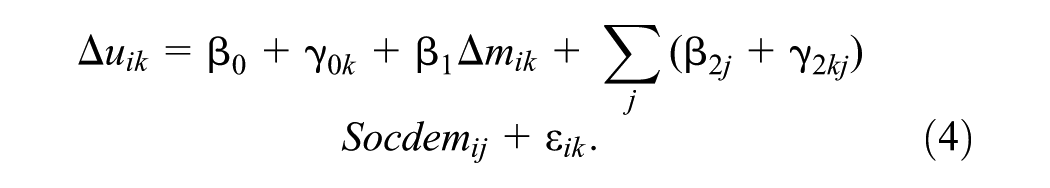
Models 4 to 6 included variation from random slopes for the sociodemographic variables, while models 1 to 3 did not. Therefore, the variability of the random slopes
where

Additional analyses included a jackknife analysis to assess whether a country was considered an influential point. If a country was influential, associations found for
Results
Data Collection and Descriptive Statistics
The collection of data sets started in January 2016 and ended in August 2017. Forty-four studies were initially identified as currently completed or ongoing EQ-5D valuation studies. PIs were contacted through email and at the EuroQol meetings. Out of these 44 studies, 4 had not collected TTO data, 3 studies were not published yet, and 6 PIs were difficult to contact, leaving 31 studies. One of the data sets could not be shared with us for contractual reasons, leaving 30 studies. Data of 30 studies were obtained, of which 19 were EQ-5D-3L data sets and 11 were EQ-5D-5L data sets.9,31,33–59 Two studies were excluded, as sociodemographic data or cultural values (in the case of the United Arab Emirates) were not available. Therefore, 28 studies remained. The jackknife analysis did not identify any influential points. Thus, 28 countries remained for the final analysis. For 21 of these studies, information about educational level was also available, while in 26 of these studies, the EQ-5D self-description was included.
In total, 690 respondents did not value both mild and severe states, making it impossible to calculate
Table 1 provides information on the studies that were obtained and their characteristics. The scores on the 2 cultural dimensions for each country are shown in Figure 1 and show a wide spread of cultural values. Dotplots were computed to illustrate the variation in average
Obtained Studies and Their Characteristics a
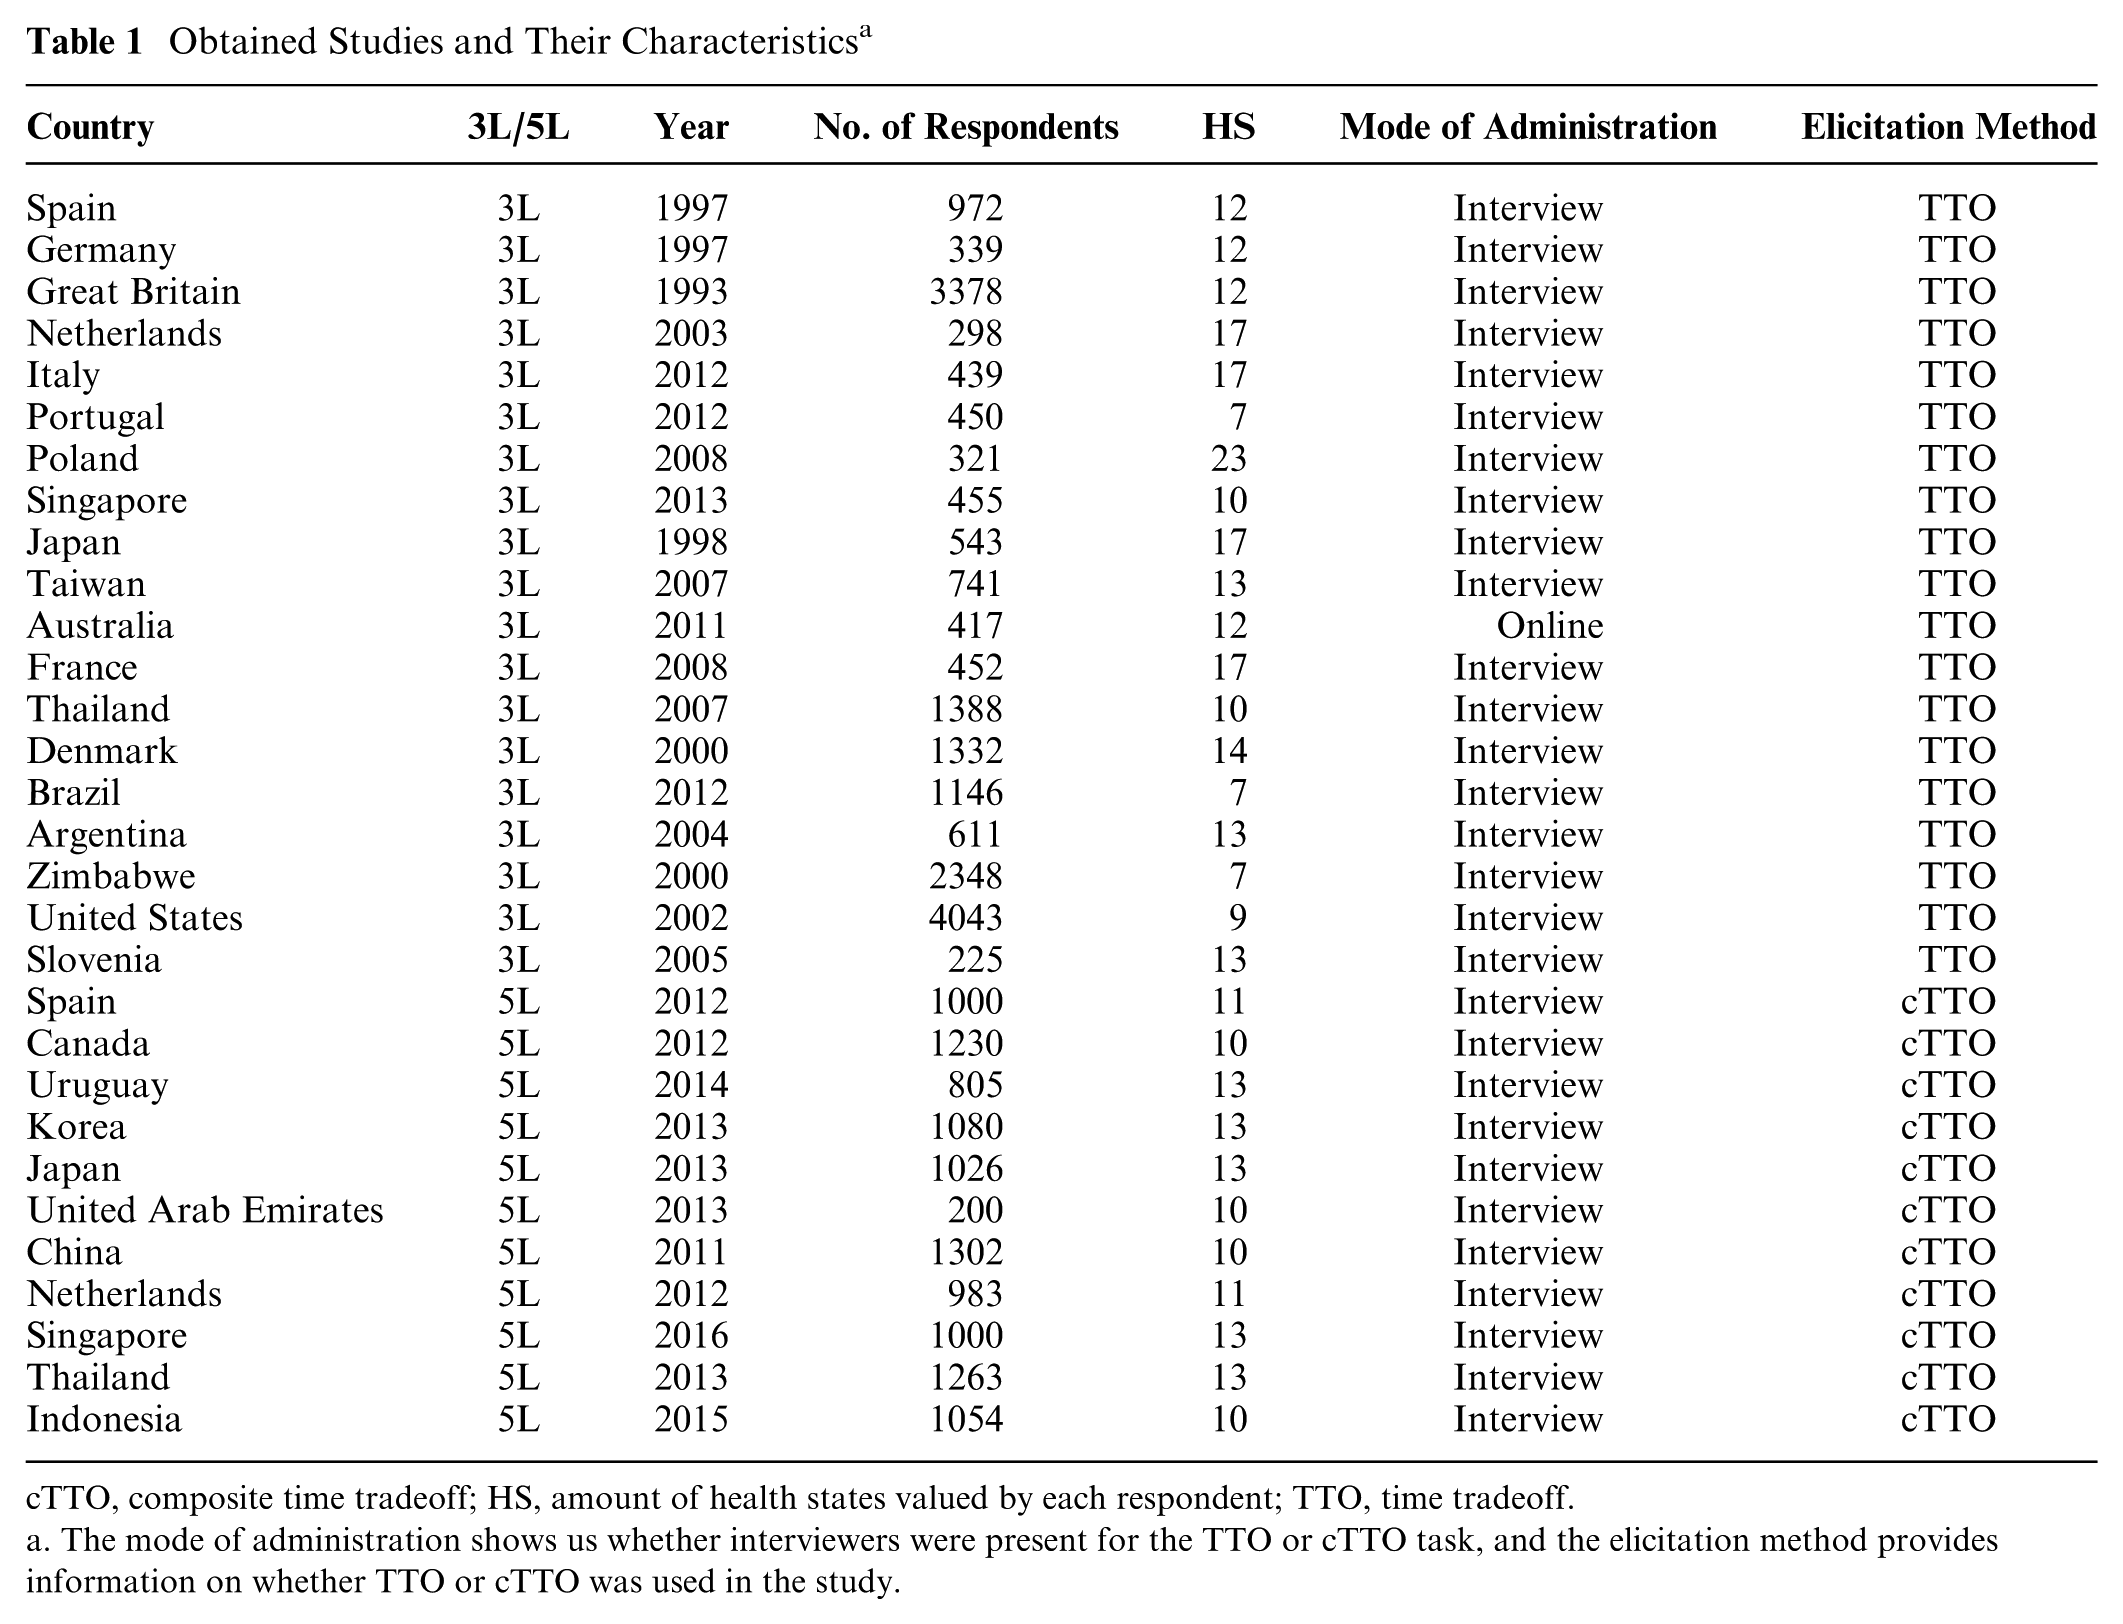
cTTO, composite time tradeoff; HS, amount of health states valued by each respondent; TTO, time tradeoff.
a. The mode of administration shows us whether interviewers were present for the TTO or cTTO task, and the elicitation method provides information on whether TTO or cTTO was used in the study.
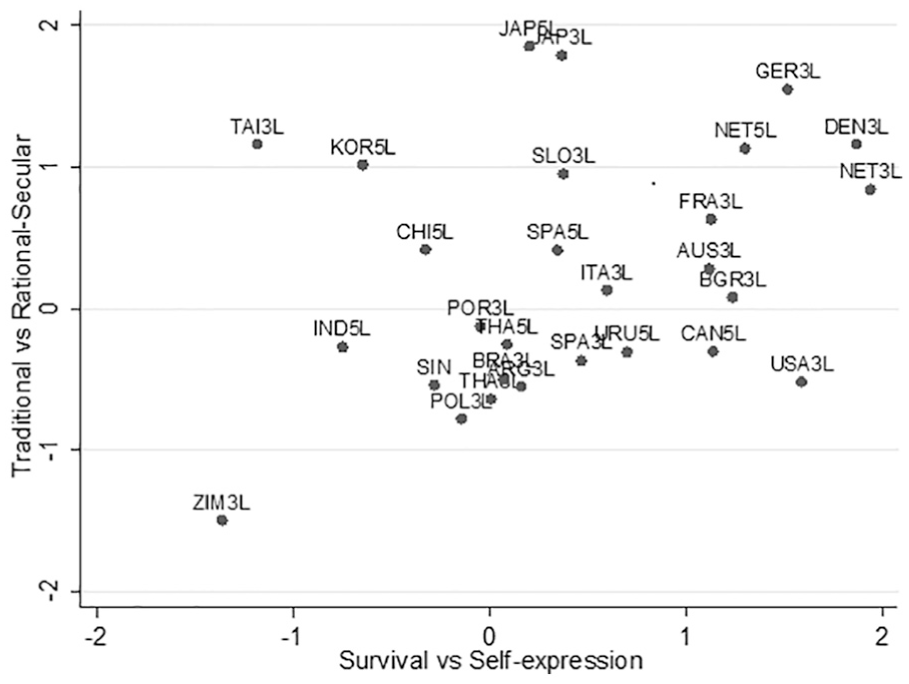
Scores on the 2 cultural dimensions, by country.
Correlations between Average Values per Country a
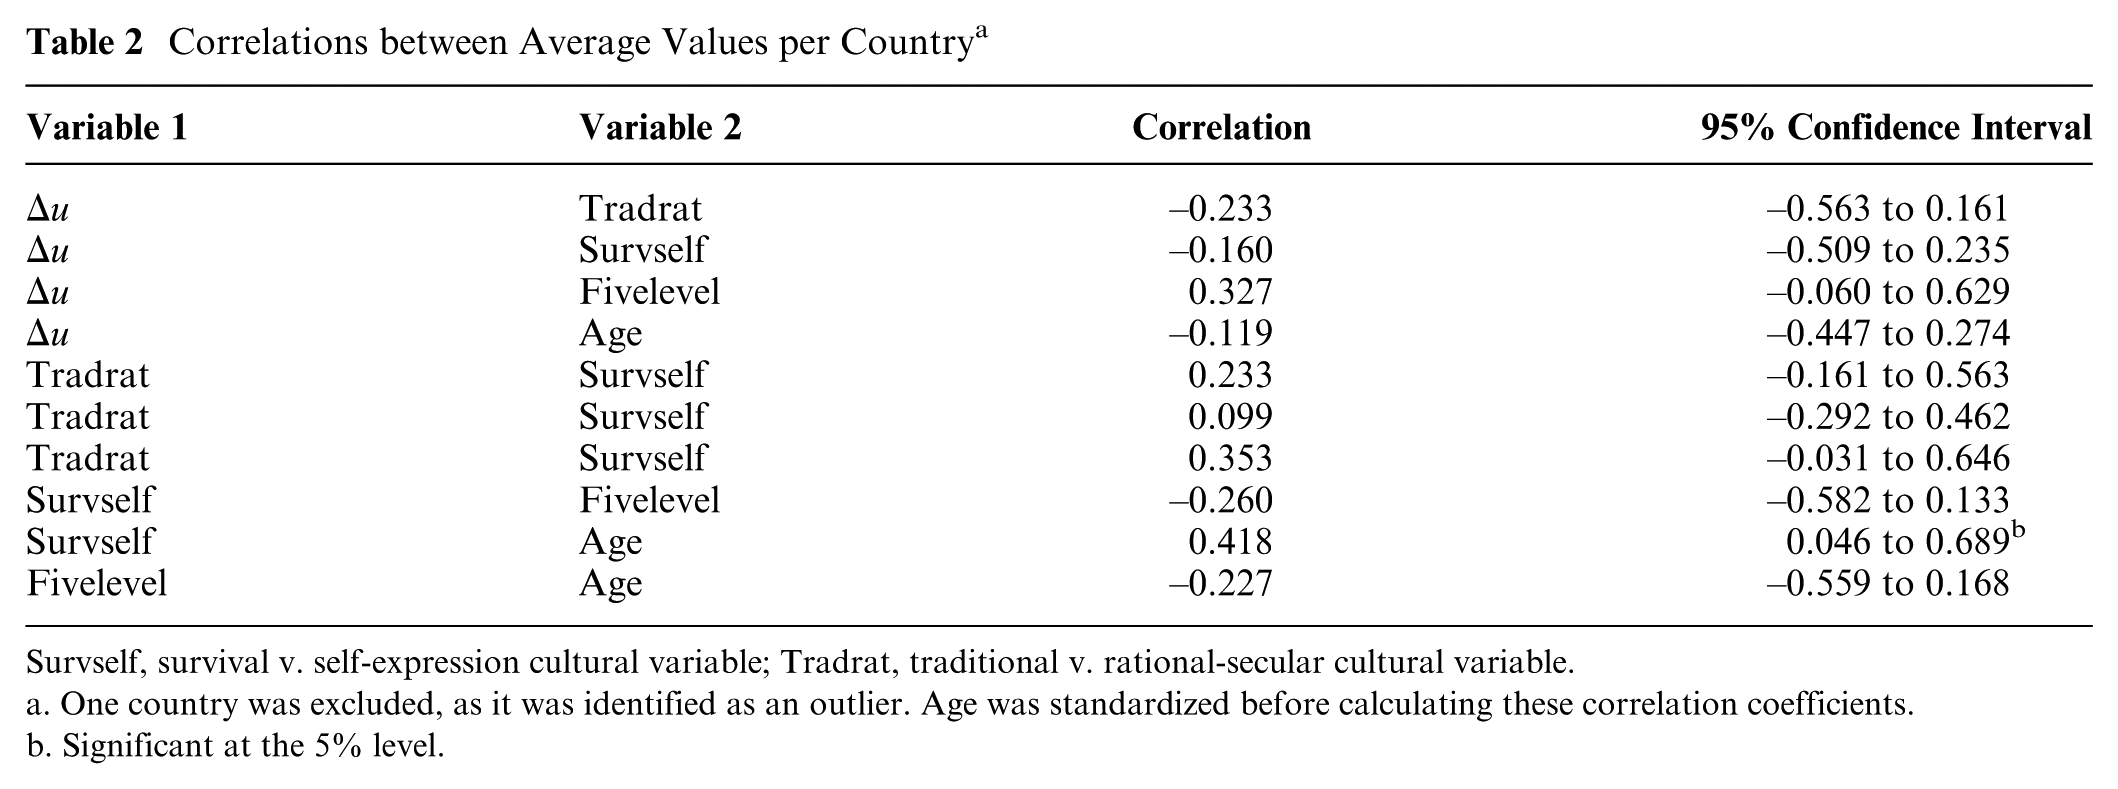
Survself, survival v. self-expression cultural variable; Tradrat, traditional v. rational-secular cultural variable.
a. One country was excluded, as it was identified as an outlier. Age was standardized before calculating these correlation coefficients.
b. Significant at the 5% level.
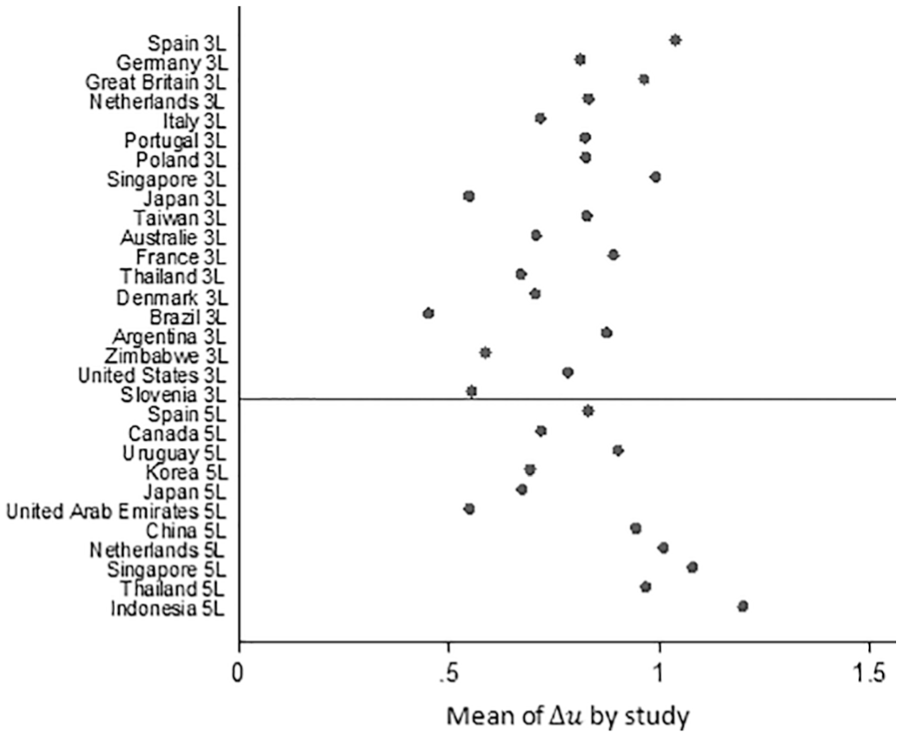
Dotplot of average
Multilevel Models
Preliminary analyses that included education and a rescaled EQ-5D self-description showed that education was not significant. As 6 studies had no measure of education, education was excluded from analysis to avoid losing data. The EQ-5D self-description was a significant predictor of
The results from the multilevel analyses are reported in Table 3. The columns represent the 6 different models described in equations (1) to (6). The first 7 rows present the coefficients of the fixed intercept and fixed effects for the included variable: the
Results from Multilevel Analyses for 27 Countries a
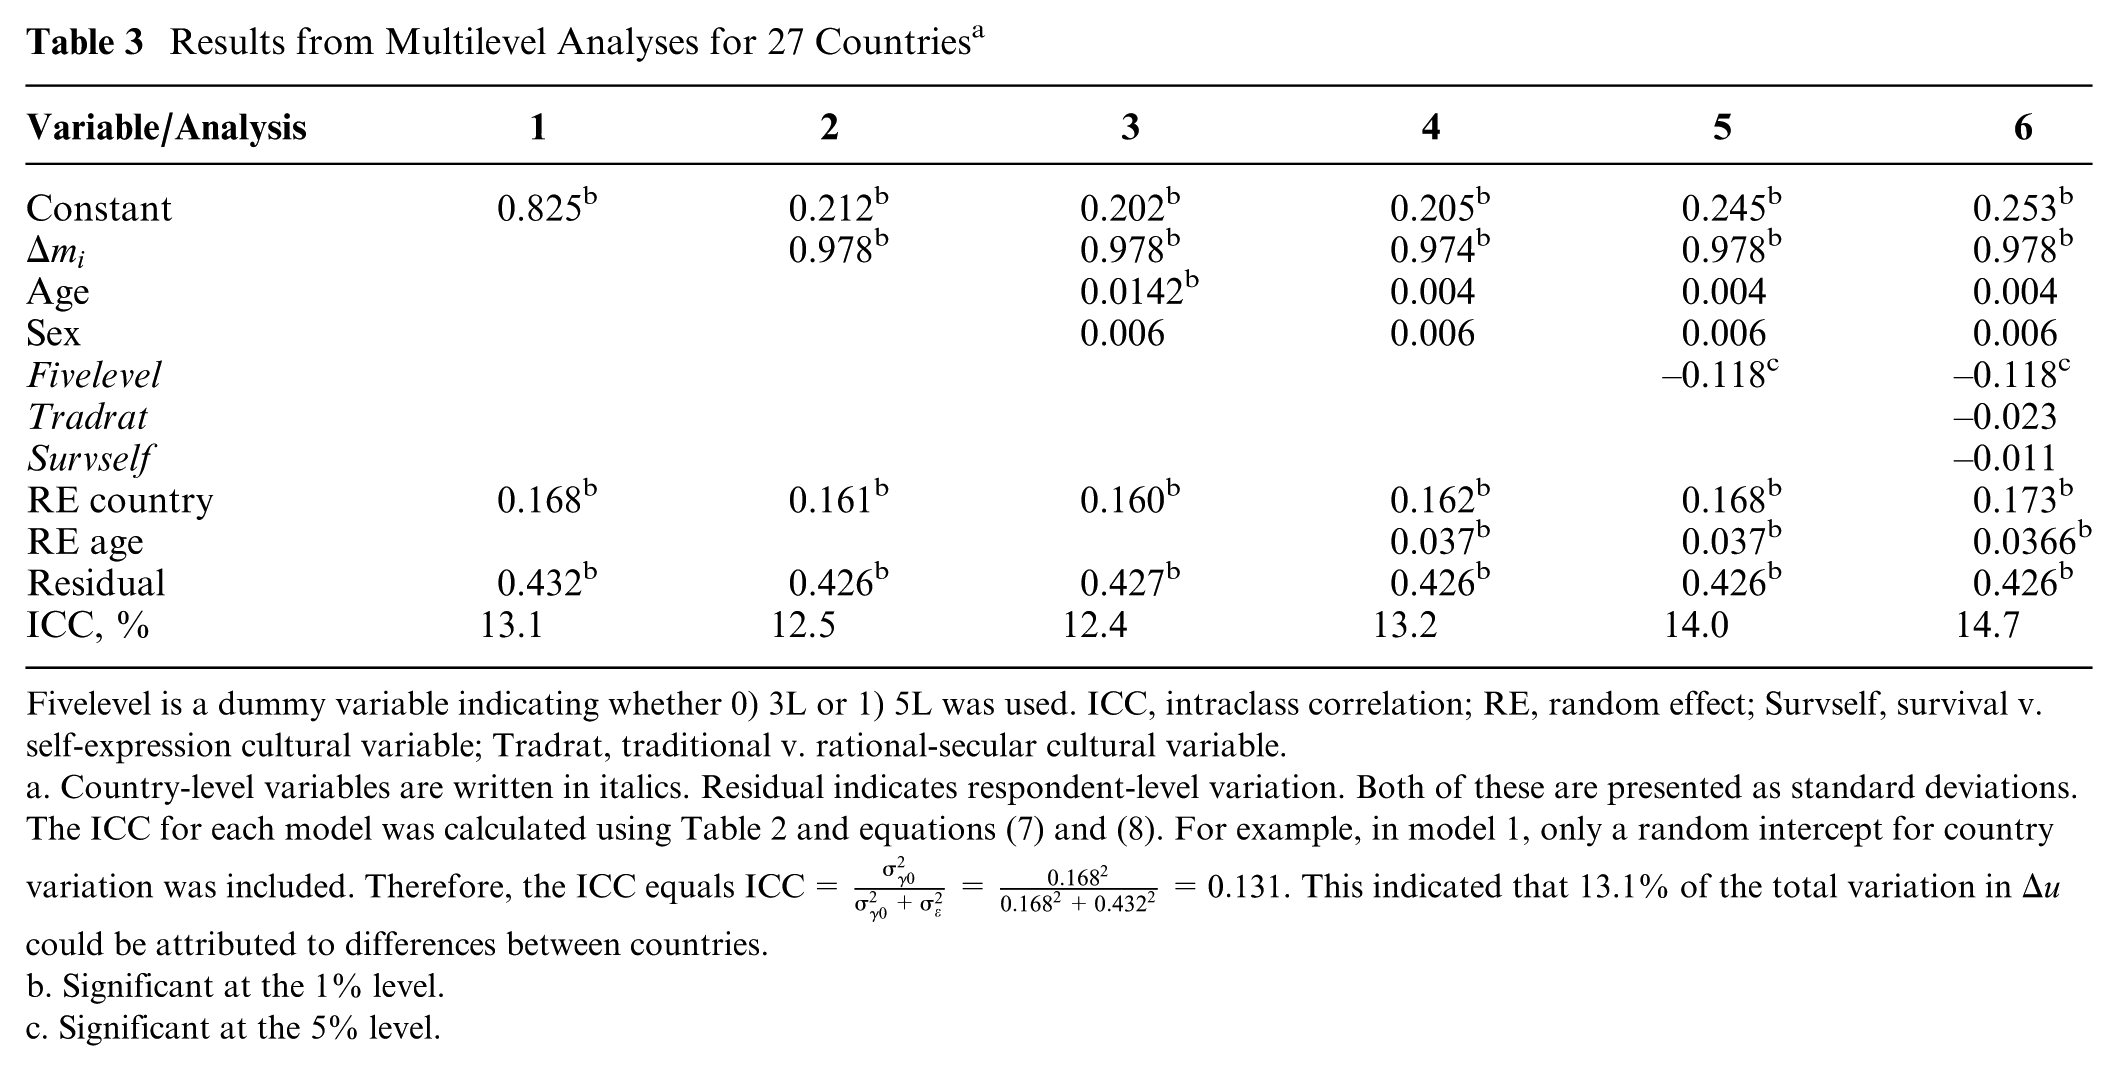
Fivelevel is a dummy variable indicating whether 0) 3L or 1) 5L was used. ICC, intraclass correlation; RE, random effect; Survself, survival v. self-expression cultural variable; Tradrat, traditional v. rational-secular cultural variable.
a. Country-level variables are written in italics. Residual indicates respondent-level variation. Both of these are presented as standard deviations. The ICC for each model was calculated using Table 2 and equations (7) and (8). For example, in model 1, only a random intercept for country variation was included. Therefore, the ICC equals
b. Significant at the 1% level.
c. Significant at the 5% level.
ICC
In every model, the random intercepts for country variation were significant, indicated by the row “RE country” in Table 3. This indicated that
Fixed Effects
The first 7 rows of Table 3 show that in model 3, the fixed effect of age was only weakly related to
Additional Analyses
Additional analyses were performed using Hofstede’s cultural dimensions.
22
The same model was used as in equation (6), now including Hofstede’s 5 cultural dimensions instead of Inglehart’s 2 cultural dimensions. The results showed that none of the 5 cultural dimensions of Hofstede was significantly related to
The analyses with different definitions for mild and severe states produced similar results. Although the ICC varied slightly for each model, depending on the definition of mild and severe states, the same pattern of reduction in country-level variation was found. The ICC did not decrease when the Fivelevel dummy was added or when the cultural variables were added to the models.
Discussion
Main Findings
We aimed to examine the effect of sociodemographic background, methodological factors, and cultural values on differences in health utilities,
Interpretation
Although cultural values were hypothesized to be related to variation in utilities for health states, we did not find a relation between cultural values and
Our results are contrasted by Bailey and Kind,
24
who looked at the mean TTO value for 7 mild health states in 10 countries, correlated those with 5 Hofstede cultural dimensions for each country, and found a relation between Hofstede’s dimensions and the TTO scores.
22
The relation found by Bailey and Kind was the strongest for Hofstede’s “Power Distance” and “Uncertainty Avoidance” dimensions; these dimensions were also strongest in our own analysis of Hofstede’s cultural dimensions. However, there are some differences between Bailey and Kind’s study
24
and our study. Our study included more countries and considered respondent-level data, whereas Bailey and Kind
24
used mean TTO data for some specific health states and correlated those with Hofstede’s cultural dimensions. Furthermore, our study is on differences in utilities,
We found 2 predictors of
Limitations and Strengths
This study has some limitations. First, our analyses were done on existing data, and also, desired data was not collected in all countries. Second, only a small number of sociodemographic variables could be considered for analysis, since more could not be analyzed while preserving a sufficient sample of included countries. Third, cultural data were collected at the national level instead of at the respondent level, which reduces the chance of finding a relation between cultural values and
First, a major strength of this study is its methodology; we have combined the largest number of EQ-5D valuation data sets to date. Second, our method of analysis takes into account the multilevel structure of the data. Third, our method of analysis is well suited to correct for disturbing variables. Lastly, the results of our study are robust as different definitions of mild and severe states produced similar results.
Practical Implications
Countries use their own EQ-5D tariffs for the calculation of QALYs in cost-utility analyses. This is reasonable, as our findings reveal a large amount of variation in
Conclusion
Health utilities differ between countries, as shown, for example, by the varying amounts of health states worse than dead reported by EQ-5D valuation studies. The aim of this article was to assess these differences and to test whether these differences were related to the sociodemographic background of the respondents, methodological differences, and cultural values. Cultural values did not explain
Footnotes
Acknowledgements
We thank Simon Pickard, Juan-Manuel Ramos-Goñi, and Bas Janssen for helping us contact the PIs and acquire the data sets used for this project.
The author(s) declared no potential conflicts of interest with respect to the research, authorship, and/or publication of this article.
Financial support for this study was provided entirely by a grant from the EuroQol Research Foundation, EQ Project 2015150. The funding agreement ensured the authors’ independence in designing the study, interpreting the data, and writing and publishing the report.
Members of the Cultural Values Group who contributed data to this study and should be indexed as collaborators are Nan Luo, Rosalie Viney, Monica Viegas Andrade, Claire Gudex, Gerard de Pouvourville, Wolfgang Greiner, Luciana Scalone, Aki Tsuchiya, Dominik Golicki, Pedro Ferreira, Valentina Prevolnik-Rupel, Xavier Badia, Ching-Lin Hsieh, Jennifer Jelsma, Marisa Santos, Feng Xie, Fredrick Purba, Shunya Ikeda, Takeru Shiroiwa, Elly Stolk, Min-Woo Jo, Juan-Manuel Ramos-Goñi, Federico Augustovski, Lucila Rey-Ares, Nancy Devlin, Koonal Shah, Juntana Pattanaphesaj, and Sirinart Tongsiri. Collaborators included in the Cultural Values Group provided 1 or multiple EQ-5D valuation data sets but did not analyze the data and were not involved in writing the manuscript.
Research was performed at the Department for Health Evidence, Radboudumc, Nijmegen, the Netherlands. Research was presented as a poster at the EuroQol Academy Meeting in Budapest, March 5–7, 2018.