
Abstract
Discrete choice experiments (DCEs) are a commonly used survey-based method to quantify preferences for the characteristics (termed attributes) of health care interventions.1–3 DCEs are underpinned by 2 key economic theories: random utility theory (RUT) and Lancaster’s theory of consumer demand.4,5 In a DCE, respondents are asked to choose their preferred option from a series of hypothetical scenarios (choice tasks) defined by attributes and levels combined according to a mathematical design. Using respondents’ stated choices, it is possible to infer how changes in the attributes’ levels affect satisfaction or “utility” derived from an option and the probability of an option being chosen.
Systematic reviews have shown DCEs in the health care context are increasingly used to elicit preferences for benefits and risks.6,7 The use of DCEs to inform regulatory decision making by identifying the levels of risk consumers of health care interventions will tolerate for an associated benefit has also been mooted.8–10 In these contexts, risk and uncertain outcomes often feature in DCE designs, yet numerical probabilistic information is a notoriously difficult concept to present and communicate clearly.6,11,12
In health risk communication literature, it has been suggested that pictorial presentations of probabilistic information may help individuals’ understanding.13–15 In contrast, health care DCEs most commonly present risk information using percentages. 6 If DCE respondents do not understand the choice task, they may employ simplifying heuristics such as ignoring confusing attributes, violating the axiom of continuity in preferences, resulting in biased preference estimates.
Positivist qualitative research methods, such as “think-aloud,” have been used to illuminate the underlying decision strategies employed and understand whether respondents answer consistently in line with a priori expectations underpinning the DCE. 16 Think-aloud is a type of cognitive interview17,18 purposefully developed to understand approaches to problem solving.19,20 Such qualitative research methods have been criticized for their susceptibility to researcher biases. 21 It has also been highlighted in concurrent think-aloud that the burden of speaking while simultaneously completing a task may change how the task is completed. 22 If the act of thinking aloud disturbs natural decision-making behavior, generated data may be of limited use and not reflect the decision-making processes under examination. Alternative retrospective think-aloud relieves the task burden but remains susceptible to other biases associated with recalling information. 23
As an alternative to cognitive interviews, psychologists have studied eye movements to understand how visual information is being processed. 24 In its most basic form, this has involved researcher-individual observation of participants’ eyes and manual notes on pupil dilation. 25 More sophisticated methods have developed in line with changes to, and availability of, technology. The “eye-mind hypothesis,” proposed by Just and Carpenter, 26 underpins most psychological analyses of eye-tracking data. The logic of using eye-tracking data is based on the assumption that where people look is indicative of their cognitive processing. Just and Carpenter state, “There is no appreciable lag between what is fixated and what is processed.”26(p331) A substantial body of research supports this proposal (see Rayner’s comprehensive review 27 ). Therefore, attention, measured in “fixations” (where an individual’s attention falls), can be thought of as quantification of individuals’ information processing, although it is still possible that what is processed may still be ignored.
This study aimed to explore eye-tracking as a method to understand how individuals attend and process information in a DCE. A secondary aim was to investigate whether alternative approaches to presenting and communicating risk affected attention and processing strategies to understand whether pictorial presentation reduced cognitive burden or the need for simplifying heuristics.
Methods
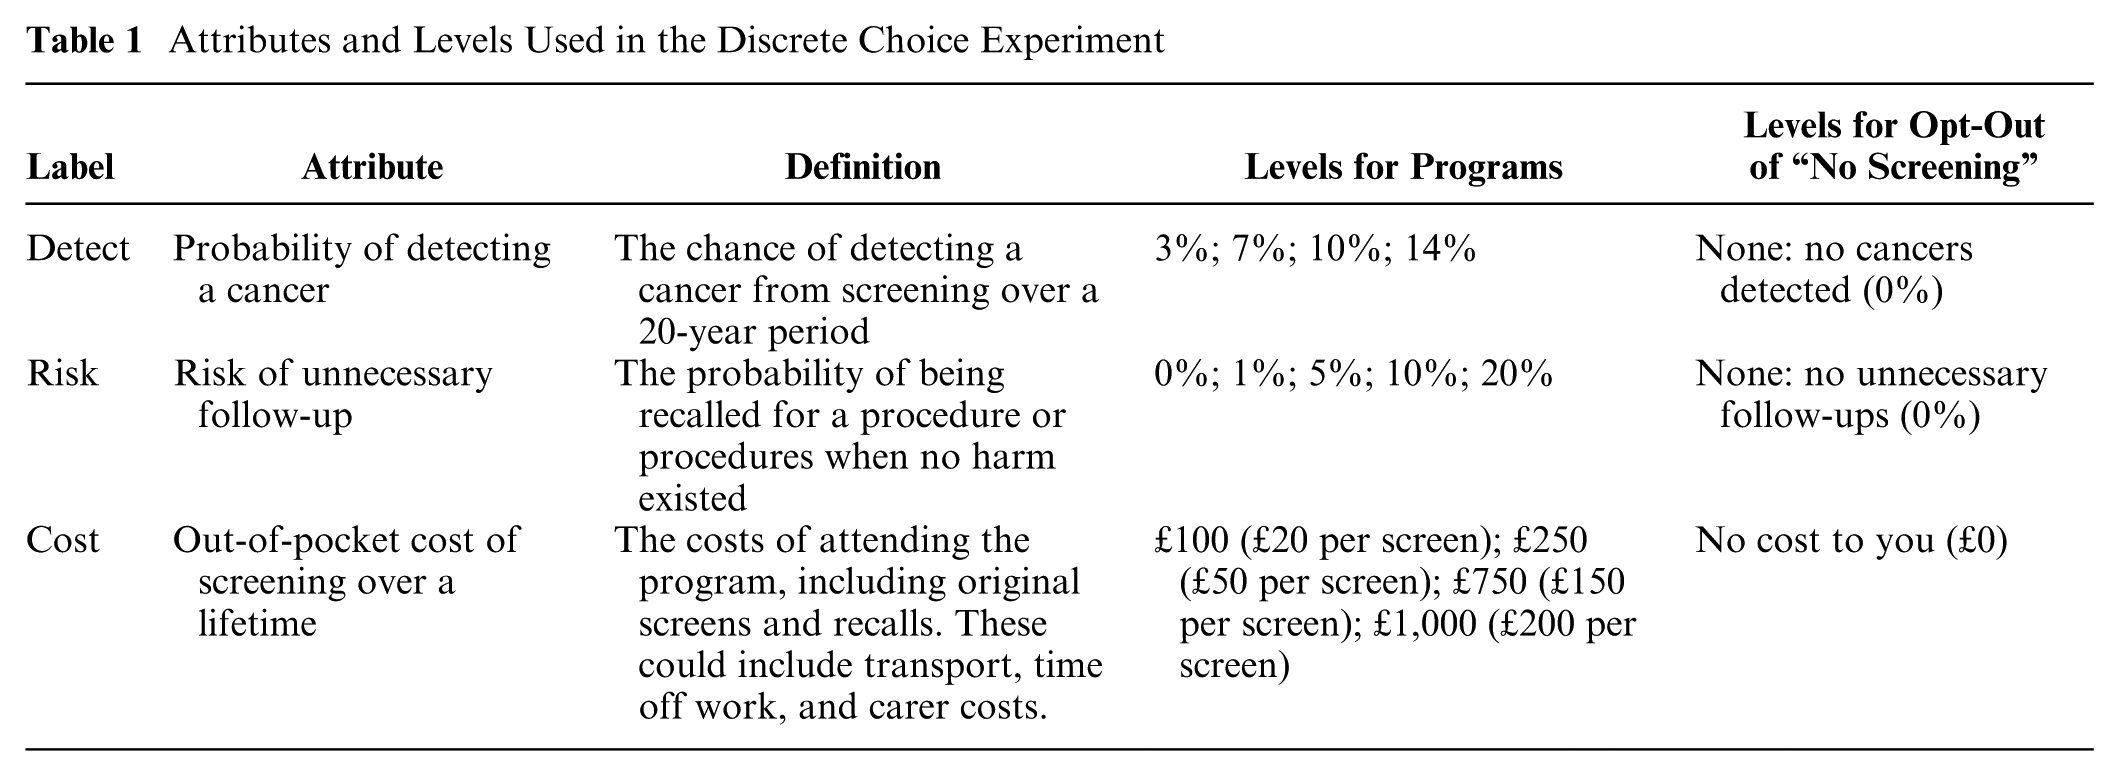
Eye-tracking was used to investigate how respondents complete a selected example of a DCE. This study used a DCE survey designed to elicit preferences from female members of the public for a breast screening program described by 3 attributes (probability of detecting a cancer, risk of unnecessary follow-up, and out-of-pocket screening costs). Attribute labels, definitions, and levels are presented in Table 1.
Attributes and Levels Used in the Discrete Choice Experiment
This survey has been published in detail elsewhere. 28 In brief, respondents chose between 2 hypothetical breast screening programs and a “no screening” opt-out. Estimates of breast screening in the United Kingdom suggest uptake to the national program is approximately 75%, 29 implying some women who are invited do not attend. The option of “no screening” allowed women to express this preference. The levels for the “no screening” alternative were written with text to avoid confusion with icons that could represent both people screened or people not screened. Participants competed 11 choice tasks generated by Ngene 30 with a design minimizing the D-error with priors obtained from a pilot study. Survey respondents were randomized to 1 of 2 surveys, presenting risk as either percentages only (“percentages”) or percentages with icon arrays (“icon arrays”).
Eye-Tracking Metrics
Eye movement measures include those associated with fixations (where the eye is fixating on a particular aspect of the visual input) and those associated with saccades (eye movements between fixations). 31 Saccadic patterns in eye-tracking data have been used to explain visual responsiveness, such as how quickly an individual can locate a target. 32 In the context of choices, saccades have been used to understand how individuals seek information to make a decision, with research suggesting vertical movements (when alternatives are presented in columns) align with expected utility theory (EUT). 33
Pupillometry (measuring pupil size) can also reveal cognitive load. 34 When individuals think hard about a difficult task or one requiring significant memory load, the pupils dilate. 35 The exact mechanism by which this occurs is not entirely known, but pupil size is regulated (like heart rate, perspiration, and goosebumps) by the sympathetic division of the autonomic nervous system, which stimulates the body’s response to stress (either fight or flight).36,37 There are now many data-driven studies that empirically demonstrate a relationship between task complexity and pupil dilation.38–40 As early as the 1960s, Hess and Polt 37 used a mirror and a camera to monitor academics’ pupil sizes as they solved multiplication problems, noting a correlation between dilation and question complexity.
Study Population and Study Sample
The relevant study population was women who were, or would be, eligible for the national breast screening program. Although breast cancer does occur in men, national screening programs are targeted at women because of the considerably higher prevalence. 41 The sample was limited to women fluent in English and aged between 18 and 70 years (the current cutoff for routine screening in England). 42 There were no other exclusions. The study took place in a laboratory setting requiring travel to the university’s campus, and women were recruited through local advertising on public noticeboards (post offices, coffee shops) and the university’s public website. A pilot study informed the experimental setup using eye-tracking conducted with employees of the University of Manchester (n = 15). The main exploratory study aimed for a sample size of 40 women on the basis of a similar study, 43 which also used a sample of 40, and feasibility of data collection.
Eye-Tracking Apparatus
A desktop-mounted EyeLink 1000 was used. 44 The eye-tracking device calculates the participant’s gaze position using a camera to detect the corneal reflection from an infrared illuminator. The device recorded the eye position a thousand times a second, every millisecond. The head rest was positioned 43 cm from the screen, as per the manufacturer’s recommendations, and this distance was remeasured for every participant. While the machine had a capacity for binocular recording, monocular recording of the dominant eye, with the best calibration, was conducted. The laboratory was a dark, windowless room with minimal luminosity. Choices in the DCE survey were made via a handheld games controller.
The survey containing the DCE was programmed for the eye tracker with assistance from EyeLink Experiment Builder software. 44 The survey included 3 warm-up questions, allowing participants to become familiar with the handheld controller buttons. All choice sets and images of the DCE in both risk formats were identically sized to the nearest pixel.
Data Collection
Ethical research approval was obtained from the University of Manchester’s Research Ethics Committee (AJ/ethics/1809/13/ref13178). Following consent, women were randomly (50:50) assigned to receive risk attributes framed either as percentages only or with an icon array. The women were asked to place their chin on the head rest, make themselves comfortable, and refrain from speaking. Calibration then began. If the calibration was “good” (corneal reflection was consistently recorded), then it was validated through additional calibration, ensuring all screen corners were recordable before the survey began. If either calibration or validation failed, the procedure restarted using the other eye. In the event that neither eye could be calibrated, the experiment ended.
When respondents were completing the DCE, a between-choice set calibration occurred called “drift correction.” This procedure corrected for any movement of the participant’s head, improving the accuracy of the collected data.
Background questions, including self-reported measures of attribute attendance, were completed by the participant on an iPad after participants had finished the DCE with the eye tracker (see online Appendix A).
Analysis
Analysis, in this exploratory study, was descriptive and focused on the recorded measures that may reveal information about individuals’ decision-making processes when completing a discrete choice set. Analysis was conducted to explore the effect of risk communication format on choices made in the DCE, fixations to predefined areas of interest, saccades, and pupil size (as a proxy for task difficulty). All analyses were conducted with STATA software. 45
The Choice Data
The choice data from the DCE were analyzed using a heteroskedastic conditional logit model based on this utility function:
where U represents individual n’s indirect utility from alternative j.

Icon arrays have been proposed as a means of reducing the cognitive load associated with understanding probabilities and hence improving choice consistency and reducing error variance.46,47 To investigate this, the scale parameter was modeled as a function of the ICON dummy variable, allowing error variance to systematically vary by risk communication format:

Areas of Interest
Eye-tracking data provide highly detailed records of all locations the user has looked at, and reducing these data to a level that can be easily analyzed, taking into account computational limitations, is challenging. Data coordinates were segmented into defined areas of interest (AOIs), reducing the data file size to a more manageable level. 48 AOI quadrants were defined for each choice set, based on the sections of the task that might be stimulating for the participant, for example, attribute titles, levels presented, and response options. AOIs for attribute levels were of particular interest, which differed depending on the DCE version received (percentages only or icon arrays). Areas outside the AOIs were used to measure the amount of gaze in the “white space,” which would suggest “daydreaming” and perhaps disinterest.
Fixations
Fixations were measured in milliseconds and conservatively defined as less than 1 degree of movement for 75 ms, in line with a previous study. 43 If a fixation was under this threshold, and another fixation occurred within 1 degree of the original fixation, then the fixations were merged. Merging adjacent fixations allowed identification of fixations that may have been missed due to measurement errors.
Collecting fixation data allowed analysis of information processing via respondents’ attention to the choice task. Fixation data were analyzed in terms of 1) number of fixations, 2) average length of a fixation, and 3) total dwell time (sum of all fixation durations) to an AOI. Self-reported attribute nonattendance (ANA) was recorded in the iPad-based survey.
Saccades
Saccades were measured by their direction (angle of movement). The EyeLink 1000 tracker records degrees of vertical direction (between −180° and 180°), with zero degrees being a perfectly horizontal movement to the right. A rightward saccade was defined as movement between −45° and 45°, downward as movement between −135° and −45°, leftward as movement between −135° and 135°, and an upward saccade as a movement between 45° and 135°. Blinks were identified by EyeLink’s in-built software 49 and differentiated from “normal” saccades by immediate loss of pupil image on the camera as the eyelid closed. These blink data were acknowledged but disregarded from the analysis.
The saccade data of interest were the number of saccades made and the direction of these saccades. No specific hypothesis existed about the number of saccades a respondent may make. There is evidence that more up-down movements could suggest the choices were made in line with EUT 33 and Lancaster’s theory as a respondent would be considering the alternative as a whole.
Pupillometry
Pupil size was calculated by the eye tracker counting black pixels on the camera image of the eye to identify and measure pupil diameter. Pupil dilation was calculated as the difference between minimum and maximum pupil size, retained as an absolute measure rather than a percentage that can be inflated when baseline pupil size is small. 50
With the EyeLink 1000, pupil size data were not calibrated, and units of pupil measurement typically vary between studies. Pupil size was recorded as an integer number, based on the number of pixels but measured in arbitrary units, meaning that results cannot be compared across studies or even within studies if there was inconsistent luminosity or stimuli appeared at different locations on the screen, as these can affect pupil size measurement. However, in this experiment, the choice set stimuli, either icon arrays and/or percentages, occurred in precisely the same location and the head-mount, monitor, and camera were identically located for each subject. In addition, all experiments took place in 1 laboratory with identical equipment setup and light sources, keeping consistent luminosity.
Pupil size data were described as 1) average pupil size per individual fixating to an attribute in a choice set and 2) average change in pupil size per individual fixating to an attribute in a choice set. Pupil size data were used as a measure of cognitive burden.
Influence of the Risk Presentation Format
Eye-tracking data were recorded for each choice set of the 2 alternative approaches to risk presentation completed by each participant. Data were analyzed using ordinary least squares (OLS) in a linear regression model that fitted the observed data by minimizing the sum of the squared residuals. 51 This method was chosen to investigate the effect of the risk communication method on each of the outcomes of interest. The relevant outcomes summarized using count data for everyone in each choice set were number of fixations and number of saccades. In addition, pupil size and response duration level were summarized for each individual in each choice set. The aggregate outcome summarized was the dwell time. Direction of saccade was a binary outcome and calculated as the proportion of times at the saccade level (in a choice set) where the binary variable equaled unity.
For all outcomes, the regression specification in equation (4) was estimated separately for each of the 3 attributes in the DCE (detection, risk, and cost):

where


The estimated constant,
The results from the survey’s debriefing questions showing self-reported attribute nonattendance were compared with the mean dwell time for each attribute using the regression specification in equation (7) estimated separately for the 3 attributes in the DCE (detection, risk, and cost):


The estimated constant,
Table 2 summarizes the eye-tracking data recorded for each outcome. Table 2 also presents the definition of
Definitions and Interpretation of Eye-Tracking Outcomes Data
ANA, attribute nonattendance; DT, dwell time; NOF, number of fixations; NOS, number of saccades.
0 = up-down; 1 = left-right.
Results
Forty-two women were recruited, but results from 2 women were excluded because their eye movements could not be accurately recorded due to calibration failure. Data from 40 women aged between 18 and 63 years were included in the exploratory analysis. These 40 women were randomly assigned to a risk format within the DCE (n = 20 for percentages; n = 20 for icon arrays).
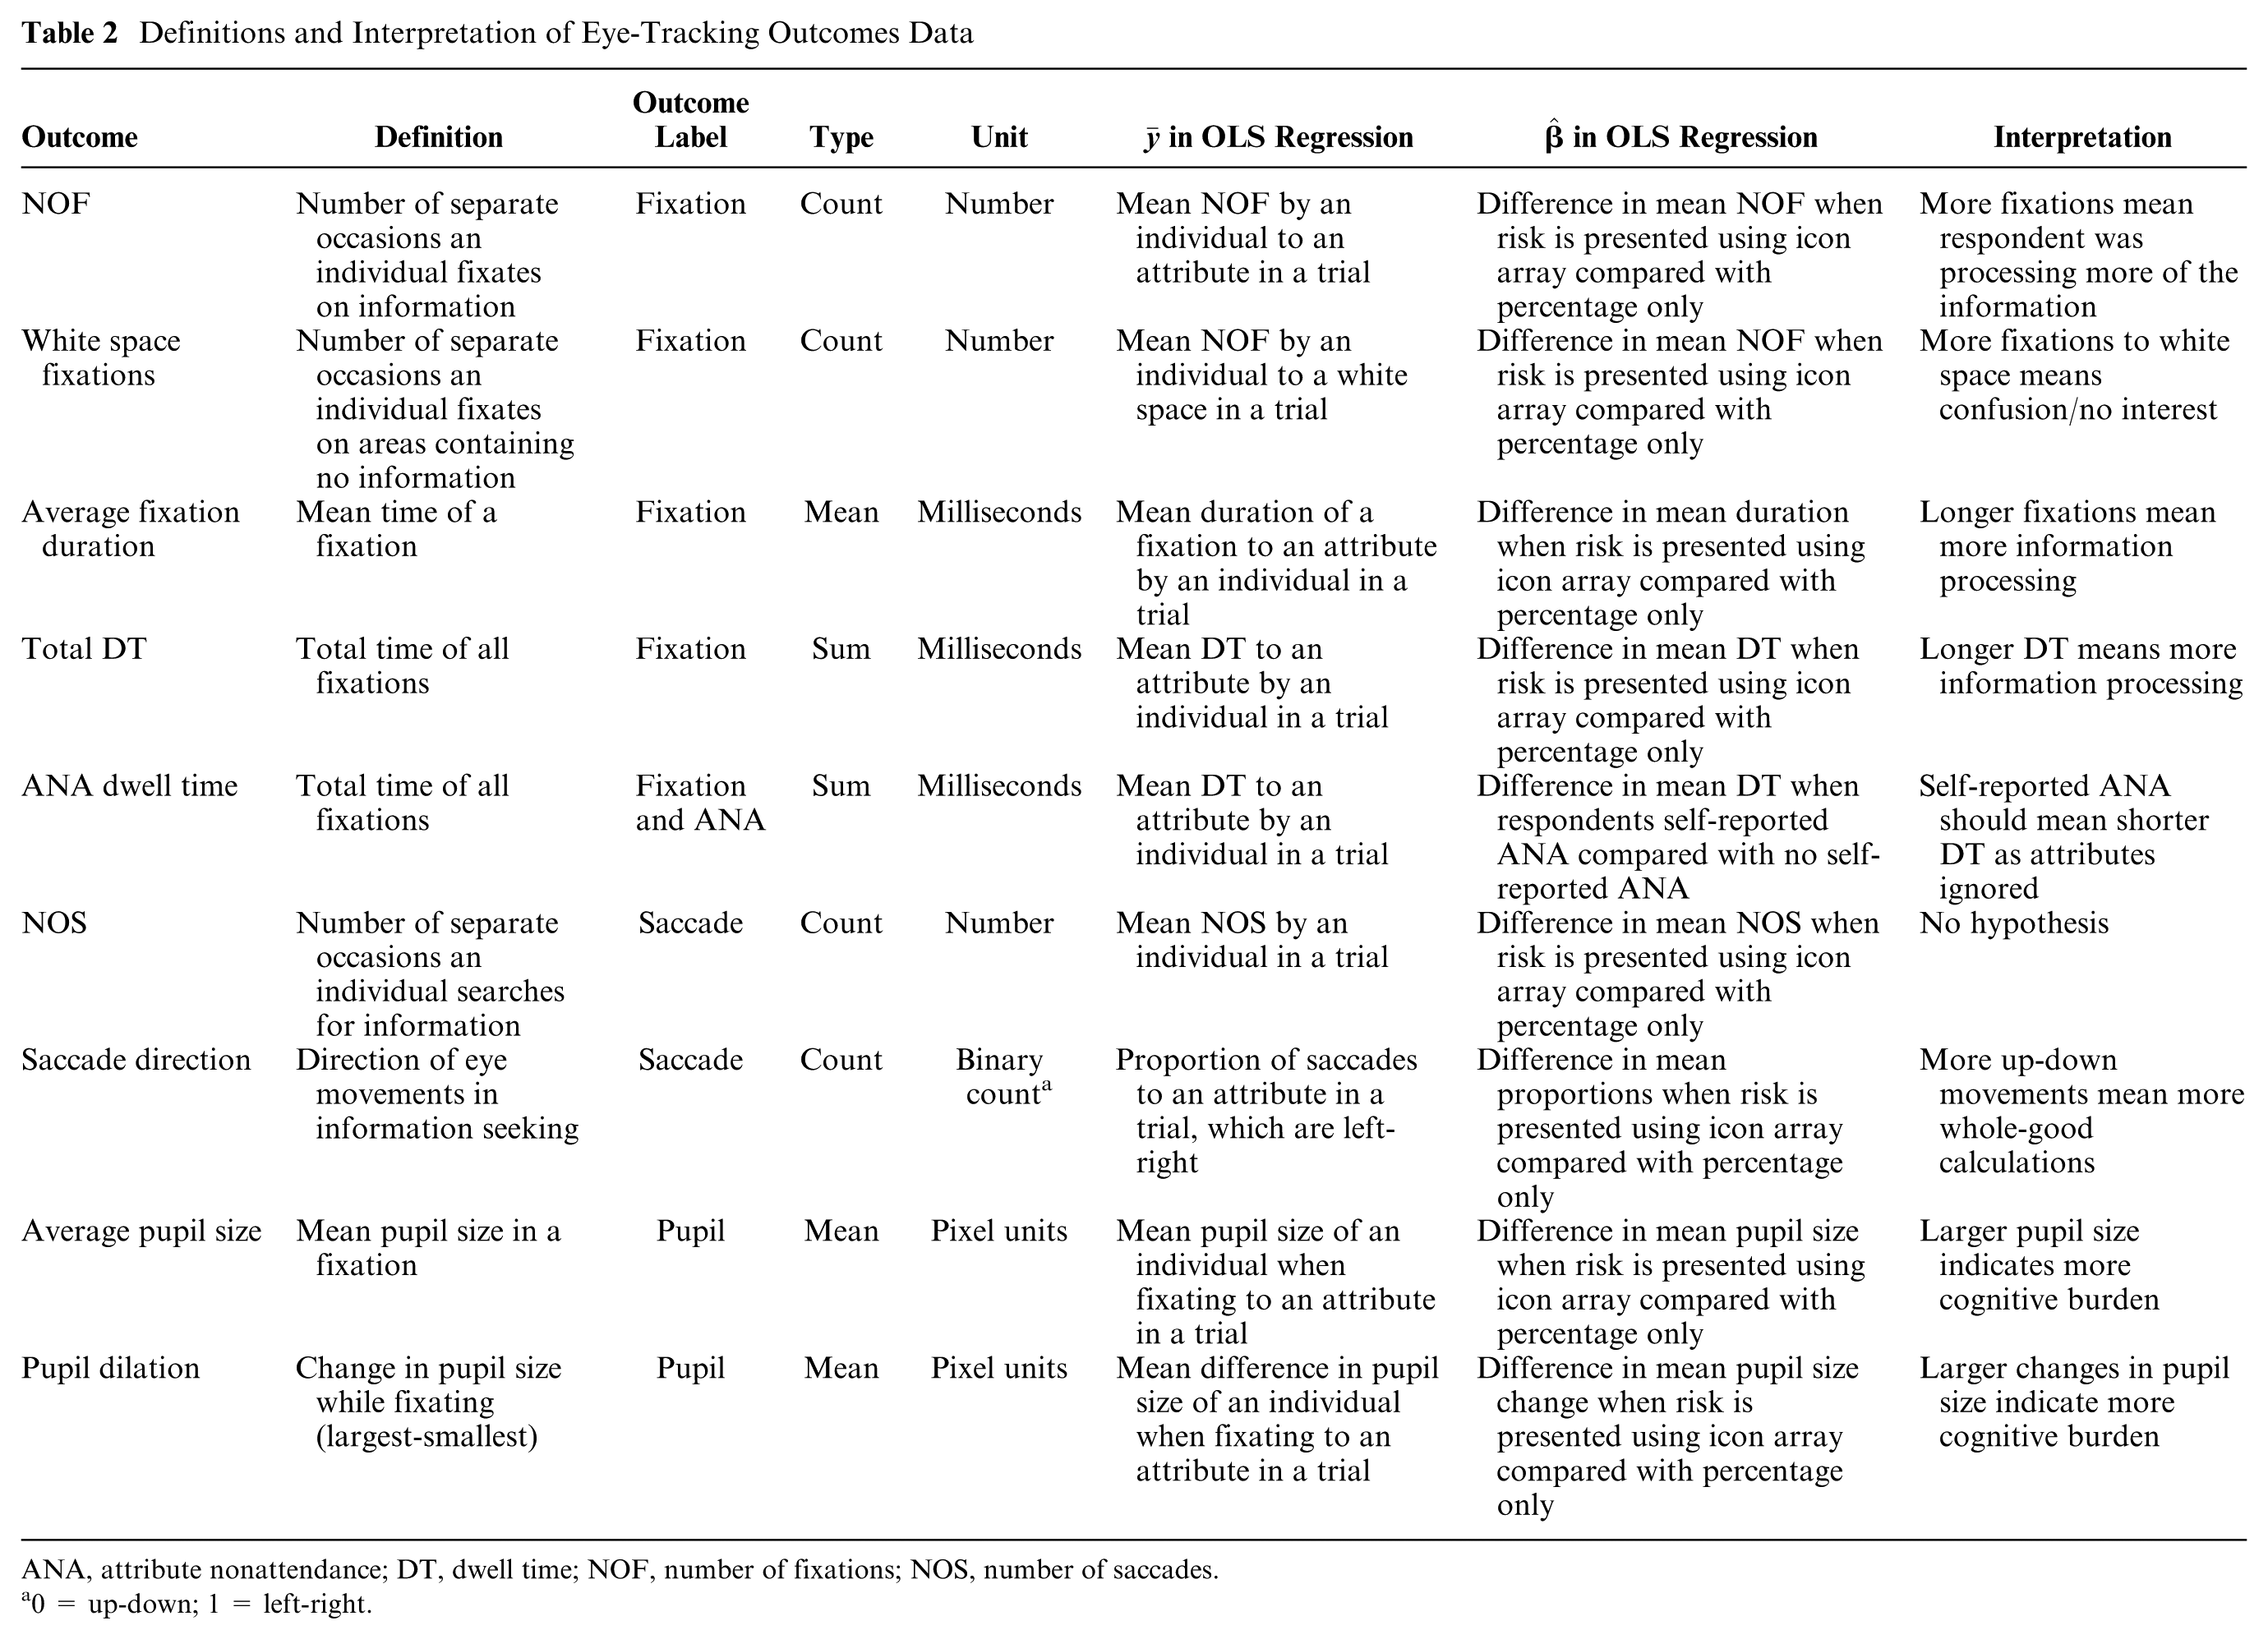
The results of the heteroskedastic conditional logit model analyzing the choice data are shown in Table 3. The results showed all estimated coefficients had the expected sign (negative coefficients on the attributes “risk of unnecessary follow-up” and “cost of screening program” and a positive coefficient on the attribute “probability of detecting a cancer”). Two of the 3 estimated coefficients were statistically significant (at P < 0.001), but the coefficient on the cost attribute was not statistically significant.
Heteroskedastic Conditional Logit Results a
Log likelihood = −329.87321. n = 42. Observations = 1386.
Probability of detecting a cancer.
Risk of unnecessary follow-up.
Out-of-pocket cost of screening over a lifetime; ICON identifies respondents who received icon arrays and percentages.
P < 0.005. ***P < 0.001.
Figure 1 shows examples of the tracked eye movements for 2 respondents each completing 1 of the 2 versions of the DCE. Video examples of eye-tracking (collected in pretesting) can be found in online Appendices B and C. Visual examination of the scan paths of respondents indicated the eye-tracking experiment had face validity, with almost all fixations to the predefined AOI. On average, each participant made only 2 fixations (2.38 for the percentages version; 2.40 for the icon arrays version) to areas of white space (with no information) per choice set question. There was no significant difference (P = 0.197) between the 2 risk communication formats.
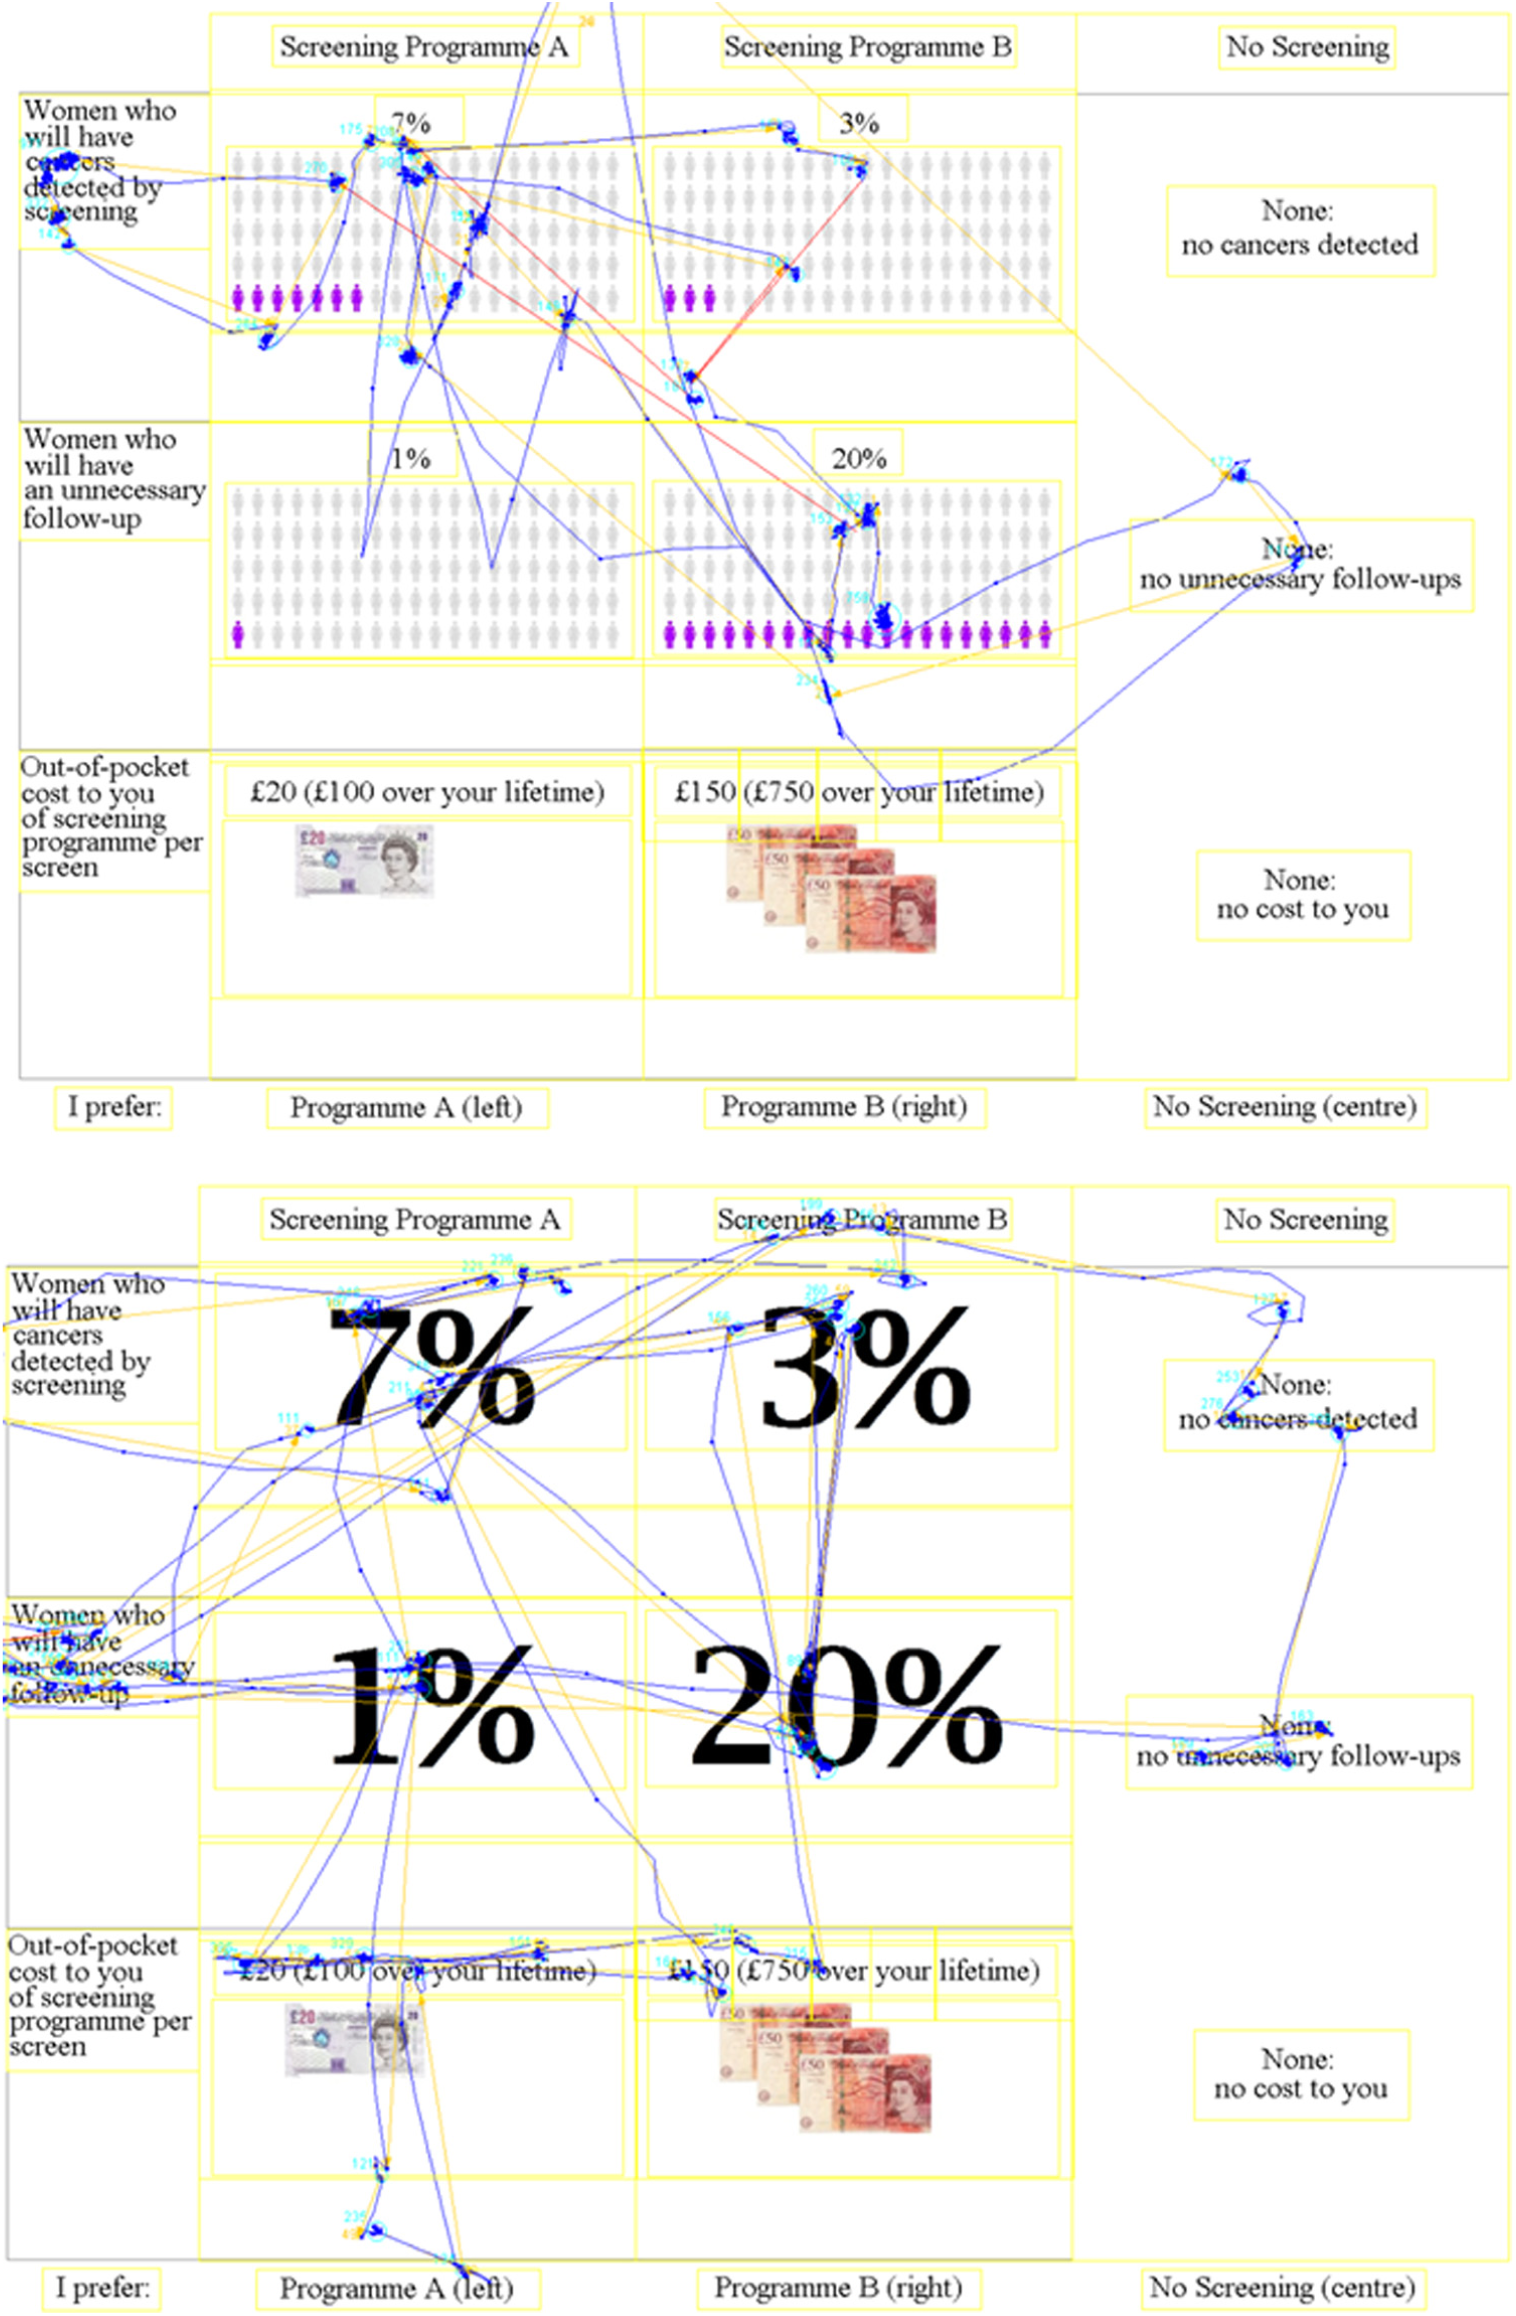
Example of scan paths from eye-tracking data for respondent completing the discrete choice experiment.
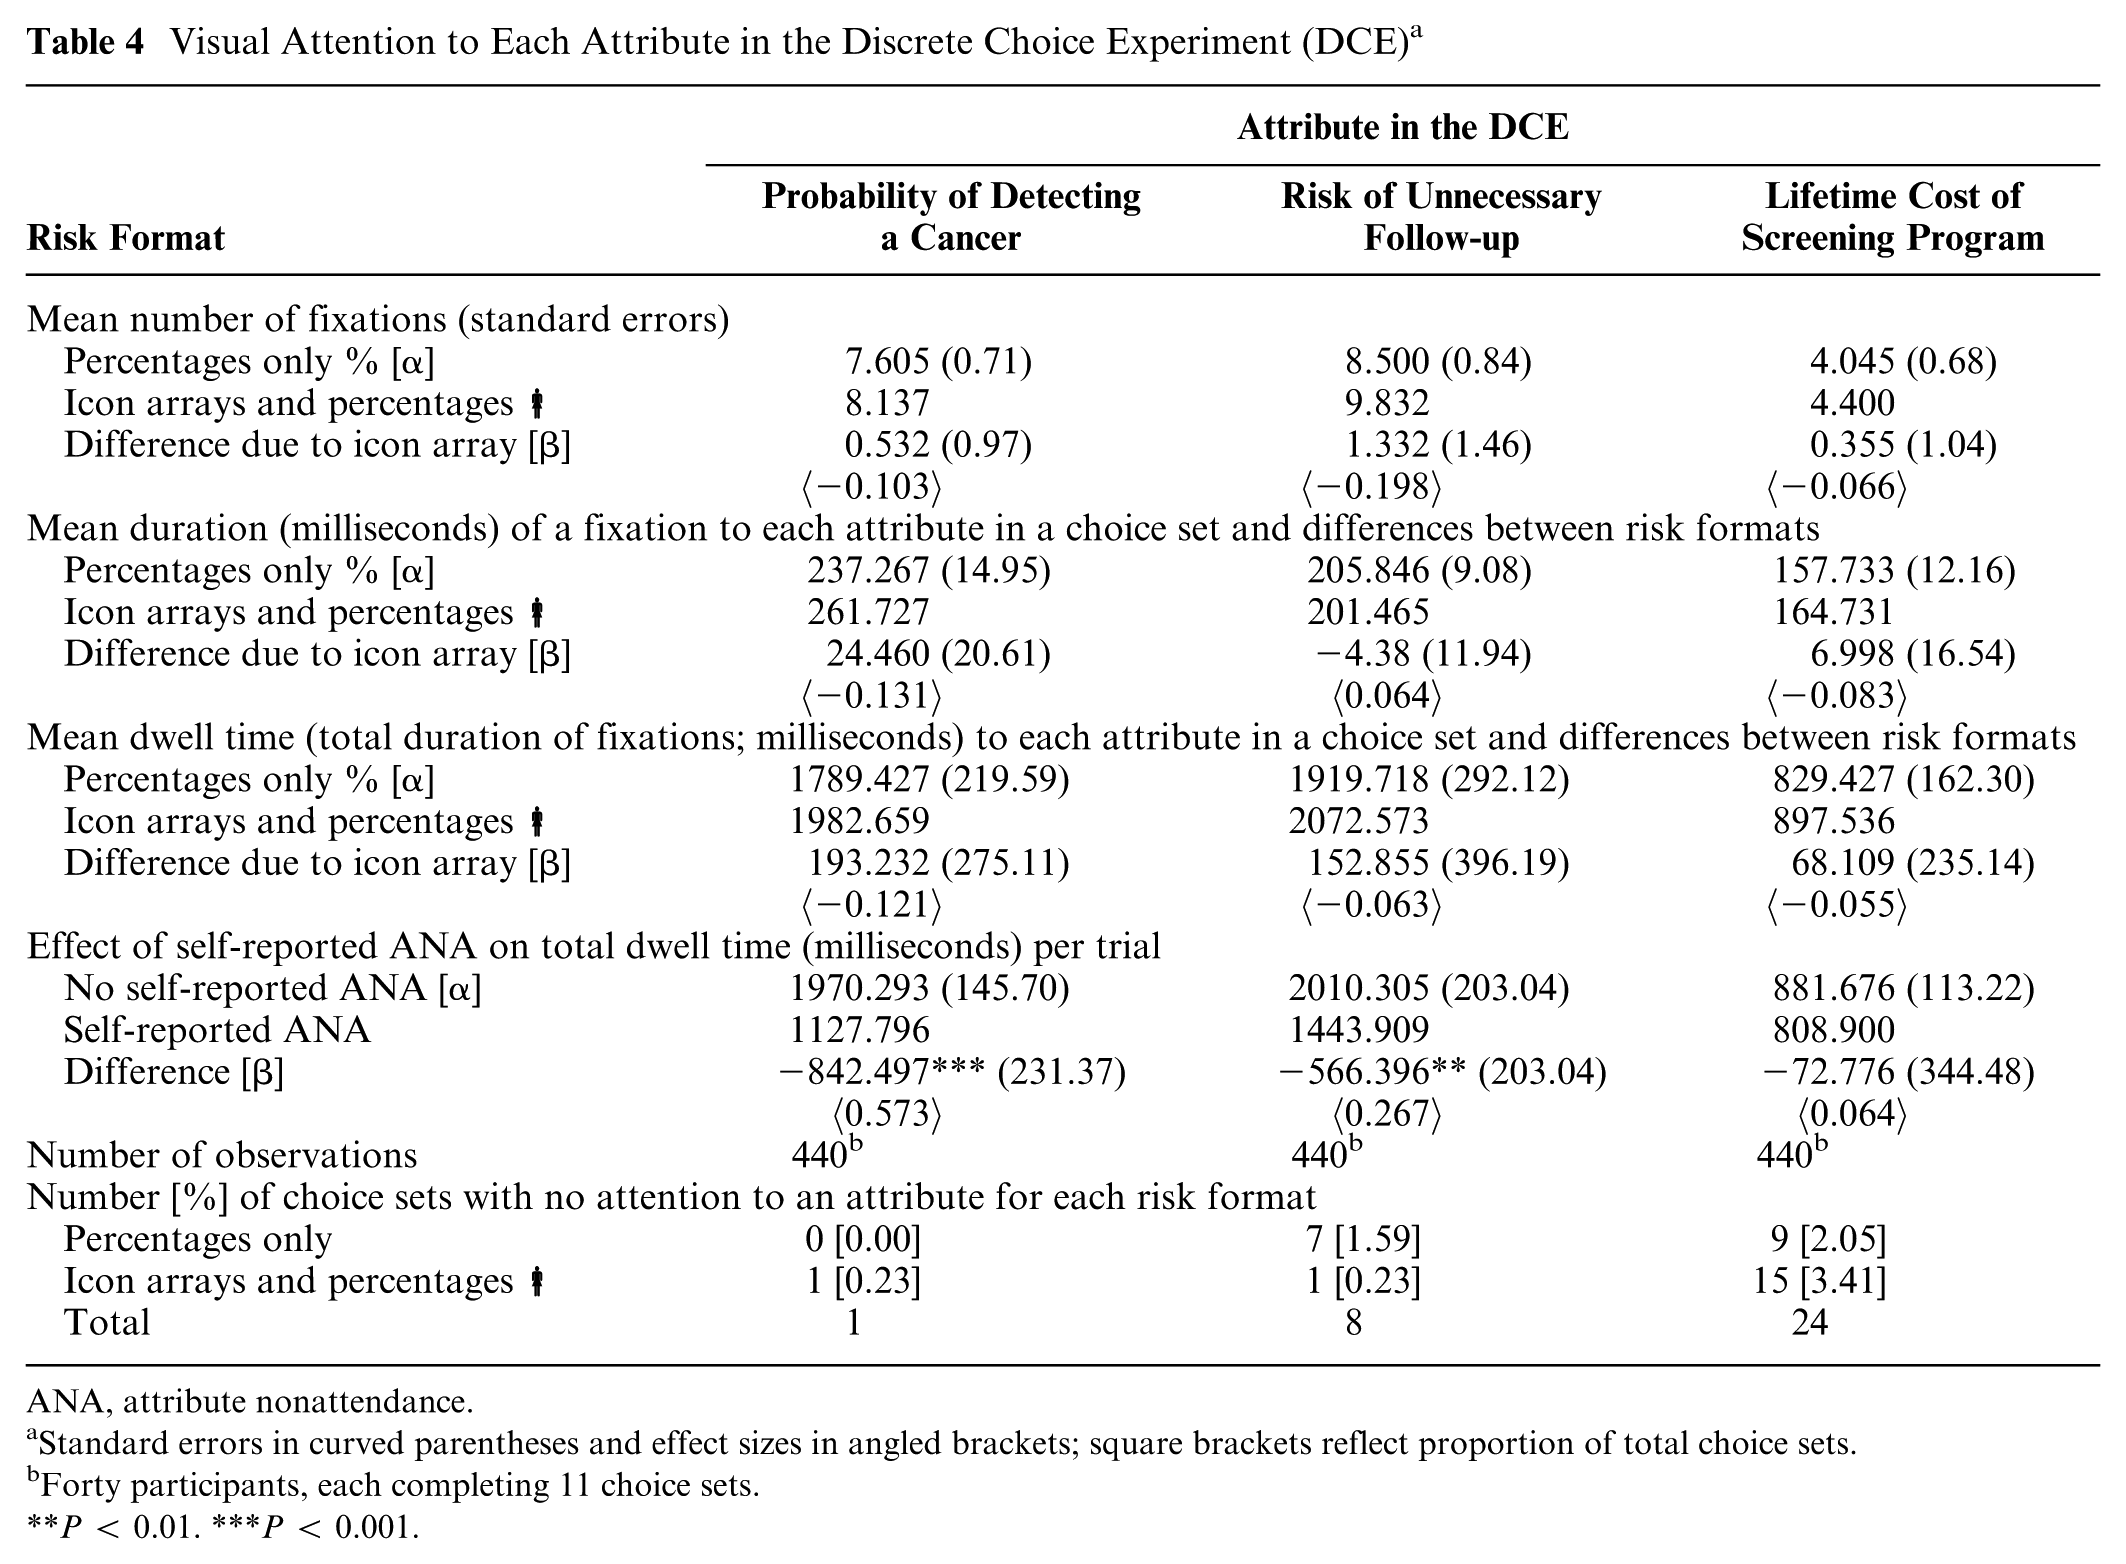
Visual Attention: Fixation and Dwell Times
Table 4 summarizes data for fixation and dwell times. The attributes, risk and detection, had the highest number of fixations, attracting almost twice as many fixations as the cost attribute. Fixations to these attributes were also longer in duration. The mean number of fixations made when looking at a choice set was not statistically significantly different between each version of the DCE (detect, P = 0.587; risk, P = 0.366; cost attribute, P = 0.735). There was no statistically significant difference in fixation duration between the risk communication formats to either the risk (P = 0.716), detect (P = 0.243), or cost attribute (P = 0.674).
Visual Attention to Each Attribute in the Discrete Choice Experiment (DCE) a
ANA, attribute nonattendance.
Standard errors in curved parentheses and effect sizes in angled brackets; square brackets reflect proportion of total choice sets.
Forty participants, each completing 11 choice sets.
P < 0.01. ***P < 0.001.
When the number of fixations and the fixation duration were aggregated to measure the complete dwell time to an attribute, results were maintained. Eye-tracking participants spent a total of 1.8 seconds, 1.9 seconds, and 0.8 seconds on each attribute in the DCE (detect, risk, and cost), respectively. Between the 2 risk communication formats, there was no statistically significant difference in the time spent processing attributes (detect, P = 0.487; risk, P = 0.702; cost attribute, P = 0.774).
Attribute Nonattendance
Comparing eye-tracking dwell time data with self-reporting from debriefing questions, it was found that mean dwell time was statistically significantly lower for participants reporting nonattendance to these attributes (“detect” and “risk”). The results in Table 4 show the difference was substantial in magnitude, with nonattendance to risk resulting in a 25% lower dwell time to the risk attributes (P = 0.008) and nonattendance to detect resulting in over 40% shorter dwell times (P = 0.001). There was no statistically significant difference (P = 0.834) between dwell times to cost between those who reported looking at the attribute compared with those who self-reported not attending to the attribute.
Respondents who received risk communicated as a percentage only seemed to give complete visual attention to the attribute “detect,” attending to this attribute in every choice set. Table 4 shows that when risk was framed using percentages only, complete nonattendance to the risk attribute occurred in 7 choice sets compared with only 1 choice set when risk was presented using icon arrays. Cost was the attribute most neglected by the respondents (24 choice sets completed with no apparent visual attention to this attribute).
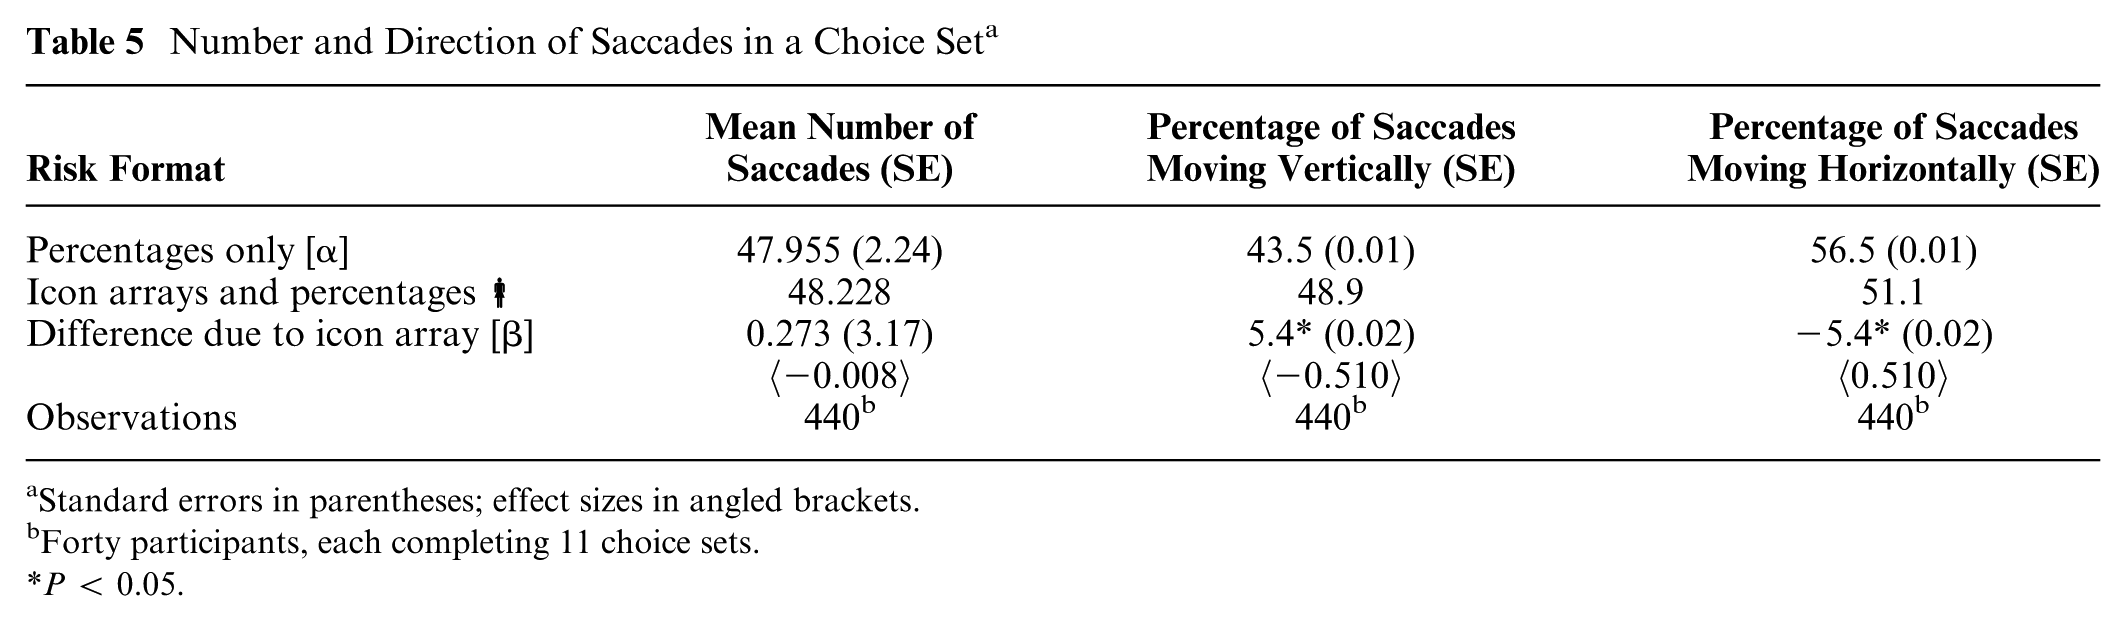
Saccades
Information searching by respondents was evaluated through analysis of saccade data. These data showed respondents had more upward-downward eye movements, which has been suggested to be in line with EUT 33 and Lancaster’s theory. Table 5 shows there was no statistically significant difference (P = 0.932) between the 2 DCE versions in terms of the mean number of saccades per respondent in each choice set (around 48 movements). Respondents completing the DCE in either version made more horizontal (left-right) saccades than vertical (up-down).
Number and Direction of Saccades in a Choice Set a
Standard errors in parentheses; effect sizes in angled brackets.
Forty participants, each completing 11 choice sets.
P < 0.05.
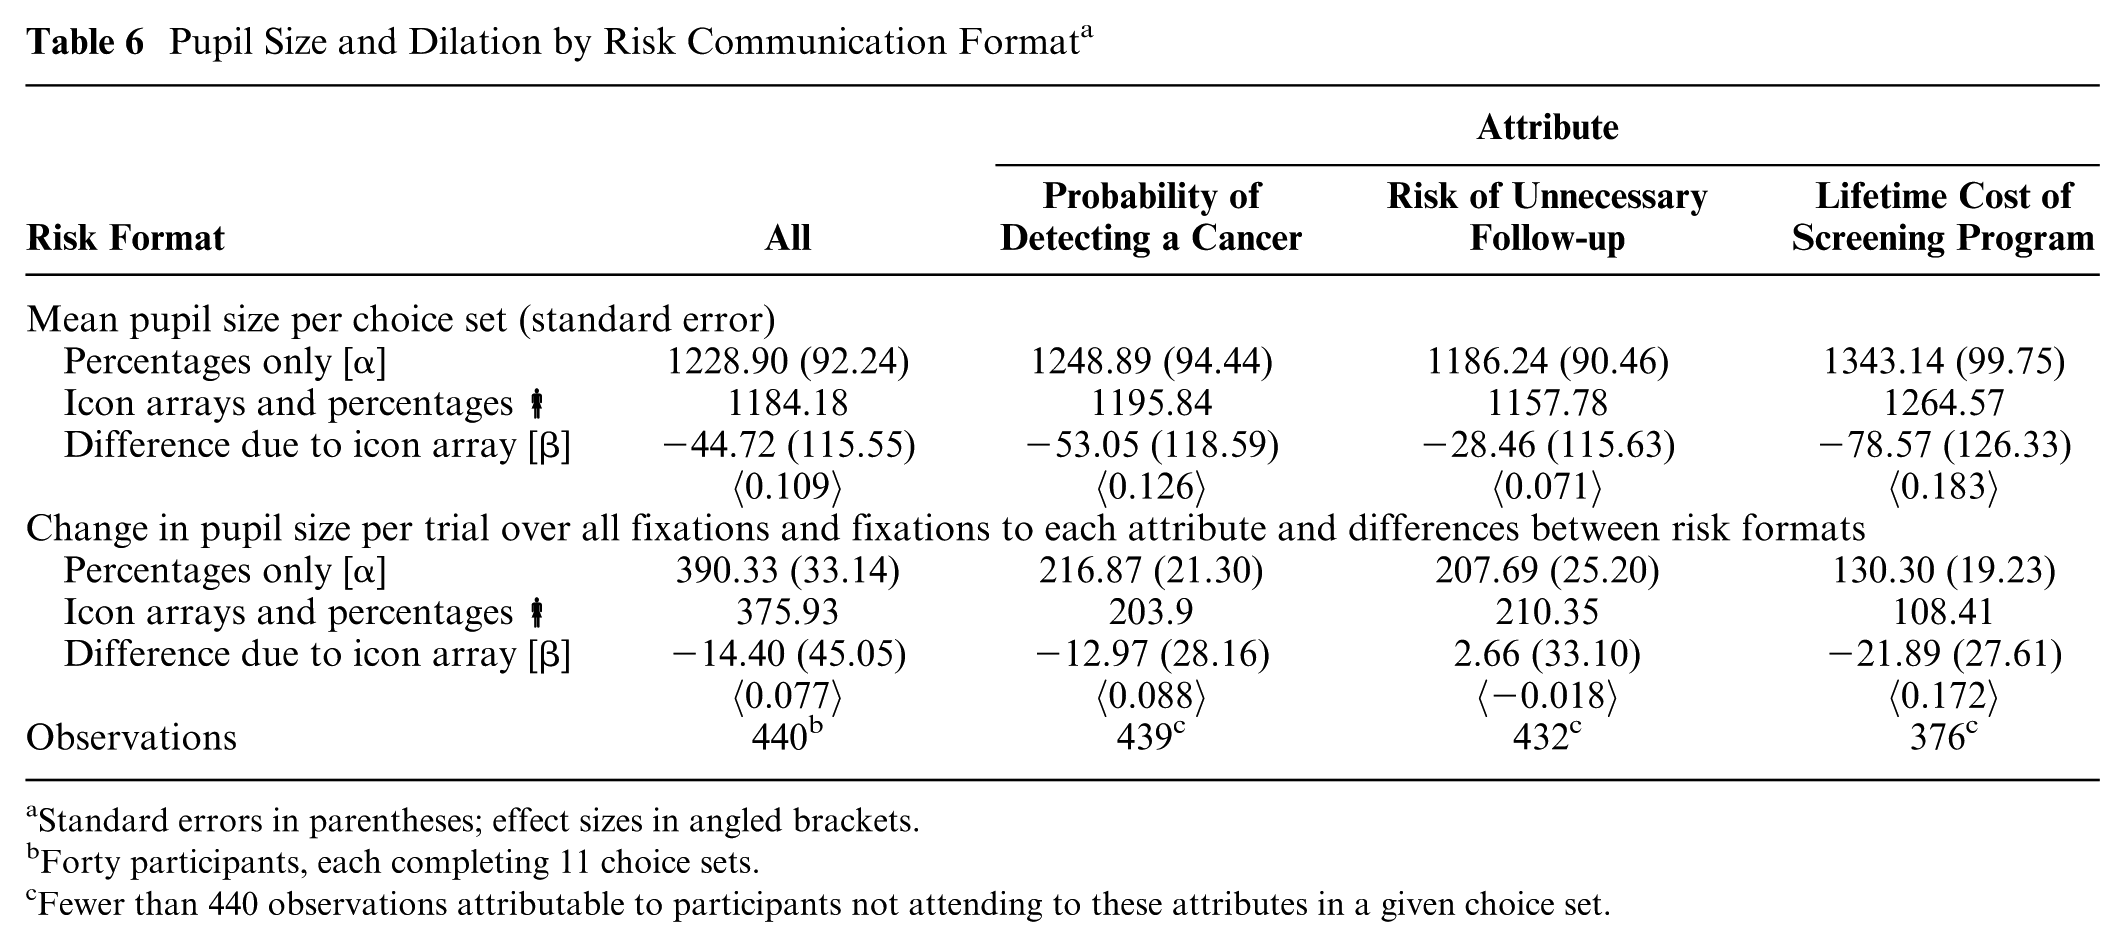
Pupil Dilation
Data reporting the mean degree of pupil dilation when completing the DCE and for each of the individual attributes are presented in Table 6. The number of observations varied, reflecting that some attributes had incomplete visual ANA. For each of the 3 attributes, the mean pupil size was smaller for respondents completing the DCE with icon arrays (P = 0.701). None of these differences were statistically significant.
Pupil Size and Dilation by Risk Communication Format a
Standard errors in parentheses; effect sizes in angled brackets.
Forty participants, each completing 11 choice sets.
Fewer than 440 observations attributable to participants not attending to these attributes in a given choice set.
Discussion
This exploratory study suggested that eye-tracking could be used as a method to identify how respondents complete a DCE and reveal information on their choice strategies. The eye-tracking experiment appeared to be well calibrated with very few fixations to white-space areas on survey pages. This finding also suggests respondents engaged in the task rather than “daydreaming.” The study also explored if the type of risk presentation format affected DCE completion. Descriptive data on the number of fixations indicated the risk format had no effect on participants’ visual attention to relevant attributes. Results indicated there was no difference in information processing. Attributes “risk of unnecessary follow-up” and “probability of detecting a cancer” both attracted more attention than the cost attribute. This could suggest that the attributes “risk of unnecessary follow-up” and “probability of detecting a cancer” required more information processing or that this information was more important for study participants. This hypothesis was partially confirmed by results from the heteroskedastic conditional logit model.
Other eye-tracking studies have investigated the effect of risk communication format on individuals’ information processing.53–55 Keller et al. 55 found no statistically significant difference between attention to icon arrays or percentages when comparing high and low numerate samples. Measuring numeracy using 3 standardized questions, 56 split-sample analysis of our data corroborated these findings with no statistically significant differences between attention to the different formats by numeracy.
Self-reported ANA was confirmed by eye-tracking data on visual attention to the “risk” and “detect” attributes. When respondents reported that “risk” and “detect” were unimportant in choice making, data reflected that they had paid significantly less attention to these attributes. There was no difference in attention between participants reporting attending to the cost attribute and those who did not. The results of this study suggest that self-reported ANA to cost attributes, as measured through supplementary questions to the DCE, may not be robust. Balcombe et al. 57 also found in their food-based eye-tracking study that an individual reported attending to the cost attribute but never fixated on this attribute in the experiment. Qualitative research has found cost to be a delicate attribute in health care DCEs, with interviewees reporting that “I wouldn’t really be concerned about the cost.” 17 This could be because it is genuinely not important or because the presence of a researcher induces some “social desirability bias” similar to the Hawthorne effect where participants align to perceived social norms.58,59
Respondents in both versions of the DCE exhibited more horizontal movements than vertical, and those completing the DCE with icon arrays spent more time considering each alternative separately to make their choice. The “vertical” and “horizontal” movements are likely related to the choice set design where alternatives were presented in columns; if alternatives were presented in rows, participants may have made even more horizontal movements. The difference may also be driven by the location of the colored icons in the array. In a study involving a simple choice set experiment, with 1 risk attribute and 1 cost attribute, Arieli et al. 33 concluded that a high proportion of vertical eye movements was indicative of respondents conducting expected payoff calculations. In this study, more vertical movements could indicate that the respondent was weighing up each alternative as a whole to decide which would offer the most utility given the uncertainty in the “detect” and “risk” attributes, suggesting EUT-type calculations. This behavior could also be seen as aligning with Lancaster’s theory, 4 which suggests individuals value the attributes of a good or service, as individuals are taking account of each alternative to make a choice. In contrast, a high proportion of horizontal eye movements would indicate that attributes were being considered independently, such as risk and probability in this DCE. This study provided an exploratory investigation of eye-tracking to understand whether risk presentation in a DCE affected decision strategies. There was only scope to infer that different decision-making strategies were being employed between the 2 risk presentation versions. Further research is needed to understand the nature of the drivers of the difference in saccade patterns by, for example, changing the attribute order and introducing nonrisk attributes.
Results from this study also indicated that pupil dilation when completing the DCE was smaller for the icon array respondents, which implies the task was potentially less cognitively burdensome and easier for respondents to complete. This finding is only indicative due to the small sample size, and a larger sample size would be required to investigate this preliminary finding further.
Results of the heteroskedastic conditional logit model suggested an insignificant effect of cost attribute on participants’ choice. As with many forms of health care in the United Kingdom, national screening programs are free at the point of use, and in other countries or other domains, this may differ.
While increasingly used in psychology, 24 there are few examples of the use of eye-tracking in economics. 60 Exceptions include an eye-tracking study eliciting preferences for food, to investigate respondents’ attendance, or lack of, to levels in a choice set. 57 Lack of attention, ANA, was measured by the number of times respondents reattended attribute levels. Another study recorded saccades to understand how individuals seek information in simple choice sets of financial lotteries. 33 In health care, the authors are aware of only 2 examples of eye-tracking used to identify ANA 61 and for modeling of choice data.62,63 There are several parallels in these choice-based eye-tracking studies, with most focusing on visual attention to attributes. None have presented data on pupil dilation or compared decision strategies or attention across different attribute frames.
Limitations
Eye-tracking involves tradeoffs between precision equipment and apparatus that participants find comfortable. Equipment used in this study required participants maintain a fixed head position. Clearly, this is an unnatural reading position and could have reminded the respondents that their eye movements were being monitored, causing them to pay more attention to the screen than they would have otherwise. However, it is unlikely that the effects of this would differ between respondents randomized to the different risk formats.
Eye-tracking data also collect visual attention at the pupil’s point of gaze. Although evidence from eye movement research suggests that little detailed information is extracted outside of the fovea and parafovea during written language comprehension,64,65 it is possible that some information about the attribute levels may have been picked up in the participant’s peripheral vision without observable attention.
The sample size of 20 women in each condition could ideally have been larger and may possibly have led to more statistical significance for some findings. However, with no priors from existing studies, power calculations could not be performed, and therefore a pragmatic approach to selecting the sample size was taken in this exploratory study. However, the results could be used to inform sample size calculations for future studies.
This study tested multiple hypotheses relating to the eye-tracking data. Although corrections for multiple hypothesis testing exist, 66 these were not applied as in tests that could have been correlated (i.e., the effect of risk communication method on mean dwell time, mean fixation time, number of fixations, mean pupil size, or change in pupil size) 67 the null hypotheses were never rejected. Applying the Bonferroni correction would therefore not have changed the results or study conclusions.
Pupil size depends on the location of the stimuli on the screen and laboratory luminosity. These 2 dependent factors influencing pupil size mean that the cognitive burden of studies cannot be compared on either an absolute or a relative scale using this metric alone. There are various causes of pupillary responses, and care must be taken in using this metric to distinguish the exact response activator. Extraneous variables, such as time of day and participants’ previous activities, were not collected or controlled for in this experiment. Studies have shown that alcohol, lack of sleep, and reading may affect participants’ eye movements. As respondents were randomized to different risk formats, we can assume these are unlikely to have affected the comparative results, but a larger sample size is ideally required to account for these potential sources of confounding in the experimental design.
Conclusion
This exploratory study found that eye-tracking is a promising method to understand more about how DCE respondents view the choice task and identify different decision-making strategies when different formats are used to present the survey. Differences were identified in how respondents searched for information dependent on risk presentation in the DCE. The study provided indicative findings that visual attention to attributes was greater, and cognitive burden lower, when risk was presented using an icon array. Eye-tracking data also suggested that using self-report to identify ANA may not be completely reliable. Using eye-tracking in the context of completing stated preference surveys, in general, and DCEs, specifically, is still in its infancy. This study is one of the first in the context of health care DCEs and has demonstrated the potential of eye-tracking to answer many further research questions by providing quantitative data on the decision-making strategies employed by survey respondents.
Supplemental Material
DS_10.1177_0272989X18782197 – Supplemental material for An Exploratory Application of Eye-Tracking Methods in a Discrete Choice Experiment
Supplemental material, DS_10.1177_0272989X18782197 for An Exploratory Application of Eye-Tracking Methods in a Discrete Choice Experiment by Caroline Vass, Dan Rigby, Kelly Tate, Andrew Stewart and Katherine Payne in Medical Decision Making
Footnotes
Acknowledgements
We are grateful for feedback received at the Society for Medical Decision Making’s 36th and 37th annual meetings, as well as the International Academy of Health Preference Researchers inaugural meeting. We are also grateful to experts Professor Gareth Evans, Professor Tony Howell, Dr. Michelle Harvie, and Ms. Paula Stavrinos of the Nightingale Centre at Wythenshawe Hospital, as well as Professor Stephen Campbell of the Centre for Primary Care at the University of Manchester for providing their thoughts and comments the study, including draft versions of the survey.
The author(s) declared no potential conflicts of interest with respect to the research, authorship, and/or publication of this article.
Caroline Vass was in receipt of a National Institute for Health Research (NIHR) School for Primary Care Research (SPCR) PhD Studentship between October 2011 and 2014. The views expressed in this article are those of the authors and not of the funding body. Preparation of this manuscript was made possible by Mind the Risk, a project funded by the Riksbankens Jubileumsfond. Financial support for this study was provided by an NIHR SPCR PhD Studentship for Caroline Vass and a grant from the Riksbankens Jubileumsfond. The funding agreement ensured the authors’ independence in designing the study, interpreting the data, writing, and publishing the report.
Supplementary Material
References
Supplementary Material
Please find the following supplemental material available below.
For Open Access articles published under a Creative Commons License, all supplemental material carries the same license as the article it is associated with.
For non-Open Access articles published, all supplemental material carries a non-exclusive license, and permission requests for re-use of supplemental material or any part of supplemental material shall be sent directly to the copyright owner as specified in the copyright notice associated with the article.