
Abstract
Health status, captured using the quality-adjusted life year (QALY) measure,1,2 and quantified using generic preference-based measures, 3 has become the commonly recommended outcome to value the consequences of healthcare programs in economic evaluations. 4 Guidance on how to perform economic evaluations to inform resource allocation within healthcare systems, such as the National Institute for Health and Care Excellence (NICE) methods guide for technology appraisal, 5 has led to a focus on using the EQ-5D5,6 as the relevant metric to quantify the health consequences of healthcare programmes.7–9
Relevant consequences broader than health status, as defined by the EQ-5D, 3 have been suggested.10–13 Moving beyond health status may be particularly relevant when valuing the consequences of complex 12 and social care interventions. 14 An alternative consequence is the notion of capability introduced as a concept by Sen.15–17 Sen suggested that the relevant objective for policy-makers should be based on a person’s ability to “do” or “be.”16–20 Lorgelly 21 and Coast et al. 22 provide an overview of measures that aim to quantify capability and their potential use in economic evaluation.
The suite of ICECAP measures are considered useful, as they have associated preference weights, making them viable measures of capability for use in economic evaluations. The ICECAP measures were the first capability-based measures designed for use in economic evaluations.23,24 The ICECAP suite includes the ICECAP-O (the full measure can be downloaded from the ICECAP [University of Birmingham] website 25 ) for use in older people 26 and ICECAP-A for adults. 27 NICE guidance currently recommends the ICECAP measures as an option in economic evaluation of social care interventions. 28 The developers suggest that the ICECAP measures capture the impact of a broader aspect of quality of life rather than only health status as captured by the EQ-5D. Differences are apparent in both the conceptualization and practical design of the ICECAP and EQ-5D measures, respectively. Conceptual differences are apparent in the question wording to bring the focus of ICECAP in line with Sen’s theoretical underpinning using the terminology of “ability” rather than the focus on “functioning” seen in EQ-5D. Two practical design differences are apparent: the severity levels used (4 levels for ICECAP v. 3 for EQ-5D-3L) and different tariff scoring scales. Both measures use the same upper bound score of 1, representing either “full capability” or “perfect health.” The measures differ in how the lower bound is anchored at zero. For ICECAP, zero represents “no capability.” For EQ-5D, zero represents a state equivalent to dead but it is also possible to have states worse than dead with negative scores. Thus, the 2 measures operate on different scales, with implications for their direct comparison. There is currently no definitive guidance on how to use ICECAP measures in economic evaluation (i.e., should they be used in a QALY-based approach or otherwise?). Even though the ICECAP measures are preference-based, this does not mean they could be used to quantify a QALY; although, at least one study has chosen this path. 29 Relatedly, it is not clear that the QALY is an appropriate end-point for evaluating capability. 30 This has led to work on an alternative capability-based method for economic evaluation. 31 Therefore, research into how capability should be operationalized as part of an economic evaluation should be considered as “ongoing.”
Sen was purposely vague in his definition of capability.17,32 Nussbaum suggested a need for more specificity in what is meant by capability.33,34 Grewal and colleagues 35 suggested that “It is not poor health in itself, which reduces quality of life, but the influence of that poor health upon each informant’s ability to, say, be independent, that is important”. In this context, health is perceived as a conversion factor for capability. Capability is viewed as the objective end-goal for patients when receiving healthcare rather than only health status. Available measures of health status (EQ-5D-3L) and capability (ICECAP-O) have been argued to be conceptually different, 21 and a previous study has suggested that the 2 measures offer complementary information (rather than the ICECAP-O acting as a substitute to the EQ-5D-3L, because it captures essentially the same information). 36 However, it seems logical, based on their conceptual underpinning, that health and capability could be linked in some quantifiable way and, therefore, a change in health captured by the EQ-5D-3L may be associated with a change in capability captured by the ICECAP-O. 37 One study has identified that capability (ICECAP-O) was strongly and positively associated with health status (EQ-5D-3L); however, that study focused on a specific population of older people receiving post-acute rehabilitation care and was a relatively small sample (n = 82). 38 The current study aimed to build on this work and quantify the link between the EQ-5D-3L and the ICECAP-O to quantify the relationship (association) between the constructs of the measures, health, and capability, respectively.
Methods
This study used regression-based statistical methods to quantify the link between the EQ-5D-3L and ICECAP-O, informed by published guidance and recommended reporting standards for mapping studies (also called “cross-walking” or “transfer to utility”).39–44 The ICECAP-O was used as the target measure (response variable) for this assessment so that the descriptive results suggest to what extent a change in health is associated with a change in capability. This approach is consistent with the conceptual idea that health is a conversion factor for capability rather than vice versa (i.e., using the EQ-5D-3L as the target measure).
Study Sample
Data were collected from 3 observational cohort studies that formed the Medical Crises in Older People (MCOP) program: Acute Medical Outcomes Study (AMOS); Better Mental Health (BMH) study; and Care Home Outcomes Study (CHOS).
AMOS45,46 included older people (70 y and over) admitted to hospital and discharged within 72 h from an Acute Medical Unit (AMU), in Nottingham or Leicester, England. Baseline data (n = 667) were collected at recruitment and follow-up data collected 90 d post-recruitment. Patients were excluded if staff advised against approaching the patient, or if neither the patient nor the carer could communicate in English sufficiently to complete baseline assessments. Patients who lacked the mental capacity to consent to study participation were recruited provided a responsible physician gave permission.
BMH47,48 included older people (70 y and over) with a co-morbid mental health problem; with an unplanned admission to an acute general hospital in Nottingham, England, lasting 2 or more days to one of 12 named wards (trauma orthopedic, acute geriatric medical, general medical); and who had been screened using brief tests of cognition, 49 depression, 50 anxiety, 51 or alcohol misuse. 52 Baseline data (n = 250) were collected at recruitment and follow-up data collected 180 d post-recruitment. Patients viewed to have sufficient mental capacity gave written informed consent. Patients viewed to lack sufficient mental capacity were recruited provided a family member or carer gave permission.
CHOS 53 included older people (65 y and over) living in either a residential or nursing care home. Eleven (6 residential and 5 nursing) care homes within the Nottinghamshire catchment area were recruited. Baseline data (n = 227) were collected at recruitment and follow-up data collected at 180 d post-recruitment. Outcomes (EQ-5D-3L; ICECAP-O) were recorded using proxy and self-reported approaches but the study did not record when either approach was used. Care home managers determined which residents had the mental capacity to consent to participate, defined against the criteria in the English Mental Capacity Act. 54 If residents lacked capacity, a consultee was identified and, if they were in favor of proceeding, the resident was enrolled.
Dataset
Data collected in all 3 studies included: age, gender, whether living in a care home (nursing or residential), EQ-5D-3L, and ICECAP-O (follow-up only). Appendix S1 details the outcome measures collected. The analysis used ICECAP-O and EQ-5D-3L data collected between April 2009 and February 2011.
The ICECAP-O comprises 5 attributes reflecting capability (attachment, security, role, enjoyment, and control), each of which has 4 levels (the full measure can be downloaded from the ICECAP [University of Birmingham] website 25 ). The ICECAP-O tariff score is anchored between 0 (no capability) and 1 (full capability). The preference-based scoring tariff for the ICECAP-O 26 was quantified using the best–worst scaling technique. 55 The measure, which was specifically designed for older people, has proven construct,37, 56–58 convergent and discriminant,59–61 and face 62 validity.
The EQ-5D-3L comprises 5 attributes reflecting health status (mobility, self-care, usual activities, pain/discomfort, anxiety/depression), each of which has 3 levels (the full measure can be downloaded from the EuroQoL website 63 ). The UK preference-based tariff score of the EQ-5D-3L ranges from −0.594 (a state worse than dead) to 1 (perfect health). The value of zero is representative of the state of dead. The UK’s preference-based scoring tariff for the EQ-5D-3L 64 was quantified using the time–trade-off technique. 65 A structured review of the generic self-assessed health instruments suggested that there is good evidence of validity (construct, convergent and discriminant) for the use of the EQ-5D-3L in older people. 66
Estimation Dataset
The estimation dataset (hereafter called “MCOP”) used data from all 3 studies combined. The appropriateness of using this combined dataset was tested using a linear regression model to assess the degree of association among the data coming from 1 of the 3 study samples and the ICECAP-O tariff score (see Appendix S2). There was concern that cognitive ability may need to be accounted for within this analysis, as it could be associated with a given response to the ICECAP-O. A linear regression model was used to test the degree of association between cognitive ability (defined by Mini Mental State Examination [MMSE] score as a continuous or discrete dummy variable67,68) and the ICECAP-O tariff score. This analysis indicated that being in a particular study sample or cognitive ability (MMSE score) did not have a statistically significant association with the ICECAP-O tariff score.
Older people are on a continuum often characterized by aspects such as co-morbidities, physical and mental health, and cognitive ability. However, the 3 study samples are artificial groupings defined by place of recruitment and eligibility criteria but, overall, probably represent the continuum of older people more than any one study sample on its own (see also Graham et al. 69 and Carlo et al., 70 which describe this continuum in the case of prevalence of cognitive ability in older people with and without dementia). Therefore, the results of the statistical analysis to inform combining these groups were not unexpected.
Data Analysis
All analyses were carried out using Stata version 11. 71 The estimation dataset (MCOP) and data from the 3 studies were analyzed using descriptive statistics and the distributions of the EQ-5D-3L and ICECAP-O data. Regression techniques were used to analyze the estimation dataset (MCOP) to quantify the strength of association between the EQ-5D-3L and ICECAP-O.
To inform the choice of regression models, the distribution of the ICECAP-O and EQ-5D-3L were assessed. Figure 1 shows the distribution of the EQ-5D-3L and ICECAP-O within the estimation dataset and illustrates that both measures had skewed and bimodal or multimodal tariff score distributions. Importantly, both measures were identified to have non-normally distributed tariff scores, and ceiling effects were apparent.
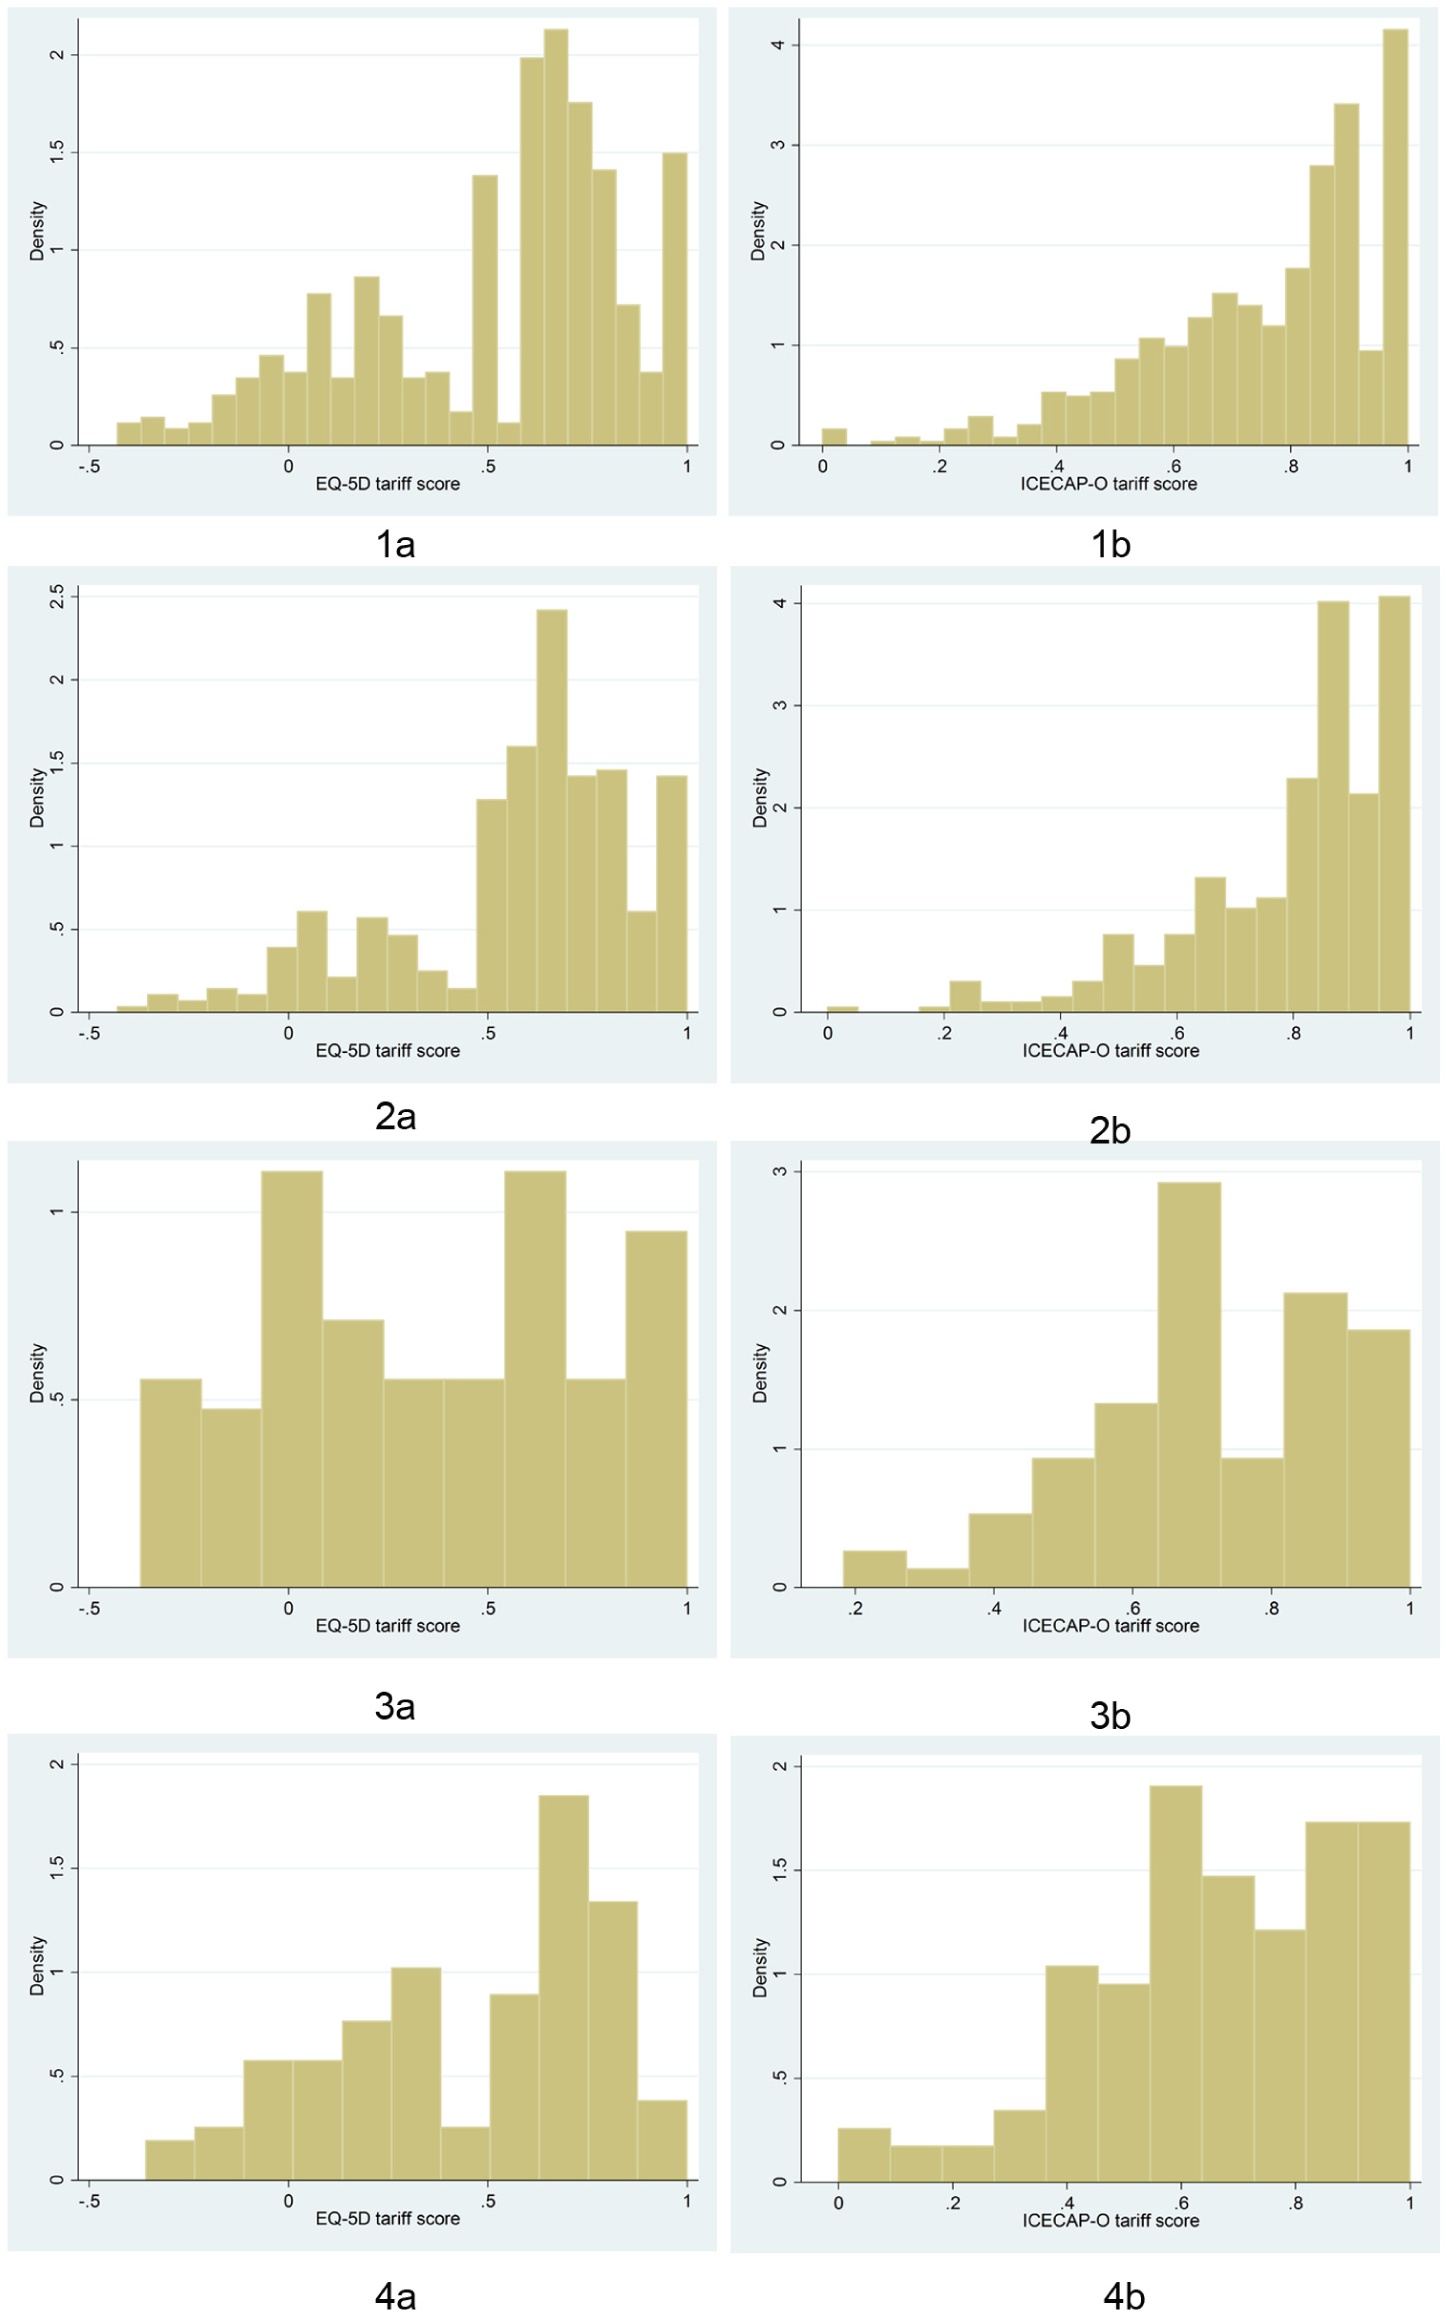
Distribution of the observed tariff scores for (a) EQ5D-3L and (b) ICECAP-O for 4 datasets: (1) MCOP, (2) AMOS, (3) BMH, and (4) CHOS.
Based on this result, 3 types of regression models were investigated to identify which was most appropriate in terms of taking into account the type and distribution of the ICECAP-O scores (tariff or domain scores, as the response variable): (1) ordinary least squares [OLS] or censored least absolute deviation [CLAD] models were used to quantify the link between overall health status (EQ-5D-3L tariff score) or domains of health (EQ-5D-3L domain scores) and overall capability (ICECAP-O tariff score as a continuous variable); (2) Multinomial Logistic [MNL] models to quantify the link between overall health status or domains of health and domains of capability (ICECAP-O domain scores as categorical variables).
ICECAP-O Tariff Score as a Continuous Variable
The OLS model is a commonly used model, particularly in the context of mapping studies.39,72 On occasion, the OLS model provides a relatively good, if not superior, model performance compared with alternative models.39,42,73 However, when data are semi-continuous, which has been shown to be a characteristic of EQ-5D-3L and ICECAP-O data, there is evidence that OLS may not be the best model.41,74,75 In such circumstances, the CLAD model may be appropriate because it is robust in the presence of heteroscedasticity and non-normality, and allows a censoring (consistent with full capability at a tariff score of 1) at the upper end of the data distribution.41,76
ICECAP-O Domain Scores as Categorical Variables
The MNL model allows prediction of the domain scores of the ICECAP-O. This additional information could be used to describe the relationship between health status and capability at the domain level for both measures.42,75,77 The MNL model assigns a probability to the likelihood of a person reporting a particular level score for each domain of the target measure, which is represented by the coefficient from the MNL model. The MNL model was estimated twice using a different number of Monte Carlo simulations (once with 1 simulation, once with 100 simulations) to assess the effect of running multiple simulations on model performance. 78 Monte Carlo simulation was preferred to other methods such as expected utility or most-likely probability methods, 79 and probabilistic mapping, 80 because it ensured that unbiased expected values were obtained. 78 This method previously performed relatively well in a mapping study with the ICECAP-O as the response variable. 42
Model Specifications
Ten model specifications were assessed (see Table 1). Four of these model specifications (see Table 1, Models 1, 3, 5 and 7) add covariates (age, gender and care home [being a resident in a care home]) in line with published recommendations, with the aim of improving the statistical robustness of the model.39,42,75,81
Selected Regression Model Specifications
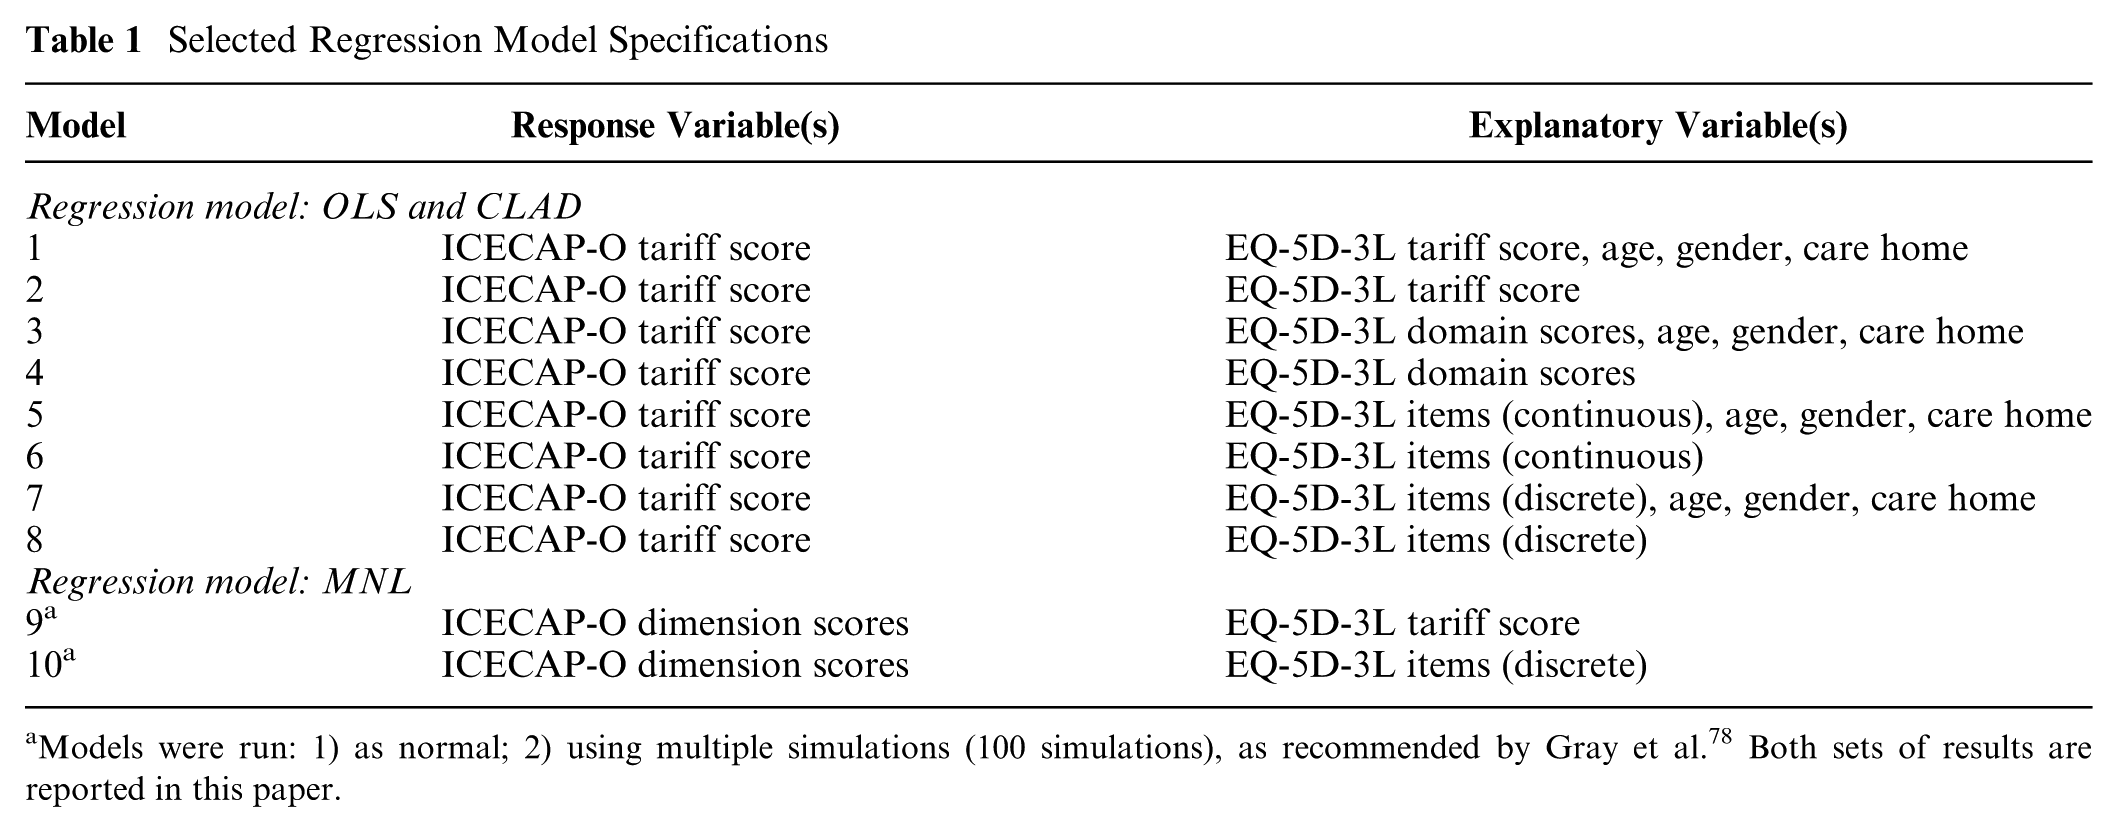
Models were run: 1) as normal; 2) using multiple simulations (100 simulations), as recommended by Gray et al. 78 Both sets of results are reported in this paper.
Internal Validity
The “best” performing model specification was identified using tests for internal validity. “Best” was defined as the lowest absolute difference (AD) between the mean observed and predicted value; lowest mean absolute error (MAE); lowest root mean squared error (RMSE); and highest R2 statistic. (Note, AD biases the results to preferring OLS over CLAD or MNL models but, given the properties and uses of the arithmetic mean, such a bias is beneficial when estimating and providing summary statistics describing the relationship between health and capability, which will include focus on the mean value.) Internal validity was also checked by comparing the results from the analysis of the estimation dataset (MCOP) with data from the 3 independent study samples (AMOS; BMH; CHOS). This analysis is classed as assessing internal, rather than external, validity because the 3 independent samples formed the MCOP sample.
Results
Table 2 shows the demographic, screening tool (MMSE) and measure (ICECAP-O and EQ-5D-3L) scores information for the estimation dataset. The mean (standard deviation; SD) ICECAP-O and EQ-5D-3L scores in the estimation dataset (MCOP) were 0.76 (0.20) and 0.53 (0.34), respectively; lower than the mean score for the UK population over 75 y for ICECAP-O of 0.82 57 and the EQ-5D-3L of 0.73. 82 The highest mean (SD) ICECAP-O score across studies was for the AMOS study, 0.80 (0.18), which also had the relatively highest EQ-5D-3L score, 0.59 (0.30). The BMH study had a relatively higher mean ICECAP-O score than CHOS (0.71 v. 0.67); although, CHOS had a relatively higher mean EQ-5D-3L score than the BMH study (0.46 v. 0.35). As observed in Figures 1 and 2, only a small proportion of people across and within study samples had low EQ-5D-3L and ICECAP-O tariff scores (e.g., 33 [5.6%] people had an ICECAP-O tariff score <0.4).
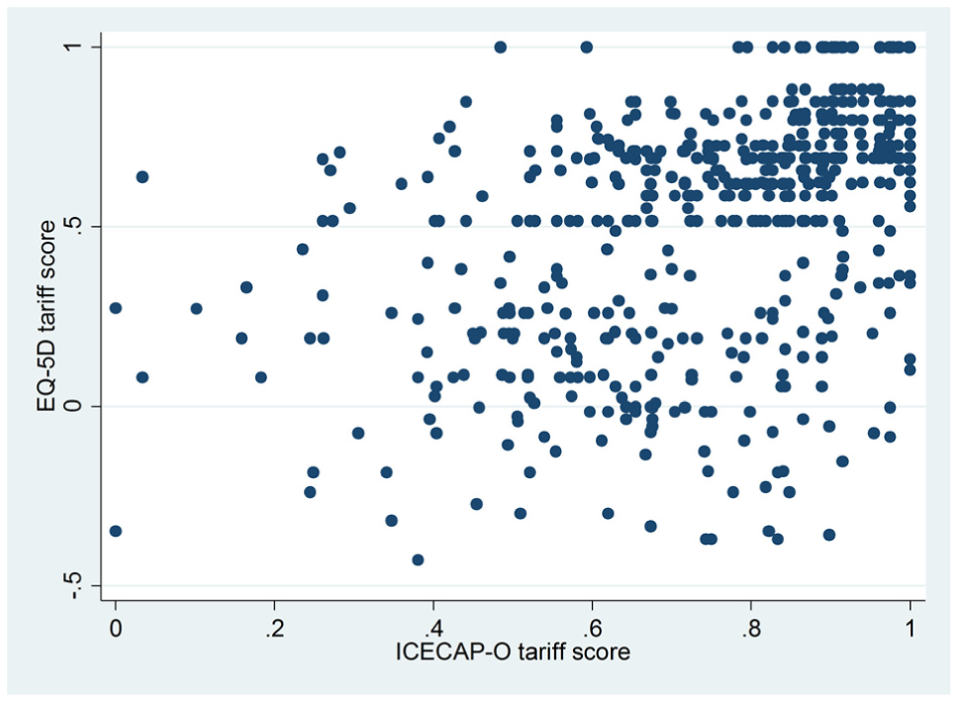
Scatter plot of the relationship between the EQ5D-3L and ICECAP-O tariff scores for the observed dataset from MCOP.
Descriptive Statistics for the Combined Sample (MCOP) and Sample from Three Studies (AMOS; BMH; CHOS)
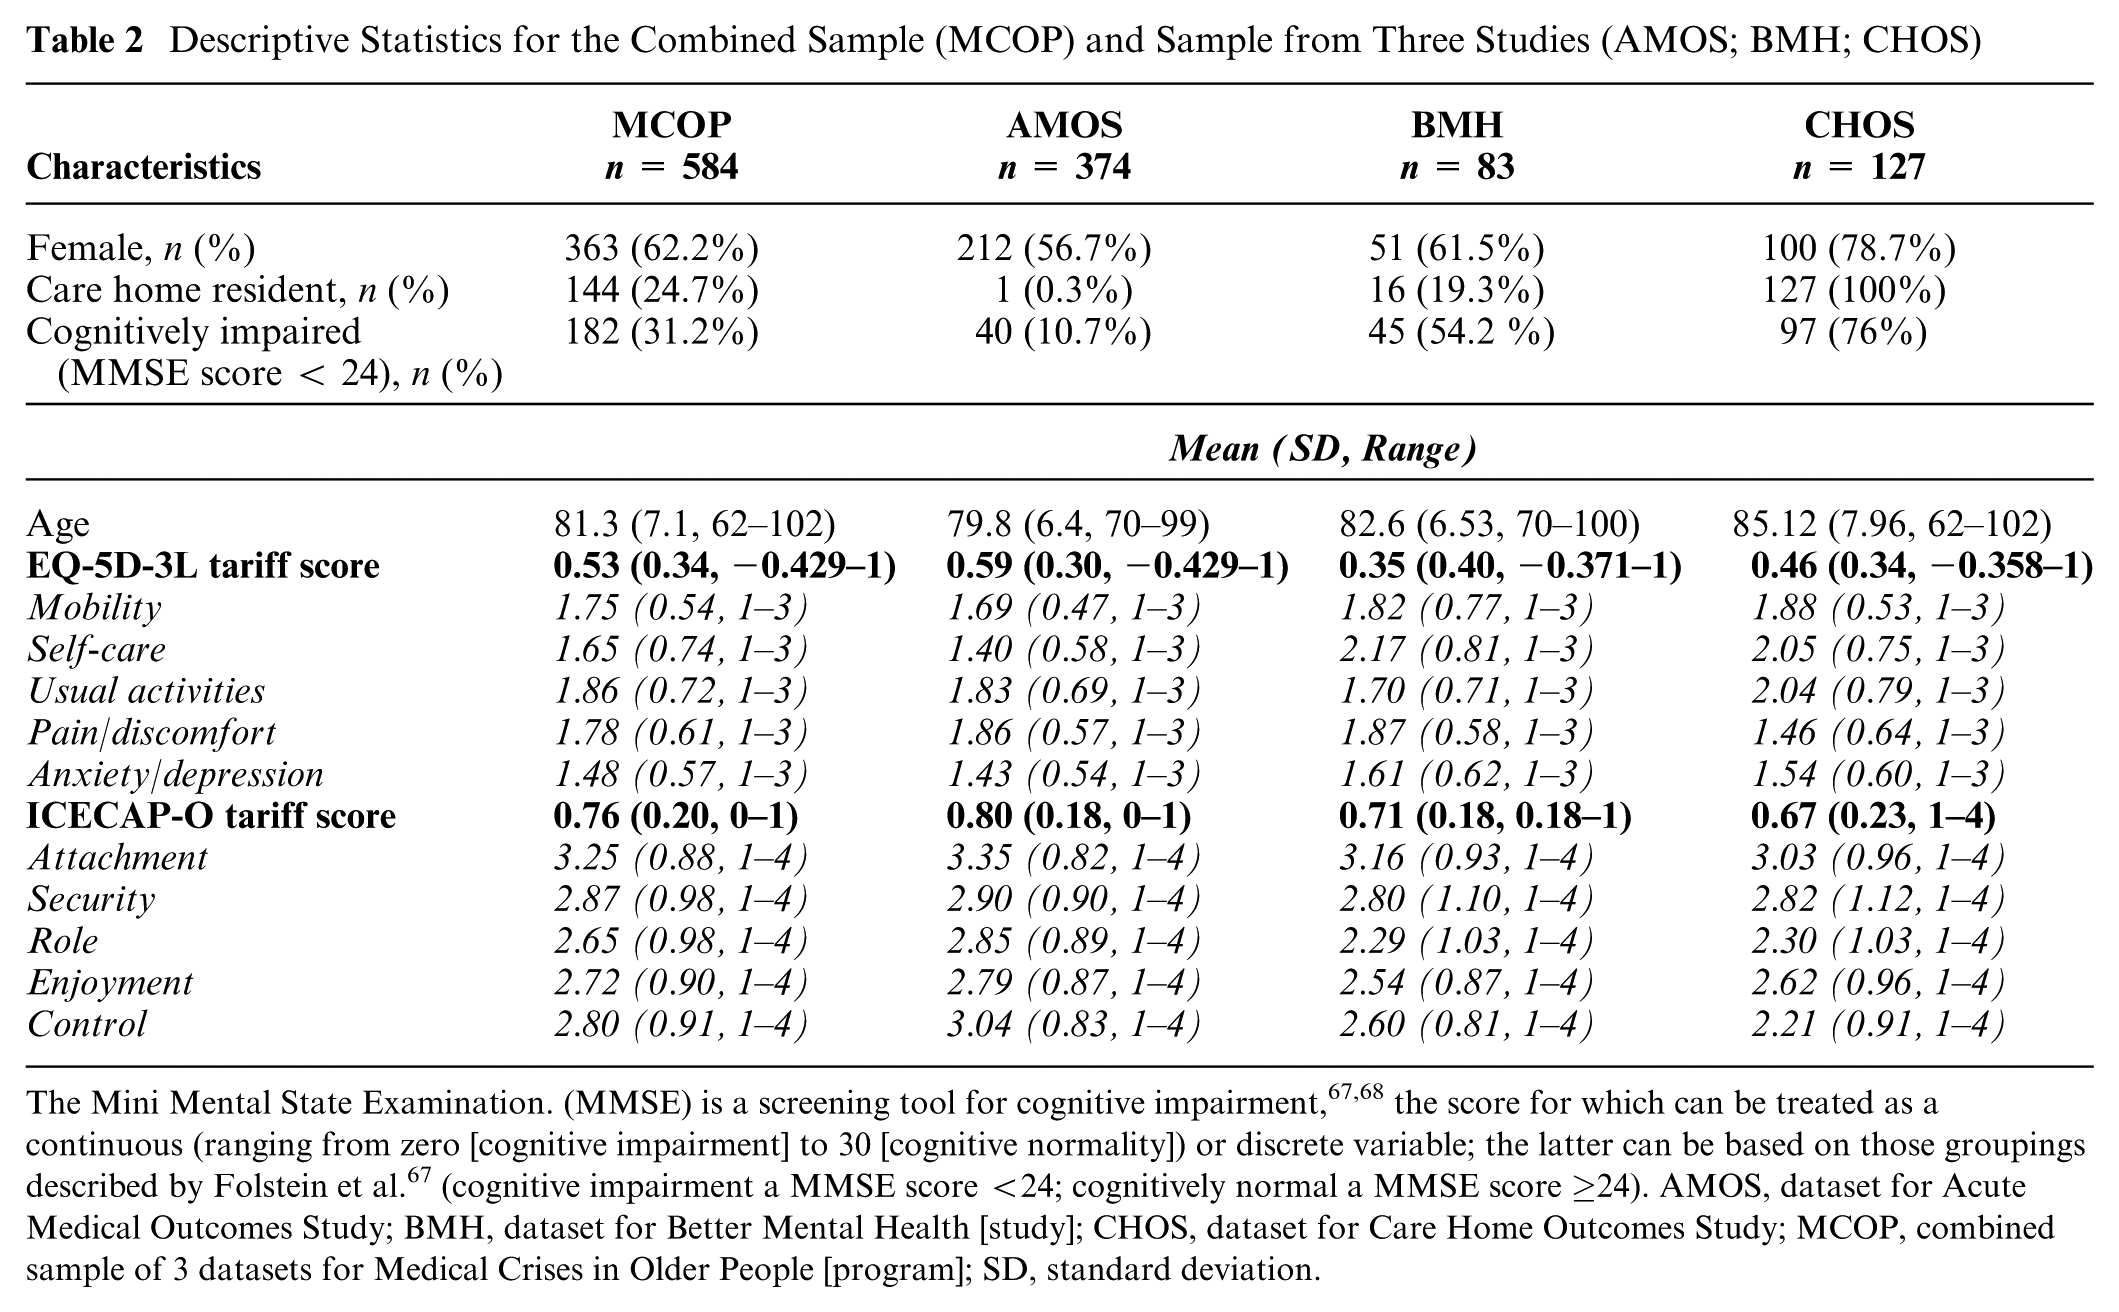
The Mini Mental State Examination. (MMSE) is a screening tool for cognitive impairment,67,68 the score for which can be treated as a continuous (ranging from zero [cognitive impairment] to 30 [cognitive normality]) or discrete variable; the latter can be based on those groupings described by Folstein et al. 67 (cognitive impairment a MMSE score <24; cognitively normal a MMSE score ≥24). AMOS, dataset for Acute Medical Outcomes Study; BMH, dataset for Better Mental Health [study]; CHOS, dataset for Care Home Outcomes Study; MCOP, combined sample of 3 datasets for Medical Crises in Older People [program]; SD, standard deviation.
Describing the Relationship between the EQ-5D-3L and ICECAP-O
Figure 2 shows the relationship between the EQ-5D-3L and ICECAP-O from the estimation dataset (MCOP). There was a positive relationship between the measures; although, this was not obvious on visual inspection of the scatter plot.
Quantifying the Relationship between EQ-5D-3L and ICECAP-O
Table 3 reports the results from the different model specifications of the estimation dataset (MCOP). Model 7 (OLS model with EQ-5D-3L items as discrete variables, including age, sex, and care home explanatory variables) produced the best model overall, with the lowest RMSE (0.1626) and highest R2 (0.3532). The lowest MAE (0.1191) was produced by model 13 (CLAD model), which was the best CLAD model overall but with a higher RMSE (0.1654) and lower R2 (0.3418) than model 7. The smallest AD was produced by each of the OLS models (models 1, 2, 3, 4, 5, and 6), which was intuitively correct, given that OLS is a linear mean model. The MNL models (models 9 and 10) performed worst overall across all statistics.
Internal Validation (MCOP)
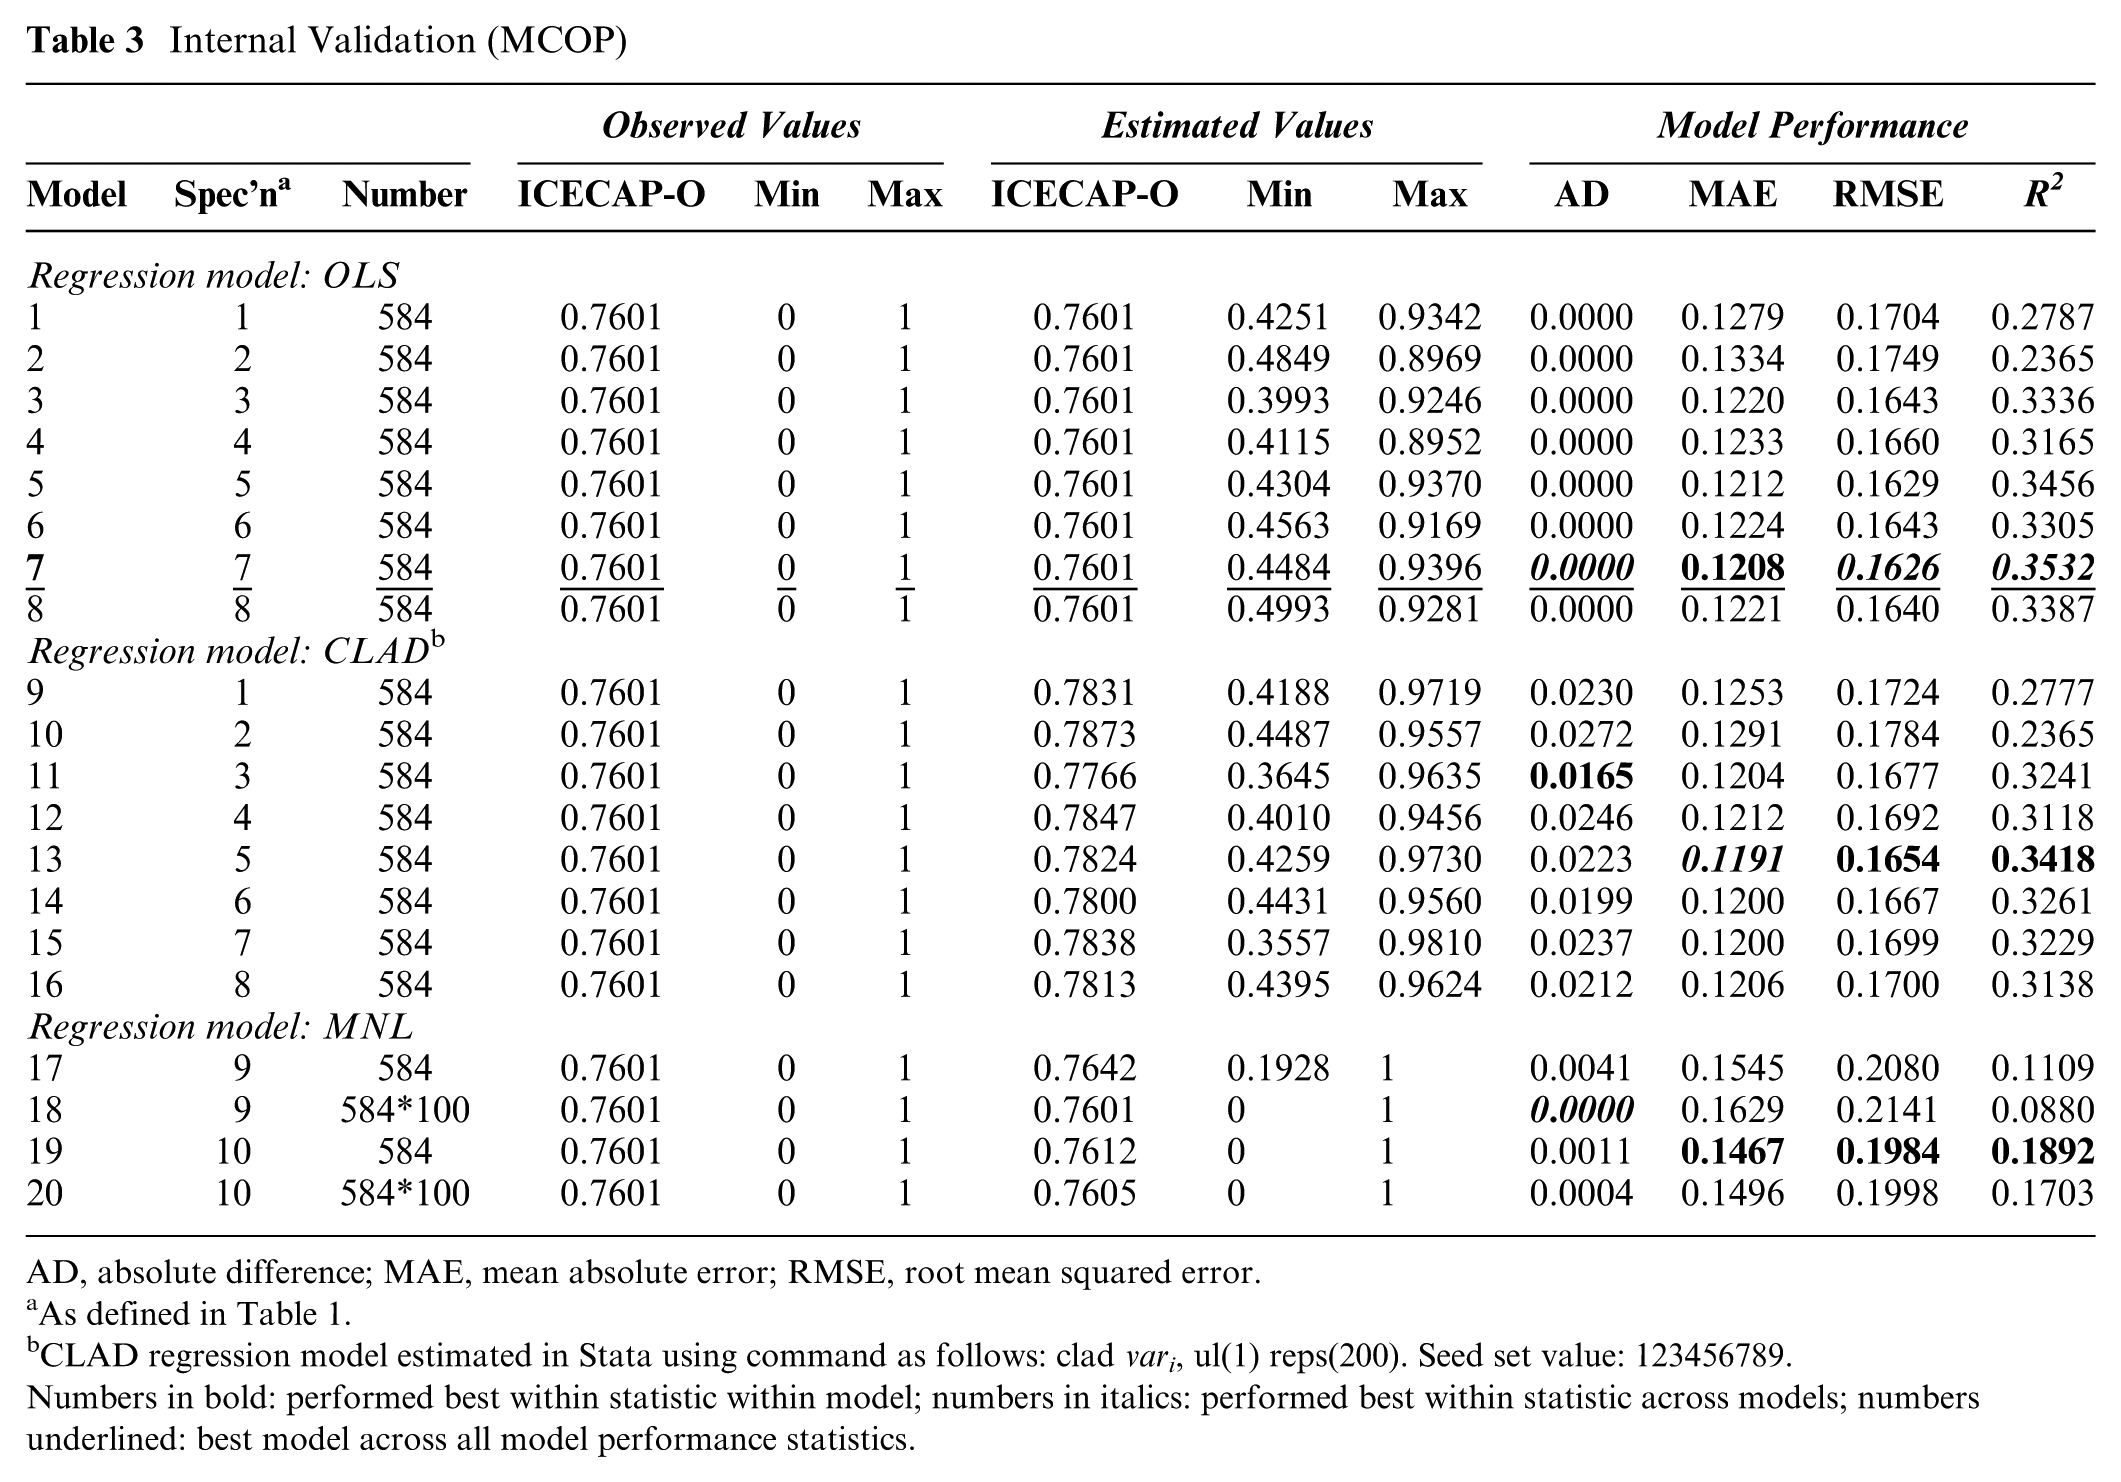
AD, absolute difference; MAE, mean absolute error; RMSE, root mean squared error.
As defined in Table 1.
CLAD regression model estimated in Stata using command as follows: clad vari, ul(1) reps(200). Seed set value: 123456789.
Numbers in bold: performed best within statistic within model; numbers in italics: performed best within statistic across models; numbers underlined: best model across all model performance statistics.
Table 4 reports the difference in results when the performance statistics from the internal validation assessment using the estimation dataset (MCOP) were compared head-to-head with the performance statistics from the same algorithms but when applied to the 3 study samples independently. The performance statistics and coefficients for the 20 regression models for the 3 independent study samples are provided in Appendix S3 and S4. This head-to-head comparison suggested that all model performance statistics improved in the AMOS sample compared with the estimation dataset (MCOP). These statistics worsened within the CHOS sample at a larger scale than any other sample (see Table 4); across all models: MAE increased within the range of 0.0530 to 0.0715; RMSE increased within the range of 0.0613 to 0.0812; the R2 statistic was lower with this difference in statistic value being in the range of 0.0771 to 0.2579 compared with the model’s performance in the MCOP sample.
Regression Model Performance for Each Dataset
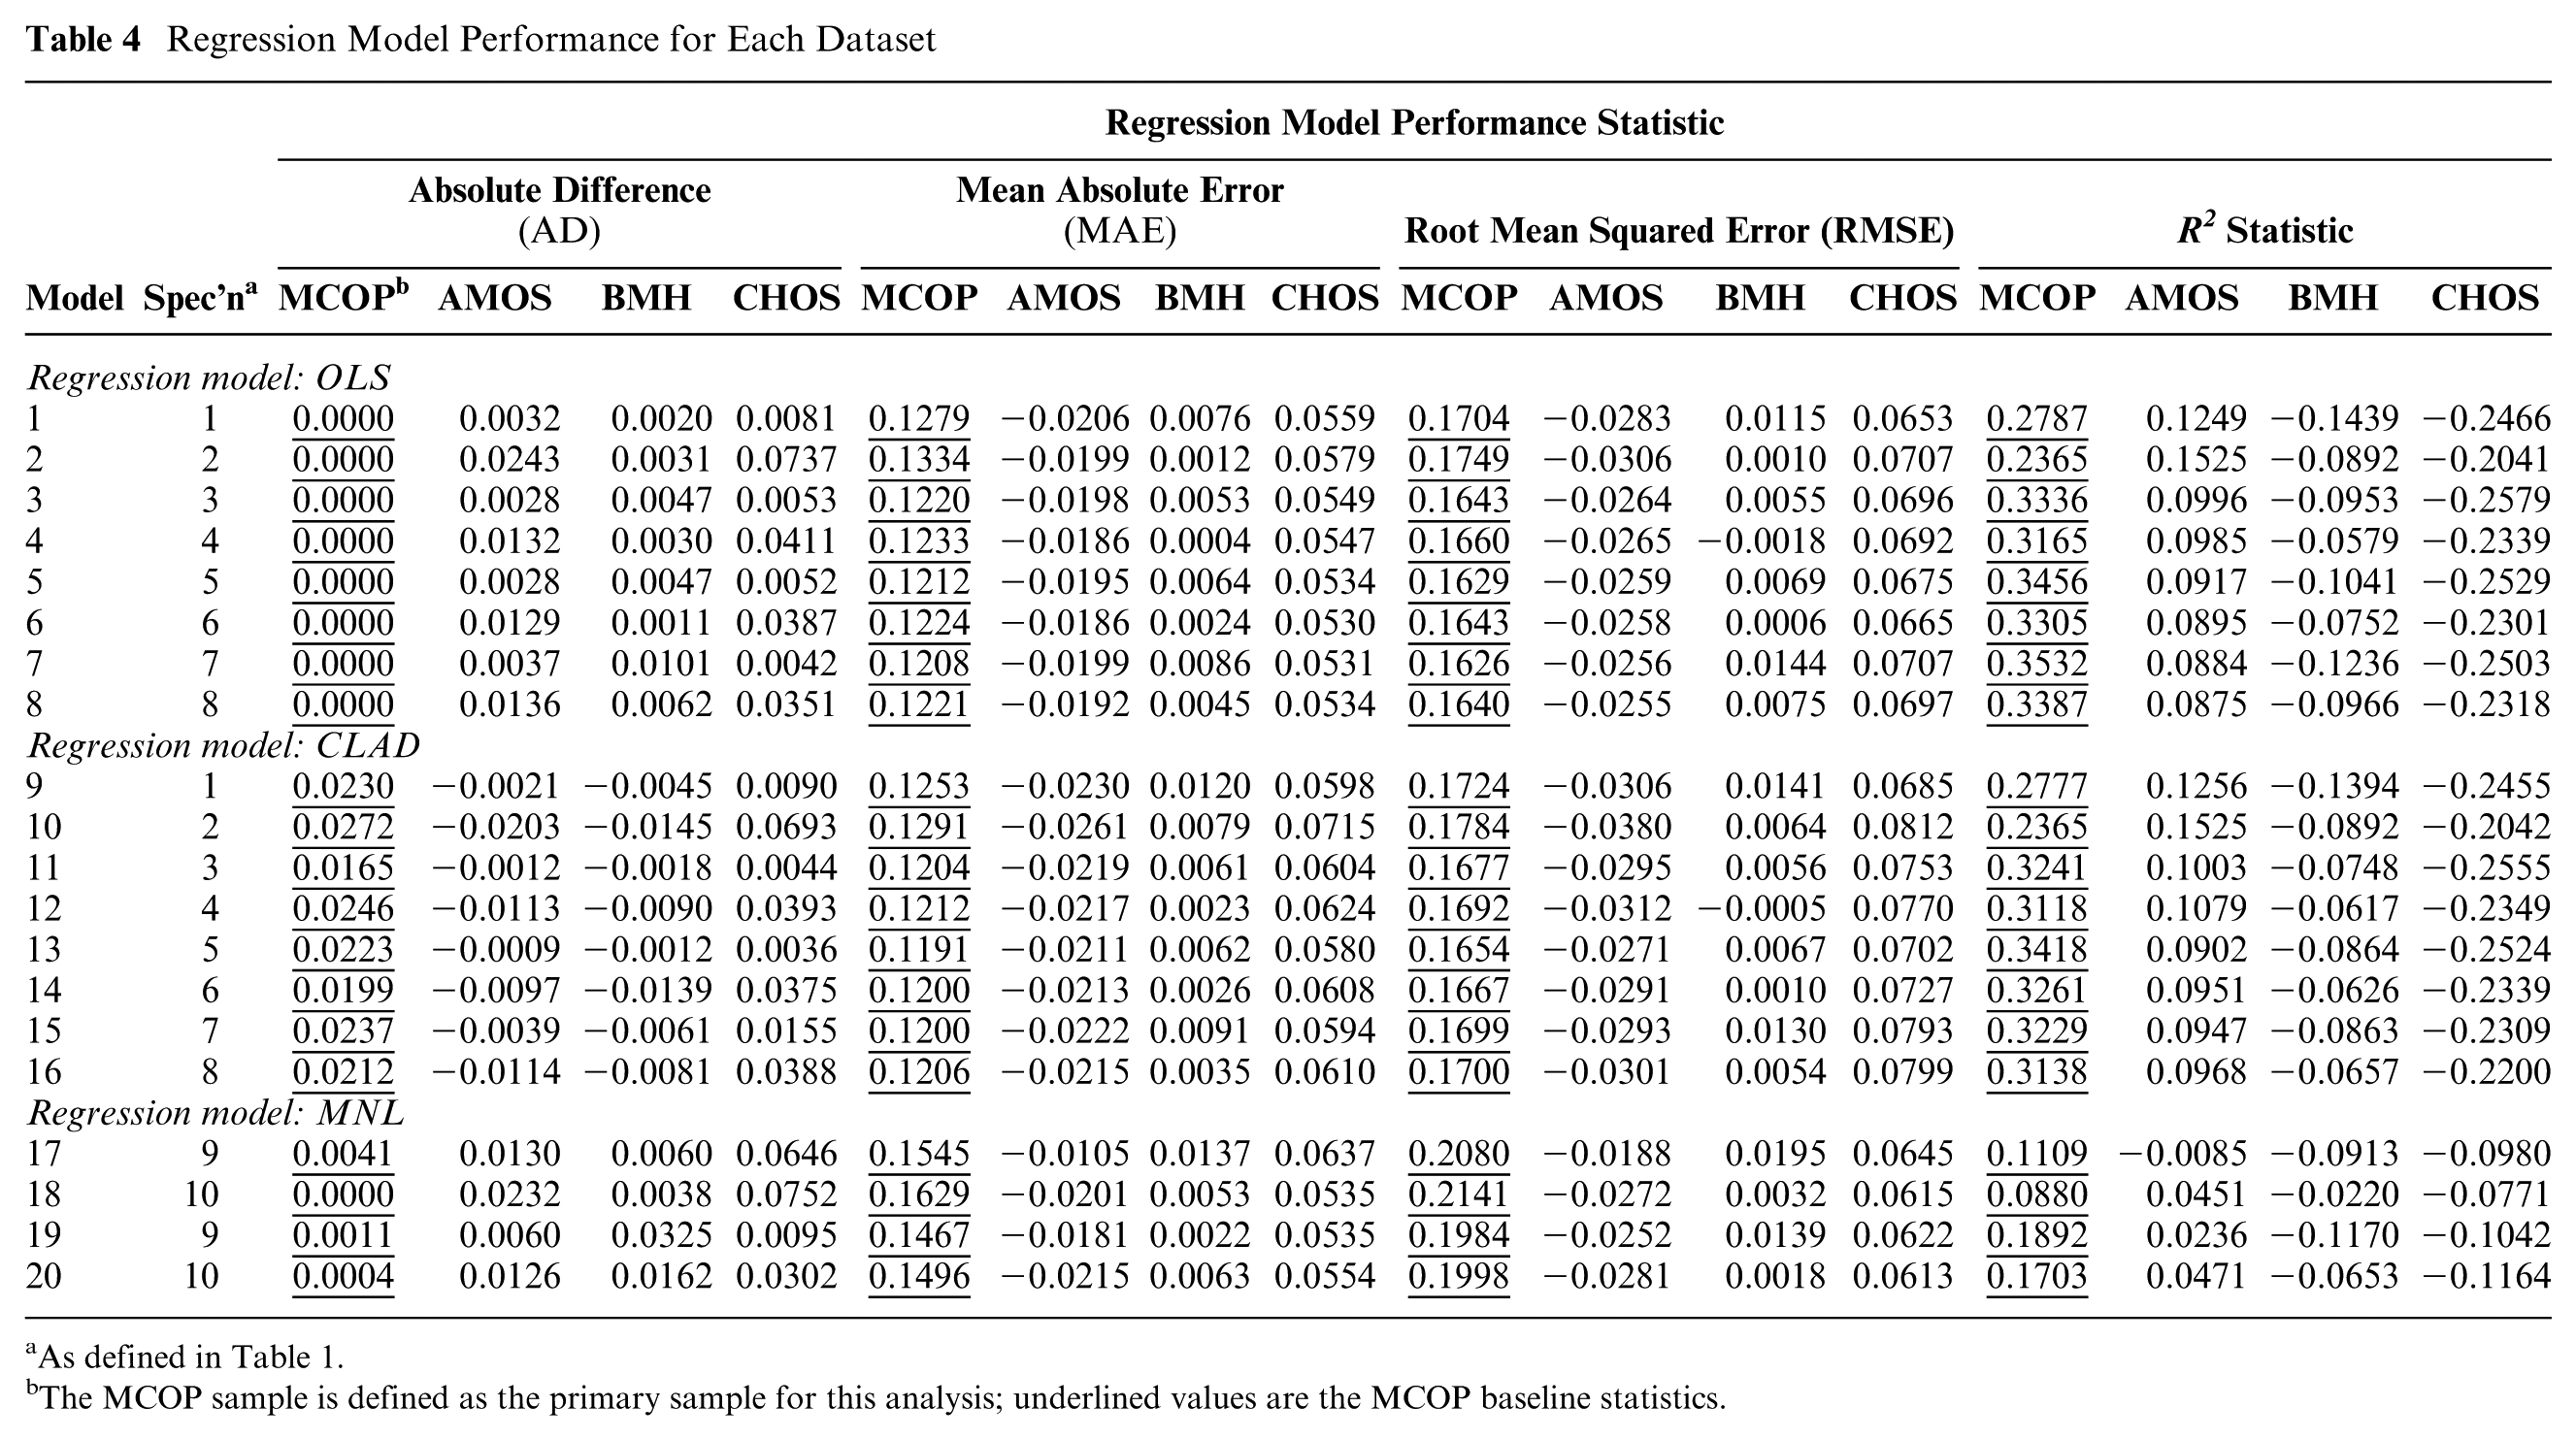
As defined in Table 1.
The MCOP sample is defined as the primary sample for this analysis; underlined values are the MCOP baseline statistics.
Quantifying the Relationship between Health and Capability
The best performing regression model was OLS model 7. Model 7 is a linear model and this may have implications when quantifying the relationship between different parts of the score distribution of the ICECAP-O. To account for this, Table 5 presents 2 performance statistics, MAE and RMSE, to show how the best performing OLS model (7) performs when quantifying the association for different parts of the ICECAP-O tariff score distribution.
MAE and RMSE of Estimated v. Observed Scores by ICECAP-O Tariff Score Groups for Best Performing Model (OLS Model 7)
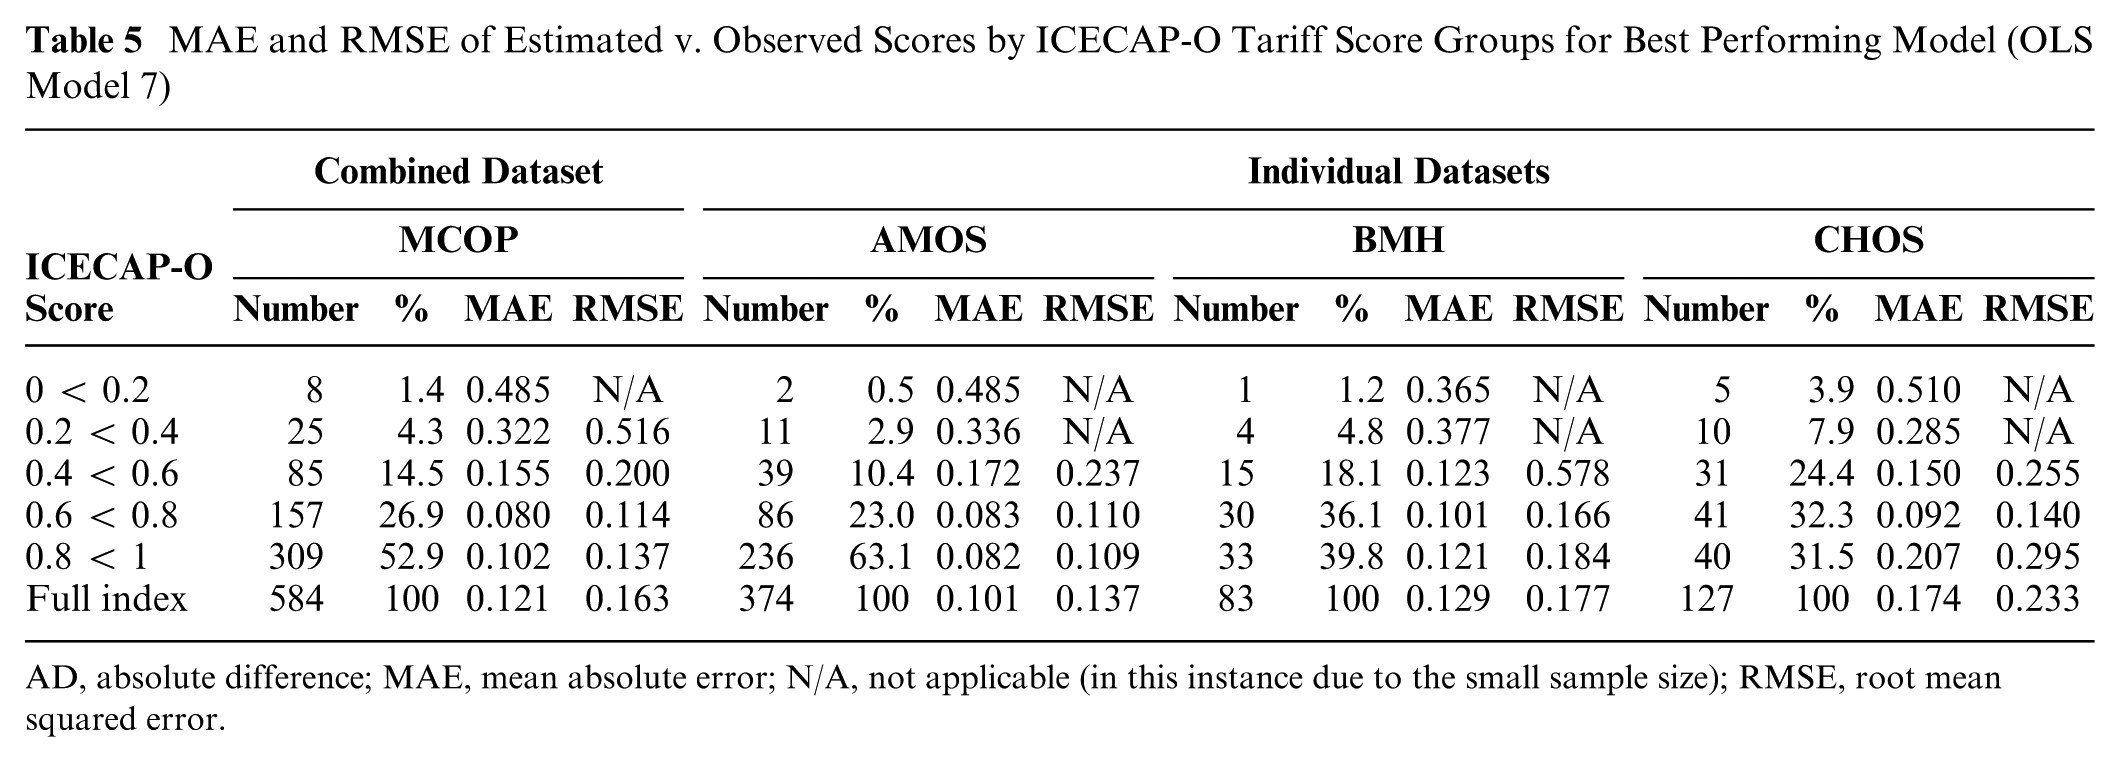
AD, absolute difference; MAE, mean absolute error; N/A, not applicable (in this instance due to the small sample size); RMSE, root mean squared error.
The overall performance of OLS model 7 resulted in an MAE of 0.1208 and an RMSE of 0.1626. The higher RMSE compared with the MAE value was indicative of higher degrees of error between the observed and estimated values. Table 5 shows that the size of the error between the observed and estimated values was larger for values at the lower end of the tariff score and smaller when the observed values were closer to the mean value. For example, in the MCOP sample, when the observed value for the ICECAP-O score was in the range of 0.2 to 0.4, the MAE and RMSE were 0.3221 and 0.5162, respectively. Nearing the peak of the distribution, when the observed ICECAP-O tariff score was in the range of 0.6 to 0.8, the MAE and RMSE values were 0.0877 and 0.1136, respectively. This result was consistent among the 3 independent samples, where lower MAE and RMSE values were observed within the peak of the score distribution rather than the left-hand tail. A quantile-quantile (Q-Q) plot to further assess the potential bias induced by the OLS model 7 (particularly at lower level ICECAP-O tariff scores) is provided in Appendix S5.
The coefficients for the explanatory variables and intercepts estimated by the best performing OLS model 7 are presented in Table 6. Using these coefficients, the following equation represents the best performing regression model and the best estimate of a quantified relationship between health and capability:
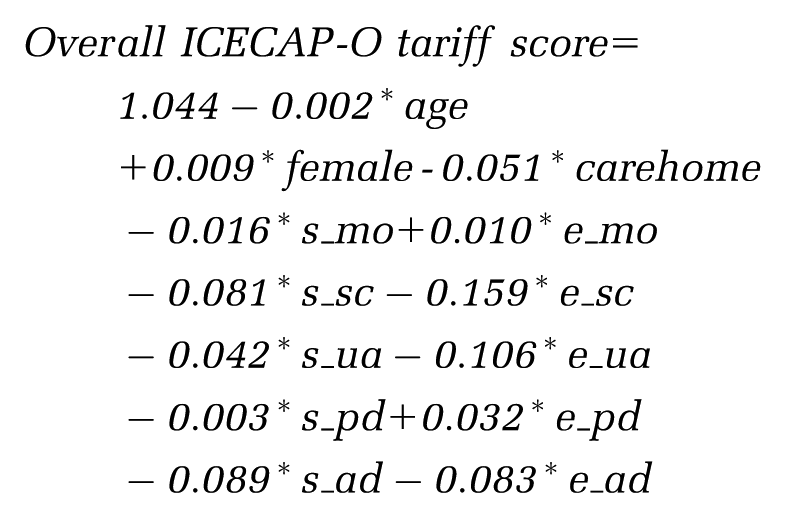
Best Performing Regression Model Quantifying the Link between ICECAP-O Capability Index and the EQ-5D-3L Item Scores and Covariates (OLS Model 7)
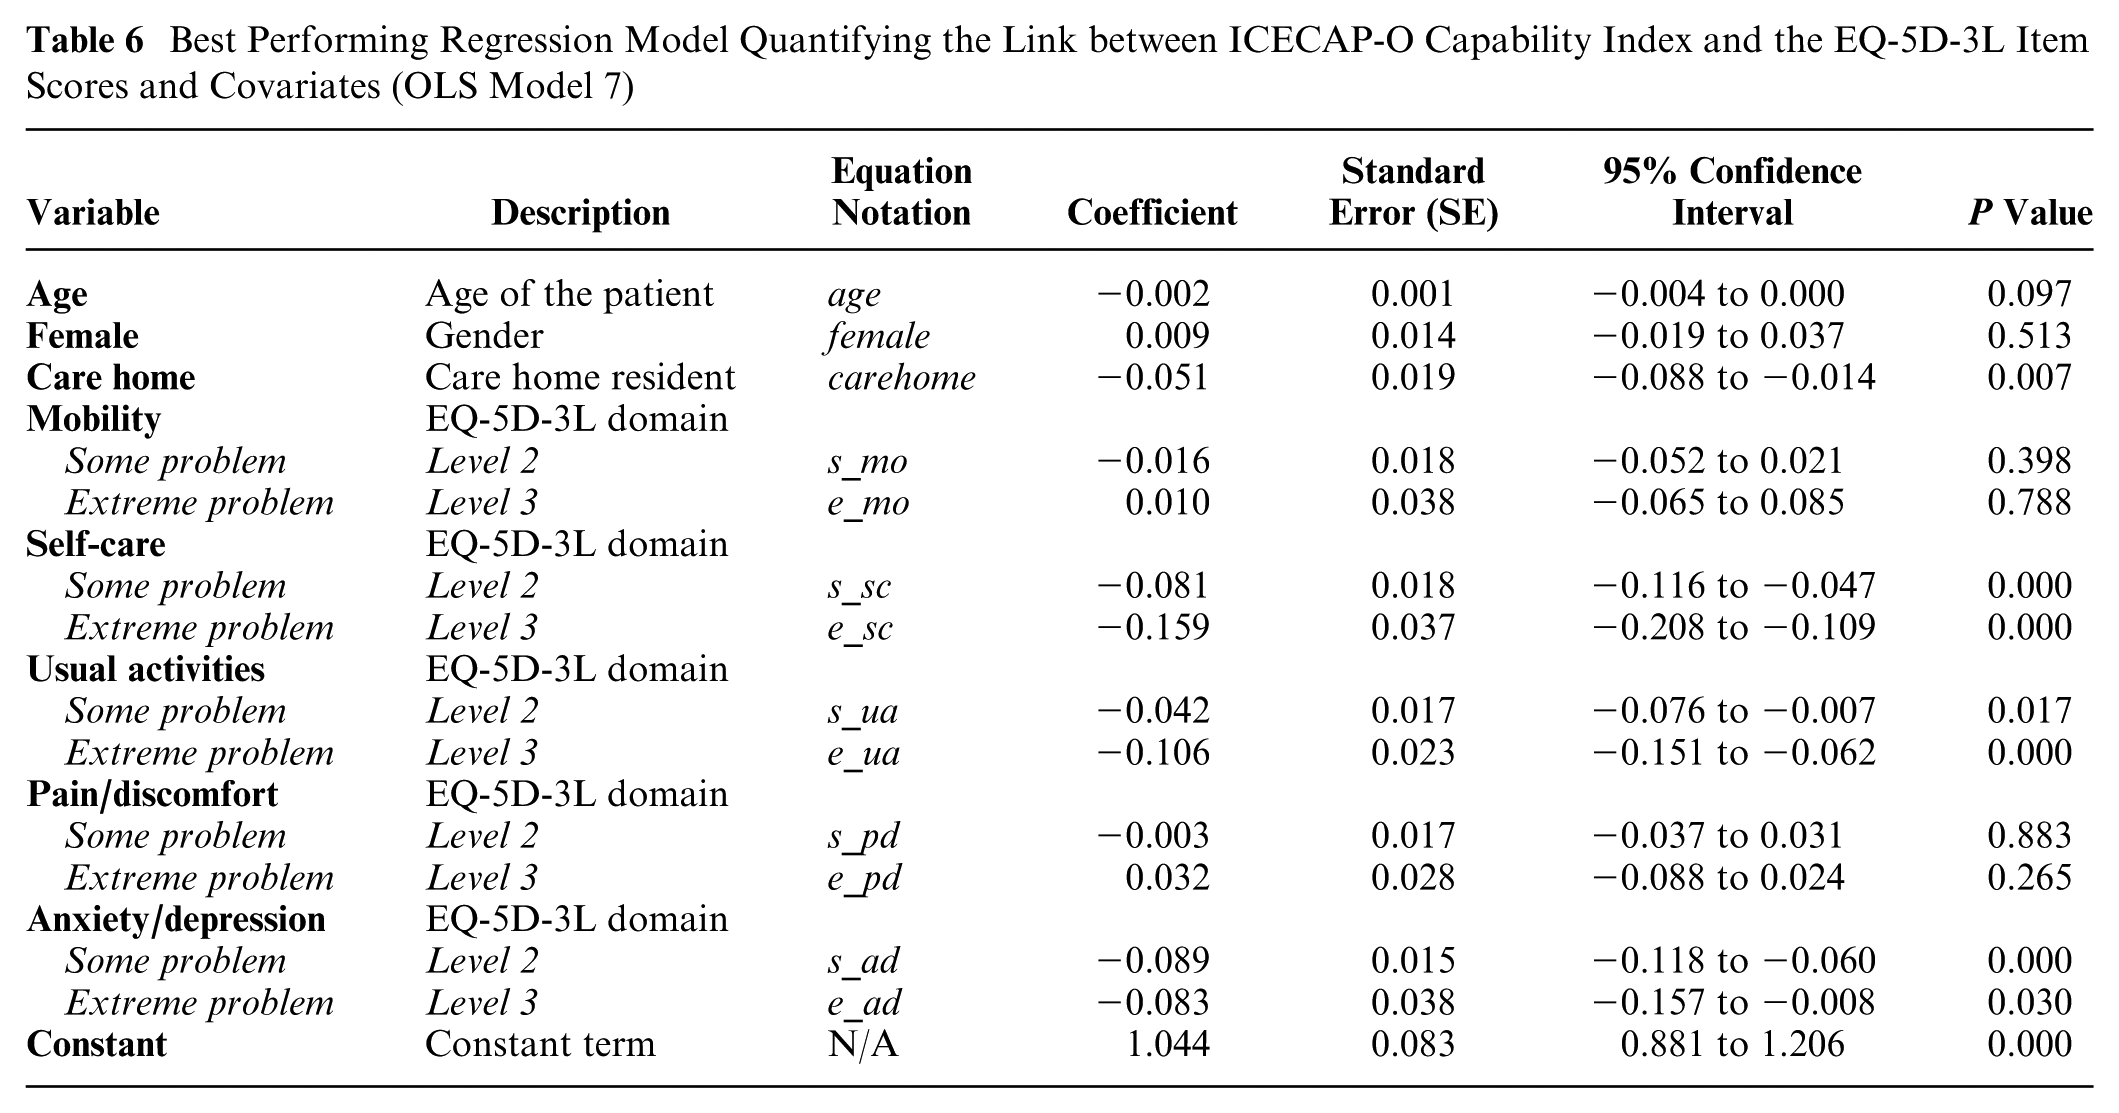
These coefficients can each be interpreted as an associative (not causal) relationship between health and capability when we have accounted for the effects of all other variables in the model. Not all the estimated associations were statistically significant (assuming statistical significance is defined at a 5% threshold level; P < 0.05); therefore, for descriptive purposes, only statistically significant relationships are now described. Moving from “no problem” with self-care to: “some problem” is associated with a decrease in capability of 0.081 (P = 0.000); and “extreme problem” is associated with a decrease in capability of 0.159 (P = 0.000). Moving from “no problem” with usual activities to “extreme problem” is associated with a decrease in capability of 0.106 (P = 0.000). Moving from “no problem” with anxiety/depression to: “some problem” is associated with a decrease in capability of 0.089 (P = 0.000); and “extreme problem” is associated with a decrease in capability of 0.083 (P = 0.030). Living in a care home was also statistically significantly associated with a decrease in capability of 0.051 relative to living in the community (P = 0.007).
Discussion
Regression methods, synonymous with those applied in mapping studies, were used in this study because they provided the relevant basis to identify the extent of the quantifiable link between 2 measures and their underlying constructs.39–44 The results of this study suggest it was possible to quantify a relationship between the EQ-5D-3L and ICECAP-O (albeit, with large errors around the point estimate coefficients). Results from the best performing regression model (OLS model 7) suggested that capability did have a statistically significant relationship with some domains of health (self-care; usual-activities; anxiety/depression), but not all domains of health (mobility; pain/discomfort) at the 5% significance level; the small number of very low score observations limits the extent to which a statistically significant result could be detected, which should be taken into account when interpreting these results. This result could suggest that ICECAP-O does not include the domains of capability with which mobility or pain/discomfort would have a relationship, and so would be an insensitive measure for assessing change in capability for interventions focused on improving these aspects of health. Alternatively, it may suggest that a change in mobility or pain/discomfort is generally not statistically significantly associated with a change in capability. This would mean that the generalized conceptual idea that health is a conversion factor for capability is not true for all domains of health.
Findings from this study add further support that the 2 constructs of health status and capability—when quantified using EQ-5D-3L and ICECAP-O, respectively—are complements rather than direct substitutes for each other. Keeley et al. 83 have also explored the link between capability and health using a different capability-based measure, suggesting ICECAP-A and EQ-5D-3L were measuring 2 different constructs, producing different but complementary information, a result which was further supported by Engel et al. 84 (comparing ICECAP-A and EQ-5D-5L) and Davis et al. 36 (comparing ICECAP-O and EQ-5D-3L). This study indicates that it is not possible to produce a robust mapping algorithm based on the conceptual and design differences of the ICECAP-O and EQ-5D-3L.
Together with previous studies,36,83,84 this study questions whether the measures conceptually overlap sufficiently in their descriptive systems to support the face validity of using a mapping algorithm. 41 The 2 measures operate on different numerical and conceptual scales. For descriptive purposes, assume that a value of zero is equivalent across both scales (i.e., a state equivalent to “dead” is the same as “no capability”; although, conceptually, “no capability” might not be the same as “dead”). It is logical to assume that, as health declines, so does capability (this hypothesis is supported by the results in this study) up to the point where a value of zero is reported across both measures (i.e., a state equivalent to dead is equal to no capability). This assumption is conceptually possible but practically could never happen, because zero is not an achievable EQ-5D-3L tariff score. However, when using the EQ-5D-3L, health can decline into negative values (or “states worse than dead”) but there are no negative values for the ICECAP-O (i.e., there are no assumed negative capability states). In this case, it is quite possible for a person to be in “a state worse than dead” (e.g., −0.2) and have a positive value of capability (e.g., 0.2), while still assuming that the values of zero across both scales are equivalent; conceptually this is illogical and adds further concern to producing and using a mapping algorithm.
The methods used to generate the available tariff scores for the 2 measures, ICECAP-O and EQ-5D-3l, best-worst scaling 55 and time–trade-off, 65 respectively, did not account for the impact of time or anchoring in an equivalent way. Brazier et al. 85 provide a useful discussion about these issues when eliciting preference-based scales, which is beyond the scope of this paper. Furthermore, the feasible range of the scores and data scaling issues for each outcome cause measurement issues when using regression analysis. Practically, it is still feasible to perform the regression analysis but the measurement issues mean that, when estimating a mapping function from a larger scale to a smaller scale (i.e., −0.594 to one [EQ-5D-3L) or zero to one [ICECAP-O]), there will be a corresponding change in the scale of the coefficients but no change in statistical significance. Therefore, in this instance the estimated coefficients may be smaller, which will have implications when quantifying and describing the relationship between health and capability. This means that mapping between measures and scales would not appropriately account for the conceptual differences in terms of what the scales and scores mean and their subsequent application in economic evaluations.
This study suggested there was a substantial difference in the mean EQ-5D-3L score but a marginal difference in the mean ICECAP-O score for the MCOP dataset when compared with the general population (0.53 v. 0.73 for EQ-5D-3L; 0.76 v. 0.82 for ICECAP-O). After simply rescaling to account for the EQ-5D-3L tariff score scale (1/1.594 = 0.627), the absolute difference in ICECAP-O and EQ-5D-3L scores could be described as a factor of 2 (0.06 v. 0.13). This observed difference in scores relative to the general population is logical and feasible. The empirical literature supports that people tend to adapt to their state of being (such as health),16,86,87 which indicates that although in a lower health state, a person’s capability may start to move back towards “normal” as they adapt to the health state (where “normal” could be defined as the general population scores in this instance), when compared with the general population. For example, someone in a wheelchair might have the “ability to achieve independence” (an ICECAP-O domain), even though their mobility is severely impaired (an EQ-5D-3L domain). The impact of if, and how, people adapt is an external factor that cannot easily be understood or accounted for when using mapping methods; this is likely to restrict the generalizability of any estimated algorithm measuring the relationship between health and capability-based measures.
The relatively low levels of health status and capability in the MCOP dataset and the assumptions of the regression models used (e.g., OLS) will also influence the robustness of the observed quantified relationship between health and capability. When assessing the validity of the quantified relationship using the 3 study samples independently, performance of the models improved when using the AMOS dataset (patients with relatively better quality of life than the overall MCOP sample) compared with the MCOP dataset. Model performance was generally not as good in the BMH and CHOS datasets (patients with poorer quality of life than the overall MCOP sample). This result is echoed in the results assessing the performance of the best performing model for estimating different parts of the ICECAP-O tariff score distribution, whereby performance worsened at the lower end of the tariff score distribution; this suggests that the quantified relationship may not well explain the relationship between poorer health and lower levels of capability.
Limitations and Recommendations for Future Work
The estimation dataset used in this study was relatively small compared with some previous mapping studies.80,81 However, “successful mapping” (in terms of better performance statistics) has been conducted on smaller sample sizes.39,42,75 Furthermore, there were no baseline ICECAP-O data in the available dataset, so it was not possible to assess the potential sensitivity of the ICECAP-O to change over time.
In terms of validation, the preferred method is to use an external validation sample but this was not feasible in this study. 41 Validation of the regression specification selected in this study was limited to internal validation using 3 sub-groups defined a priori. Other approaches to internal validation, such as K-fold,88–91 could have been explored but the impact of using this approach is a topic for future research. During internal validation, the poorest performance statistics were observed for the CHOS sample. This could be attributed to: (i) the use of proxy and self-responses within this study, when previous studies have shown a discrepancy between proxy and self-response;92,93 (ii) the nature of care homes and their residents (for example, poor health and no other option [in relation to informal or formal carers enabling community living], forcing a need to live in a care home) may change the relationship between health and capability compared with their community-dwelling counterparts for which the selected model specification may be better suited.
The EQ-5D-3L is a relatively specific measure of generic health status. There are more comprehensive (e.g., SF-36 94 ) and condition-specific health status (e.g., QLQ-C30 for cancer 95 ) measures that could have been compared with capability. A newer alternative to the EQ-5D-3L, the EQ-5D-5L,96,97 which has 5 rather than 3 levels, is also recommended by NICE. 5 It was not possible to use EQ-5D-5L in this study, as it was not ready for use during the time period of the MCOP program’s studies. People may respond differently to the EQ-5D-5L, 98 leading to a redistribution of responses and therefore a change in how health is quantified and described. Using the EQ-5D-5L could affect the quantified relationship between capability and health status. It is difficult to hypothesize the effect this redistribution might have on the estimated relationship and this should be a focus for future research. Other capability-based measures could also be considered to further explore the relationship between health status and capability, such as ASCOT, 99 OCAP-18, 100 or OxCAP-MH 101 measures. Consistent with Makai et al. 102 , future studies should assess the relationship between other aspects of health and capability, particularly if these constructs are to be used as objective endpoints by which the effectiveness of interventions will be judged within an economic evaluation.
A general limitation of the approach used in this study was using OLS and CLAD models for complex score distributions (for example, non-normally distributed data with multiple peaks). The linear aspect of these models potentially limited the extent to which the estimated relationship captured the impact over different points of the distribution of the scores for the target measure within a defined patient group. Additional model specifications, such as mixture models to assess different aspects of the distribution,75,77 could have been explored but these models would still not compensate for the inherent limitations in the available dataset. The small number of patients with very low ICECAP-O scores (<0.4; n = 33) in the MCOP dataset meant that there may be too few observations to detect a statistically significant association between lower levels of health and capability. The small number of low-score observations limits the production of a robust algorithm at the lower levels of health and capability using regression analysis, which is a limitation for this study and other studies where it is difficult to recruit patients with these low scores (e.g., a low score is associated with poor health, and poor health restricts a person’s ability to take part in research). This limits the generalizability of the quantified relationship to “all” older people (e.g., different co-morbidities and care consumption, including medications) and other countries (e.g., those with different health and social care systems, which may affect health and capability).
It was not possible to make causal inferences about the relationship between the 2 constructs. Establishing causal inferences would require fitting regression models that contain different combinations of 1 to 4 domains and interactions between covariates (such as being in a care home and type of care home) in a larger sample size with a wider distribution of outcome measure scores (i.e., more lower level scores for both measures) than that available in this study. Therefore, exploring causal inferences could be the focus of future research but would require a more suitable dataset.
Conclusion
A statistically significant association with capability (measured using ICECAP-O) was identified for 3 (self-care, usual-activities, and anxiety/depression) of the 5 EQ-5D-3L domains. Although health status was found to be positively and directly associated with capability, the strength of the association suggested that it is not appropriate to use a mapping algorithm to provide a link between the EQ-5D-3L and ICECAP-O. This study demonstrated how the relationship between health and capability can be assessed using regression-based methods and adds further support to previously published studies that a measure of capability, in this case, the ICECAP-O, is providing complementary information rather than acting as a direct substitute to a measure of health status.
Footnotes
Acknowledgements
The authors would like to thank the patients who were involved in the entire MCOP programme of studies. The authors would also like to acknowledge the wider MCOP study group which included John Gladman, Simon Conroy, Rowan Harwood, Anthony Avery, Sarah Lewis, Davina Porock, Rob Jones, Pip Logan, Justine Schneider, Jane Dyas, Judi Edmans, Adam Gordon, Sarah Goldberg, Vladislav Berdunov, Lukasz Tanajewski, Georgios Gkountouras, Lucy Bradshaw and Bella Robbins.
Financial support for this study was provided entirely by a grant from National Institute for Health Research (NIHR) under its funding stream of programme grants for Applied Research (grant number RP-PG-0407-10147). The writing of the manuscript was part-funded by the National Institute for Health Research Collaboration for Leadership in Applied Health Research and Care Yorkshire and Humber (NIHR CLAHRC YH). ![]() .The funding agreement ensured the authors’ independence in designing the study, interpreting the data, writing, and publishing the report.
.The funding agreement ensured the authors’ independence in designing the study, interpreting the data, writing, and publishing the report.
This study used data provided by the Medical Crises in Older People (MCOP) programme. MCOP was a 5-year program of work funded by the National Institute for Health Research (NIHR) under its funding stream of program grants for Applied Research (grant number RP-PG-0407-10147; see also: http://nottingham.ac.uk/mcop/index.aspx). The writing of the manuscript was part-funded by the National Institute for Health Research Collaboration for Leadership in Applied Health Research and Care Yorkshire and Humber (NIHR CLAHRC YH). ![]() . The views expressed in this publication are those of the author(s) and not necessarily those of the NHS, the NIHR or the Department of Health.
. The views expressed in this publication are those of the author(s) and not necessarily those of the NHS, the NIHR or the Department of Health.
References
Supplementary Material
Please find the following supplemental material available below.
For Open Access articles published under a Creative Commons License, all supplemental material carries the same license as the article it is associated with.
For non-Open Access articles published, all supplemental material carries a non-exclusive license, and permission requests for re-use of supplemental material or any part of supplemental material shall be sent directly to the copyright owner as specified in the copyright notice associated with the article.