
Abstract
Keywords
Clinicians are increasingly encouraged to consider the evidence on benefits and harms alongside a temporal dimension when making treatment decisions for older people and/or those with multimorbidities whose life expectancy may be limited.1–3 The rationale underpinning this suggestion is clear. People with limited life expectancy may never accrue the benefits from interventions with deferred effects, making the use of such interventions pointless in some groups of patients. Where there are upfront harms associated with an intervention, there is also the potential for net harm if individuals do not live long enough to accrue sufficient benefit.
The “payoff time” is a potentially useful concept to consider the temporal dimension in benefit-harm decision making. It is defined as the “minimum time until the cumulative incremental benefits that are attributable to a guideline exceed its cumulative incremental harms.”5(p2) Where the life expectancy of an individual is less than an intervention’s expected payoff time, then the rational decision would be not to implement the intervention. Decision making using the payoff time approach therefore requires the calculation of a number of inputs: the expected benefits and harms over time; the point in time where the benefits exceed the harms; and the life expectancy of the patient. Heuristics for calculating these inputs have been proposed to make the payoff time approach a practical way to improve shared decision making.5–7
There is also potential to integrate the payoff time within cost-effectiveness analysis,8,9 as McCabe and others 10 have demonstrated providing information to reimbursement agencies on how long it takes for benefits to outweigh the financial costs of implementing healthcare programs in a given patient population.10,11 This paper focuses on developing the payoff time concept within a shared decision-making framework, although its secondary analysis also takes a more traditional health economic perspective by including costs into the analysis.
Current examples in the literature of the payoff time concept have included the examination of interventions with up-front risk of harm and deferred benefits such as in vascular procedures (e.g., carotid endarterectomy for risk reduction), 7 the use of intensive glucose control in type 2 diabetes, and screening for colon cancer. 6 These published applications of the payoff time concept were all estimated using relatively simple mathematical calculations based on probabilities and expected outcomes. None of the examples included the costs of treatment as a decision input.4–7 However, the concept has clear potential to be applied in the kind of decision-analytic framework used to assimilate evidence on the outcomes and costs of alternative healthcare interventions in health technology assessment. 12
The aim of this paper is to provide an example of how the payoff time can be (1) integrated within a decision-analytic model-based economic evaluation; (2) useful for decision making for benefit-risk judgements in a shared decision-making framework where patients are undergoing a long-term preventive intervention associated with some small treatment disutility that may vary from person to person.
Theory of the Payoff Time
The Conceptual Framework
Figure 1a illustrates the QALY (quality-adjusted life-year) concept. The QALY combines length of life and health status or health-related quality of life (HRQoL) into a single metric and allows for both health gains and harms to be measured on the same scale. For a given health state
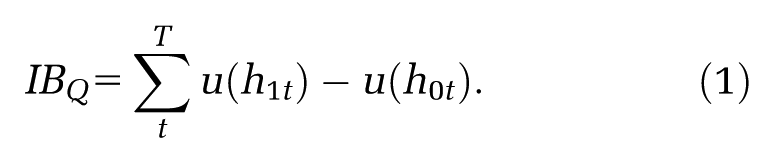
Figure 1b shows how the QALY underpins the simplest calculation of the payoff time for an individual. The concept of IB can also be used to generate a profile of cumulative QALYs over the full time horizon. The example in Figure 1b shows how the intervention produces an initial harm (or requires an initial investment) but leads to an overall QALY gain
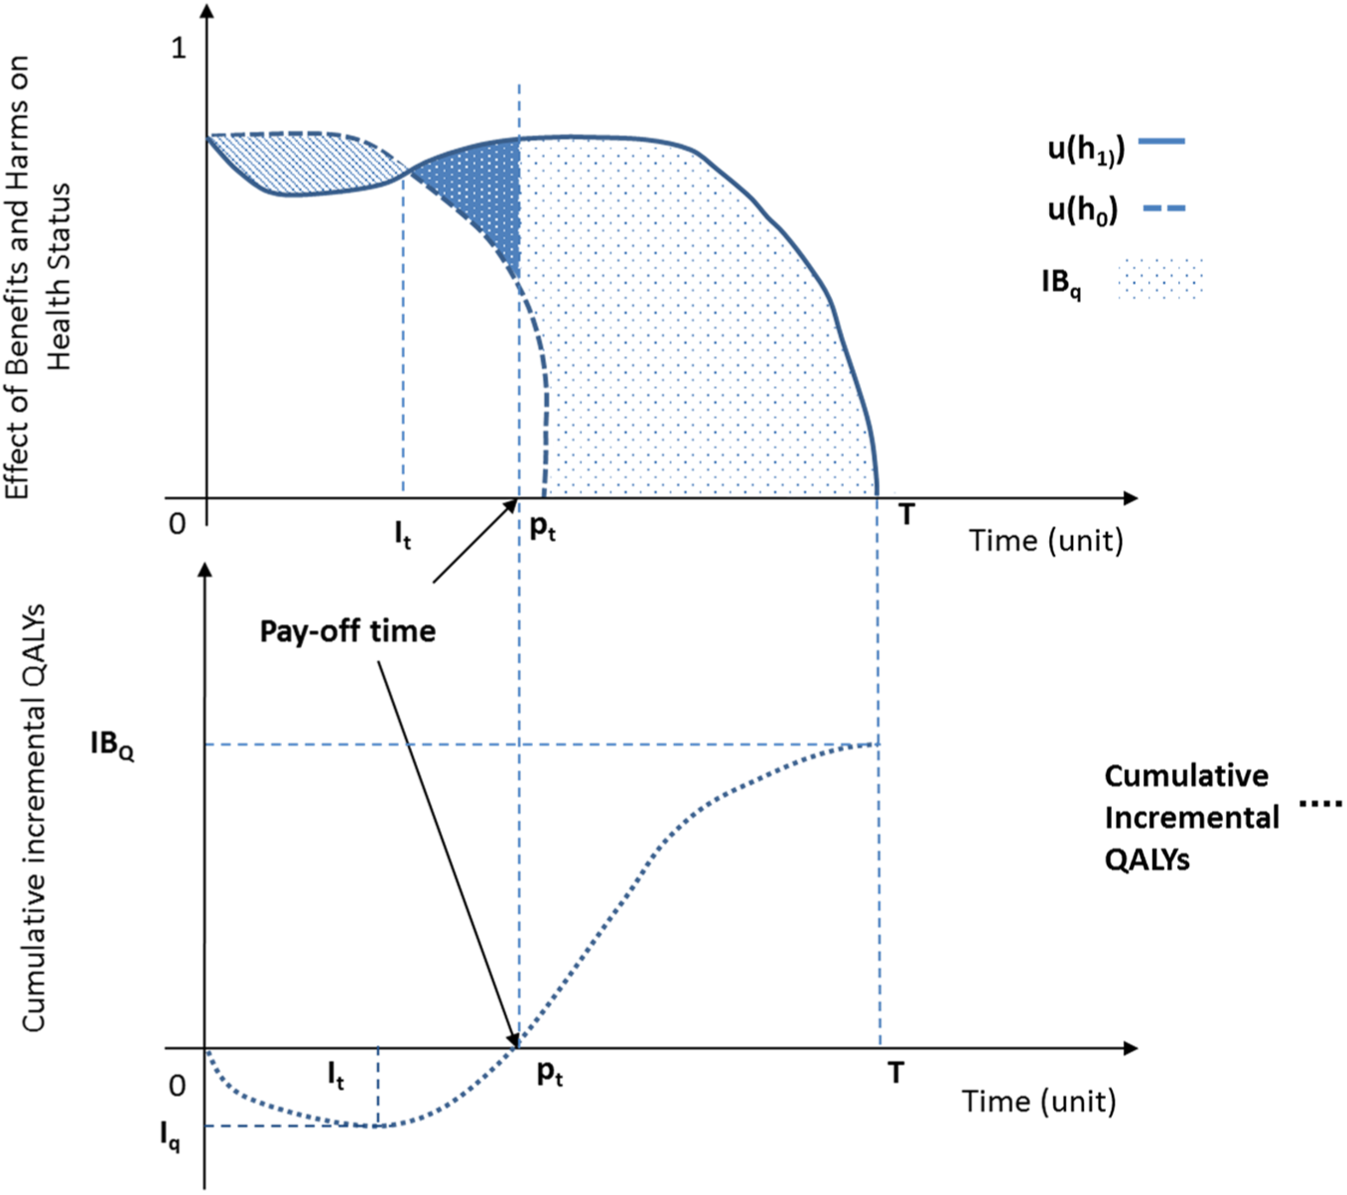
(a) The QALY concept (top). (b) Cumulative incremental QALYs over time (bottom). pt represents the payoff time when costs are not included; QALYs are quality-adjusted life-years; T represents the full time horizon; IBQ represents the maximum incremental net benefit at time T measured in QALYs; Iq represents the maximum investment size measured in QALYs; It represents the time the maximum investment size occurs.
In practice, the plot of health status and life expectancy over time for an individual receiving the intervention can never be observed simultaneously with the counterfactual of “no-intervention.” Randomized controlled trials are the gold standard method to provide a causal estimate of the outcomes that are generated by the 2 scenarios (intervention and no-intervention) by averaging the effects for each patient sample randomly allocated to each group. Consequently, it is only feasible to estimate expected (population-level), and not individual, values of IB and payoff time. For simplicity, this assumption is made throughout this paper.
The Inclusion of Costs
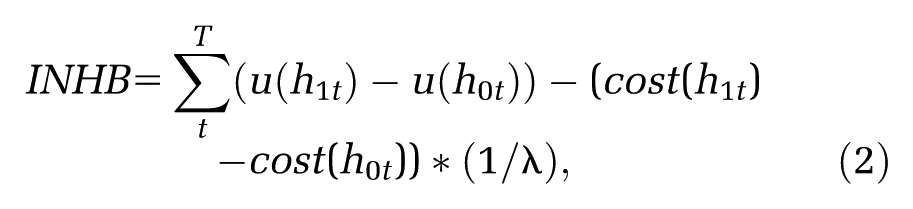
An extension to calculating a QALY-based benefit-risk payoff time is to include healthcare costs within the calculation10,11 using the incremental net benefit framework.
8
In this framework, both costs and QALYs are converted onto the same scale using a cost-effectiveness threshold (
where
To calculate a payoff time, Equation 2 can be plotted over time.10,11 In this analysis the “payoff time” represents the point in time at which the intervention becomes cost-effective for a given explicitly defined cost-effectiveness threshold (λ) compared with a relevant comparator: the time point where benefits outweigh the initial resources required for investment as well as those expected downstream. When allocating scarce healthcare resources, McCabe and others highlight how decision makers are likely to value a formal framework calculating the payoff time (as well as its uncertainty) in INHB 10 and how it can be potentially be used to share risk between payers and providers and smooth investment decisions over time. 11
Direct Treatment Disutilities
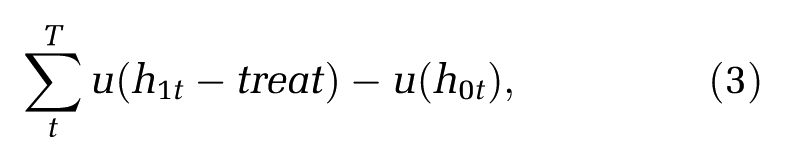
Previous studies have focused on clinical situations where there is a large, but transient, upfront harm due to a surgical or other one-off procedure, with deferred benefits subsequently accruing. 7 The initial upfront harm is then integrated with the downstream treatment benefits in order to calculate an expected payoff time. For preventive treatments that are taken long term, such as antihypertensives or statins, a one-off harm (or disutility) is not usually meaningful, but the concept of direct treatment disutility (DTD) becomes relevant. DTDs have previously been defined as representing an individual’s strength of preference not to undergo regular treatment separate from an any potential adverse effect resulting from treatment. 15 Disutility beyond that caused by specific treatment-related adverse effects could occur because of the inconvenience associated with treatment, such as obtaining prescriptions and collecting medicines, taking them daily, and having follow-up tests or appointments. Disutility may also arise because patients find treatment an unpalatable prospect in its own right. A previous review has highlighted an emerging literature which seeks to elicit DTDs and has described the consequences of including DTD values within cost-effectiveness modeling for long-term preventive interventions. 15 Within such a context, the interpretation of the payoff time for a preventive intervention is the point in time where the benefits outweigh the initial and ongoing DTDs associated with treatment. Equation 1 with the inclusion of direct treatment disutility becomes Equation 3:
where
The Modeling Framework
A number of types of decision-analytic models are available for use in cost-effectiveness analysis (CEA). 16 For model developers, selecting the appropriate model requires an explicit process involving a number of stakeholders in order to make clear the simplifying assumptions of the model-type and its appropriateness to capture the relevant treatment and disease processes. 17
Decision trees lack an internal time component so are not a useful model type if a payoff time is required. By comparison, state-transition Markov models have time within their structure in the form of model cycles. Consequently, Markov models require only a trivial extension to the modeling framework to calculate payoff times. To calculate a payoff time for a long-term preventive intervention, such as a statin for primary prevention, the initial step is to check whether any harms were included, or planned to be included, in the model-based CEA. Harm is defined as the reduction in HRQoL, or an increase in risk for the new intervention versus the old, within any time period. Step 2 involves including a relevant, literature-sourced DTD for the intervention arm with no DTD in the no-treatment arm. Step 3 calculates an expected value for the cumulative QALYs and/or net benefit for each model cycle for the whole cohort for all the alternative treatment strategies. Step 4 involves calculating the incremental outputs by subtracting the cumulative outputs for the alternative strategies. The calculation of the payoff time can be found indirectly by identifying the point in time at which the cumulative incremental QALYs become positive. This value can be readily visualized on a plot of cumulative incremental QALYs against time from model start. If the observed payoff time occurs between model cycles, then a linear interpolated time can be estimated by assuming a common trend between the time points. The payoff time can be calculated inclusive of healthcare resources with only a trivial extension to the previous steps.
For an individual level approach, such as the use of a discrete event simulation (DES) model,18,19 the calculation of the payoff time is less straightforward but it is feasible to calculate individualized payoff times by modeling individual patients in different counterfactuals and by comparing outcomes. For those developing a new model, the payoff time calculation should be a core part of the design, and a number of attributes tracking the timing of events would be needed to allow estimation for the payoff time. A substantial advantage of the use of a DES model is the ability to capture patient-level heterogeneity rather than having to prespecify a number of homogenous cohorts in state-transition Markov models. However, it is unlikely that payoff times can be calculated retrospectively for existing DES models without significant redesign.
Example of the Payoff Time: Primary Preventive Intervention Using Statins
The Model
A published state-transition Markov model previously developed by the National Centre for Clinical Guidelines (NCGC) and used to inform a NICE clinical guideline was used as the framework to illustrate an application of the methods described above.20,21 The model was designed to assess the relative cost-effectiveness of statin therapy for primary and secondary prevention of cardiovascular disease. Here we focus only on primary prevention. The 2014 NICE guidelines on lipid modification recommend offering statin treatment for primary prevention to all people with an estimated 10-year risk of cardiovascular disease of 10%. 21 The equivalent US guideline recommends initiating statins in people aged up to 75 years at a 10-year risk threshold of 7.5% and to consider initiation if 10-year risk is 5%–7.5%. 22 Almost all UK residents will cross the 10% threshold at some point in their late 50s or 60s, but the recommendation ignores that some older patients will have reduced life expectancy from other causes, which makes consideration of payoff time relevant.
Figure 2 shows the schematic for the Markov model structure that included 15 health states, including all-cause mortality and CVD-mortality. Treatment options included in this analysis were no-treatment and high-intensity statin treatment. The model followed the NICE reference case, 14 assumed an NHS perspective, took a life-time time-horizon, discounted costs and QALYs at 3.5%, and could be run for different age cohorts (age: 40 years, 50 years, 60 years, 70 years) and levels of baseline risk of cardiovascular disease. The original analysis used to inform the clinical guideline showed high-intensity statin treatment to be highly cost-effective at a threshold of £30,000 per QALY. No patient harm was included in the existing model; that is, statin use was assumed to have no increased risk of adverse outcomes, and DTDs were assumed be zero.
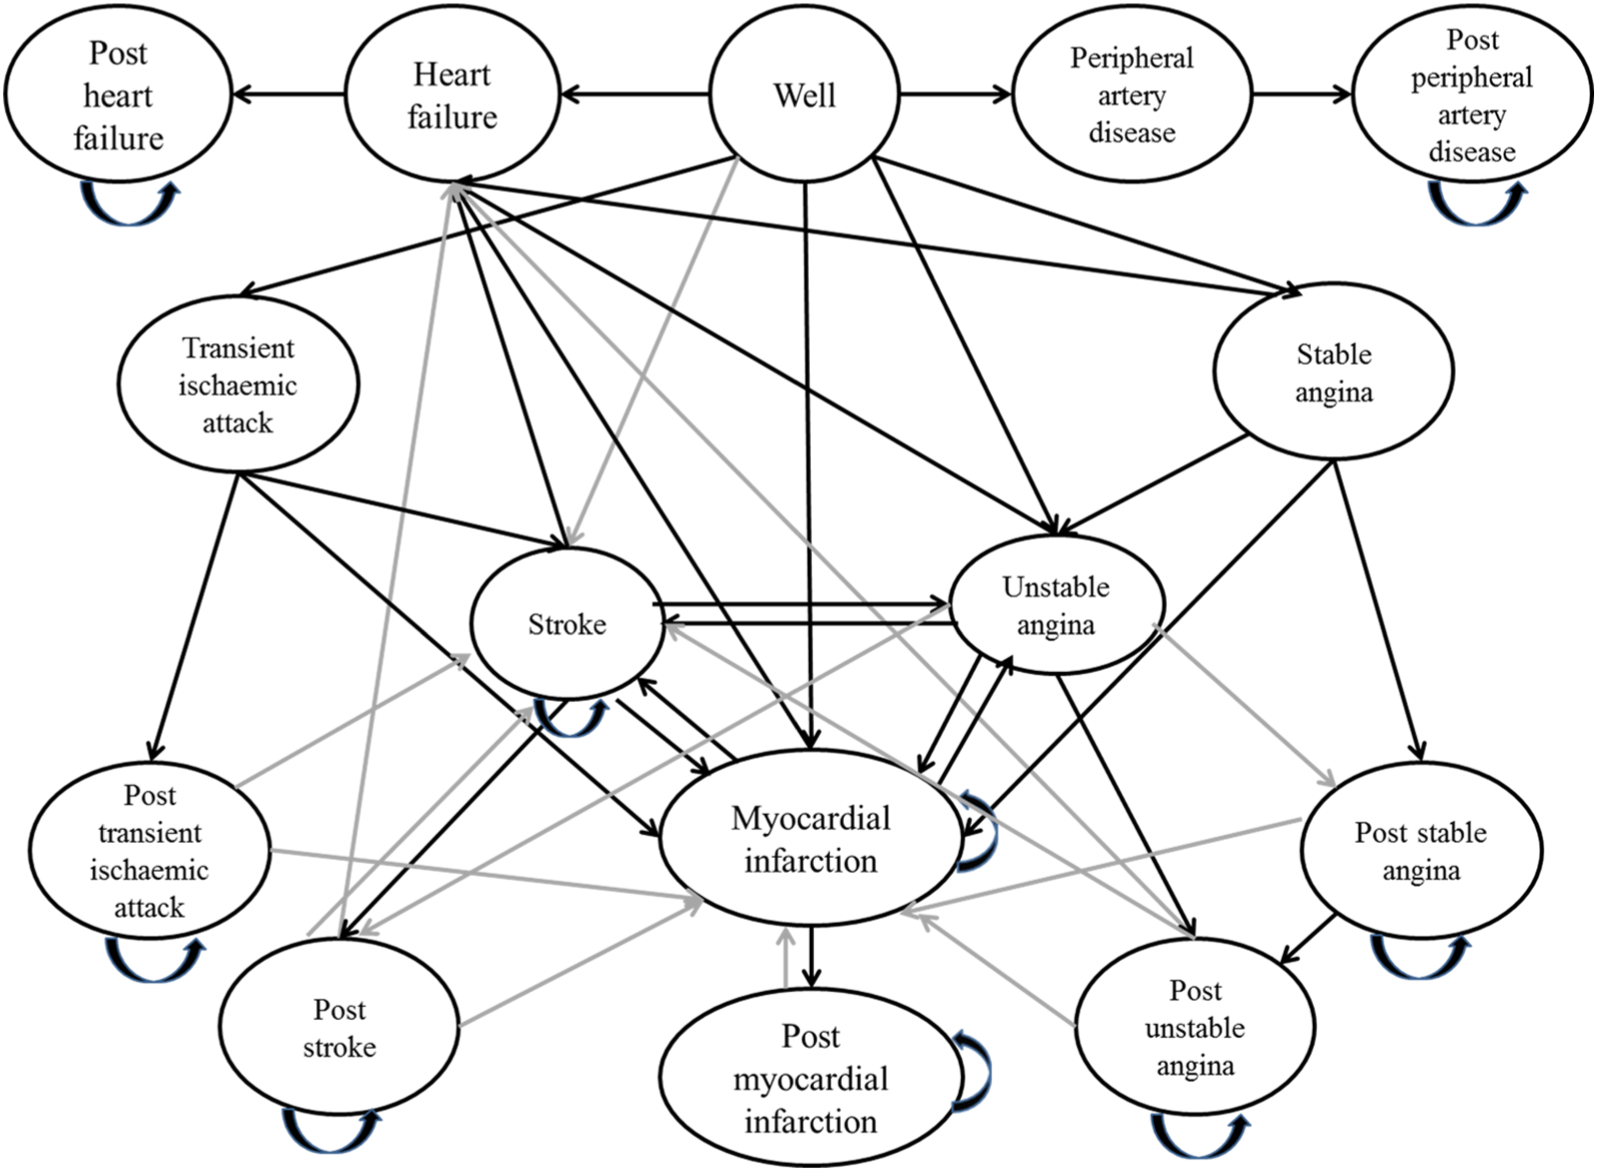
Schematic of economic model. Every health state links to all-cause mortality and CVD-mortality. *Adapted from the National Clinical Guideline Centre (NCGC) cost-effectiveness model on lipid modification. 20
Analysis
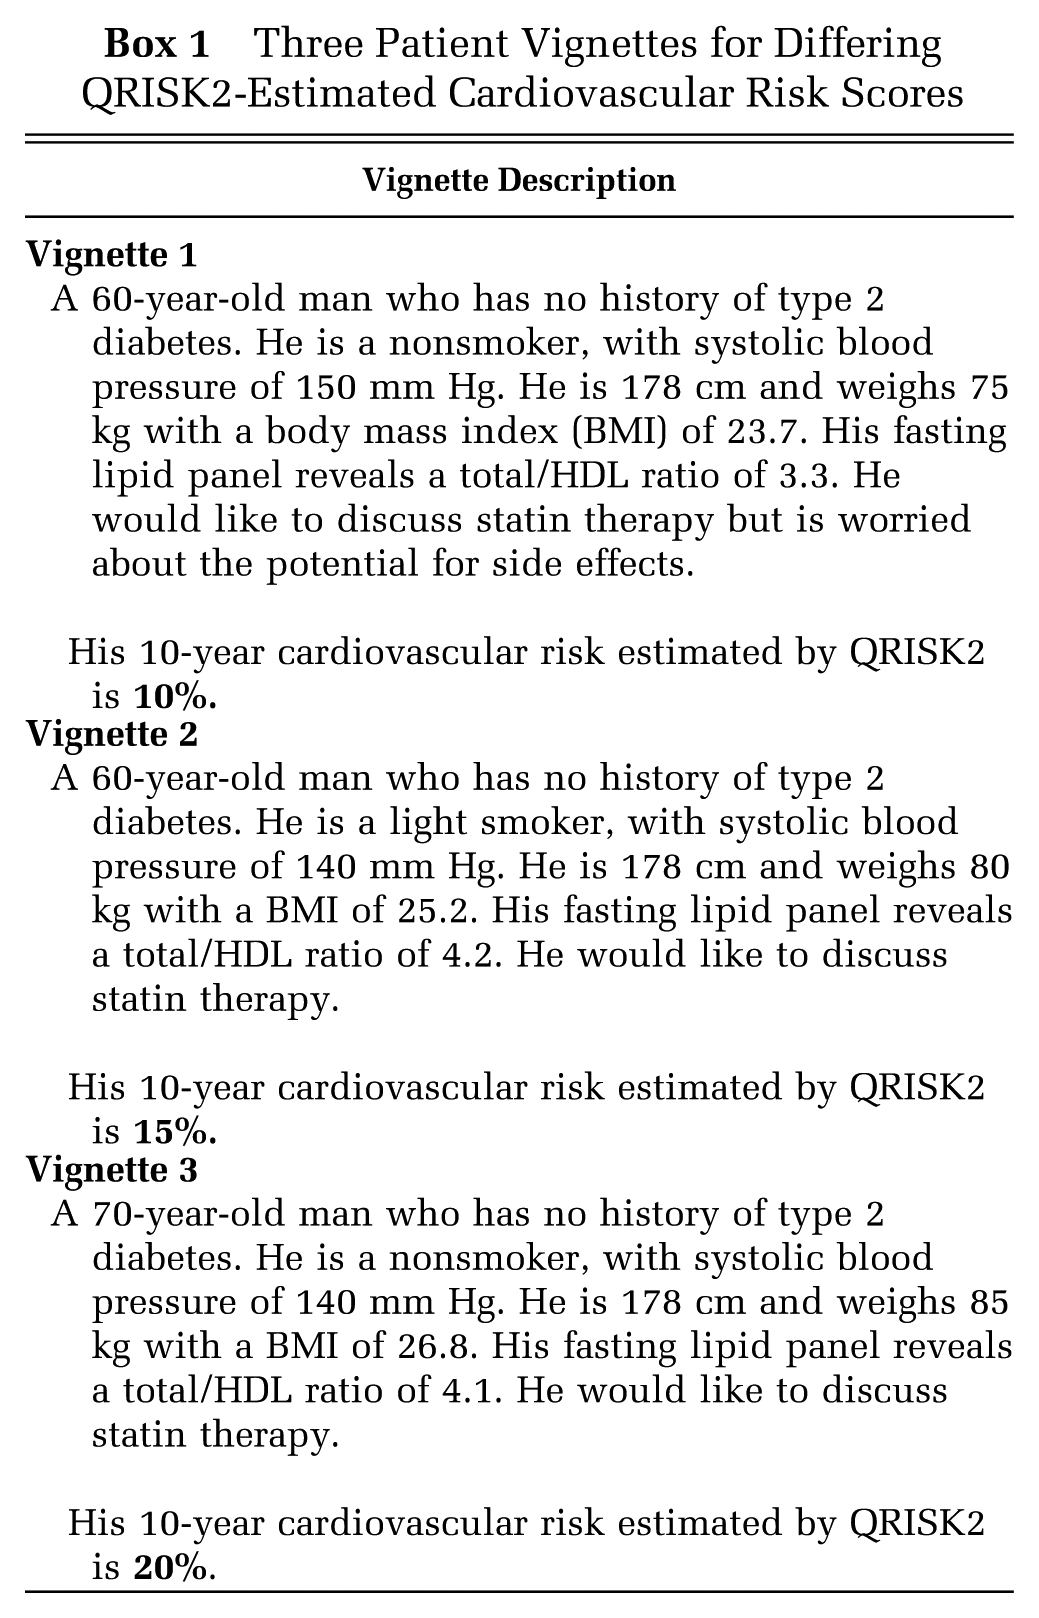
Patient vignettes were generated (see Box 1) to provide clinically relevant scenarios to illustrate how to quantify the impact of the payoff time. Three patient vignettes were created with input from clinicians (3 general practitioners and 4 specialists with experience of managing cardiovascular disease). The patient vignettes were focused on the management of male patients built around scenarios defined by estimated 10-year cardiovascular risk scores of 10%, 15%, and 20% (as calculated by QRISK2, 23 the tool currently recommended by NICE to estimate cardiovascular risk 21 ).
Three Patient Vignettes for Differing QRISK2-Estimated Cardiovascular Risk Scores
The published state-transition Markov model was adapted to allow calculation of cumulative incremental QALYs and net benefit for each 1-year model cycle. We added 3 levels of DTDs (0.005, 0.01, 0.15) in the model, which were informed by a review of the current literature. 15 The DTDs were applied annually to the whole cohort within the model and did not decrease over time. Payoff time was defined by the interpolated model cycle in which the net benefit became positive. In total, the following were calculated when costs were not included in the analysis: absolute QALYs and equivalent healthy days; payoff time (years); time to peak investment in QALYs (years); investment size (QALYs). The following were also calculated when costs were included in the analysis and a threshold of £20,000 per QALY gained was assumed: overall net benefit (£); payoff time (years).
Results
Table 1 summarizes the calculated values resulting from the adapted model.
Key Results
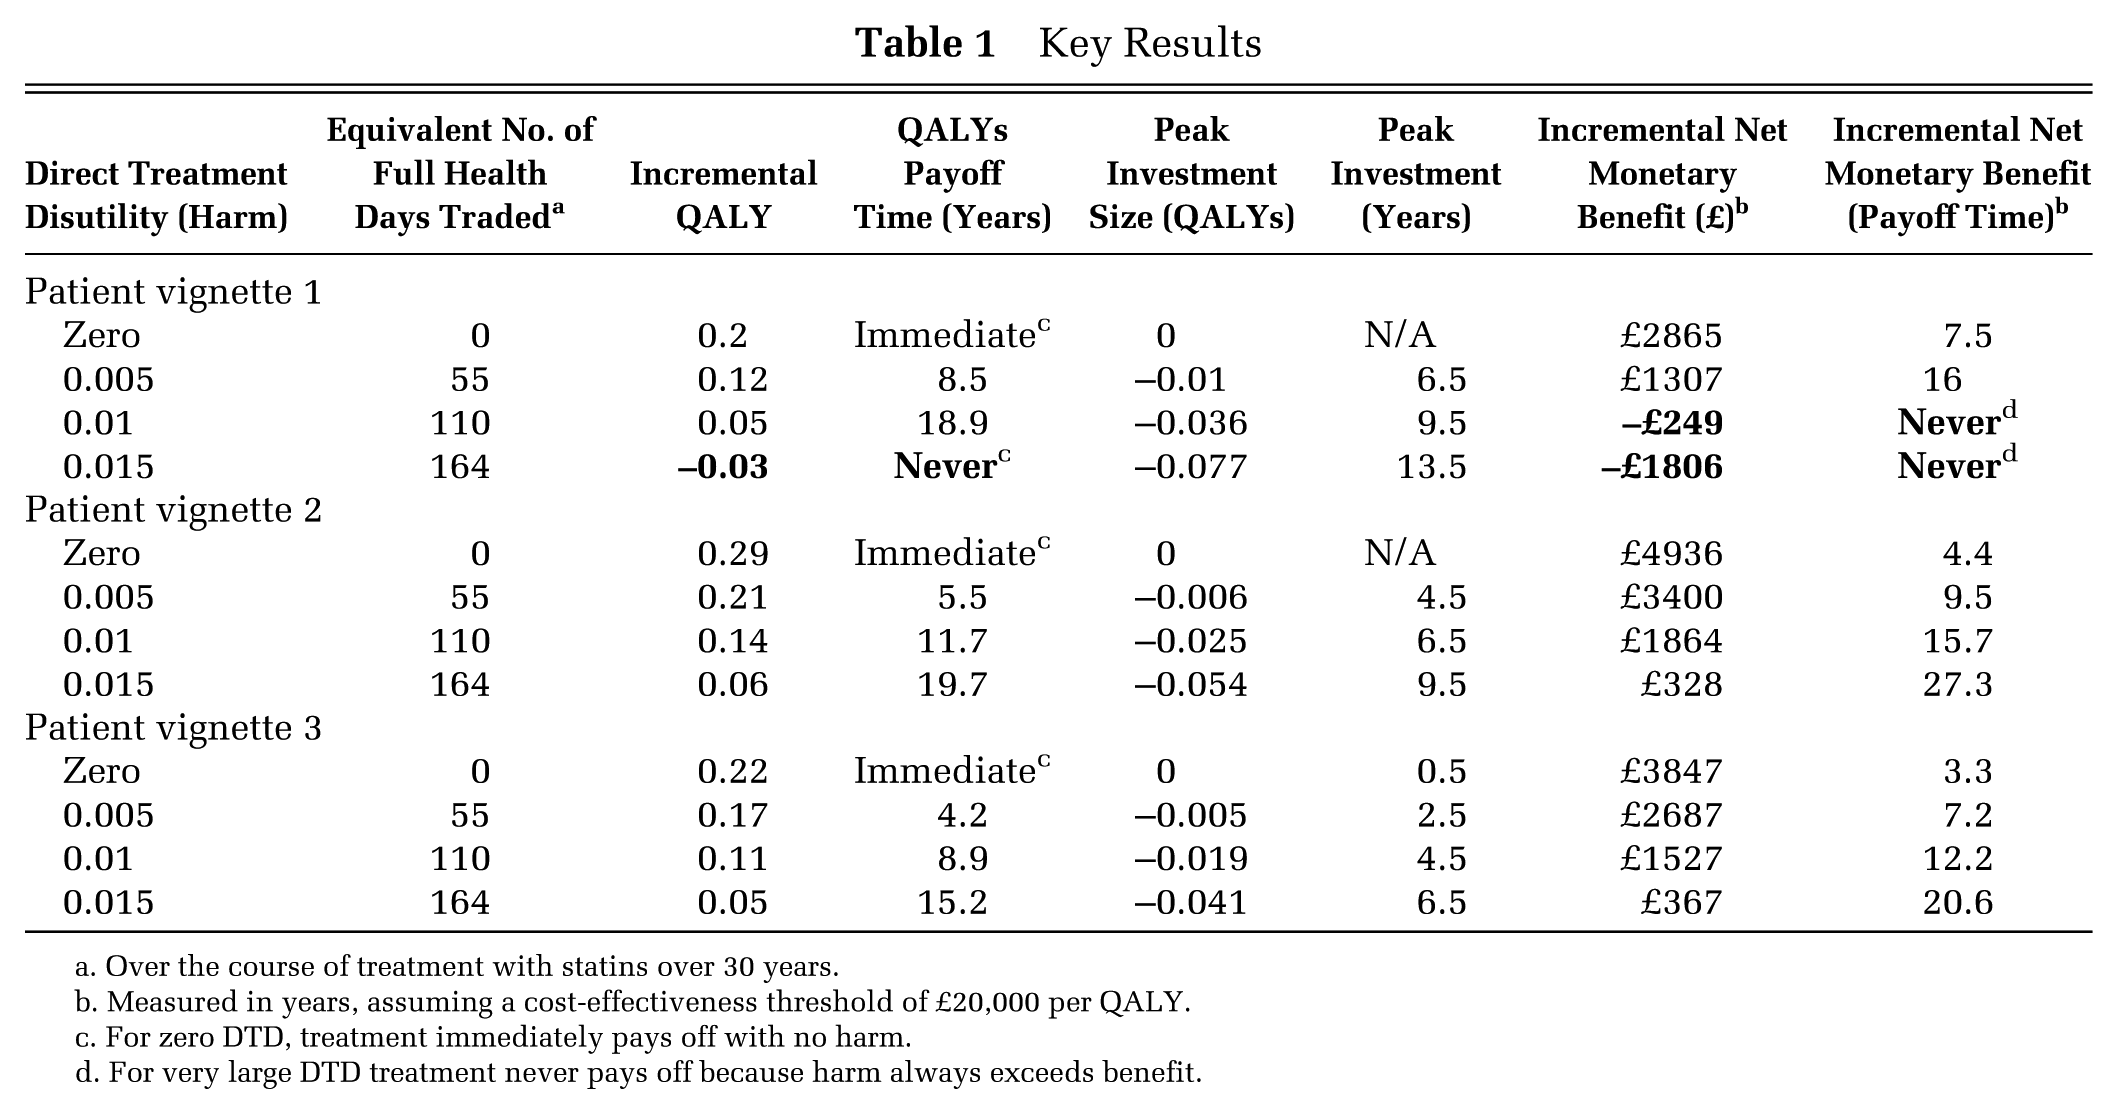
Over the course of treatment with statins over 30 years.
Measured in years, assuming a cost-effectiveness threshold of £20,000 per QALY.
For zero DTD, treatment immediately pays off with no harm.
For very large DTD treatment never pays off because harm always exceeds benefit.
Patient Vignette 1
Vignette 1 reflects a patient who is a 60-year-old man whose cardiovascular risk was largely driven by age and gender. The results in Table 1 show that high-intensity statin treatment was a cost-effective option when there was no DTD, with a positive net benefit of £2865 for a cost-effectiveness threshold of £20,000. As there was no harm or DTD included in the model, the intervention paid off immediately when measured in QALYs, and the incremental cumulative QALY gain was estimated to be 0.20 QALYs per patient equal to approximately 73 days at full health. Figure 3 shows the QALY profile for Vignette 1. Of note is that even low DTD was associated with payoff times measured in years, and the expected absolute QALY gain was sensitive to the presence of DTD. For example, a DTD of 0.005 was associated with a payoff of 8.5 years when measured in QALYs with a peak investment (or harm) occurring at 6.5 years for a QALY loss of 0.01. When the size of the DTD was set at 0.015 or above, then statin treatment never pays off and there is a QALY loss of 0.03 QALYs over the whole period.
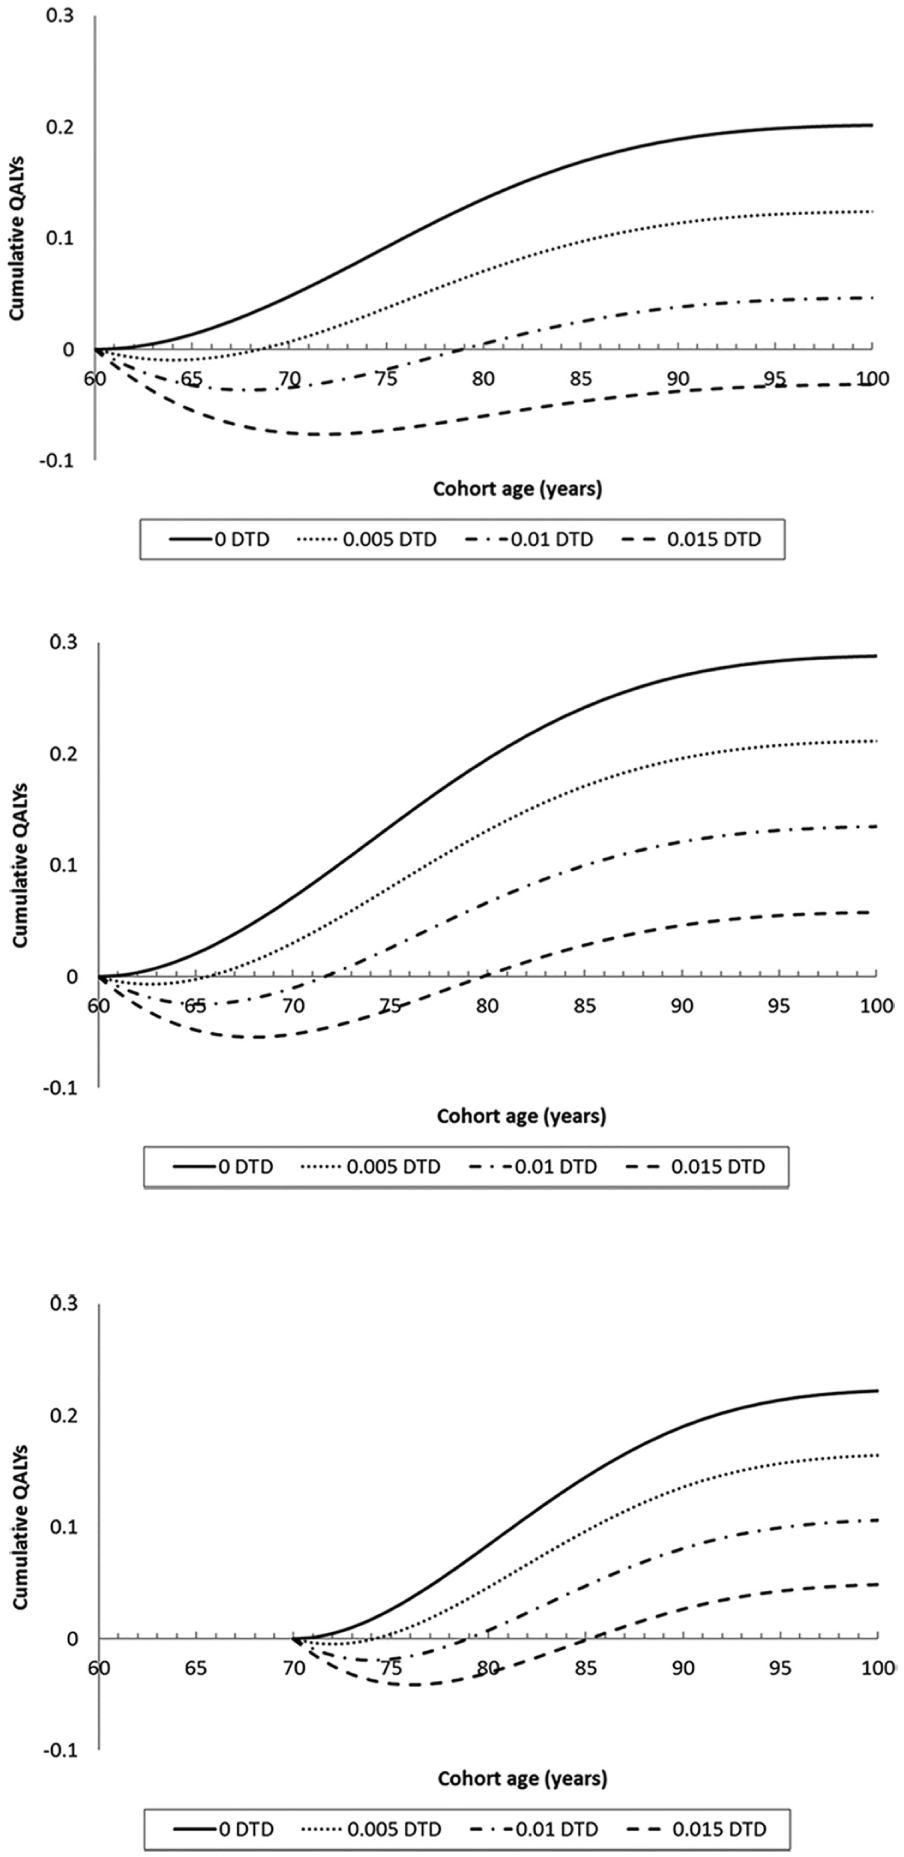
QALY profiles for 3 patient vignettes with 4 levels of direct treatment disutility (harm) from treatment.
When accounting for costs and a threshold of £20,000 per QALY, the payoff time was 7.5 years with no DTD included in the model. This payoff time rose to 16 years with a DTD of 0.005, and the intervention never paid off for DTDs of 0.01 and 0.015.
Patient Vignette 2
Vignette 2 reflects a patient who is a 60-year-old man whose 10-year cardiovascular risk of 15% is driven by age, gender, smoking, and lipid profile. The results in Table 1 show that high-intensity statin treatment was a cost-effective option when there is no direct treatment disutility, with a positive net benefit of £4936 for a cost-effectiveness threshold of £20,000. The intervention paid off immediately when measured in QALYs. Likewise, the absolute QALY gain was estimated to be 0.29 QALYs per patient equal to approximately 106 days at full health. Figure 3 shows the QALY profile for Vignette 2. Of note is that even low DTD is associated with payoff times measured in years (although as expected, payoff times are shorter and absolute QALY gains are greater when baseline risk of cardiovascular disease increases), and the expected absolute QALY gain is sensitive to the presence of DTD. When the size of the DTD was set at 0.015, then statin treatment only pays off after 19.7 years.
When accounting for costs and a threshold of £20,000 per QALY, the payoff time was 4.4 years with no DTD included in the model. This payoff time rose to 9.5 years for a DTD of 0.005, 15.7 years for a DTD of 0.01, and 27.3 years for a DTD of 0.015.
Patient Vignette 3
Vignette 3 reflects a patient who is a 70-year-old man whose 10-year cardiovascular risk of 20% is driven by age, gender, and lipid profile. The results in Table 1 show that high-intensity statin treatment is a cost-effective option when there is no direct treatment disutility, with a positive net benefit of £3847 for a cost-effectiveness threshold of £20,000. The intervention paid off immediately when measured in QALYs, with an absolute QALY gain estimated to be 0.22 QALYs per patient equal to approximately 80 days at full health. Figure 3 illustrates that even low DTD was associated with payoff times measured in years (although again, as expected, payoff times were lower and absolute QALY gains were greater when baseline risk of cardiovascular disease increased), and the expected absolute QALY gain was sensitive to the presence of DTD. For example, a DTD of 0.005 was associated with a payoff of 4.2 years rising to 15.2 years for a DTD of 0.015.
When accounting for costs and a threshold of £20,000 per QALY, the payoff time was 3.3 years with no DTD included in the model. This payoff time rises to 7.2 years for a DTD of 0.005, 12.2 years for a DTD of 0.01, and 20.6 years for a DTD of 0.015.
Discussion
This study has applied the 2 emerging concepts of payoff time and DTD to an existing decision-analytic model designed to assess the relative cost-effectiveness of statins for the primary prevention of cardiovascular disease. It illustrated how evidence regarding the temporal dimension of treatment decisions can be generated retrospectively using existing economic evidence. The calculation of payoff time together with visual presentation of the information provides a potentially useful tool to complement existing cost-effectiveness results and aid decision making when choosing between interventions with different payoff times.
We provided 2 estimates of payoff time. The first focused on the balance between benefits and harms, which is more useful for individualized patient-level decisions for treatments judged cost-effective by technology appraisers and guideline developers. In these models, the existing model-based CEA assumed no upfront harm or DTD and estimated immediate (zero) payoff times, but incorporating DTD led to substantial payoff times including failure to ever payoff in some scenarios. The second estimates we generated were inclusive of healthcare costs and are likely to be of particular interest for those assessing public health interventions or diagnostic technologies that could have significant upfront costs but deferred patient benefits or downstream cost savings. Where costs were included in the model, the payoff times varied from 3.3 to 7.5 years assuming no DTD. Substantial payoff times were estimated in the presence of DTD including scenarios in which the intervention failed to ever payoff. The development of tools to calculate the return on investment for public health interventions for NICE 24 or budget impact and costing tools suggests a demand for alternative forms of evidence by commissioners and policy makers. However, these tools do not currently account for upfront harms or DTD, and an explicit calculation of the payoff time has yet to be used. Our study showed how a payoff time inclusive of healthcare costs can be generated from an existing decision-analytic model.
The American Geriatrics Association (AGA) outlined key principles for the care of older people with multimorbidity in 2012, including that “time to benefit” and expected absolute benefit should inform clinical decision making. AGA recommended that interventions in this population should ideally be prioritized based on evidence of net benefit occurring within an individual’s expected lifetime. However, robust evidence on a temporal dimension is not currently available for decision makers. For example, current clinical guidelines such as those produced by NICE generally do not provide explicit information on the temporal dimensions of benefit, with at most trial-duration being stated as a surrogate for the treatment time required to receive a benefit from an intervention. Decision making is further constrained by a clinical evidence base that has typically adopted a simplistic statistical approach to handling “competing risks.” For example, in survival analysis assessing a disease-specific endpoint, a common naïve approach is to treat the occurrence of a competing event (e.g., death not because of the disease) as independently censored. Consequently, those subjects who do experience the competing event are handled as if they are still at risk of the disease endpoint in the future, leading to the potential overestimation of this risk and an overestimation of the subsequent benefits and cost-effectiveness of treatments.25–27 Where the risk of the competing event is particularly high, such as death in older patients who are multimorbid, 28 a naïve approach can lead to unnecessary and potentially harmful treatment. 25 Further work is needed to ensure that appropriate statistical methods are used within trials to estimate benefit and in the development of competing risk-adjusted risk-prediction algorithms to stratify treatment decisions. The impact of properly accounting for competing risk on payoff times is also a clear research interest.
The methods developed in this paper begin to allow a temporal dimension to be incorporated into benefit-risk decision making and allow for absolute measures of benefit to be calculated. Future studies could generate estimates of the payoff time for other interventions likely to be taken alongside statins, such as antihypertensives. The majority of people with any chronic condition are multimorbid 29 and so are likely to be prescribed multiple interventions each with differing payoff times. Providing decision makers with a range of competing payoff times allows for prioritization between interventions, particularly preventive interventions where benefits accrue further into the future.
Limitations
There are some potential limitations with our application of the payoff time approach for current decision making. We do not conduct probabilistic sensitivity analysis to generate ranges for our payoff estimates as others have done so for reimbursement decisions.10,11 Instead we used 1-way sensitivity analyses for differing levels of DTDs and baseline risks. Given that the DTD value for an individual and the impact these values have on payoff time are of primary interest, this form of 1-way sensitivity analysis was deemed to be most straightforward to apply to our research problem. Ideally, all the uncertainty, including uncertainty around DTD, would be incorporated within the analysis simultaneously as is the case in probabilistic sensitivity analysis.
A methodological limitation is whether there are quantifiable estimates of DTD. There is increasing evidence that patients negatively value taking long-term preventive medications and that if properly accounted for in decision-analytic models, these DTD values could have important consequences for cost-effectiveness. 21 Future research generating robust empirical estimates for DTD using well-designed stated preference studies in appropriate samples of the patient population and members of the public is required. These studies need to provide evidence on the level of heterogeneity of DTD values between patients, providing the scope to potentially use individualized or group-level DTD values within individual-level models such as a DES. It is also uncertain how best to incorporate DTD into the utility values for the patient cohort being run through a Markov model. In this study, a constant harm (DTD value) was used and the utility decrement was taken from the total utility for the relevant model cycle. Research is needed to explore the validity of these assumptions that DTD is constant over time and that simple subtraction of the disutility value is an appropriate approach.
It is not currently clear what the best approach is to discount benefits for the payoff time in the IB framework and benefits and costs for a payoff time in the INHB framework. In this paper both benefits and costs were discounted at 3.5% but there is the potential for “double discounting” on the benefit side if the method of eliciting DTD values has already incorporated individuals’ time-preference (e.g., within a time tradeoff exercise) and DTD values are then further discounted in the model-based analysis. For the calculation of a payoff time within the INHB framework, McCabe and colleagues 10 conducted sensitivity analyses for differing discount rates for benefits (1.5%) and costs (3.5%) and found the impact on the expected payoff time to be small but the impact on the uncertainty of the estimate to be substantial. Future models calculating the payoff time for primary preventive interventions with an associated DTD could explore the impact of time-preference on the results when more is known as to how patients discount DTDs over long periods.
A similar conceptual problem relates to the risk aversion of the decision maker. In this paper we have assumed individuals within a shared decision-making framework would be happy to make decisions based on expected outcomes. In short, they are risk-neutral like a societal decision maker allocating resources over time. Consequently, any positive expected payoff time that falls within an individual’s lifetime would be a rational treatment choice. If, instead, individual decision makers are risk averse, as is more likely to be the case, then this may not hold. Future work could explore these conceptual implications further alongside the calculation of payoff times for other potentially “competing” interventions for cardiovascular disease, such as antihypertensives, in order to inform potential prioritization decisions.
Conclusion
Evidence on a temporal dimension to net benefit has been argued to be essential to prioritize and select interventions, particularly for patients with multimorbidity. We have shown how current decision-analytic models can readily be modified to estimate the payoff time and that payoff time is a potentially useful tool to aid decision making in the context of developing clinical guidelines. Further research is required to generate more estimates of payoff time for a range of different interventions so prioritization can occur. Further empirical research is also needed to generate estimates of DTDs, how to best include DTD within decision-analytic models, and how to present uncertainty around estimates of payoff time. Ideally, DES models will form the basis for future payoff time calculations allowing for individualized estimates to be made and used in decision making.
Footnotes
Financial support for this study was provided National Institute for Health Research Health Services and Delivery Research Programme (Project No. 11/2003/27).
The funding agreement ensured the authors’ independence in designing the study, interpreting the data, and writing and publishing the report. The views and opinions expressed therein are those of the authors and do not necessarily reflect those of the HS&DR Programme, NIHR, NHS, or Department of Health.
The authors have no conflicts of interest to declare.