
Abstract
The EQ-5D is internationally one of the most widely used health-related quality-of-life instruments. 1 It is therefore very important to obtain a good understanding of the characteristics of EQ-5D data. Many studies of the original 3-level version of the EQ-5D (now known as the EQ-5D-3L) have found that its index scores typically have a nonnormal distribution divided into 2 distinct groups. (This is often described as “bimodal,” but we will argue that this label is misleading.) This phenomenon has been found in both patient and general populations, for many conditions, and using different country-specific value sets. In examining the distribution of health states within a particular population, it is useful to know to what extent its shape is determined by the way that the EQ-5D-3L index is constructed rather than by the true distribution of ill health. In addition, the index is constructed from 2 separate elements—a classification system used to create health state profiles and a set of weights applied to profiles—and it is useful to know the relative importance of these factors in shaping health state distributions.
This paper examines the determinants of the shape of EQ-5D-3L index score distributions, in particular the origins of the “2 groups” distribution. We analyze data from patients undergoing elective surgery (hip and knee replacements and varicose vein and hernia repairs) in the UK National Health Service (NHS) and from primary care patients in a study of 2 chronic conditions (asthma and angina). The distributions are compared with those of index scores from which weights have been stripped, and profile data are decomposed into their constituent dimensions and levels to see how they influence those distributions. Distributions that arise from applying different sources of weights (value sets), including those from countries other than the United Kingdom, are demonstrated. They are also compared with the distributions of condition-specific indexes assessed for the same patients. We conclude by suggesting practical ways in which researchers could analyze EQ-5D index data to obtain richer results than are conventionally reported.
Background
The EQ-5D is used widely in economic analyses and population health surveys and for routine assessment of patients’ health: for example, the Patient Reported Outcome Measures (PROMs) program for the NHS. 2 The EQ-5D-3L instrument comprises 2 self-report elements: The first is the EQ-5D self-classifier, where respondents tick boxes to indicate which of 3 levels of problems (no, some, extreme) they have on each of 5 dimensions (mobility [MO], self-care [SC], usual activities [UA], pain and discomfort [PD], and anxiety and depression [AD]) to create a health profile. The second element is a visual analogue scale, the EQ-VAS, on which respondents rate their overall health from 0 (worst health imaginable) to 100 (best health imaginable).
The profile and EQ-VAS both provide valuable information about patients’ views of their own health, and either can form the analytical focus. Profile data can be analyzed in different ways (e.g., a Health Profile Grid and a Paretian Classification of Health Change 2 ), but by far the most common way is to use index scores to summarize the data. These scores provide, for each of the 243 (=35) possible states described by the EQ-5D-3L, a value on a scale anchored at 1 (full health) and 0 (a state as bad as being dead), with values less than 0 indicating states worse than being dead. Typically, these values are obtained for a subset of states from general public surveys, using stated preference methods to ascertain their views about how good or bad the states are. These sample data are used to model values for all states. The resulting value sets, sometimes called tariffs, result from and are influenced by factors including choices about whose values are relevant (e.g., the general public or patient populations), the methods used to elicit preferences (e.g., time tradeoff, visual analogue scale, or standard gamble), and how the data are modeled.
There are clear normative grounds for using index scores to summarize profile data where the purpose is to estimate quality-adjusted life-year gains for economic evaluation. For example, it is often argued that for decisions in the UK’s tax-funded NHS, the relevant values are those of the general public, as taxpayers and potential users of the service. However, index scores are also widely used in other applications, where that rationale may not apply. For example, the Health Survey for England 3 reports all EQ-5D data as index scores, even though they are intended as descriptive rather than evaluative. This is probably because single numbers are easier to analyze and report than are profiles comprising multiple dimensions. This practice may also result from a mistaken belief that index scores are like the scoring systems used in condition-specific instruments, which are usually developed as an integral part of the instrument.
Some important concerns have been raised about the use of index scores to summarize EQ-5D profiles. This introduces an exogenous source of variance, which can bias statistical inference.4,5 For example, conclusions about whether there are statistically significant differences in the health of 2 regions, or over time, or between 2 arms of a clinical trial, may be influenced by which value set is used. More generally, there is no such thing as a neutral value set. Any weighting of EQ-5D profile data exerts an influence on results. This point is not peculiar to the EQ-5D; it applies equally to other health measures’ scoring systems, both generic and condition specific, including measures that simply sum ranked responses.
Because the EQ-5D is such a widely used instrument and because an index is so often used to summarize it, understanding the characteristics of the index is very important. An issue that has been widely identified as problematic is that the distribution of EQ-5D-3L scores is nonnormal, having what is often labeled a bimodal shape. The main concern has been about possible estimation problems if this shape results in a nonnormal distribution of residuals when the EQ-5D index is the dependent variable in regression analyses.
A further problem is that a bimodal distribution might imply that there are actually 2 separable patient populations that should be analyzed separately. It might be that many patient populations comprise distinct groups, and the EQ-5D-3L is capable of picking out 2 of them. Alternatively, the EQ-5D profile might divide patients into groups even though they are from a common distribution, or the weighting of EQ-5D profiles might have that result. Knowing which of these is the source of the observed distribution pattern is crucial to its proper analysis and interpretation.
Studies that have identified this issue, reviewed below, often suggest that the score distributions are bimodal or trimodal, but those labels are misleading. A better description is that the distributions identify 2 groups, with an identifiable gap in scores between them. We will refer to these as the “high cluster” and the “low cluster.” The label trimodal has been used where there are many observations of people who have no problems according to the EQ-5D classification, forming a third group, again with a gap from the high cluster. The large gap between no problems (11111 = 1) and the next best health state (11211 = 0.883 using the weights most widely used in the UK 6 ) is important, but the reason why a single score “group” at 1 exists is obvious, and its mode is trivially determined. The interesting questions concern the other 2 groups and the gap between them, which has been identified as being around 0.5 7 or 0.45.8,9 The reason why bimodal is a misleading description for this phenomenon is that the modes of the 2 groups are not their most interesting feature; the groups do not always have a single local mode; and in practice these modes are never actually identified, reported, or analyzed.
This feature of EQ-5D-3L index distributions has been reported in studies covering a diverse range of conditions. There have been many studies in arthritis,7,10–20 rheumatic disease,21,22 orthopedic conditions and treatments including herniated lumbar disc, 23 common spinal conditions for which surgery is indicated, 24 total knee replacement,25,26 lumbar spinal stenosis, 27 all elective orthopedic operations,28,29 and hip arthroplasty. 30 Studies of other conditions and populations include accident victims with life-threatening injuries, 10 breast cancer, 31 chronically ill patients undergoing hemodialysis, 32 lower back pain, chronic obstructive pulmonary disease, end-stage renal disease, 10 irritable bowel syndrome, leg ulcer and osteoporosis,8,9 menopausal women and healthy older women, 8 pregnant women with chronic energy deficiency, 33 HIV, 34 postmenopausal women, 35 multiple myeloma and non-Hodgkin’s lymphoma, 7 asthma, chest pain, clodronate, hormone replacement therapy, leg reconstruction and varicose veins, 9 and multiple sclerosis. 36
It is often alleged that the gap arises because the decrement in the index between levels 2 and 3 is relatively large compared with that between levels 1 and 2. 11 More specifically, the so-called “N3” term 6 used to calculate the index in the UK and elsewhere has been implicated.8,9,21,31 This gives a large decrement to the index if any dimension has a level 3 state.
The presence or absence of a level 3 observation does, in practice, place the UK index score above or below 0.5. If there is any level 3 in a profile, the score is at most (1 − [0.081 + 0.269]) = 0.650. The maximum score that any profile can have with a level 3 in a particular dimension is therefore 0.336 (MO), 0.436 (SC), 0.556 (UA), 0.264 (PD), or 0.414 (AD). The smallest level 2 increment for dimensions other than UA is 0.069 (MO). Therefore, only 1 of the 211 (= 35 – 25) profiles that include a level 3 observation also has a score above 0.5, namely 11311. This is an unusual profile that is very rarely encountered in practice. Conversely, all 32 profiles that do not include a level 3 observation have a score above 0.5.
Related to this is evidence that in mapping between the EQ-5D-3L and other health indexes, the EQ-5D-3L may overestimate the scores for more severe health states. One study 37 hypothesized that predictions are poor for more severe states, defined as index lower than 0.5, because they all have at least 1 dimension at the most severe level and the UK EQ-5D-3L model uses the N3 term. The importance of this term was tested by reestimating the UK model without it, using the same data and methods as the original. 6 Although the predictions for more severe health states were better, they still appeared to be overestimated.
To test the hypothesis that N3 in itself does not generate a bimodal distribution, authors of another study 7 generated a random set of EQ-5D cases with an equal distribution of answers across the dimensions. The authors claimed that the resulting index scores were normally distributed, although it is more accurate to say that the distribution did not have the 2-groups-and-gap shape, suggesting that N3 is not the sole cause of that shape. The authors concluded that although N3 is a factor in the bimodal distribution and overestimation in mapping states whose scores are less than 0.5, these also arise from the fact that fewer responses are observed at level 3 than at level 1 or 2, and only a few states are observed.
Some studies have examined whether the existence of 2 groups is an artefact or whether, in some cases or in some way, it does identify different patient groups. One group of authors asserted27,28 “We strongly believe that it is the structure of the instrument that causes this phenomenon rather than the fact that it appears to highlight 2 sub-groups of patients.”28(p88) One study 36 examined this by seeking external validation of the groups identified by the EQ-5D distribution. In mapping a condition-specific measure (i.e., the MSWS-12) to the EQ-5D-3L, the authors calculated median MSWS-12 scores for 2 groups defined by a cut-point, which was the EQ-5D-3L score closest to 0.5.
Data and Methods
We explored the issues using both simulated and real data. First, an artificial data set was created, comprising 1 observation of each possible health state described by the EQ-5D-3L, from 11111 (no problems in any dimension) to 33333 (severe problems on all dimensions). This is equivalent to a data set consisting of random health states that have an equal probability of occurring. Each state was assigned 2 index scores, one using the UK weights and the other using an “equally weighted” scoring system, calculated by summing the level numbers (1, 2, or 3) over all dimensions, producing a number from 5 for the best health state to 15 for the worst health state. The equal weighting index was then converted so that it had the same range (−0.594 to 1) as the UK value set, using a linear transformation. The 2 resulting distributions were smoothed using identical kernel density estimation functions.
Second, we analyzed real patient data on 4 elective surgical procedures (hip and knee replacements and varicose vein and groin hernia repairs), which were collected by the English NHS PROMs program 2 from April 2009 to February 2011. This program collects data before and after surgery. Questionnaires are completed by patients mainly in preoperative clinics, which are then followed up by postal questionnaires 3 months (varicose vein and hernia) or 6 months (hip and knee) afterward. The aim is to collect data from every NHS patient in England, but in practice data are not always completed. We report analyses only from the preoperative data. We also analyzed old primary care data on angina and asthma patients collected as part of a trial 38 in which patients identified as having those conditions completed a postal questionnaire including the EQ-5D on 3 occasions. We report analyses of the data from the first survey. Rather than report all of our analyses for every data set, for some of them we focus on hip replacement data as an example.
The analysis consisted mainly of comparing index distributions using different ways of classifying and weighting profiles. We explored 2 different ways of classifying profiles into the 2 groups: dividing profiles into those above and below the EQ-5D-3L index score 0.5; and using a clustering technique, specifically the kmeans clustering procedure. This partitions observations into one of a predefined number of clusters, in this case 2, such that the within-cluster sum of squares is minimized. Each observation is assigned to the cluster with the mean closest to its own score.
We decomposed the profile data into its dimensions and levels to analyze whether the frequencies with which different combinations of these are found in patient populations could account for the observed clustering. We examined whether the EQ-5D-3L clusters were also identified by a different, condition-specific health measure. We compared the prevalence of clustering based on different country-specific value sets.
Results
Inspecting the shape of frequency distributions for health states with and without index weighting demonstrates the effect of index weighting. Figure 1 shows smoothed, UK-weighted, EQ-5D-3L index score distributions for the artificial data set described above. This might suggest that equally weighted data are naturally normally distributed, whereas UK weighted data are naturally skewed and bimodal. But is this purely a product of index weighting, or are other factors involved?
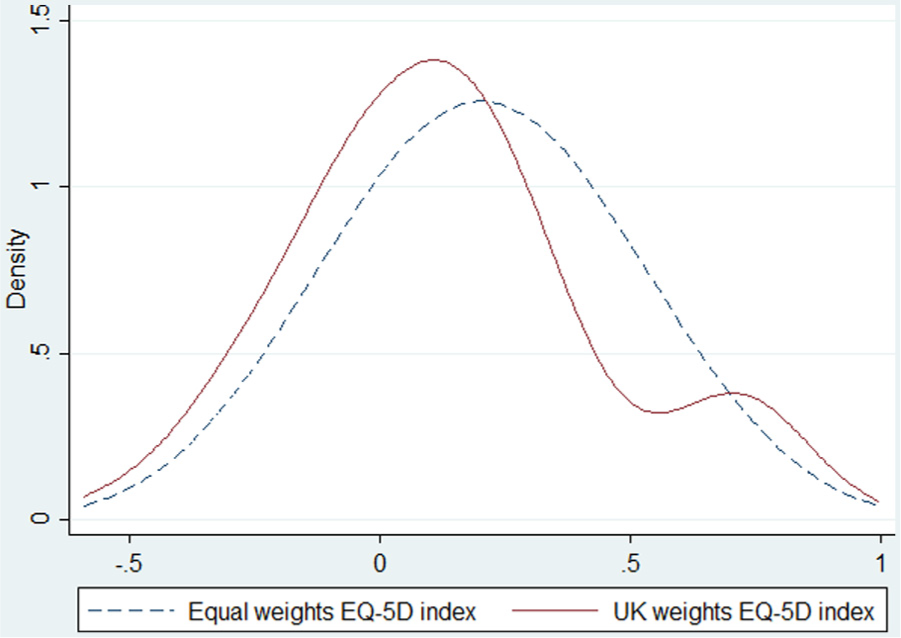
Distribution of equally weighted and UK-weighted scores for all 243 EQ-5D profiles in the EQ-5D descriptive system. Equal weight: mean 0.203, median 0.203, mode 0.203, standard deviation 0.292, skewness 0.000, kurtosis 2.700. Normality confirmed by skewness/kurtosis tests. UK weights: mean 0.137, median 0.109, mode 0.107, standard deviation 0.311, skewness 0.437, kurtosis 2.95. Local minimum 0.559; local mode 0.700. Nonnormality confirmed by skewness/kurtosis tests.
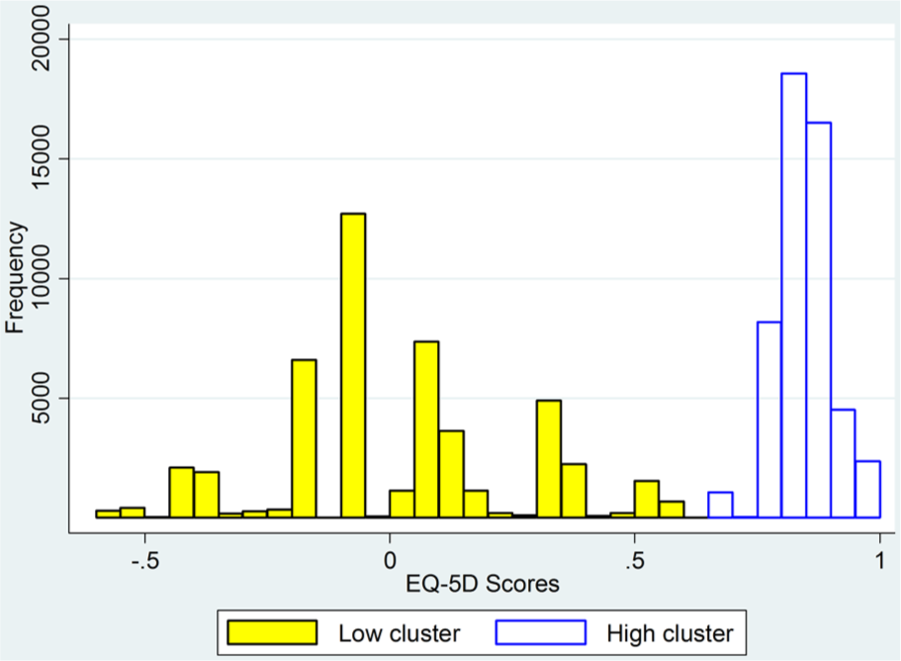
We explored this using the data on hip and knee replacements, varicose vein and groin hernia repairs, and angina and asthma patients. Figure 2 shows the index score distributions for patients prior to hip replacement surgery, which clearly exhibits a 2-groups-with-gaps pattern. (Ignore for now the distinction between low and high clusters.) Because it is less important for our purposes, we will disregard the third group, comprising all patients who reported no problems on any dimension. Patients undergoing varicose vein surgery have very different health characteristics compared with hip replacement patients. However, Figure 3 demonstrates that the distribution of their index scores also has the 2-groups-with-gaps pattern.
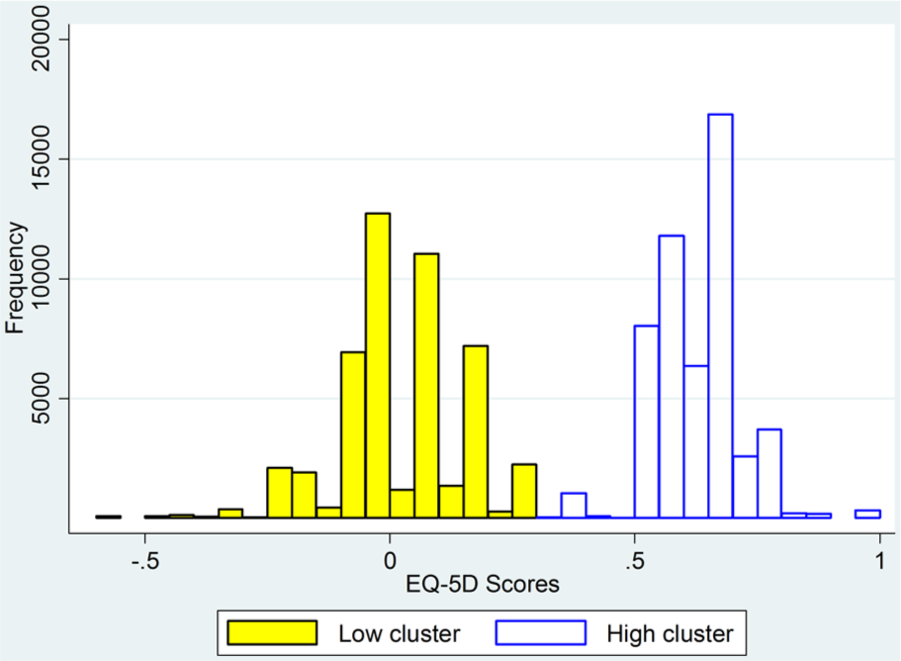
Distribution of presurgery EQ-5D index scores for hip replacement patients, using UK-weighted index.
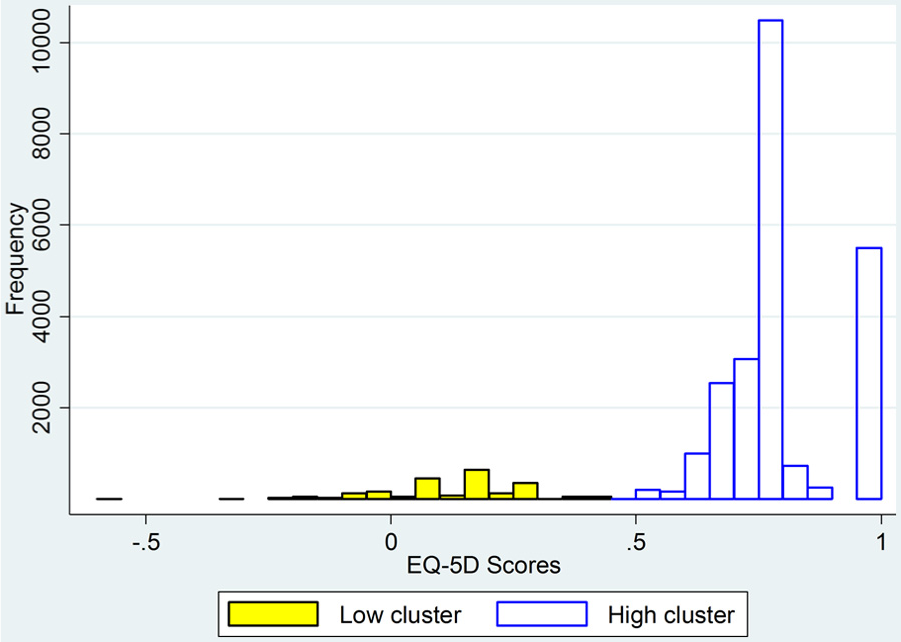
Distribution of presurgery EQ-5D index scores for varicose vein patients, using UK-weighted index.
We first identified more rigorously the 2 groups suggested by the histograms. Inspection of the hip replacement histogram suggests that they could be defined as being above or below 0.5. The kmeans procedure identifies a different divider, lying between 0.313 and 0.329. However, the 2 methods classify only 1180 of 99,447 observations differently. In Figures 2 and 3, the high and low clusters are those identified by the kmeans procedure.
The index scores shown in these distributions result from applying a specific set of weights to profiles. We next examined the possibility that the profiles themselves are a source of the observed clustering. If we look first at the different dimensions separately, Table 1 shows the percentage of responses in each level of each dimension. This suggests that responses do not vary across all 3 levels in any dimensions; that is, either 1 or 2 levels dominate. There is very little difference between patients about to receive hip surgery with respect to MO; they almost always record level 2 and very rarely record level 3. (One reason for this is that the EQ-5D-3L label for level 3 is “confined to bed,” so even patients with very severe mobility limitations will not choose level 3. 39 ) In each of the other dimensions, 2 levels dominate. For SC and AD these are levels 1 and 2, and for UA and PD they are levels 2 and 3. In each case, the less severe of the 2 levels has the largest numbers.
Percentage of Responses in Different Dimensions and Levels of the EQ-5D for Presurgery Hip Replacement Patients
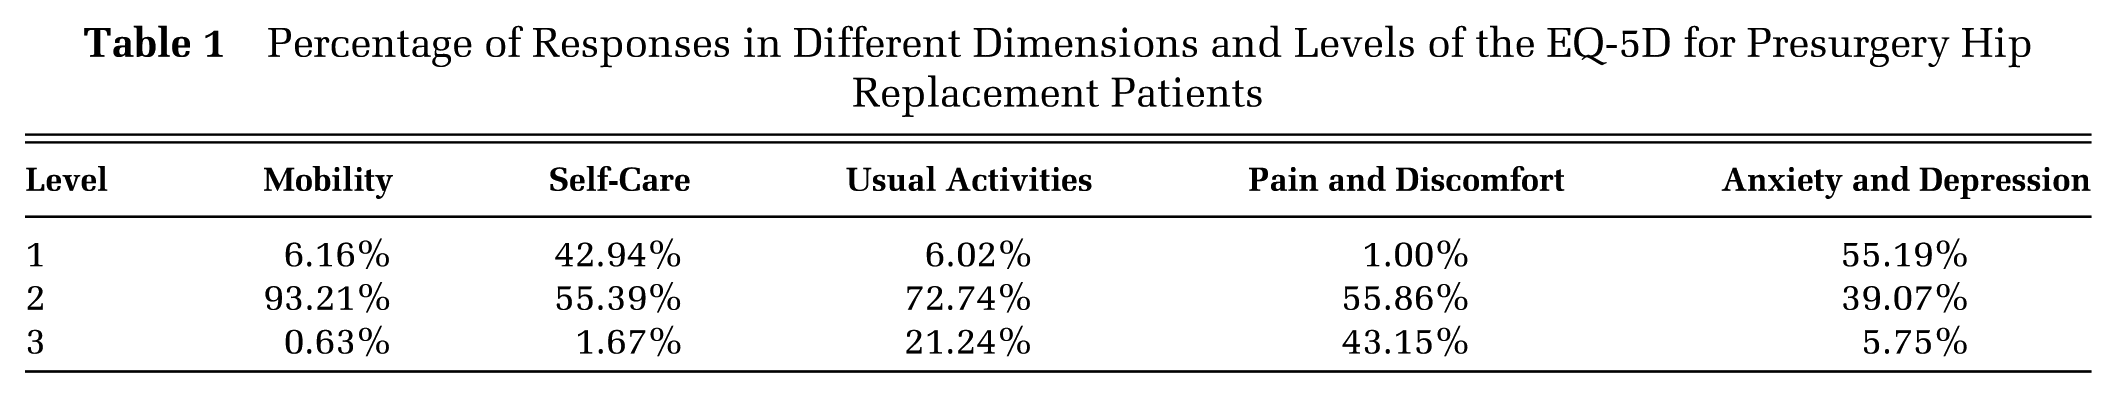
We can therefore rule out differences in mobility as a cause of the 2 groups observed in these data. We next examine the distribution of profiles to see whether the other dimensions are individually or in combination the cause, as in Table 2, which shows only the most frequently observed profiles. Between them, these 12 profiles account for 80% of all profiles in this data set. The 4 within the high cluster account for 81% of profiles in that cluster, and the 8 within the low cluster account for 79% of profiles in that cluster.
Distributions of the EQ-5D Profile for Presurgery Hip Replacement Patients within High and Low Clusters
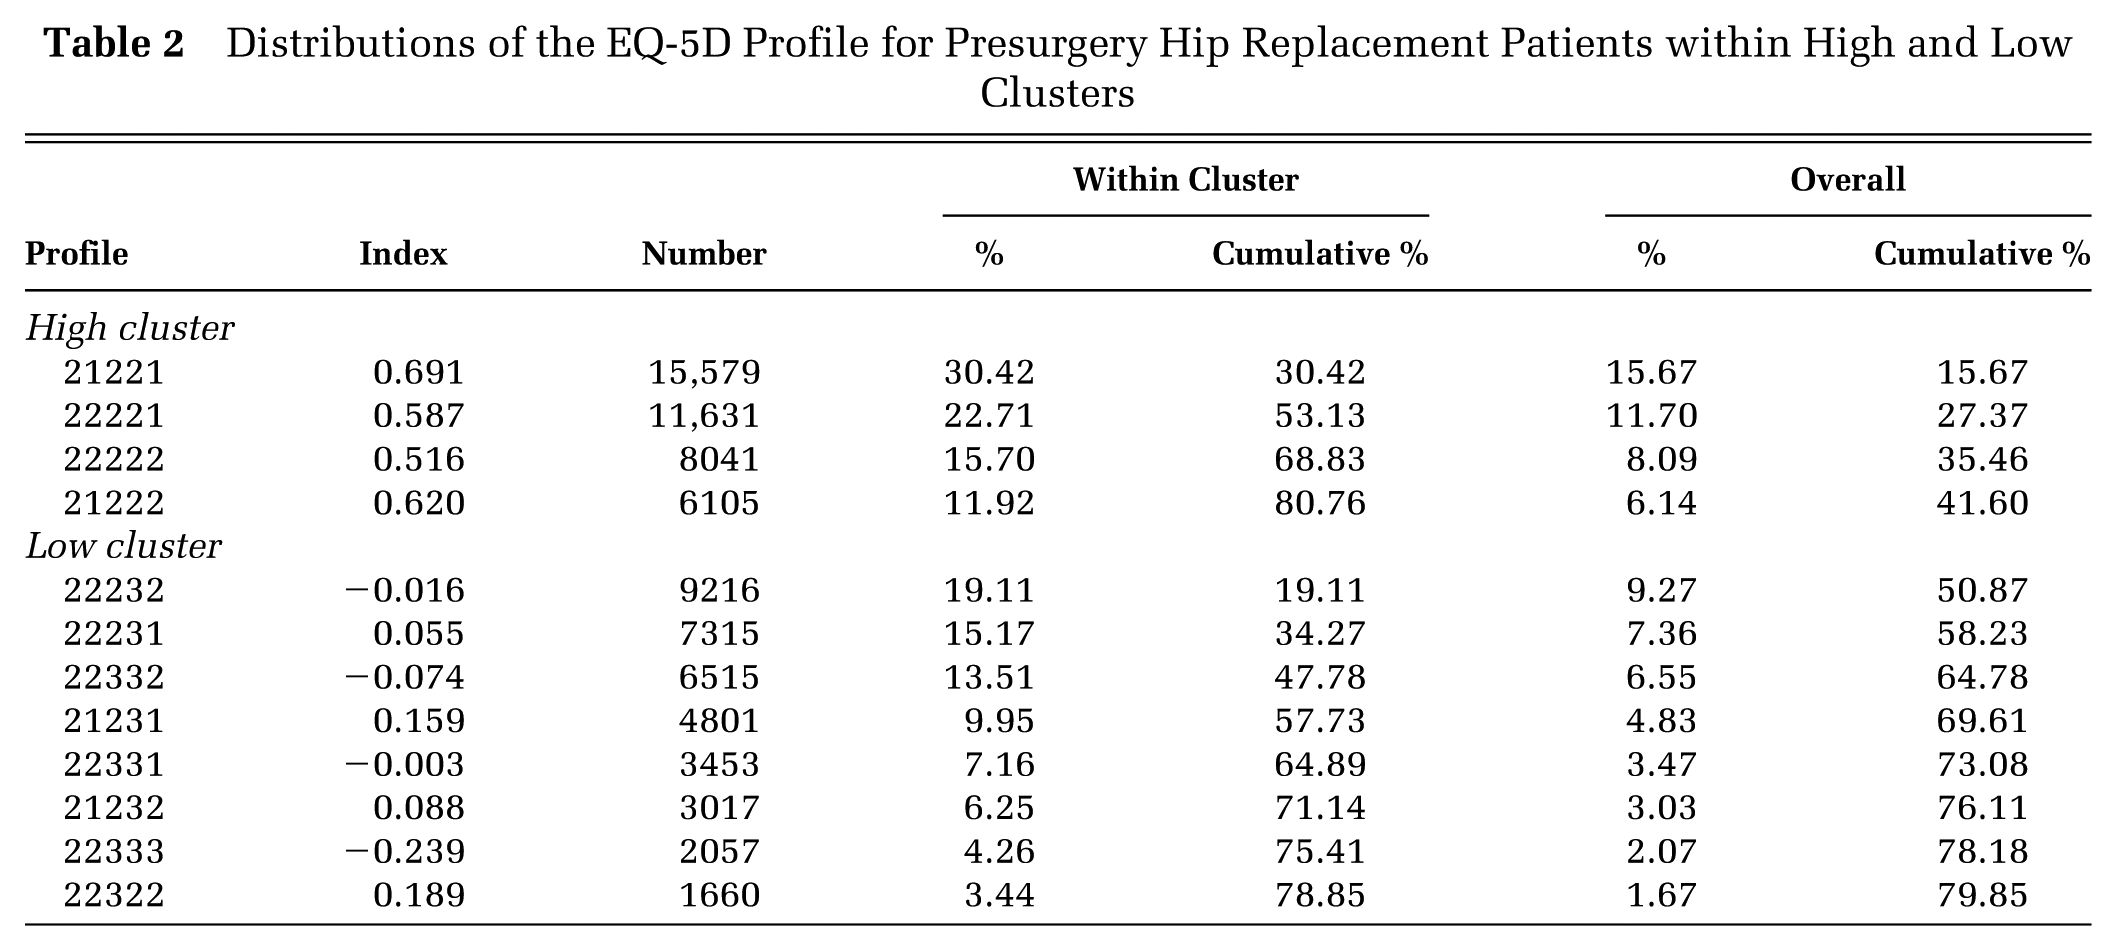
All 12 profiles have, as suggested by the earlier figures, MO = 2. The 4 main profiles in the high cluster all have UA = 2 and PD = 2. They are distinguished only by whether they have SC = 1 or 2 and AD = 1 or 2. The 8 profiles in the low cluster also appear in the 4 high-cluster profiles, but with PD = 3, UA = 3, or both.
The implication is that the difference between the 2 groups is simply in the dimensions of PD and UA—the low cluster includes people who experience more pain and discomfort and have more restrictions on their usual activities than those in the high cluster. There is a complicating factor, because the difference within these dimensions is between levels 2 and 3 rather than 1 and 2, and the presence of one or more level 3 gives additional decrements in scores within the UK value set. This is both because the differences between levels 2 and 3 in each dimension are greater than those between levels 1 and 2 and also because of the N3 term. The question remains whether it is the difference between the dimensions alone that generates the clusters or the fact that the low score cluster has more level 3 observations.
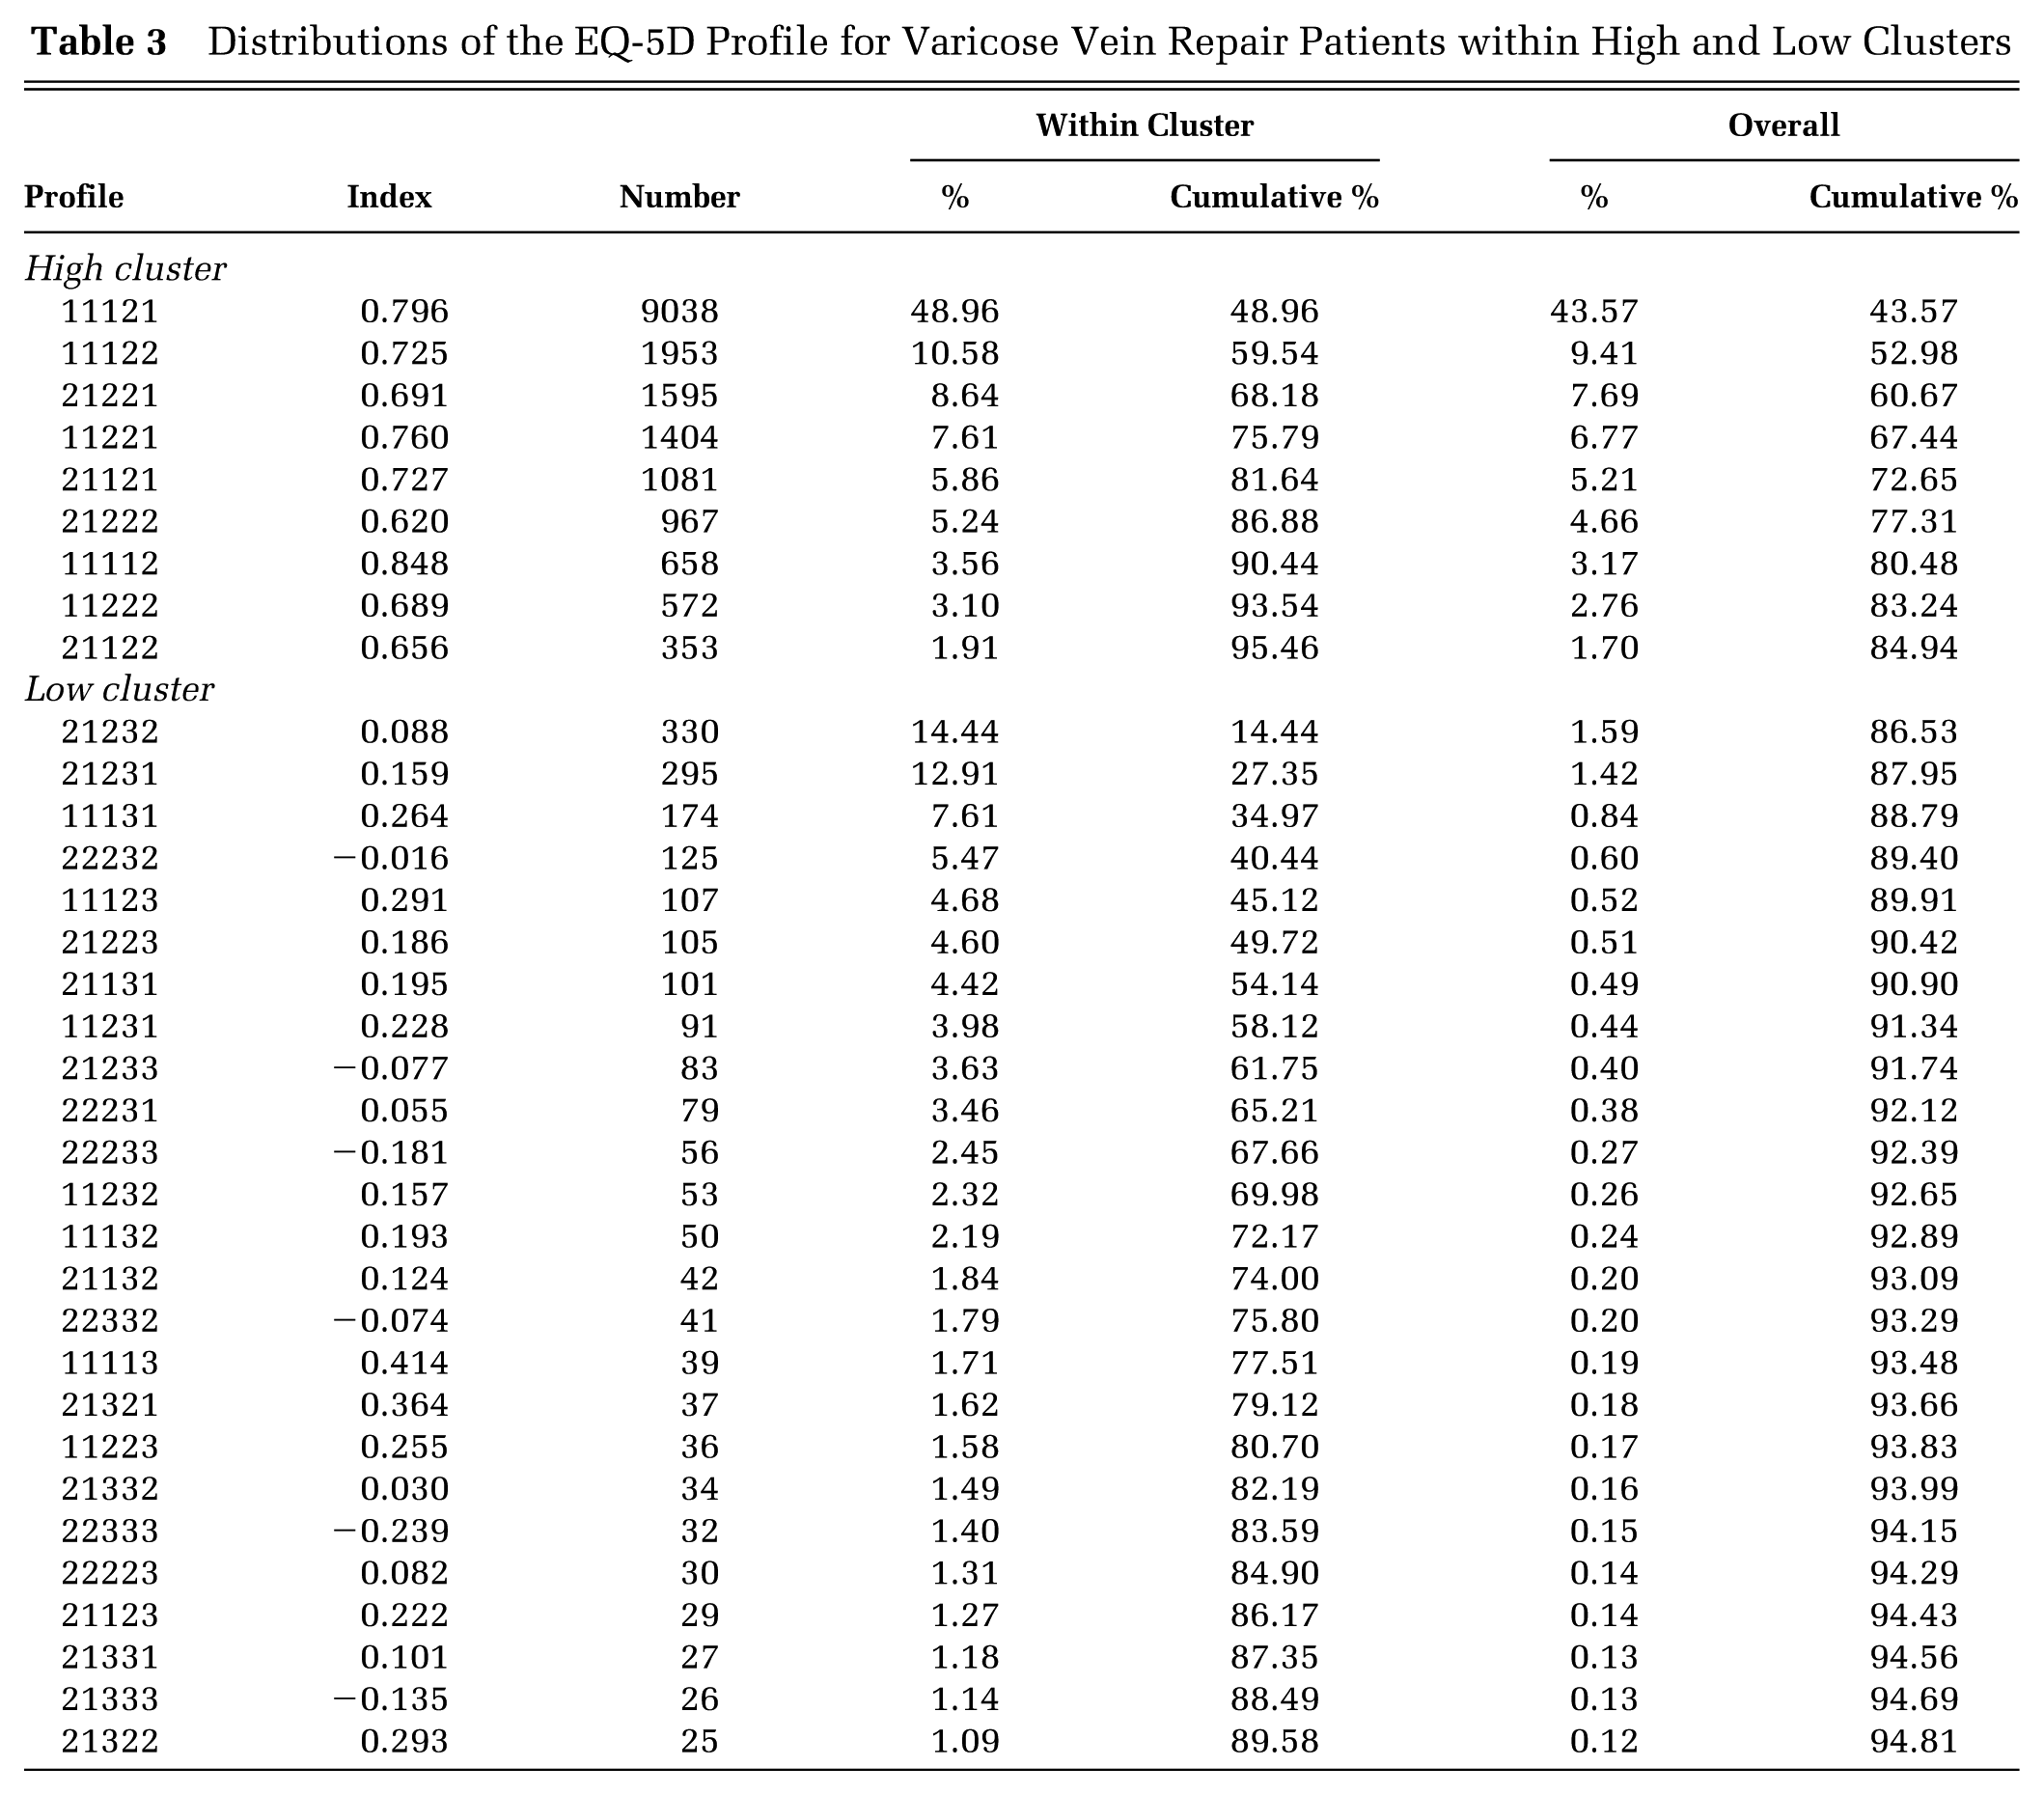
For varicose vein patients, the difference between the 2 groups is as clear. Almost all in both groups report SC = 1. Almost all patients in the high cluster report PD = 2 and do not have a level 3 in any dimension. Almost all of those in the low cluster report PD = 3, and a few report a level 3 in dimensions other than SC. Again, the fact that the difference is in level 3 is a complication. Table 3 shows the most frequent profiles, excluding 11111. One dominant profile, 11121, has nearly half of the high-cluster profiles, but otherwise there is much greater variation in frequently observed profiles within both high and low clusters, with 95% of high-cluster profiles covered by 9 profiles and 90% of low-cluster profiles covered by 24 profiles.
Distributions of the EQ-5D Profile for Varicose Vein Repair Patients within High and Low Clusters
We have therefore demonstrated that the classification system itself can generate clusters defined by dimensions and levels according to numbers of observations, at least for the data that we have analyzed. The next step is to investigate whether this is sufficient by itself to generate clusters defined by index scores and whether the relative size of the weights given to different levels and dimensions contributes to this.
One way to examine this is to change the weights and see whether the clustering apparent when the UK weights are used remains. For example, we could apply to the profile data different weights to those in the UK value set and see whether the same or different clusters are generated. Ideally, this would entirely remove the effect of weighting, but there is of course no such thing as a truly unweighted score and, as noted earlier, there is no neutral set of weights that can be used for this purpose. In the analysis of Figure 1, we applied equal weights for levels and dimensions to an artificial data set that by construction contained no clusters in levels and dimensions, demonstrating that a bimodal distribution of the UK-weighted index (in this case, bimodal is a better term than clusters) can arise without any such clusters. However, this process oversmooths the data into 11 categories that contain very different health profiles, giving a very weak test of the effect of specific weights on real data that contain real profile clusters. For example, applying this to hip replacement and varicose vein repair data generates distributions that have a single mode but are skewed; when ordered from worst to best, they are skewed positively for hips and negatively for varicose veins. A better alternative is to convert the set of weights into ranks. This retains the level of detail, in that every profile has an individual score, but removes the impact of size differences in the relative weighting of levels and dimensions, including removing the level 3 factor.
The result of this is shown in Figure 4 for hip replacement patients. In this figure, the ranks are transformed so that they have the same scale as the UK EQ-5D-3L index—this is simply to make direct visual comparisons easier and has no impact on the results. The division into 2 groups is less obvious, because of the wider spread of the data in the low cluster, but it does exist. The same result is obtained when the same procedure is applied to the varicose vein data.
Distribution of presurgery EQ-5D rank scores for hip replacement patients by cluster, using transformed ranking.
A possible conclusion is therefore as follows:
(a) The division into 2 groups can result from differences between clusters of patients identified by the EQ-5D-3L classification system in key dimensions of health.
(b) This distribution will be reinforced by the weighting system, which generates the large gap between the 2 groups in index scores.
A final question is whether the 2-group distribution reflects true differences in the health of a sample or is an artefact of the classification system. It is not possible to answer that question directly, but it is possible to explore it using additional data. The NHS PROMs program data also include condition-specific health state instruments—for hip replacements, the widely used and well-validated Oxford Hip Score (OHS). 40 The OHS is calculated from a 12-item questionnaire, each item having 5 possible response categories ranked from 0 (no problems) to 4 (most severe in that item). The score is obtained by summing the ranks over all items and therefore takes 1 of 49 values from 0 (most severe in every item) to 48 (no problems). Is the 2-group distribution apparent in OHS data?
Figure 5 shows a density distribution for the PROMs OHS data, which does not exhibit any clustering. It is unimodal with a positive skew. If the OHS is a more accurate measure of hip patients’ health status than the EQ-5D, this would imply that the EQ-5D clusters are indeed an artefact. However, if the OHS density distributions are calculated separately for the 2 EQ-5D clusters a different picture emerges, as shown in Figure 6 by a combined plot of these 2 distributions. Both distributions are unimodal; the high EQ-5D cluster group also has a positively skewed OHS distribution, but the low cluster has a symmetrical distribution. The overall OHS distribution may therefore be the sum of the overlapping distributions of 2 groups, 1 of which has worse health than the other. A Mann-Whitney test of the null hypothesis that the observations in the 2 clusters are drawn from the same distribution is rejected (z = −211.927, P < 0.00005). This evidence is therefore consistent with the possibility that the EQ-5D clusters identify genuinely separate groups of hip patients according to the severity of their condition.
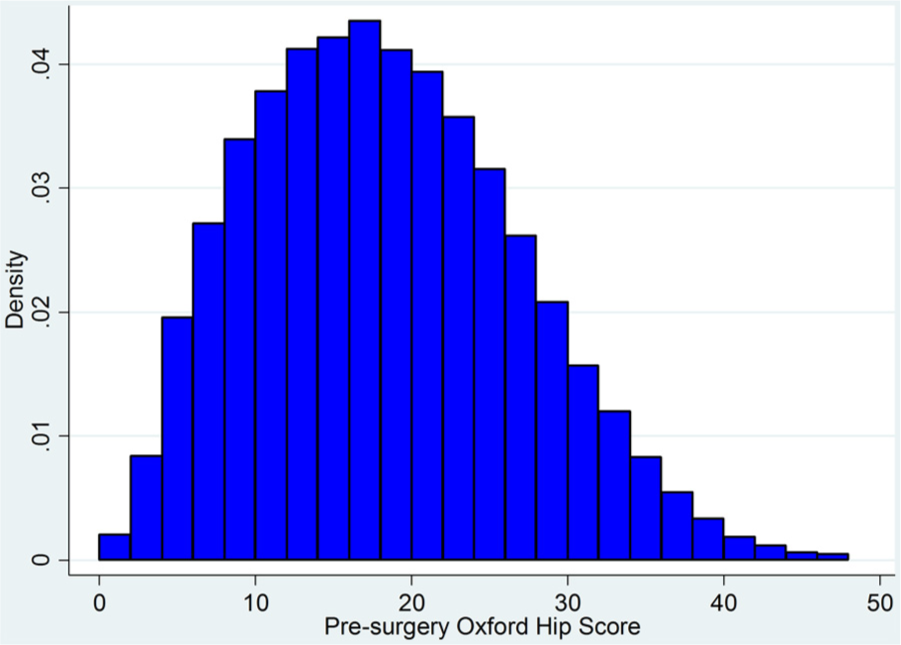
Distribution of presurgery Oxford Hip Score for hip replacement patients.
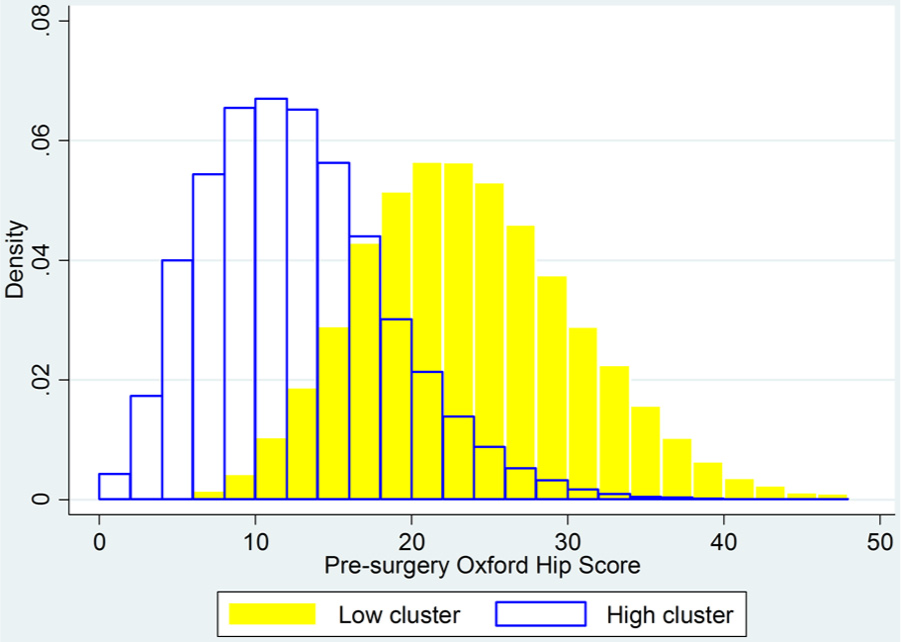
Distribution of presurgery Oxford Hip Score for hip replacement patients, identified by EQ-5D clusters.
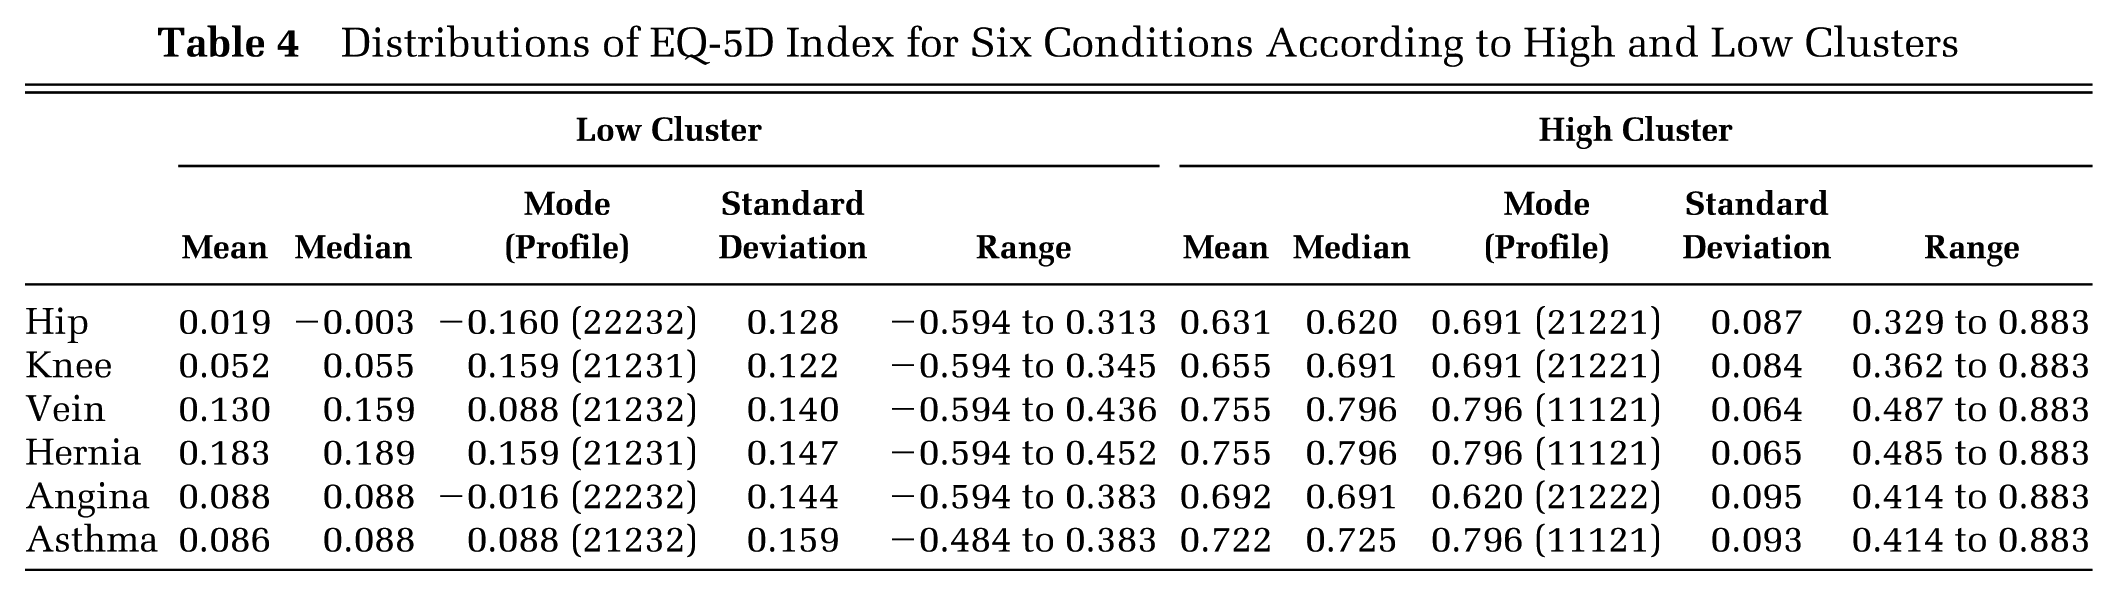
A conclusion is that better descriptions of EQ-5D-3L index distributions are required, which take account of what appears to be a natural tendency to form a 2-groups-and-gap pattern. Table 4 shows descriptive statistics for all 4 PROMs procedures and the 2 chronic conditions that we analyzed, using the kmeans clusters. The mode refers to the most frequently observed profile within the cluster and its associated index score. Such simple descriptive statistics give a far clearer picture of the distribution of EQ-5D-3L index scores than are usually reported. This table also demonstrates that the mode is not the key feature of the groups or the best descriptor of their distributions, suggesting that the label bimodal should not be used.
Distributions of EQ-5D Index for Six Conditions According to High and Low Clusters
To highlight further the contribution of weighting, we reanalyzed the NHS PROMs data, applying the value sets from different countries 41 using a standard algorithm. 42 The results of this analysis are in the online Appendix, which shows that the 2-groups-and-gap characteristic of EQ-5D-3L index distributions is not uniquely associated with the UK value set or with any technique for eliciting weights. However, the index scores that define the clusters differ between different value sets. This also emphasizes that for any given set of patients’ EQ-5D-3L data, the value set used to summarize profiles may strongly influence the results.
Discussion
Nonnormal distributions of index-weighted EQ-5D-3L data featuring 2 distinct groups of patients are commonly observed. This has implications for statistical analysis and modeling of those data. Our analysis suggests that this pattern is a result of the EQ-5D-3L classification system, which generates differences between patients with the same condition in respect of dimensions that are mainly observed at level 2 or 3. The weights commonly used to calculate the index exacerbate this grouping by placing a larger weight on level 3 observations, generating a noticeable gap in index scores between the groups.
A further factor is that in general, only a few of the 243 potential EQ-5D-3L profiles are observed with any great frequency. In a large and diverse data set, it was found that just 22 profiles covered 90% of all health states observed, and 161 were not found at all. 2 One reason is that profiles that contain very great differences in levels between dimensions are rarely observed: for example, profiles having four level 1 dimensions and one level 3. It is therefore reasonable that patients’ health states form groupings for particular conditions, since we are unlikely to observe extreme variations from a typical EQ-5D profile for a particular condition.
Our analysis was conducted on the EQ-5D-3L. A 5-level version is now available, the EQ-5D-5L, 43 and it will be important to examine whether similar issues apply to data that it generates, using methods similar to those used here.
One recommendation is that when one is analyzing EQ-5D data, it is very important and informative to examine profiles as well as index scores. As we have argued elsewhere,2,4 concentrating on the EQ-5D index in effect obscures useful information about health states and may even produce misleading information. In this case, we found that examining profiles enabled a better understanding of the distribution of index scores, which will be useful for those wishing to analyze those scores for comparison, inference, and mapping between different health measures.
We have examined the EQ-5D, but our analytical approach applies to any health status index that uses the weighted profile approach. This includes both generic and condition-specific measures and also indexes calculated without explicit weights, such as the OHS. It is arguable that a measure such as the OHS is far more wasteful of useful information than the EQ-5D index and that it positively obscures important differences between patients. There are potentially 244,140,625 (512) different OHS profiles; the OHS was not devised to be able to generate and analyze these, but they exist as a by-product of the way that the OHS is constructed. Its simple scoring system reduces this to 49 categories, involving a huge information loss. The vast majority of those profiles would never be observed, but it is likely that far more would be observed than 49 and that the differences between them would be of relevance in assessing patients’ health.
Footnotes
Acknowledgements
We thank Professor Alistair Gray and Professor Michael Drummond for helpful comments on earlier versions of this paper.
The first author’s contribution to this research was supported by the National Institute for Health Research (NIHR) Biomedical Research Centre based at Guy’s and St Thomas’ NHS Foundation Trust and King’s College London and by the NIHR Collaboration for Leadership in Applied Health Research and Care South London at King’s College Hospital NHS Foundation Trust. The views expressed are those of the authors and not necessarily those of the NHS, the NIHR, or the Department of Health.