
Abstract
When multiple parameters are estimated from the same synthesis model, it is likely that correlations will be induced between them. Network meta-analysis (mixed treatment comparisons) is one example where such correlations occur, along with meta-regression and syntheses involving multiple related outcomes. These correlations may affect the uncertainty in incremental net benefit when treatment options are compared in a probabilistic decision model, and it is therefore essential that methods are adopted that propagate the joint parameter uncertainty, including correlation structure, through the cost-effectiveness model. This tutorial paper sets out 4 generic approaches to evidence synthesis that are compatible with probabilistic cost-effectiveness analysis. The first is evidence synthesis by Bayesian posterior estimation and posterior sampling where other parameters of the cost-effectiveness model can be incorporated into the same software platform. Bayesian Markov chain Monte Carlo simulation methods with WinBUGS software are the most popular choice for this option. A second possibility is to conduct evidence synthesis by Bayesian posterior estimation and then export the posterior samples to another package where other parameters are generated and the cost-effectiveness model is evaluated. Frequentist methods of parameter estimation followed by forward Monte Carlo simulation from the maximum likelihood estimates and their variance-covariance matrix represent’a third approach. A fourth option is bootstrap resampling—a frequentist simulation approach to parameter uncertainty. This tutorial paper also provides guidance on how to identify situations in which no correlations exist and therefore simpler approaches can be adopted. Software suitable for transferring data between different packages, and software that provides a user-friendly interface for integrated software platforms, offering investigators a flexible way of examining alternative scenarios, are reviewed.
Keywords
Probabilistic methods in decision analysis were introduced in the 1980s. 1,2 Their defining feature is that they allow for a full expression of the uncertainty in model parameters. There are 2 main reasons for advocating probabilistic methods in decision making. The first is that they can provide a form of sensitivity analysis that allows investigators to easily see the joint impact of the uncertainty in multiple parameters on the expected costs and benefits and on decision uncertainty. For this reason, use of these methods is often called probabilistic sensitivity analysis. A second reason is that, faced with uncertainty in the vector/matrix of model parameters θ, decision makers should choose the decision option, D, that delivers the highest expected net benefit. In other words, the decision maker selects decision D*, such that

This “expectation” requires an integration of the net benefit function, NB(D,θ) over the joint distribution of parameters θ. There are a wide range of methods for achieving this integration, and the appropriate choice of method depends on the algebraic structure of the net benefit function.
It must be emphasized that the expected net benefit is not the same as the net benefit at the expected value of the parameters, except in the cases where net benefit is linear in all its parameters, and there are no correlations between parameters. This is relatively rare, for several reasons. First, most evidence synthesis is performed on log or logit scales, while the parameters of cost-effectiveness models tend to be probabilities on the natural scale. The transformation is a nonlinear one. Second, many cost-effectiveness analyses (CEAs) include Markov models. Here, the net benefit functions include terms in powers of transition probabilities, again introducing nonlinearity. Third, modern methods of evidence synthesis such as network meta-analysis, also known as mixed treatment comparisons, generate estimates of several treatment efficacy parameters from a common data set, in most cases inducing correlations between parameters. These correlations may have little or no bearing on the expected net benefit of each intervention option, but they will directly affect the uncertainty in incremental net benefits between interventions. Other synthesis techniques that estimate more than 1 parameter from a single data set also induce parameter correlation structures. Perhaps the most important are meta-regression, 3,4 multiple outcome synthesis, 5 –9 and bivariate meta-analysis. 10
It is therefore essential that software solutions are adopted which ensure that the complex uncertainty structure in parameter estimates is faithfully propagated through the decision model. 11 The main purpose of this paper is to provide guidance on the computational approaches that will deliver probabilistic cost-effectiveness analysis in any situation.
Not only is Monte Carlo (MC) simulation from the joint parameter distribution the simplest way to evaluate the expected net benefit, but for any form of model it also delivers other crucial tools of probabilistic CEA, such as plots of the cost-effectiveness plane, cost-effectiveness acceptability curves, and estimates of the probability that a decision is cost-effective. 12,13 MC simulation is also the easiest fully general approach to analysis of the expected value of information, 14 –16 unless the net benefit can be assumed to be normally distributed. 17 Probabilistic methods have been recommended in a range of leading textbooks and tutorial papers and are the preferred option for submissions to reimbursement agencies such as the National Institute for Health and Clinical Excellence (NICE) in the UK. 13 We therefore recommend MC simulation-based approaches for all analyses, even for strictly linear models.
We address the question of which computational approaches correctly preserve the properties of the evidence synthesis within a probabilistic CEA. No advice is given on the relative merits of cohort models compared with individual patient simulation or on how to choose the best model. This paper is restricted to providing guidance on how to implement the model of choice.
We set out 4 main generic options. These should be considered the “default” approaches as they will correctly propagate the uncertainty structure in the evidence synthesis in any situation. These include 2 uses of Bayesian Markov chain Monte Carlo (MCMC) methods and 2 frequentist methods, either (1) sampling from a multivariate distribution of the estimates and their variance-covariance (VCV) matrices or (2) bootstrapping. Some guidance is provided on how to identify situations in which there are no correlations and where simpler methods, and a wider range of software, can be adopted. This article provides a brief summary of software tools that can be used to help interface between different software, and it reviews some recent developments in user-friendly “front ends” to assist the integrated use of multiple software platforms. These offer ways in which investigators can conduct scenario analyses, not just with individual parameters but also with different data sets or different synthesis models, and quickly see the impact on cost-effectiveness results.
Methods to Incorporate Synthesis Results in Probabilistic Cost-effectiveness Analysis
There are several ways in which the results of the evidence synthesis can be incorporated into the probabilistic CEA. Table 1 summarizes the methods and the restrictions on their use.
Summary of Methods and Their Properties and Restrictions
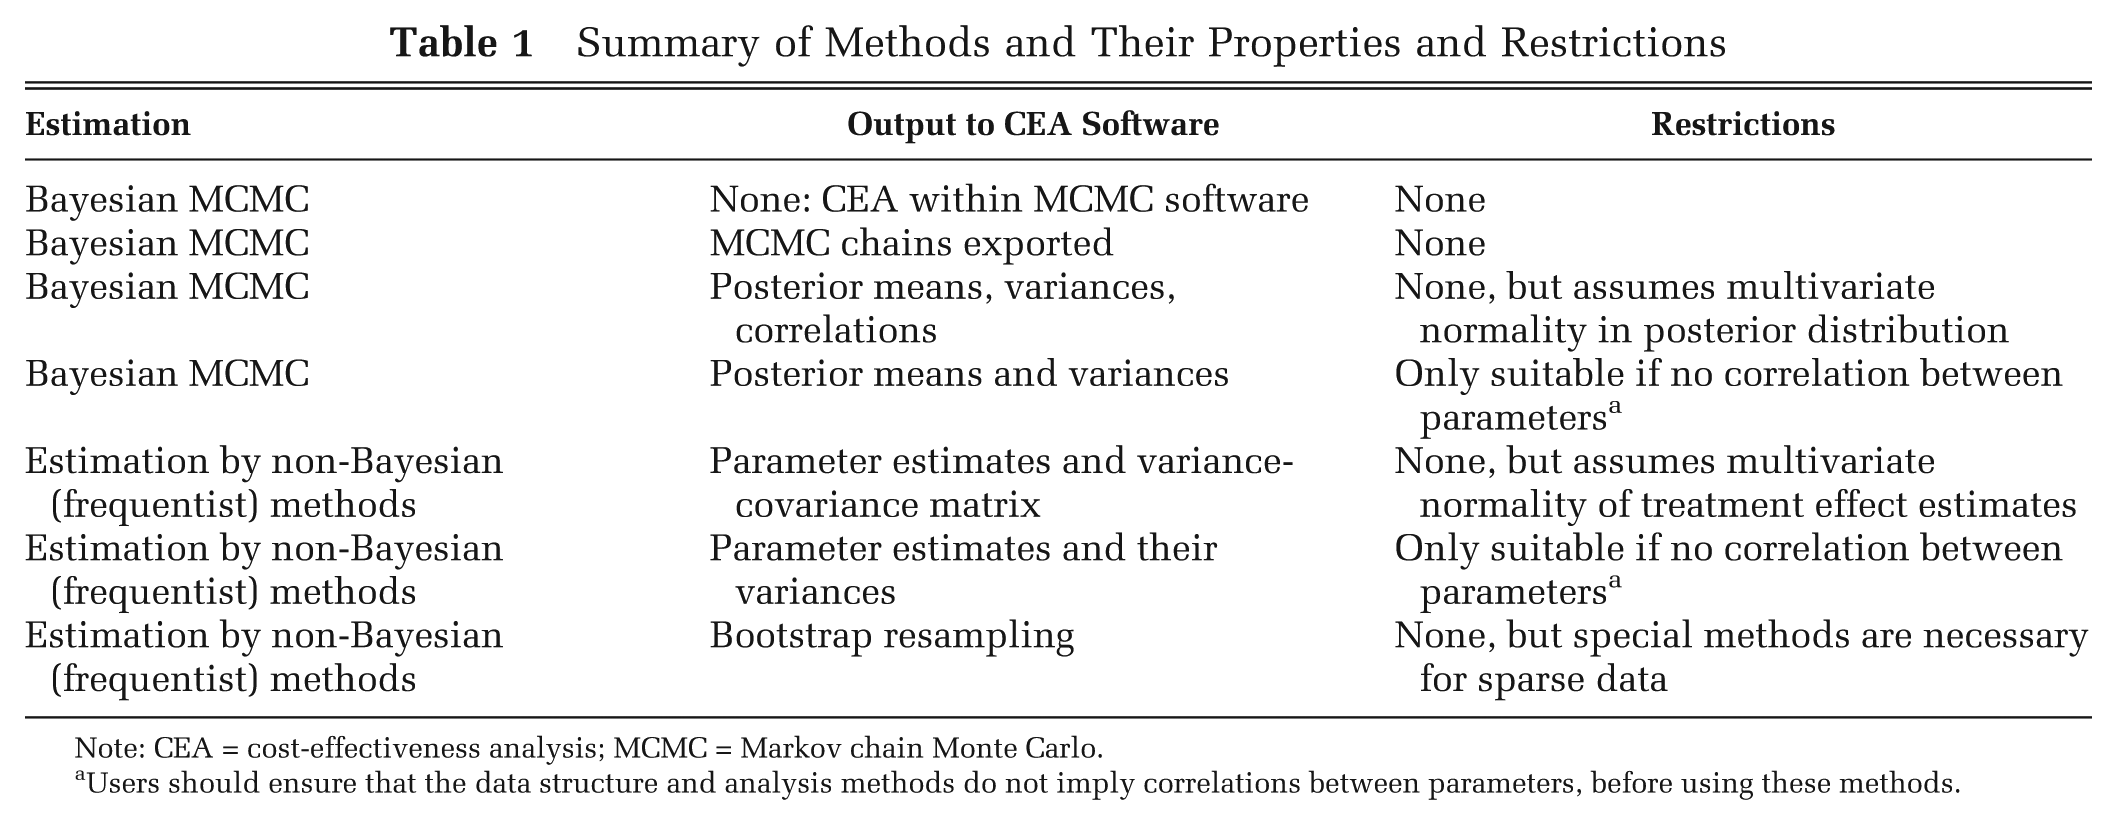
Note: CEA = cost-effectiveness analysis; MCMC = Markov chain Monte Carlo.
Users should ensure that the data structure and analysis methods do not imply correlations between parameters, before using these methods.
Bayesian Posterior Simulation: One-Stage Approach
When estimation of the synthesis parameters is via sampling from a Bayesian posterior distribution of the relevant parameters, this can be integrated with the CEA as a single process within a single programming package, in what has been referred to as “comprehensive decision analysis.” 18 –20
Bayesian MCMC simulation, 21 using WinBUGS, 22 OpenBUGS, 23 or other MCMC packages, provides the obvious example. The advantage of this approach is that it not only estimates a Bayesian posterior distribution but also is simulation-based, so that its outputs are perfectly compatible with the MC sampling approach that has become the standard modeling method in so many areas of science. Samples from the joint posterior distribution can be put directly through the decision analysis, so that net benefit and other outputs can be evaluated for each set of’parameter samples, without requirements for assumptions about its distributional form. Distributions of additional parameters and costs can be readily incorporated.
Development of MCMC algorithms and sampling schemes is a specialized area of research. Although users need not have a detailed knowledge of the precise working of MCMC software, a good understanding of the fundamentals of Bayesian data analysis is essential. For completeness it is worth mentioning that a broad range of non-MCMC simulation-based Bayesian updating schemes have also been proposed, including the sample importance resampling algorithm, 24 Bayesian melding, 25,26 and Bayesian Monte Carlo. 27 All these have the same properties as Bayesian MCMC in that they all feature both Bayesian estimation and sampling from joint posterior distributions. The latter 2 were specifically designed for evidence synthesis.
Bayesian Posterior Simulation: Two-Stage Approach
If investigators have preferred software for CEA, either general software packages such as R, STATA, or SAS or spreadsheet or decision tree packages such as EXCEL or TreeAGE, a further option is to take the posterior samples from the Bayesian MCMC, or other posterior sampling scheme, and use them as input to the CEA package. This has the same technical properties as the Bayesian 1-stage approach since the full posterior distribution is preserved. From WinBUGS, the CODA output, which lists all values generated from the full posterior distribution, can be exported into a spreadsheet-based program such as EXCEL, using BUS–BUGS Utility for Spreadsheets. 28 When the CODA output is used, it is important that the correlations in the parameter estimates are preserved. This is done by ensuring that all parameter values are sampled from the same MCMC iteration. If the CODA output is stored as separate columns for each parameter with iteration values along the rows, this would correspond to sampling all the parameter values in 1 row, each time. The CODA output can also be converted to the freely available statistical software R 29 for convergence diagnostics, further analysis, and plotting using add-on packages such as BOA–Bayesian Output Analysis Program 30 or CODA–Convergence Diagnostics and Output Analysis. 31
A potential advantage of a 2-stage approach arises in cases where there is substantial autocorrelation between successive MCMC samples. This can arise in many situations but usually depends on the statistical model, the way it is parameterized, and sparseness of the data. The effect of high levels of autocorrelation is to increase the degree of Monte Carlo error, with the result that it may require hundreds of thousands, rather than tens of thousands, of simulations before stable estimates are obtained. A common practice in decision modeling has been to “thin” the posterior sampling. For example, rather than store every posterior sample from the MCMC process, one might store every tenth or every twentieth. This will usually be enough to reduce autocorrelation substantially, so that the decision model can be run with, say, 25,000 samples from a thinned chain rather than with the 500,000 original samples. This is particularly relevant for computationally expensive models.
Frequentist Estimation with Monte Carlo Sampling
If evidence synthesis can be performed using frequentist software (which may use a variety of methods of estimation, including methods of moments, iterative weighted least-squares, or (restricted) maximum likelihood [(RE)ML]), a 2-stage approach is also possible. The first step is estimation, which produces parameter estimates and their VCV matrix. In the second step, these are used to populate a multivariate normal distribution that can be used for forward MC sampling (in the same or in a different package) along with the other CEA parameters.
A wide range of frequentist approaches to pair-wise meta-analysis exist (see below). However, of particular significance in CEA are the recently published modules in STATA and R that are capable to estimating more complex models. mvmeta 9 is a STATA routine that fits the same kinds of network meta-analysis and indirect comparison models that are described in the Bayesian literature 32,33 as well as fitting multiple outcome models. A similar module has been written in R, 34 although in its current form this is a network extension of “bivariate” meta-analysis 10 in which the true absolute (baseline) effects and relative treatment effects in each trial are drawn from a bivariate normal distribution. This is a slightly different model from the unrelated baselines models recommended in the decision-making literature. 32,33 However, it is perfectly feasible to program unrelated baseline network meta-analysis software in R, SAS, or any other platform.
In many cases, the use of frequentist estimates and their VCV matrix with RE models is likely to produce parameter distributions with a little less uncertainty, because Bayesian methods take uncertainty in variance parameters into account. The extent of the difference is unlikely to be critical, although investigators should always be sure that posterior distributions of variance parameters are sensible. Similarly, the existing frequentist approaches are all based on normal approximations to likelihoods for count data. This can lead to difficulties with sparse data, and especially with zero cells. 32,35
Frequentist Estimation with Bootstrapping
The final option of estimation and then bootstrapping 36 has been used from time to time in CEA. 37 In its original form, bootstrapping is a technique in which one generates a series of “new” data sets by repeatedly resampling with replacement from the original data, each time producing a new set of parameters estimates. This stream of estimates can then be treated in the same way as samples from a Bayesian posterior distribution. However, this procedure is not always straightforward, particularly with small sample sizes and zero cells.
Nonetheless, a very wide range of variant bootstrap procedures are available that can mitigate these and other problems. In the parametric bootstrap, for example, a model is fitted to the data by maximum likelihood and is then used to generate a series of data sets with the same size and structure as the original. The analysis procedure is applied to each of these data sets to generate a stream of parameter values. Data analysis based on resampling is a rich area with an extensive literature. Readers are referred to other texts for further information. 36,38,39
Simpler Approaches and When to Use Them
When single efficacy parameters are of interest, such as in simple pair-wise meta-analysis, and each parameter in the CEA is sourced from a distinct and independent source, simpler approaches may be adopted. There are no correlations between parameters and therefore no VCV matrix. The computing task in this case is exactly the same as described in the 2-stage frequentist approach described above, but because the synthesis task is substantially less complex, a far wider range of software is available to carry it out. An estimate of the relative treatment effect and its variance can be found by either using specific meta-analysis software or implementing meta-analysis routines in standard statistical software packages. The effect measure and its variance can, in a second stage, be used to populate a distribution for the appropriate parameter in any software suitable for probabilistic decision analysis.
A systematic and comprehensive review of all software options capable of evidence synthesis is beyond the scope of this paper, but noteworthy options are described below and more detailed reviews and comparisons are available elsewhere. 40 –43
Numerous stand-alone meta-analysis packages have been developed over the years, but the following probably include the most extensive and up-to-date feature sets:
Comprehensive meta-analysis (commercial) 44
Meta-Analyst (free) 43
MIX, 45 which is an add-on to EXCEL (commercial and free versions available)
RevMan, 46 which is the official software of the Cochrane Collaboration (free)
EXCEL (commercial), with which simple meta-analysis can be carried out with a small amount of programming
In addition, although it would be possible to program most standard meta-analysis models in any reasonably powerful general statistics package, probably the most extensive freely available software routines that allow meta-analysis to be conducted and numerous graphical outputs to be produced are available for STATA 47 and for R, such as the meta 48 and rmeta 49 packages.
Indirect comparisons represent another evidence structure that does not induce correlations between efficacy parameters. 33,50 Here again, separate syntheses can be carried out for trials comparing treatments A and B and trials comparing treatments A and C. Then the estimates obtained and their variances can be entered into the simulation package used for CEA, and the relative cost-effectiveness of A, B, and C can be readily determined because covariances are not involved. Although this is an acceptable approach in principle, the Bayesian MCMC approach to indirect comparisons 32,33 may be preferable in cases in which 1 or more of the pair-wise comparisons is represented by a very small number of trials. This is because MCMC has the flexibility to allow “shared variance” random effects (RE) models, 32 whereas with existing frequentist methods it may be necessary to have some estimates from random and others from fixed-effects models, which not only is a less natural solution but also runs counter to the mathematical relationships between variances that must hold in models in which all relative treatment effects are internally consistent. 51 There is, however, nothing to prevent shared variance models being programmed in frequentist packages.
It is worth noting for completeness that certain extensions of pair-wise or network meta-analysis will induce correlations, and in these cases it would be prudent to use 1 of the 4 fully general methods above. One of these is meta-regression 52 in which the size of the relative effect depends on a covariate. 4,53 This is essentially a model with terms for intercept and slope where these parameters will be correlated unless the model is parameterized to make them orthogonal. Another extension concerns multiple outcomes. Very frequently, different trials report different outcomes, or different combinations of outcomes, at different times or combinations of times, in different ways or combinations of ways. Elsewhere 54,55 we have advocated the use of methods that effectively model the relationships between the outcomes, in order to strengthen inference on the treatment effects. 5,56 –58 This invariably induces correlations between outcome parameters and between outcome and treatment effect estimates. Similarly, synthesis methods based on the bivariate meta-analysis model 10 inevitably generate correlations between treatment and control success rates.
The correlations induced by meta-regression or by’multiple outcome synthesis will usually have less impact on incremental net-benefit than the between-treatment effect correlations induced by network meta-analysis or by the bivariate model for meta-analysis. They will, however, affect joint parameter uncertainty in other, and possibly complex, ways, and it is prudent to use 1 of the 4 generic approaches to propagating the joint parameter uncertainty into the CEA model.
Use of Multiple Software Platforms
In recent years, interfaces have become available that let different software applications communicate with each other. These facilities allow for the integration of the components of a CEA that may have been conducted in different packages. The motivations and advantages of an integrated approach across software applications are potentially multifaceted. First, such an approach allows multidisciplinary teams who have different software skills and preferences to produce an integrated analysis. For example, statisticians may wish to use general statistical software, whereas decision modelers may wish to use EXCEL or specific decision modeling software. This approach also allows the best software for each component of the analysis to be used, therefore producing an “optimal” mix. For example, if a network meta-analysis is required, WinBUGS may be the best software to use, but it has limited graphical capabilities. Therefore, it may be desirable to present the results of the synthesis in a package with advanced graphical capability such as R. Furthermore, the original data set may have been prepared in spreadsheet software such as EXCEL. Although use of multiple pieces of software to conduct different components of the analysis is common historically, few have been integrated. Once a model has been set up within an integrated system, it is, of course, particularly easy to update.
This approach is also useful when updating a model that has already been constructed in a particular software: If, for example, the CEA is already set up in Excel but a new evidence synthesis needs to be carried out in R or WinBUGS, the packages can be made to communicate directly, facilitating the analysis and any future updates.
Communication Between Software Packages
The simplest form of communication between software packages is to allow the transfer of data between them. To facilitate communication, transparency, and future data updates, it is good practice to keep all data collected for the analysis, including all annotations and details of any corrections, in a single file, for example, an EXCEL workbook with multiple worksheets. If the analysis is to be carried out in WinBUGS, data columns can be copied directly from spreadsheet software into WinBUGS and pasted by selecting Paste Special from the WinBUGS Edit menu and choosing the Plain text option. Alternatively, XL2BUGS 59 is an EXCEL add-in that converts EXCEL data into WinBUGS vector format, and BAUW 60 converts data in text format into WinBUGS vector or matrix format.
If data are stored in R, R2WinBUGS 61 can be used to convert R objects into WinBUGS list data using the bugs.data function.
See http://www.mrc-bsu.cam.ac.uk/bugs/winbugs/remote14.shtml for details on software capable of communicating with WinBUGS.
Integrated Use of Software Platforms
Integrated platforms reduce the need to copy data and intermediate results from one screen/system to another and thereby reduce the risk of transcription errors. Further advantages of integrating the analysis (which also exist if the Bayesian 1-stage approach is conducted, since in that approach the analysis is integrated by definition) include facilitating the modification and updating of any aspect of the analysis, conducting sensitivity analyses, and, more generally, promoting transparency. For example, if a new trial is reported that is to be added to the evidence synthesis, then in an integrated approach the CEA would automatically be updated. This goes some way to ensuring that the appropriate uncertainty is propagated through to the decision model. Different software can be used to fully integrate data input, analysis, and the display of results using multiple packages, into a single step. If part of this integrated approach is the inclusion of a user-friendly interface, this can also make the exploration of the synthesis and CEA accessible to nontechnical experts, including clinical experts and even decision makers themselves, allowing them to interrogate the analysis. To this end, a Transparent Interactive Decision Interrogator (TIDI), 62 which integrated syntheses conducted in WinBUGS with graphical displays and the decision model conducted in R and a “point and click” interface in EXCEL, was developed for a recent Single Technology Appraisal at NICE. This pilot “proof of concept” initiative allowed members of the appraisal committee to request reruns of the CEA using alternative parameter distributions and synthesis models in real time in the committee meetings. 62
Several (freely available) code routines have been developed for commonly used packages in health technology assessment that allow them to communicate with other packages, and these can be used in the’creation of integrated analyses. For example, RExcel, 63 an add-on to EXCEL, provides communication between EXCEL and R, and R2WinBUGS is one of several packages that allow the user to control WinBUGS through R. Thus, if both of these linking packages are used in combination, then WinBUGS can be controlled through EXCEL (via R), and a Visual Basic interface can be written in EXCEL to facilitate this (which is the software setup used in the TIDI project described above). Similar control of WinBUGS through STATA 64 and several other packages is also possible, as is the embedding of OpenBUGS in R through rbugs 65 and the linking of many other packages to each other.
Discussion
A number of previous authors have discussed the’role of parameter uncertainty in CEA and the’need for methods that appropriately propagate parameter uncertainty through the model to the decision. 12,16,18 –20 This tutorial paper reviews the implications for choice of computational approaches in the context of evidence synthesis. Our general conclusion is that where the synthesis involves a network meta-analysis, or other methods that induce parameter correlations, Bayesian MCMC methods of synthesis are likely to be the most convenient because the full joint posterior uncertainty in parameters can be easily propagated through the decision model in a single step. However, frequentist solutions are also available.
We recommend that where multiple software platforms are used, for example, to store data, to carry out the synthesis, and to run CEAs, an integrated approach is taken, where the different platforms communicate with each other. This will avoid transcription errors and allow for easy and immediate update of results. User-friendly front-ends on integrated platforms give decision makers the ability to interrogate models more easily.
Footnotes
Acknowledgements
The authors thank Jenny Dunn at NICE DSU and Rachael Fleurence, Jeroen Jansen, Alec Miners, Jaime Peters, Mike Spencer, and the team at NICE, led by Gabriel Rogers, for reviewing earlier versions of this paper.
from School of Social and Community Medicine, University of Bristol, Bristol, UK (SD, NJW, AEA); and Department of Health Sciences, University of Leicester, Leicester, UK (AJS). This paper was based on Technical Support Document No 6, available from ![]() , which was prepared with funding from the National Institute for Health and Clinical Excellence (NICE) through its Decision Support Unit. The views expressed in this document, and any errors or omissions, are of the authors only. Alex Sutton has received financial reimbursement when working as an advisor on the development of the Comprehensive Meta-Analysis software package.
, which was prepared with funding from the National Institute for Health and Clinical Excellence (NICE) through its Decision Support Unit. The views expressed in this document, and any errors or omissions, are of the authors only. Alex Sutton has received financial reimbursement when working as an advisor on the development of the Comprehensive Meta-Analysis software package.