
Abstract
Keywords
Recent years have seen a growing trend to measure and publish hospital data on health outcomes to facilitate patient choice and increase provider accountability. 1,2 The focus of these activities has been on measures of mortality, readmission, or adverse events, which are easily derived from clinical records but reveal little about the health of the vast majority of patients. To allow for a more sensitive assessment of hospital performance, it is necessary to move away from a focus on relatively rare “failure” outcomes toward more comprehensive and sensitive measures of patients’ health outcomes. 3 –5
Since April 2009, all providers of publicly funded inpatient care in the English National Health Service (NHS) have been required to collect both EQ-5D 6 and condition-specific data for 4 elective procedures: unilateral hip and knee replacements, varicose vein surgery, and groin hernia repairs. 7 Eligible patients are invited to report their health status before and 3 or 6 months after surgery. The changes in patients’ health status are expected to “provide an indication of the outcomes or quality of care delivered to NHS patients”7(p5) and can be analyzed to identify systematic variation across hospital providers with finer granularity than previously possible.
Traditionally, patient-reported outcome (PRO) measures have been collected and analyzed primarily within clinical trials to assess the treatment effect on patients’ health. Their application in the context of routine performance assessment on a national scale breaks new ground and requires an appropriate methodology that takes into account the characteristics of the data and their intended use as measures of the relative quality of hospital treatment. 8
The NHS Information Centre has developed a preliminary risk-adjustment methodology that is currently being applied to the PRO data. 9 For the EQ-5D, this involves transforming the patients’ EQ-5D health profiles into utility-weighted index scores and estimating multivariate regression models to relate posttreatment utility scores to the pretreatment scores and case-mix controls. The advantage of this approach is that patient health is expressed in terms of a (quasi-)continuous score, which facilitates statistical analysis and allows for ranking of hospitals with respect to a single performance metric: their ability to influence posttreatment utilities or, equivalently, changes in scores over time. However, for the purposes of performance measurement, identifying best practice, and informing patient choice, the costs of aggregation may outweigh the benefits. We build this argument around 3 points.
First, any form of aggregation causes loss of detail and information. 10 Once constructed, an index measure cannot reveal information about the underlying components and the degree to which hospitals affect these. Certain hospitals may perform well on one EQ-5D dimension but fall short on another. Detailed information on the performance on each dimension can help to identify the source of the problem and foster improvement through adoption of best practice. 10
Second, the use of an aggregation function introduces exogenous variation that can bias statistical inference and raises normative concerns about whose preferences the weights should reflect. 10,11 In some circumstances, one may be willing to accept the weights underpinning the aggregation function, for example, when conducting economic evaluations of health technologies from a societal perspective. 12 But this is not always justified. The use of aggregate outcome data to inform patient choice raises normative concerns because it imposes a common valuation of health dimensions. In fact, reporting relative hospital performance with respect to risk-adjusted postoperative EQ-5D utility is only justified if all (prospective) patients share the same relative values. But patients may be heterogeneous with respect to their relative valuations of health dimensions or their relative valuations may differ from those of the general public. 13,14 If so, analyzing variation on the level of health dimensions is more appropriate as it allows patients to apply their own values when interpreting performance data.
Third, the use of performance data derived from EQ-5D utility scores may be limited by patients’ difficulties in interpreting these quantities. In a recent qualitative study, Hildon and colleagues 15 interviewed patients and clinicians about their views on 4 different metrics of hospital PRO performance, including mean follow-up score, mean change in score, proportion reaching a specified threshold at follow-up, and proportion reaching a minimally important difference. Their results suggest that “for patients . . . , unlike measures of height or weight, PRO . . . scores are unfamiliar and their values have no immediate meaning. It’s therefore necessary to transform them into interpretable forms, or indeed into experiences rather than metrics, to make them useful.”15(p11) Furthermore, patients “could not distinguish between the four [metrics], but liked a percentage, or what was for them intuitive scaling.”15(p10) Analyzing responses on EQ-5D dimensions rather than utility scores allows reporting performance in a similar form to the way that the data were originally collected. Hospitals could then be compared with respect to the risk-adjusted probability of a given patient to report, for example, no problems with mobility or pain/discomfort at follow-up.
To explore these claims, we assess hospital performance with respect to self-reported health outcomes for hip replacement patients. We focus on the EQ-5D and develop a multilevel risk-adjustment model for each of the 5 functional dimensions. Our approach draws on the literature on longitudinal modeling 16,17 and on cost-effectiveness in multicenter trials 18 to analyze variation in treatment impact across hospitals. More specifically, we model the hospital-specific contribution to posttreatment EQ-5D response as a random coefficient that varies between hospitals. The empirical Bayes (EB) estimates of this coefficient are then interpreted as capturing relative hospital quality. We assess the correlation between performance assessments on the level of EQ-5D dimensions and aggregated utility scores.
Methods
Data
Our study exploits EQ-5D data routinely collected from English patients who had a hip replacement during April 2009 to March 2010. All providers of NHS-funded care are required to participate in the survey. 7 This includes all NHS-operated hospitals and private treatment centers. Patients 15 years or older who undergo elective, unilateral hip replacement surgery are invited to take part in the survey. 19 We extract information on each patient’s pre- and postoperative EQ-5D health profile and EQ-5D utility score, in which the latter is calculated using the UK time tradeoff (TTO) utility weights. 20 The pretreatment (baseline) survey is collected either during the initial outpatient appointment that precedes hospital admission or at the day of admission. Follow-up data are collected by the NHS Information Centre via postal survey approximately 6 month after surgery. To ensure consistency with respect to the timing of measurements while retaining as much information as possible, we exclude all observations for which the recorded time between baseline survey and admission exceeds 12 weeks or the follow-up period is either shorter than 20 weeks or longer than 1 year.
We link these data to the Hospital Episode Statistics (HES) inpatient database, which contains detailed information on all inpatient care provided in English hospitals. The depth of information contained in HES allows us to account for a wide range of clinical and demographic risk factors. These include the most frequent main diagnoses (e.g., osteoarthritis, rheumatoid arthritis), 21 the weighted Charlson score of comorbidities, 22 –24 the number of additionally coded comorbidities, whether it was a primary or revision surgery and whether the revision was due to problems with the existing implant, patient age, sex, and the deprivation profile of the patient’s neighborhood of residence. 25 –27 We only retain patient records that can be matched to the PRO survey and for which we observe a full EQ-5D profile at baseline and follow-up.
Statistical Modeling
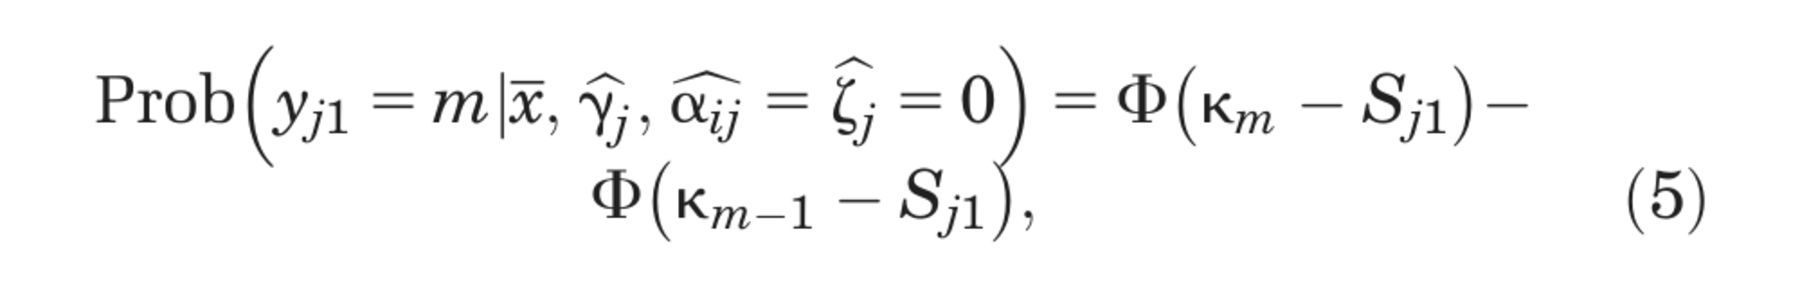
The objective of the empirical analysis is to obtain estimates of the relative systematic impact of hospital providers on patients’ posttreatment health outcomes. We estimate hierarchical ordered probit models 28 –30 separately for each of the 5 EQ-5D dimensions. We then compare the results with those obtained from a linear regression on the EQ-5D utility scores to study the practical implications of using disaggregated health dimensions for assessment of hospital performance.
Let

where the threshold parameters
Each patient provides measures of his or her health status pre- and posttreatment. Both responses are outcomes of the same measurement process as well as being (partly) determined by common factors, such as patient characteristics and baseline level of latent health. Our interest lies in the latent health gain that follows from hospital treatment and the degree to which variation in health gain can be systematically associated with the provider of care. We make the assumption that, conditional on baseline health and a set of risk factors, patients do not select into hospitals based on unobservable characteristics and that the health of patients in different hospitals would follow the same trajectory if untreated. This allows us to interpret the variation in latent health gain across hospitals as a measure of relative quality performance.
Our data are characterized by a hierarchical structure, with measurement points clustered in
patients, which themselves are clustered in hospitals. Given the nonlinear nature of our model,
these data can be analyzed in 2 ways. One can collapse the hierarchy into 2 levels and model
posttreatment latent health as a function of lagged, observed (pretreatment) response
Latent health status at any time point

with

The vector
Unexplained variation is decomposed into 4 variance components: 1) a patient-specific intercept

Larger values of
For the EQ-5D utility model, we adapt (2) to a linear specification with an identity link
function (i.e.,
All ordered probit models are estimated by maximum likelihood using GLLAMM in Stata 11.0 (StataCorp LP, College Station, TX), where the integrals for the random effects are approximated by adaptive quadrature. 35 Threshold parameters and the scale of the coefficient are identified through constraints on the mean and variance of the error term and the mean of the intercept. The linear EQ-5D utility model is estimated by maximum likelihood using xtmixed in Stata 11.0.
Provider Profiling
Our interest lies in estimates of the relative quality of each hospital,
For nonlinear models, we describe hospital performance in 2 different ways. First, we rank
hospitals according to their impact on latent health status
where

and
Both methods produce identical rankings of relative hospital performance. However, only the second method relates the result back to the original scale of the PRO survey instrument and allows differences across hospitals to be investigated in terms of the probability of achieving a specific health outcome.
Results
Descriptive Statistics and Transition Matrices
Our sample consists of 21,565 patients treated in 153 NHS and private hospitals. The number of patients in each hospital ranges from 1 to 1106 (mean [SD], 140 [124]). We present descriptive statistics of patient characteristics in Table 1.
Descriptive Statistics of Patient Characteristics (N = 21, 565)
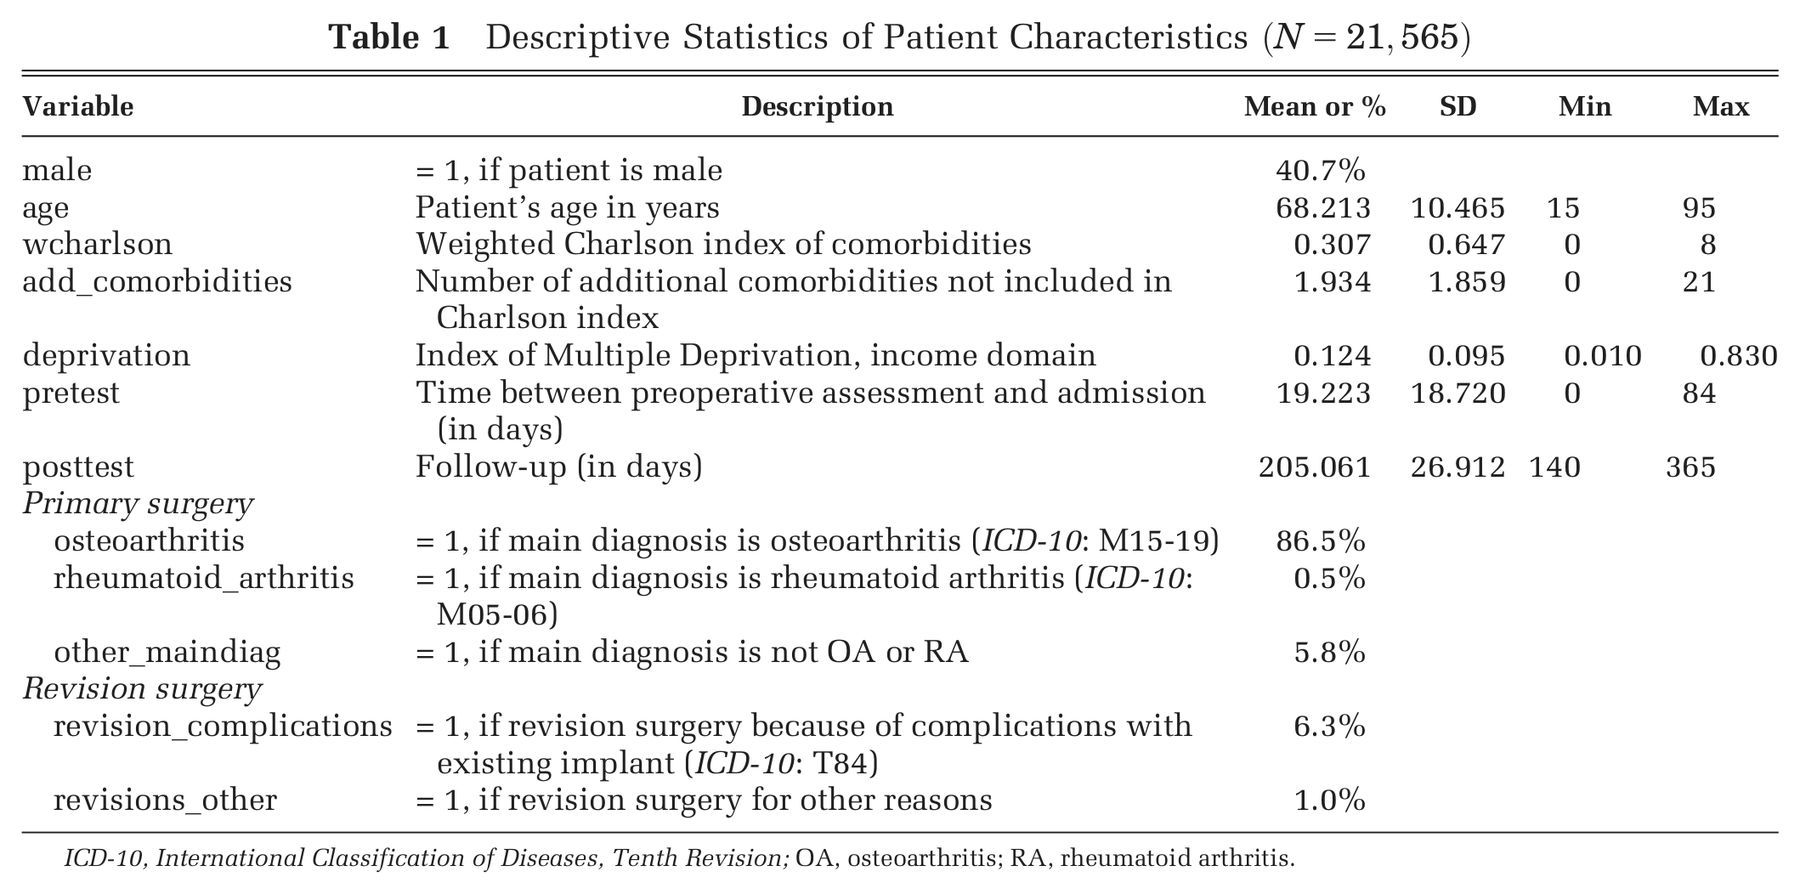
ICD-10, International Classification of Diseases, Tenth Revision; OA, osteoarthritis; RA, rheumatoid arthritis.
Elective hip replacement surgery is performed predominantly on elderly patients (mean [SD] age, 68.2 [10.5] years), with osteoarthritis being the most common reason for surgical intervention. The majority of patients in our sample are female (59.3%) and admitted for primary replacement of the hip joint (92.7%). The median time elapsed between baseline survey and date of admission is 14 days (interquartile range [IQR], 5–28 days). The median follow-up period is 197 days (IQR, 192–209 days).
Table 2 presents the transition matrices for each of the 5 EQ-5D dimensions. Rows report the patients’ own classification of their status at baseline, and columns show self-reported status 6 months after surgery. Accordingly, patients in the lower triangle report improvements in health status, whereas those in the upper triangle report deteriorations.
Transition Matrices for All EQ-5D Dimensions
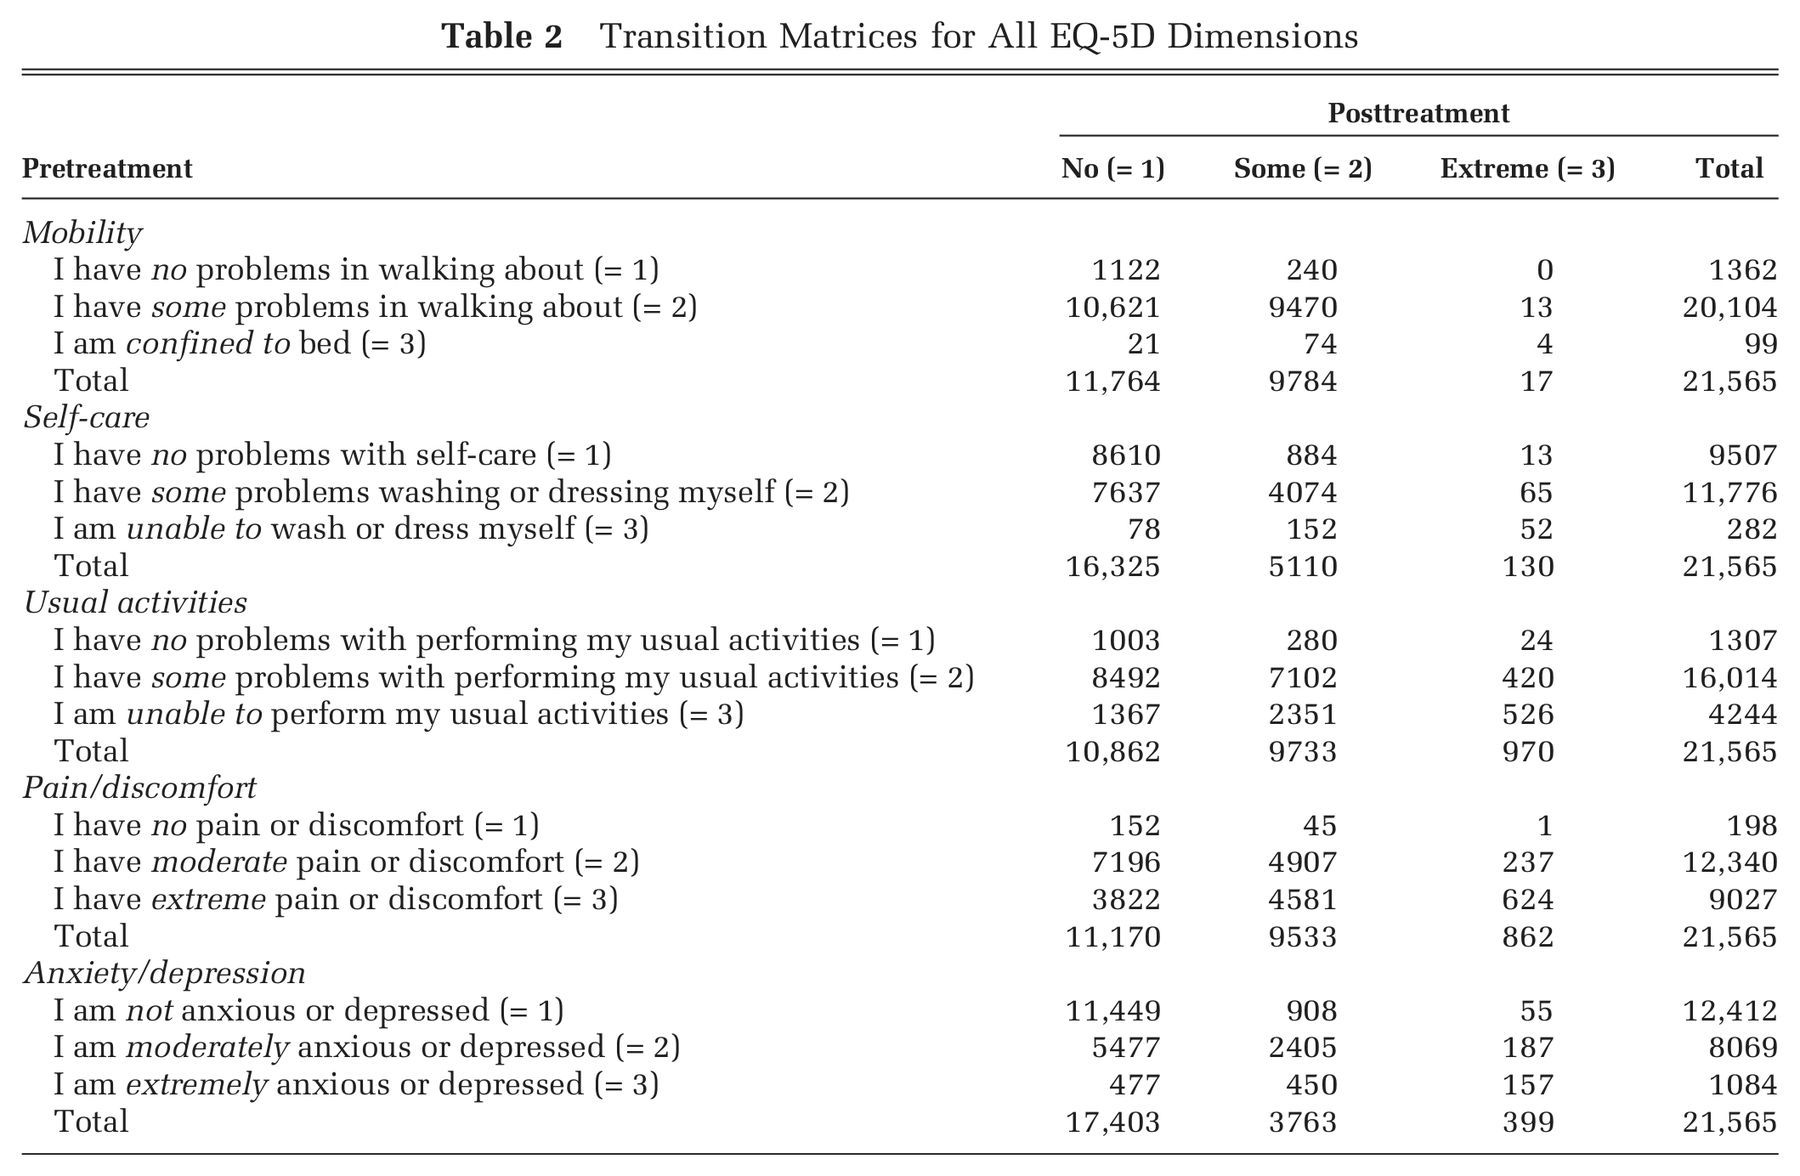
For each of the 5 dimensions, a considerable number of patients report no problems at baseline. This is especially pronounced on the self-care and anxiety/depression dimensions, in which 44.1% and 57.6% of patients fall into this category, respectively. Of the patients, 6.3% report no problems prior to treatment with respect to mobility, whereas nearly all patients report at least moderate problems with pain/discomfort (99.1%). Sixty-eight patients report having no problems in any of the EQ-5D dimensions.
The number of patients improving since treatment varies greatly by the health dimension under consideration. The dimension most improved since treatment is pain/discomfort, in which 72.3% of the patients report improvements as indicated by a transition to a more favorable category. In contrast, only 29.7% of patients report improvements on the anxiety/depression dimension.
Figure 1 present the empirical distribution of the EQ-5D utility scores pre- and postintervention. The mean preintervention score is 0.349, and the mean postoperative score is 0.761. Both distributions exhibit typical characteristics of empirical EQ-5D distribution observed for a wide range of medical conditions, including multimodality, discontinuity, and clustering at 1 (“full health”). 38,39 Of the patients, 87.3% report improvements in health as measured by the EQ-5D utility index, whereas 6.4% report deteriorations.
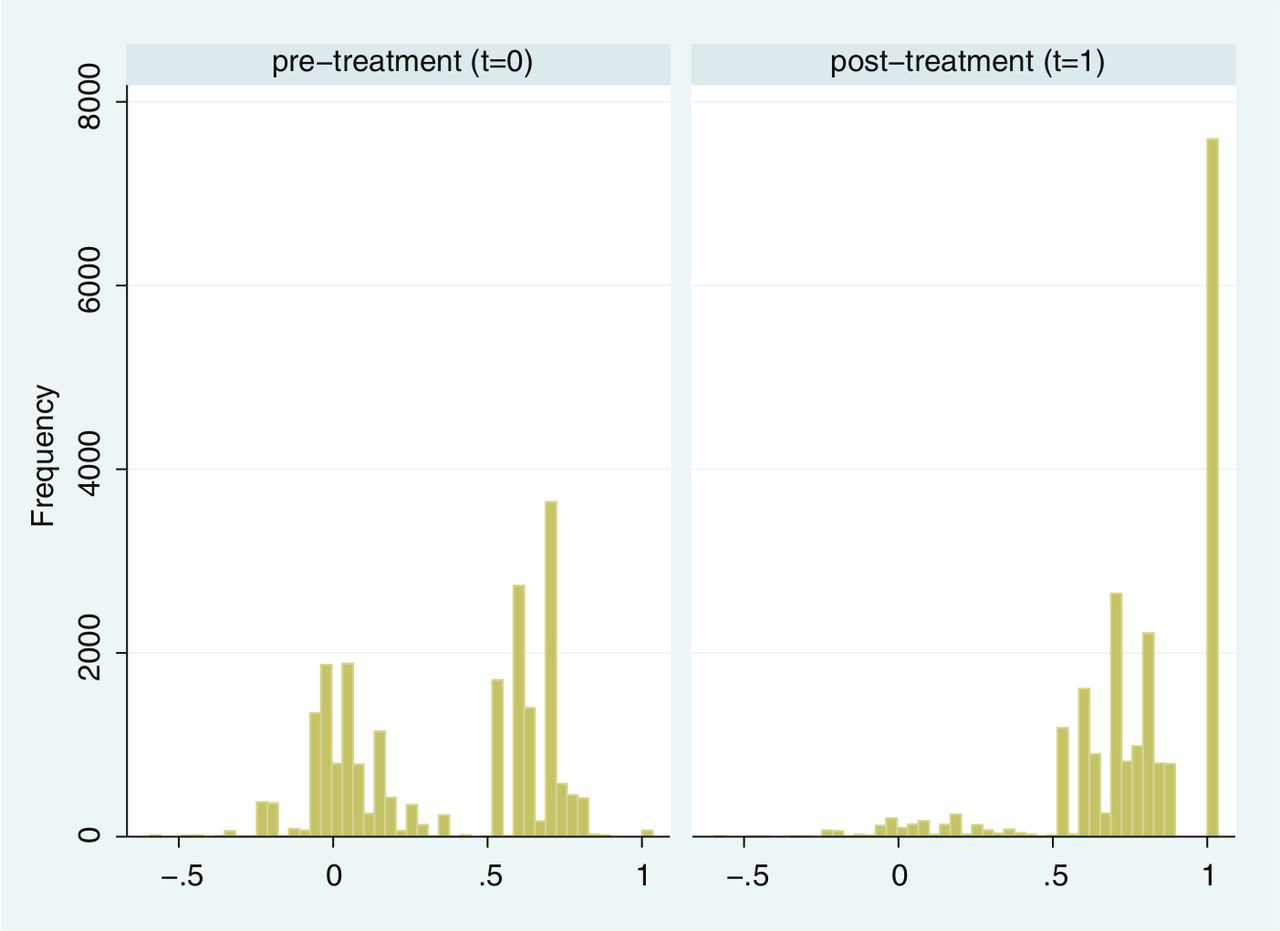
Distribution of EQ-5D utility scores pre- and posttreatment.
Regression Results
Table 3 presents parameter estimates and associated standard errors for each of the 5 dimension models and the EQ-5D utility index model.
Regression Results
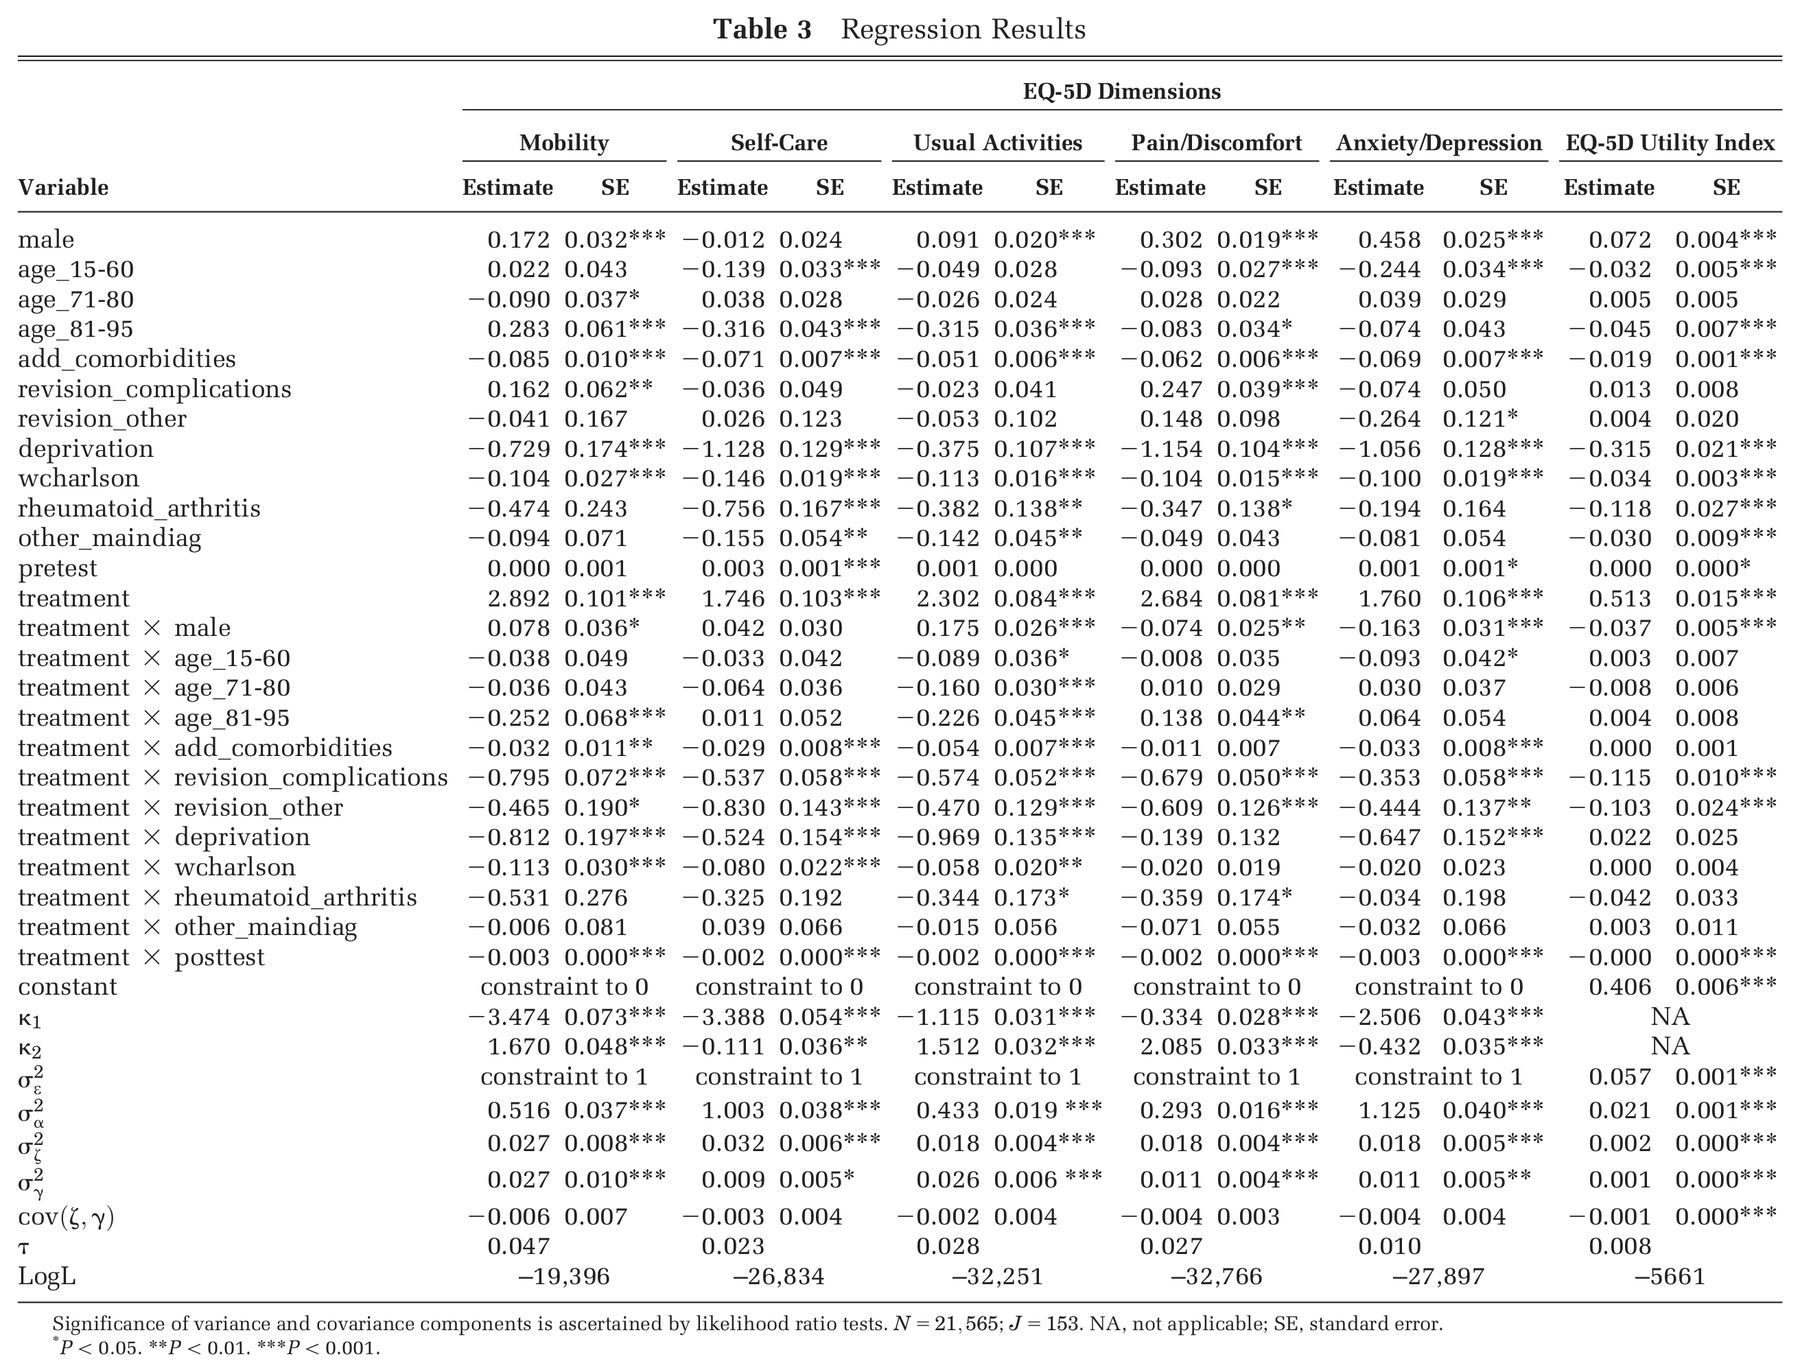
Significance of variance and covariance components is ascertained by likelihood ratio tests.
P < 0.05. **P < 0.01. ***P < 0.001.
We find several variables to be associated with self-reported health, both at baseline and follow-up. These include male sex (+), higher weighted Charlson index score (–), number of additional comorbidities (–), and the deprivation profile of the patient’s neighborhood of residence (–). Patients admitted for primary surgery tend to report worse health status than those returning for revision surgery related to complications with their existing implant, but this effect is only statistically significant for mobility and pain/discomfort. Similarly, patients with a diagnosis of rheumatoid arthritis tend to report lower levels of health, but the effect is insignificant for the mobility and anxiety/depression dimensions.
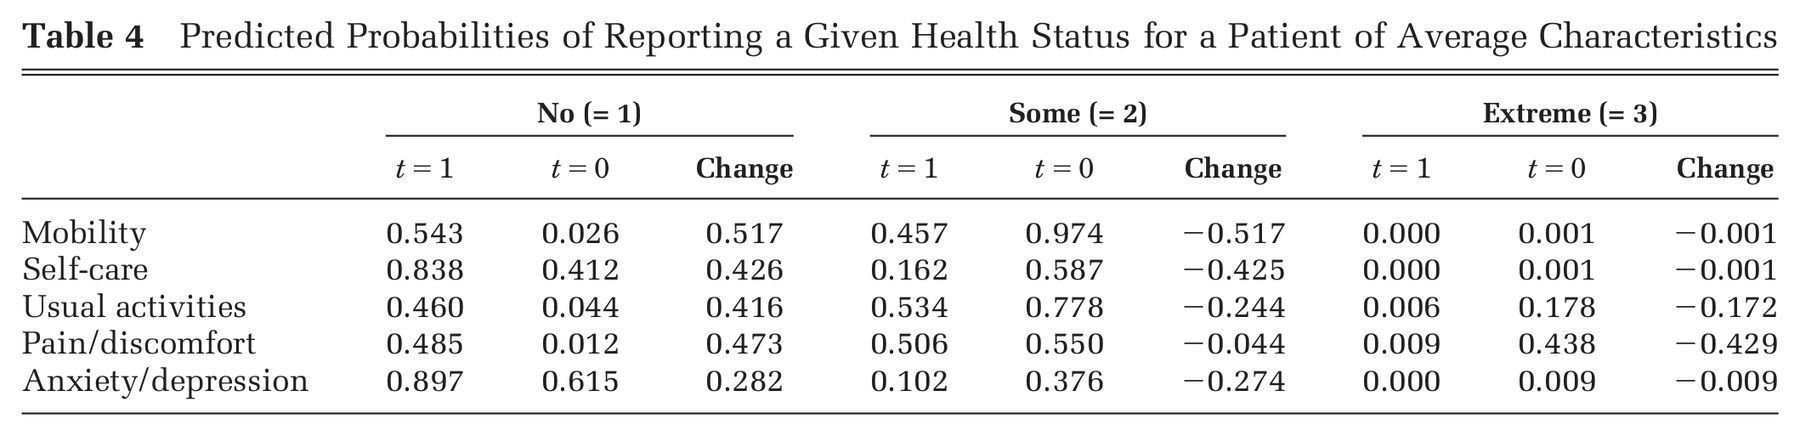
The mean effect of treatment on posttreatment latent health is positive and significant for all dimensions, resulting in substantial increases in the probability of reporting no problems after surgery (Table 4). The number of comorbidities and the indicators for revision surgery are negatively associated with the treatment effect, indicating that treatment is less beneficial for multimorbid or revision patients. Similarly, patients living in more deprived areas experience, on average, less improvement in latent health than those residing in less deprived areas. Longer follow-up is also associated with a smaller increase in postoperative latent health, albeit the effect being small. For example, for a patient of average characteristics, the probability of reporting no problems on anxiety/depression is estimated to reduce by 0.3% per additional week of follow-up. Postoperative EQ-5D utility scores are expected to reduce by 0.0027 per additional week of follow-up.
Predicted Probabilities of Reporting a Given Health Status for a Patient of Average Characteristics.
All variance components are statistically significant at the 95% confidence level as confirmed by likelihood ratio tests. In contrast, only the covariance term in the EQ-5D utility model is statistically significant. About 1.0% (anxiety/depression) to 4.7% (mobility) of the unexplained variation in latent health is estimated to be associated with the hospital itself.
Assessment of Hospital Performance
Performance on Individual EQ-5D Dimensions and EQ-5D Utility Score
Figure 2a–e presents estimates of hospital performance on the latent health scale (left graph) and the probability scale (right graph), where the latter is calculated for the average patient. Figure 2f presents the results of the EQ-5D utility model, where performance is measured directly on the utility scale. Hospitals located to the left side of each graph perform better than those to the right.
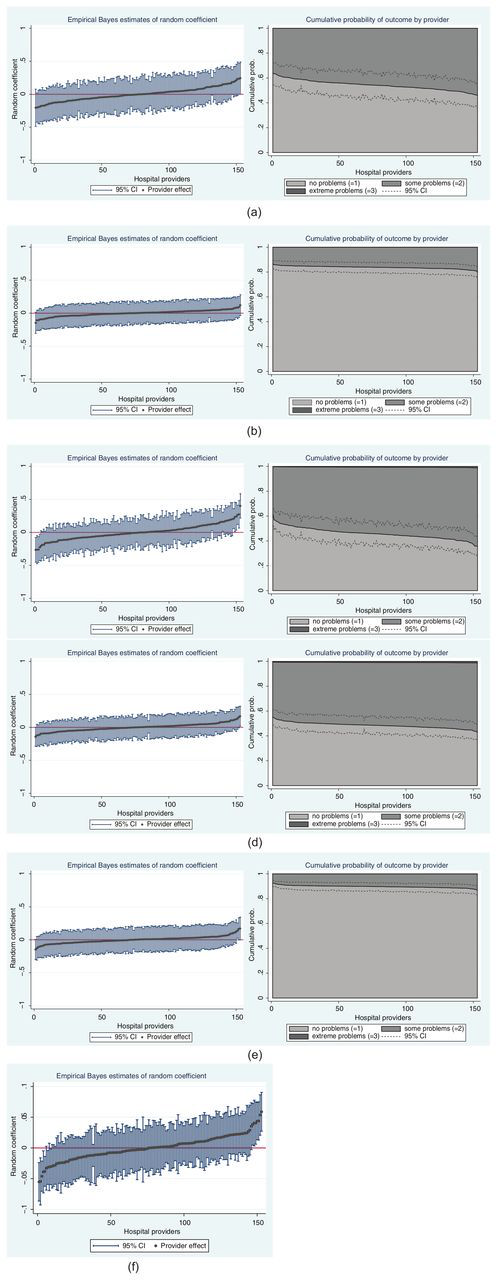
Performance estimates on the latent health and outcome scale: (a) Mobility, (b) Self-Care, (c) Usual Activities, (d) Pain/Discomfort, (e) Anxiety/Depression, (f) EQ-5D Utility Index. CI, confidence interval.
The random coefficient is standardized to zero, which represents the expected outcome for a hospital with average case mix. Hospital performance heterogeneity, as represented by the slope of the curve, is most pronounced on the mobility and usual activities dimensions. For the vast majority of hospitals, credible intervals contain zero, but a small number of hospitals have a statistically significantly different treatment impact. Credible intervals on the mobility dimension are wider than on any other dimension. This reflects the lesser amount of information contained in the data, with only 2 outcome categories being reasonably well populated.
Hospital heterogeneity on the latent health scale translates into differences with respect to hospital-specific probabilities of reporting a given posttreatment health status. The expected probabilities of reporting no problems on the usual activities dimension 6 month after surgery range from 35.8% to 61.8% (calculated for the average patient). In contrast, expected probabilities for the same outcome on the self-care dimension are significantly less dispersed and consistently above 80% for all hospitals. The probability of reporting extreme problems after surgery is close to zero for all models. We refrain from reporting credible intervals around these predicted probabilities to improve the readability of the graphs.
Association of Performance Estimates on EQ-5D Dimensions and the EQ-5D Utility Index
We explore the global agreement between estimates of hospital performance based on individual
EQ-5D dimensions and the utility-weighted EQ-5D index values by calculating Spearman’s rank
correlation coefficients (Spearman’s
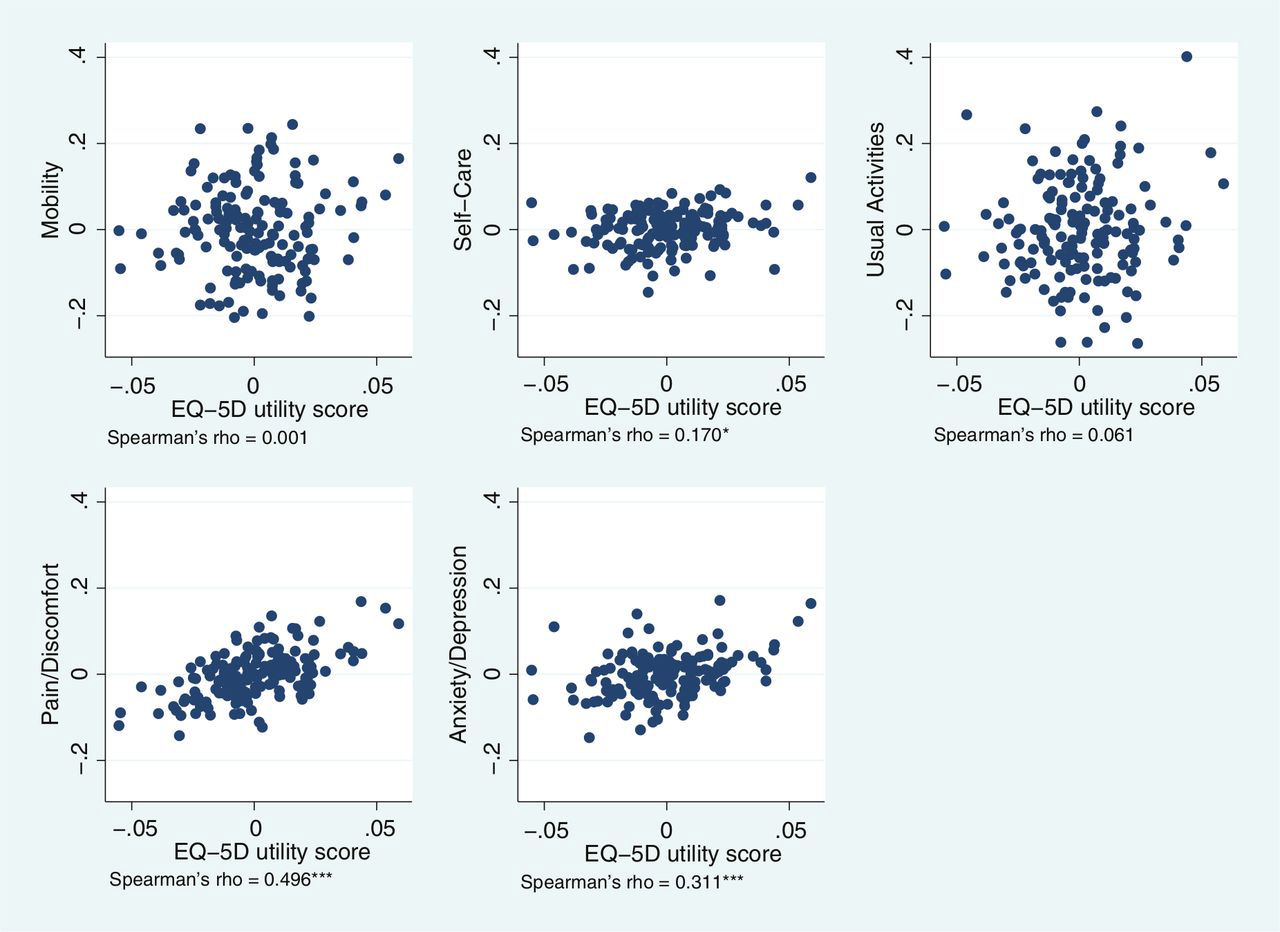
Hospital performance estimates on EQ-5D dimensions and EQ-5D utility scores.
The highest rank correlation is observed between performance estimates on the pain/discomfort
dimension and EQ-5D utility index (
To explore whether judgment about individual providers would differ depending on which metric is used to assess performance, we identify providers with statistically significantly above/below-average performance on each metric 40 –42 and compare the overlap. In 26 of 153 cases, performance classifications differ across metrics (Table 5).
Examples of Hospitals for Which Performance Assessments Differ across EQ-5D Dimensions and the EQ-5D Utility Model.
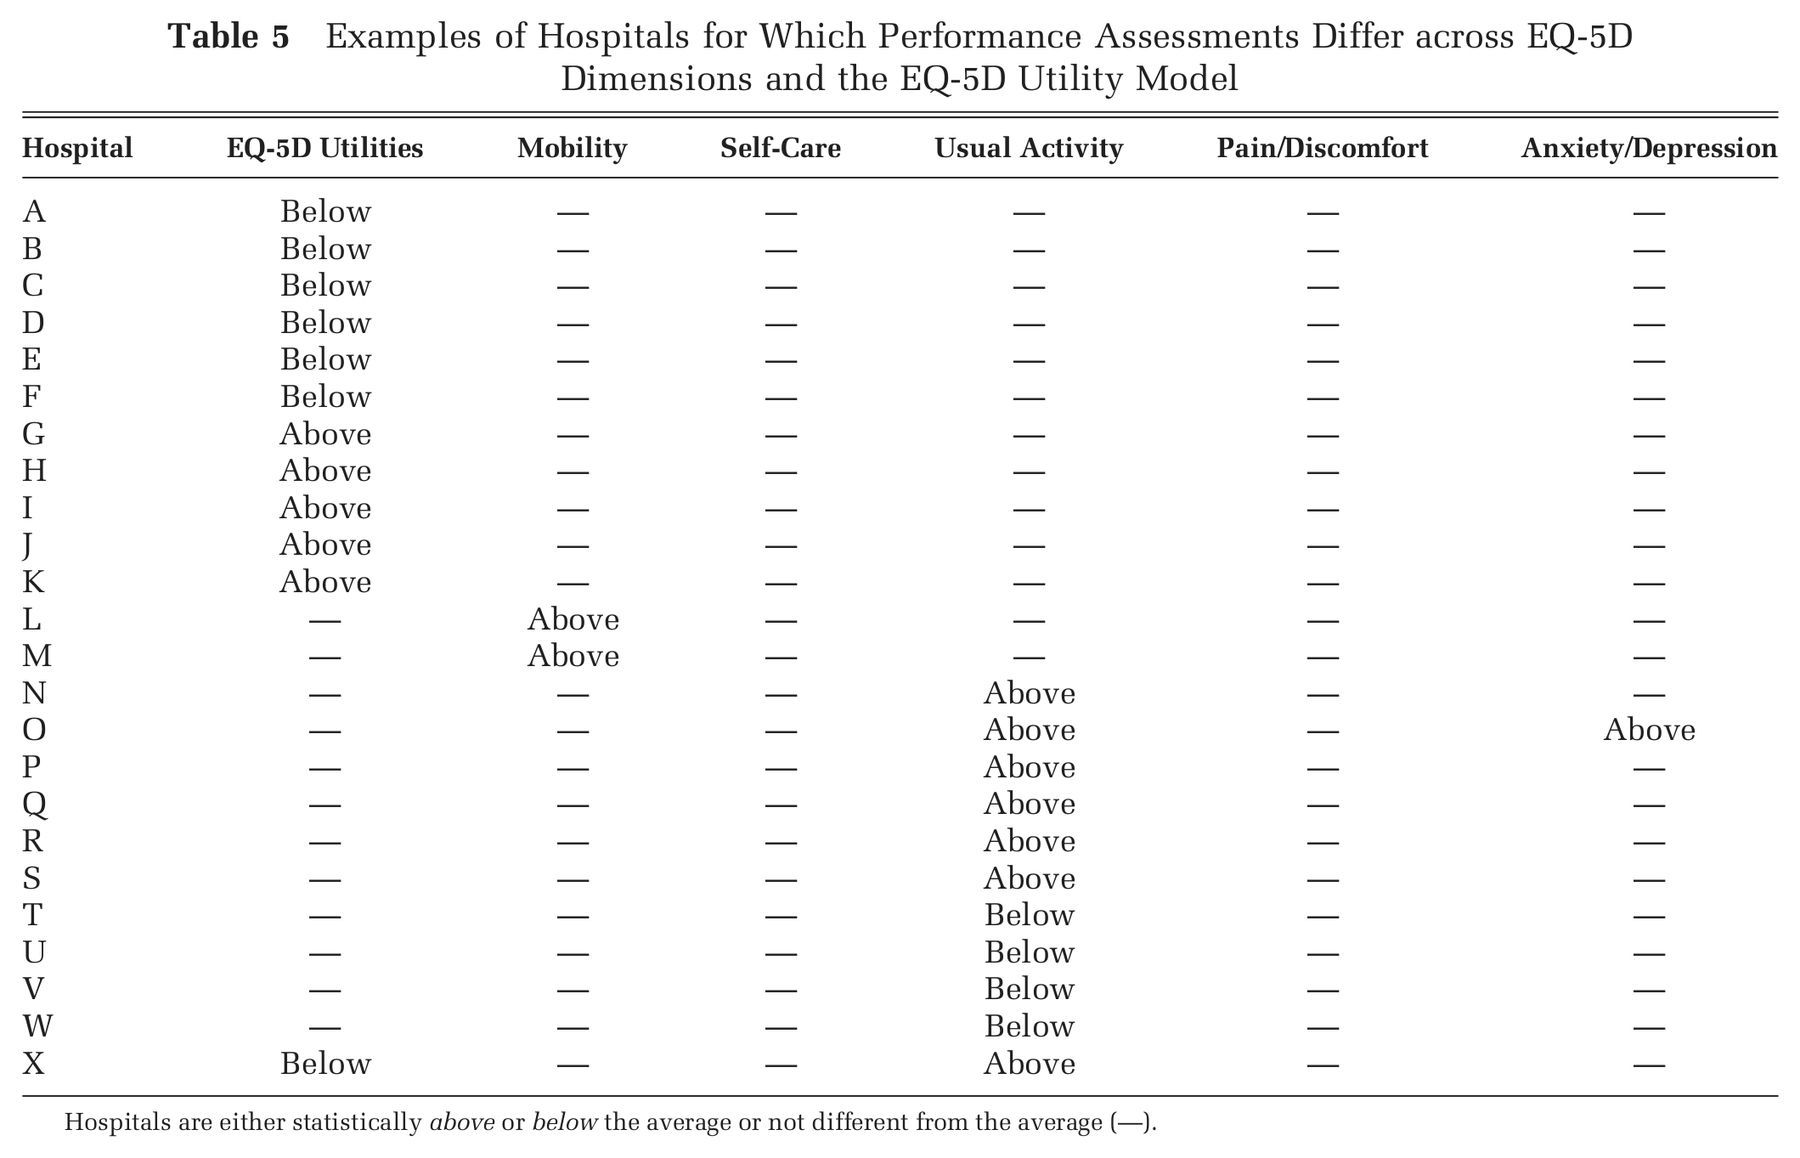
Hospitals are either statistically above or below the average or not different from the average (—).
Eleven hospitals (A–K) are identified as above/below-average performers according to the EQ-5D utility model but do not stand out on any of the 5 EQ-5D dimensions. Eight hospitals (L–S) achieve above-average results with respect to at least 1 dimension of the EQ-5D, but this performance is not reflected in their performance estimate on aggregate utilities. Four hospitals (T–W) fall short of the average benchmark on the usual activities dimension but would not be identified as underperformers in terms of their impact on utilities. The disagreement between performance in terms of EQ-5D utilities and individual dimensions is most apparent in the case of hospital X, where the hospital is classified as a low performer in terms of its impact on utilities but is a high performer with respect to restoring its’ patients’ ability to carry out their usual activities.
Discussion
We set out an analytical strategy to explore patient-level and hospital-level variation in categorical responses within and across dimensions of the EQ-5D. This approach does not require assumptions about how to aggregate across health dimensions and offers insight about which dimensions are particularly affected by hospital heterogeneity. We find heterogeneity in performance to be more pronounced across the mobility and usual activities dimensions and less so for the pain/discomfort, anxiety/depression, and self-care dimensions. Furthermore, we find that performance on the utility scale correlates well only with the anxiety/depression and pain/discomfort dimensions. Incidentally, these are the dimensions that receive the highest weighting in the UK TTO EQ-5D tariff. 20 In contrast, the mobility, usual activities, and self-care dimensions have relatively low weights attached to them, and performance heterogeneity remains undetected when analyzing aggregated EQ-5D utility data.
Policy makers are interested in assessing the change in patient-reported outcomes as a result of treatment. There are various ways that this change can be measured and modeled. Our approach has been to model both pre- and posttreatment health status as outcomes of the same reporting process and to conduct multilevel analysis with measurement points clustered in patients, which themselves are nested in hospitals. We argue that this is the appropriate modeling strategy because it acknowledges the features of the data-generating process, allows for patient heterogeneity with respect to observed and unobserved factors, and makes best use of the available information. The presented methodology is readily applicable to other conditions for which EQ-5D data are collected and, in principle, can be extended to other PRO instruments.
In recognition of the expectation that health outcome data are to be used by an audience unfamiliar with the interpretation of complex statistical results (e.g., patients and their relatives, family doctors, managers), we have suggested an intuitively appealing way of summarizing the differential impact that hospitals have on treatment outcomes. Our graphical representation indicates the probability of reporting a given health outcome and shows how these probabilities vary across health dimensions and hospitals. Prospective patients (or their agents) who place greater weight on a particular dimension may use this information to select a hospital that has a differentially greater impact on this than its peers do.
The primary limitation of our proposed approach is the increase in dimensionality of the decision problem for patients. Whereas aggregated scores result in one estimate of hospital performance, our approach generates 5 potentially divergent answers. In a recent study, Dijs-Elsinga and colleagues 43 have shown that a large group of patients favor simple data presentation and prefer one overall measure of hospital quality. But many patients intend to use more detailed quality information when making decisions about where to seek care in the future. 43 The question then arises about how much information should be provided for the different objectives for which performance information can be used (i.e., patient choice, accountability, identification of best practice) and who decides about the relative weighting of each component and objective. 11,44 Our study does not intend to resolve this debate. Rather, we present a means of making inferences about hospital quality and presenting results when health outcomes are assessed through the EQ-5D PRO instrument. How best to communicate such performance data requires careful consideration, to ensure they can be effectively understood and used.
Several issues remain that we have not addressed in this study. First, based on the full information contained in HES, we can identify those patients who have not participated or were not included in the follow-up. We find that, in our data set, only about 50% of eligible hip replacement patients participate in the baseline survey, with a further 8% dropping out of the subsequent survey. These numbers should improve in time when data collection procedures become more established. However, falsely assuming that any substantial amount of missing values are generated at random could lead to biased inferences from a nonrepresentative population, 45 raising questions about the validity of the assessment.
Second, in this study, we have controlled for patient risk factors that are deemed clinically relevant, are assumed to be exogenous to the hospital, and can be derived from routine inpatient records. However, we do not claim that this set of control variables is exhaustive: Health outcomes may be affected by nonrandomly distributed, unobserved patient characteristics such as severity of the medical condition or health-related behavior. That said, a strength of our study is that we control for the initial health status with which the patient presents at admission. In many studies, this is unobserved and makes our analysis more robust than possible in the absence of such information.
Third, we do not control for characteristics of the hospital in our analysis, our rationale being that these are within the hospital’s control. But they may not be. Hospitals may be constrained in their ability to choose and combine medical resources to their best effect by local regulation, access to factor markets, or, in the short run, the existing capital structure such as age and functionality and whether the hospital operates the service over multiple sites. 46 In this case, the assumption of exchangeability underlying the hierarchical modeling approach may not hold. Furthermore, procedures such as hip replacement are generally followed by extensive physical therapy, which may be delivered outside the hospital. If constraints bind or if quality is not attributable solely to the hospital, our estimates of hospital performance will be biased.
Fourth, our study makes use of a large administrative data set that contains rich information on patient characteristics and the type of care provided. The presented econometric approach is tailored to the data at hand. However, in other countries or disease areas, sample sizes may be smaller or information may be sparse. If patient characteristics are unobserved or cannot be included due to low degrees of freedom, then more of the time-invariant variation between patients would be captured by the patient random effect. Again, the assumption of exchangeability (i.e., that the unobserved patient heterogeneity is drawn from a random distribution) may become unrealistic and results may be biased. 47 The same argument applies to the random coefficient and the interactions of covariates with the treatment effect. Researchers will need to consider this limitation case by case, based on their data and the available set of risk-adjustment variables.
Finally, further consideration should be given to the role that patient-reported health outcome performance information can play in existing quality assessment frameworks. Although measures of risk-adjusted mortality, readmission, and adverse events have been criticized for their limited granularity and sensitivity, 48 one should not a priori dismiss their ability to identify high- and low-quality providers of care. Further research is required to establish the additional value of outcome data for hospital quality assessments and contrast it to the costs of collection.
Footnotes
Acknowledgements
We thank Stephen Barasi, Stephen Bloomer, David Nuttall, David Parkin, Aurore Pelissier, Wolfgang Greiner, 3 anonymous referees, and participants of the Health Econometric Data Group seminar series (York), the EuroQoL plenary meeting 2012 (Rotterdam), and the joint CES-HESG Winter conference 2012 (Marseille) for their valuable inputs and comments.
The project was funded by the National Institute for Health Research (NIHR) in England under the Health Services Research (HSR) stream (project number 09/2000/47). The views expressed are those of the authors and may not reflect those of the NIHR HSR program or the Department of Health.